Influence of therapy duration on suppression of … · suppression of emergence of resistance and...
63
Influence of therapy duration on suppression of emergence of resistance and influence of granulocytes on cell kill G.L. Drusano, M.D. Co-Director Ordway Research Institute
Transcript of Influence of therapy duration on suppression of … · suppression of emergence of resistance and...
Influence of therapy duration on suppression of emergence of resistance and influence of granulocytes on cell kill
G.L. Drusano, M.D.
Co-Director Ordway Research Institute

Short Course Therapy

Short Course Therapy What are the Two Great Chemotherapy
Questions?
Can We Delineate Exposure-Response i.e.
What is the Right Therapy Intensity?
For How Long Should We Treat?
Short Course Therapy
Indeed, in a paraphrase of the late, great Louie Weinstein: “There are only two things we do not
understand about antimicrobial therapy: How much drug to give and
for how long to give it”

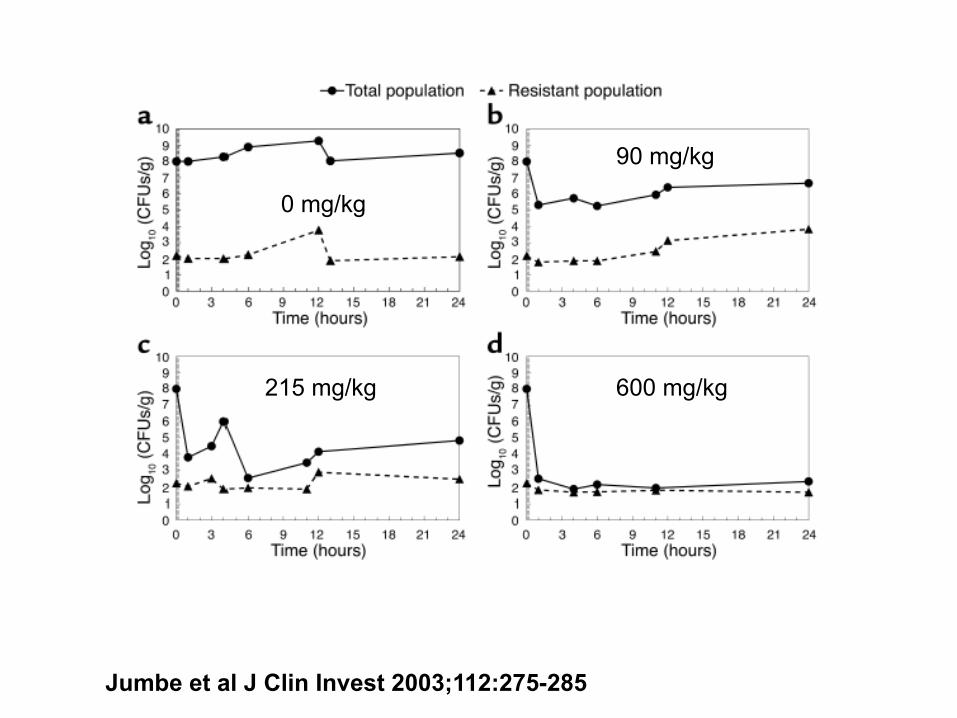
P. aeruginosa outcome studies
Jumbe et al J Clin Invest 2003;112:275-285

Short Course Therapy
What about Intensity to Suppress
Resistance?
Levofloxacin and Pseudomonas
Can a drug exposure be identified that will prevent
the resistant subpopulation from taking over the total
population?

Journal of Clinical Investigation 2003;112:275-285 & Nature Reviews Microbiology 2004;2:289-300
Drusano GL. Nat Rev Microbiol 2004;2:289-300

Jumbe et al J Clin Invest 2003;112:275-285 Drusano GL. Nat Rev Microbiol 2004;2:289-300

Levofloxacin and Pseudomonas

Journal of Clinical Investigation 2003;112:275-285 & Nature Reviews Microbiology 2004;2:289-300
Jumbe et al J Clin Invest 2003;112:275-285 Drusano GL. Nat Rev Microbiol 2004;2:289-300

How Long is Long Enough?
PK/PD – How Long is Long Enough?
• We examined the quinolone garenoxacin against a strain of Staphylococcus aureus
• One question to be addressed was the impact of therapy duration upon emergence of resistance
• Another was to examine the relationship (or lack thereof) between kill rate and emergence of resistance

PK/PD – How Long is Long Enough?
J Infect Dis. 2007;195:1818-1827.

PK/PD – How Long is Long Enough?
J Infect Dis. 2007;195:1818-1827.

PK/PD – How Long is Long Enough?
Modeling first 2 days of therapy
J Infect Dis. 2007;195:1818-1827.

PK/PD – How Long is Long Enough?
Modeling all 10 days of therapy
J Infect Dis. 2007;195:1818-1827.

PK/PD – How Long is Long Enough?
• When the first 2 days are modeled and simulation is performed, it is estimated that an AUC/MIC ratio of 100 is necessary to suppress mutant amplification for 2 days. Breakthrough is expected after day 4. Maximal kill rate is achieved at this AUC/MIC ratio
• When all 10 days are modeled, we expect an AUC/MIC ratio of 280 is required for suppression of resistance for all 10 days

Garenoxacin Prospective Validation Study
• Hypotheses to be tested in a prospective validation experiment: 1) The higher-intensity regimen will drive the colony counts down by circa 5-6 log10 (CFU/ml) by 5 days of therapy 2) The lower-intensity regimen will be similar to the intense regimen for 5 days as regards total colony counts 3) The higher-intensity regimen will suppress resistance for the full 10 days of therapy 4) The lower-intensity regimen will allow resistant organism amplification after day 4

PK/PD • We studied the quinolone
garenoxacin against S. aureus
• We studied and modeled 7 regimens
• We performed a prospective validation with 4 hypotheses
• All were validated • Resistance suppression
requires more drug exposure than that for maximal rate of kill
J Infect Dis. 2007;195:1818-1827.

PK/PD – How Long is Long Enough?
• Clearly, stopping early prevents mutant amplification because we are limiting the number of rounds of replication (importance of error-prone replication?)
• When therapy goes longer, more intense drug exposure is required to suppress mutant amplification
• The two regimens had the SAME initial kill rate. One failed (100) and one succeeded (280)

Resistance Suppression and Outcome Optimization
• Here, the pathogen is Staphylococcus aureus, not Pseudomonas aeruginosa, where we had previously shown the first resistance mechanism was pump over-expression (JCI 2003;112:275-285; J Infect Dis. 2005;192:420-428.)
• As previously, there were NO target site mutations • All the resistance was efflux pump mediated, as
shown by Dr. Fritsche from Ron Jones Lab • What happens when therapy stops? Does the
resistant population gain the upper hand?

PK/PD • We performed an experiment where 4, 5 or 6
daily doses (AUC/MIC ratio=100) were administered; outcomes monitored out to day 13
• We fit an expanded mathematical model to all the data simultaneously
• We included a natural death rate term for sensitive and resistant populations
• This allows us to look at relative biofitness in conjunction with the growth terms for the two populations

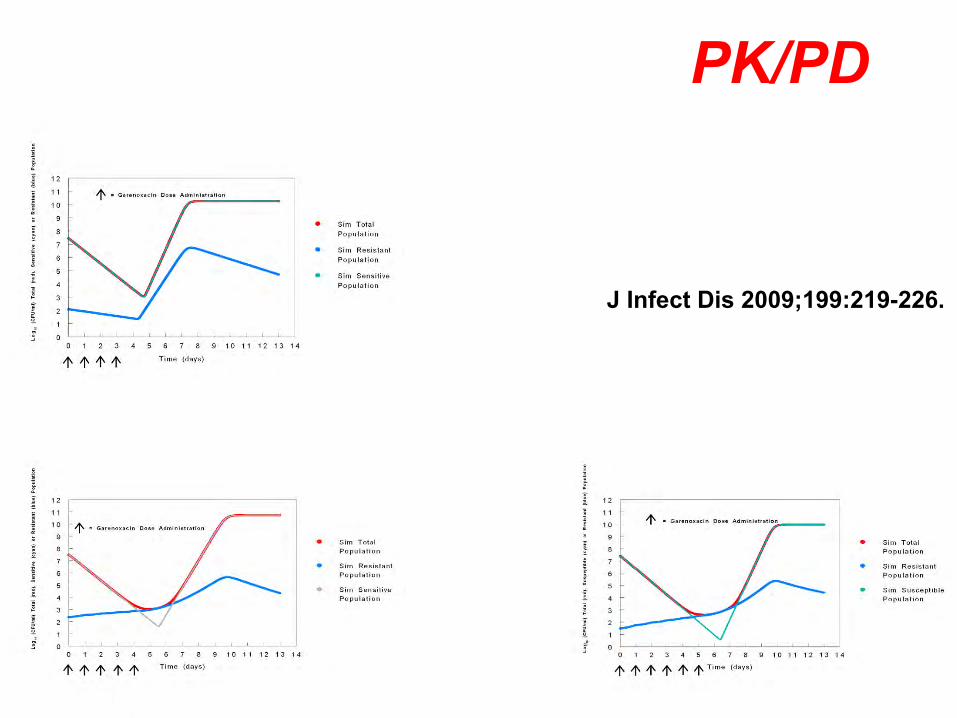
PK/PD
J Infect Dis 2009;199:219-226.
Garenoxacin – Short Therapy
• The model fit the data well for all three system outputs 1. Garenoxacin Concentrations 2. Total S. aureus Counts 3. Resistant S. aureus Counts
• But, to gain an idea of the individual fits for the four regimens, each is presented next

J Infect Dis 2009;199:219-226.
PK/PD
J Infect Dis 2009;199:219-226.

Garenoxacin – Short Therapy • Of interest, in each of the garenoxacin-
treated arms, there is a final downturn in the number of resistant mutants before or after day 10, depending on the number of garenoxacin doses administered
• Model parameters indicate that resistant mutants have an intrinsically higher rate of natural death and slower growth relative to sensitive clones
• This indicates the resistant clones are likely less biofit

Garenoxacin – Short Therapy
• This is seen graphically by the dramatic downturn in resistant clone number between days 10 and 13 for the garenoxacin-treated regimens

PK/PD • So, the longer therapy continues, the
more amplification goes on of the resistant population with a suboptimal regimen
• To prevent resistance, shorter is better • BUT, we also have to clear the infection,
so therapy needs to be long enough to accomplish this end
• How much effect do we need? • Enough to allow the immune system to do
its job!

Parameter Kmax-growth POPMAX Vmax-kill * Km Units h-1 CFU/g h-1 CFU/g Mean 0.622 0.916x10¹¹ 0.00535 147660 SD 0.104 0.980x10¹⁰ 0.00400 203928 ____________________________________________________________________ * Rate constant is multiplied by the granulocyte count
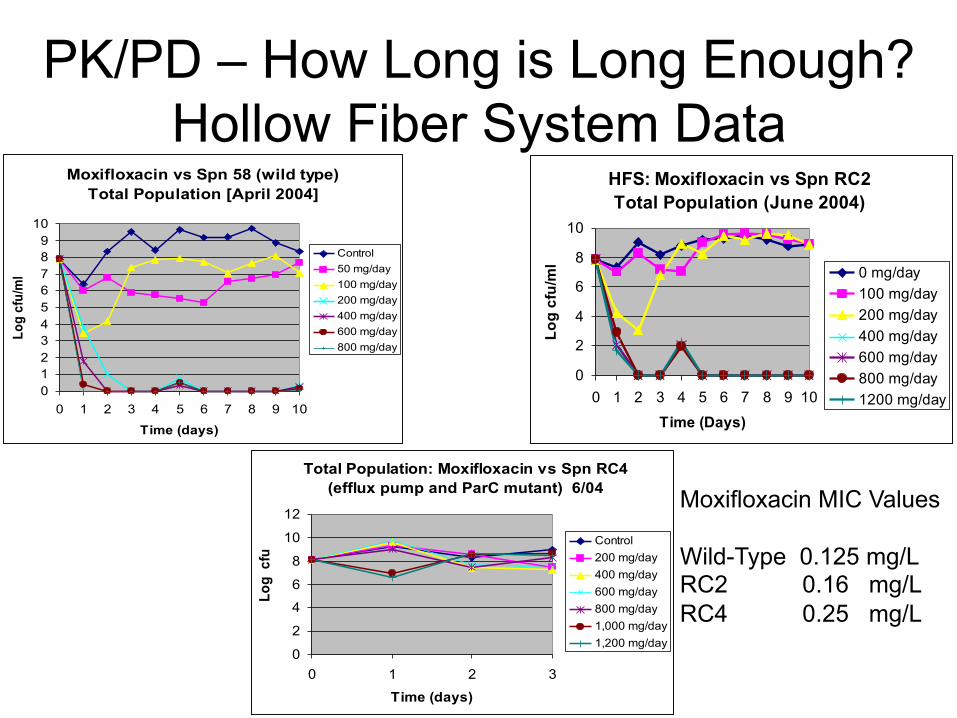
PK/PD – How Long is Long Enough? Hollow Fiber System Data
Moxifloxacin vs Spn 58 (wild type) Total Population [April 2004]
0123456789
10
0 1 2 3 4 5 6 7 8 9 10
Time (days)
Log
cfu/
ml
Control50 mg/day100 mg/day200 mg/day400 mg/day600 mg/day800 mg/day
HFS: Moxifloxacin vs Spn RC2 Total Population (June 2004)
0
2
4
6
8
10
0 1 2 3 4 5 6 7 8 9 10
Time (Days)
Log
cfu/
ml 0 mg/day
100 mg/day200 mg/day400 mg/day600 mg/day800 mg/day1200 mg/day
Total Population: Moxifloxacin vs Spn RC4 (efflux pump and ParC mutant) 6/04
0
2
4
6
8
10
12
0 1 2 3
Time (days)
Log
cfu
/ Control200 mg/day400 mg/day600 mg/day800 mg/day1,000 mg/day1,200 mg/day
Moxifloxacin MIC Values Wild-Type 0.125 mg/L RC2 0.16 mg/L RC4 0.25 mg/L

PK/PD – How Long is Long Enough?
RC2
RC4
Normal Granulocytopenic

PK/PD – How Long is Long Enough? Drug Plus WBC Effect S. pneumoniae RC2
Remove Drug Effect S. pneumoniae RC2
Difference from the hollow fiber system is determined by the PK of Moxi in mice and in man

PK/PD – How Long is Long Enough?
Normal Mice Neutropenic Mice

PK/PD – How Long is Long Enough?
• Please note that in the hollow fiber system, which has NO immune function at all, moxifloxacin performed BETTER against RC2 than in the mouse model with or without granulocytes
• Why? • We are in the midst of sorting this out, but
fully believe it is because we did not “humanize” the dosing in the mice

Torezolid with and without WBC
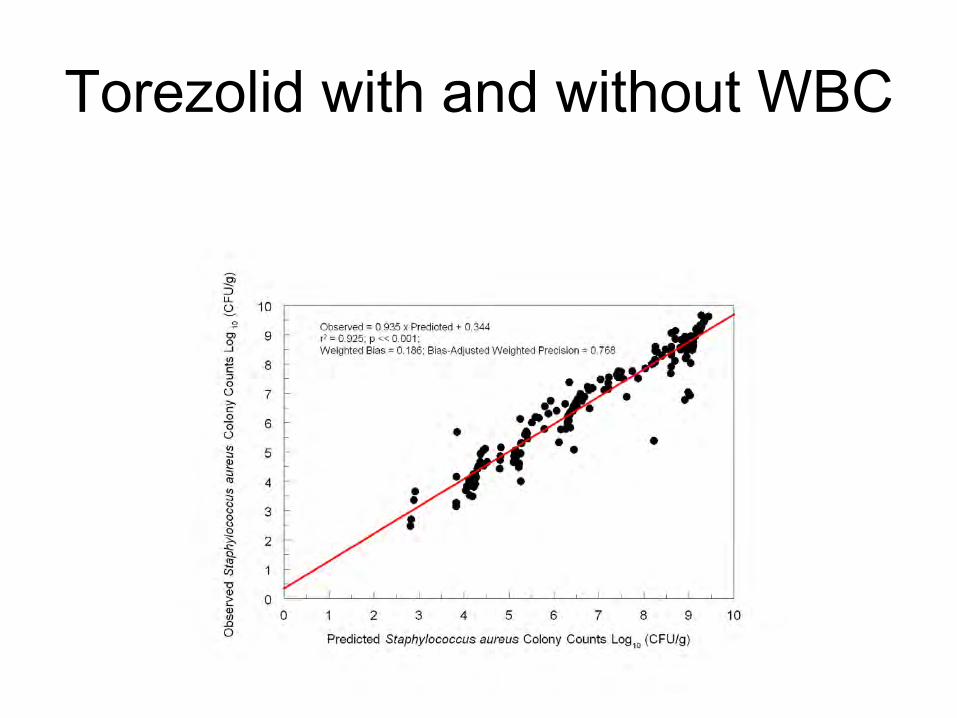
Torezolid with and without WBC
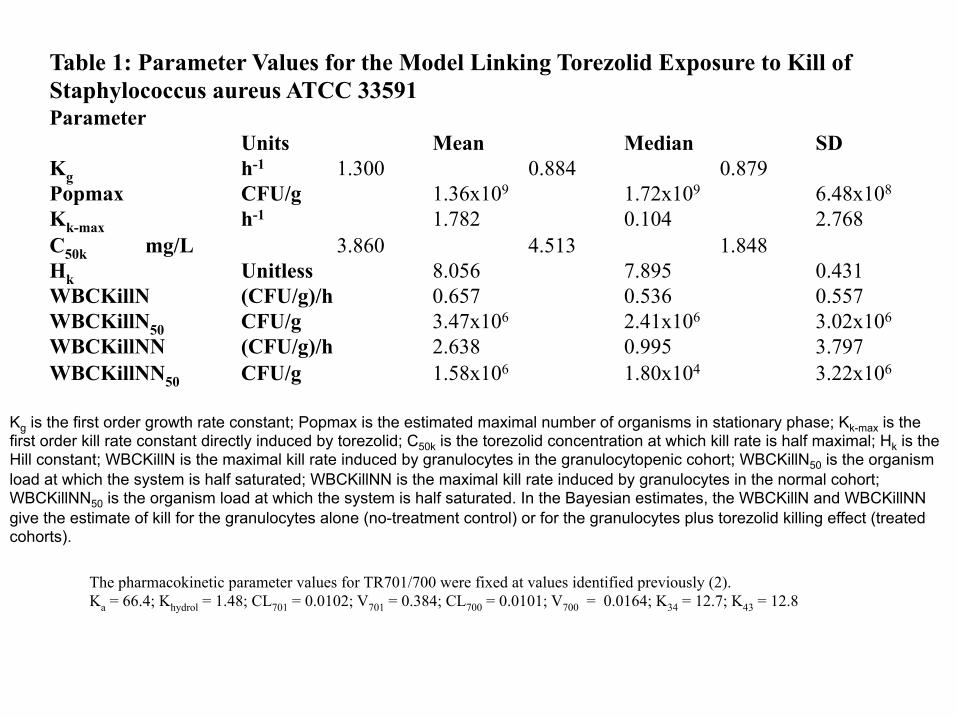
Table 1: Parameter Values for the Model Linking Torezolid Exposure to Kill of Staphylococcus aureus ATCC 33591 Parameter
Units Mean Median SD Kg h-1 1.300 0.884 0.879 Popmax CFU/g 1.36x10⁹ 1.72x10⁹ 6.48x10⁸ Kk-max h-1 1.782 0.104 2.768 C50k mg/L 3.860 4.513 1.848 Hk Unitless 8.056 7.895 0.431 WBCKillN (CFU/g)/h 0.657 0.536 0.557 WBCKillN50 CFU/g 3.47x10⁶ 2.41x10⁶ 3.02x10⁶ WBCKillNN (CFU/g)/h 2.638 0.995 3.797 WBCKillNN50 CFU/g 1.58x10⁶ 1.80x10⁴ 3.22x10⁶
The pharmacokinetic parameter values for TR701/700 were fixed at values identified previously (2). Ka = 66.4; Khydrol = 1.48; CL701 = 0.0102; V701 = 0.384; CL700 = 0.0101; V700 = 0.0164; K34 = 12.7; K43 = 12.8
Kg is the first order growth rate constant; Popmax is the estimated maximal number of organisms in stationary phase; Kk-max is the first order kill rate constant directly induced by torezolid; C50k is the torezolid concentration at which kill rate is half maximal; Hk is the Hill constant; WBCKillN is the maximal kill rate induced by granulocytes in the granulocytopenic cohort; WBCKillN50 is the organism load at which the system is half saturated; WBCKillNN is the maximal kill rate induced by granulocytes in the normal cohort; WBCKillNN50 is the organism load at which the system is half saturated. In the Bayesian estimates, the WBCKillN and WBCKillNN give the estimate of kill for the granulocytes alone (no-treatment control) or for the granulocytes plus torezolid killing effect (treated cohorts).

Table 2: Determination of the Effect of Torezolid Mediated Through Granulocytes Direct Effect of Torezolid = Net Growth No Treatment – Net Growth 200 mg Equivalent Dose (Both Granulocytopenic) 24 hr 3.26 Log (CFU/g) – 2.81 Log (CFU/g) = 0.45 Log (CFU/g) 48 hr 3.48 Log (CFU/g) – 3.62 Log (CFU/g) = -0.14 Log (CFU/g) Effect of Torezolid Mediated Through Granulocytes + Direct WBC Effect = Total Effect (G-penic - Normal Cohort Treated) –– Direct Effect of Torezolid 24 hr -3.12 Log (CFU/g) + 0.45 Log (CFU/g) = -2.67 Log (CFU/g) 48 hr -5.12 Log (CFU/g) - 0.14 Log (CFU/g) = -5.26 Log (CFU/g)
72 hr* -6.43 Log (CFU/g) - 0.00 Log (CFU/g) = -6.43 Log (CFU/g) Estimate of Torezolid Effect Mediated Through Granulocytes = Effect of Torezolid Mediated Through Granulocytes + Direct WBC Effect - WBC Effect+ 24 hr -2.67 Log (CFU/g) + 1.51 Log (CFU/g) = -1.16 Log (CFU/g) 48 hr -5.26 Log (CFU/g) + 1.73 Log (CFU/g) = -3.53 Log (CFU/g) 72 hr -6.43 Log (CFU/g) + 1.73 Log (CFU/g) = -4.70 Log (CFU/g)
* The actual direct drug effect cannot be calculated for the 72 hr time point because all the animals in the granulocytopenic no-treatment control cohort had expired before that time. As the actual value for 48 hr was a negative, the direct effect was fixed to zero
for this time point. +It is not a fair appraisal of direct granuolocyte effect to examine amplification in the granulocytopenic no-treatment control versus the normal no-treatment control, because there were different starting inocula, but the upper bound is fixed in both instances because of stationary phase. We estimated the direct effect by assuming the granulocytopenic no-treatment control cohort started at 7.54 Log (CFU), which is the same as the normal no-treatment control cohort and the direct granulocyte effect would be the difference in organism amplification between the granulocytopenic and normal no-treatment control cohorts. Again, for the 72 hr time point, we use the value from 48 hr because all animals in the granulocytopenic cohort had expired.
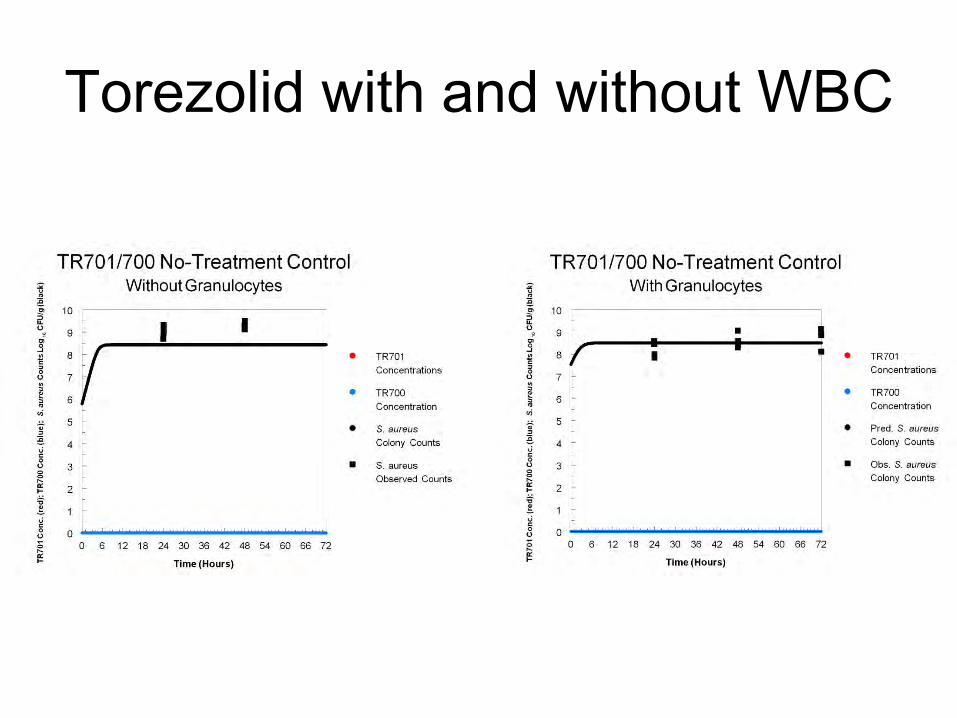
Torezolid with and without WBC

Torezolid with and without WBC


Granulocyte Effect • Granulocytes kill substantially • They are Michaelis-Menten, meaning they can
be saturated • Poor drugs may work if the burden is low
enough so that the drug causes the burden to decline to the area of the Km
• In the case of moxifloxacin, both drug and granulocyte effect are substantial
• In the case of torezolid, the majority of the cell kill is effected through the granulocytes

PK/PD – How Long is Long Enough?
• Are there clinical data that short is good? YES! 1) Ambrose Gatifloxacin Sinus Study 2) Levofloxacin CAP Study 3) Chastre Study for VAP 4) Meropenem VAP Study (Not shown)
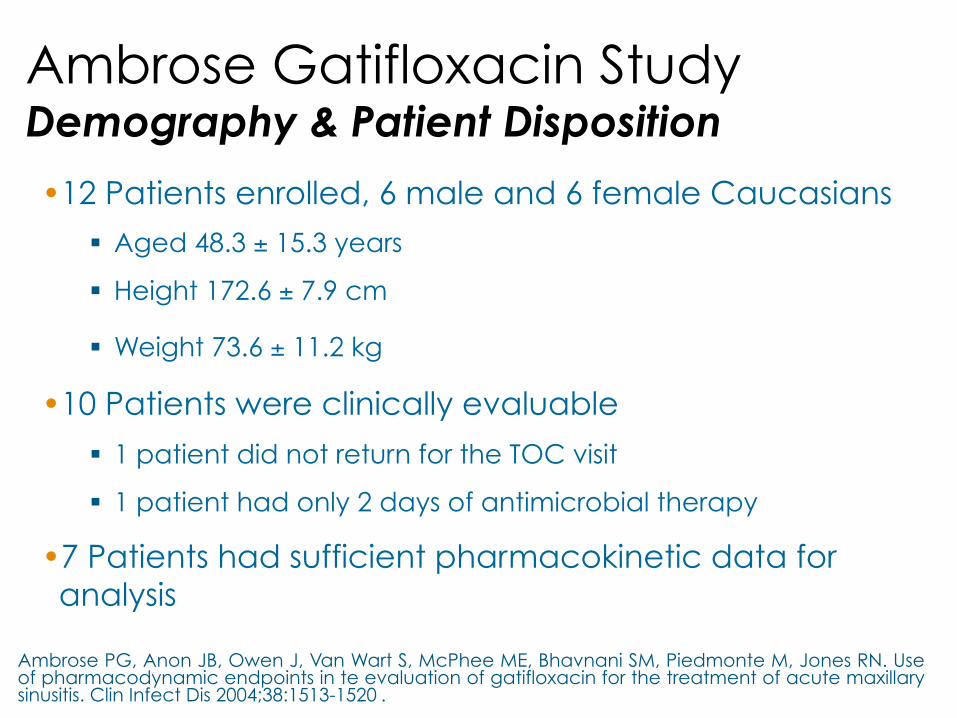
Ambrose Gatifloxacin Study Demography & Patient Disposition
• 12 Patients enrolled, 6 male and 6 female Caucasians
§ Aged 48.3 ± 15.3 years
§ Height 172.6 ± 7.9 cm
§ Weight 73.6 ± 11.2 kg
• 10 Patients were clinically evaluable
§ 1 patient did not return for the TOC visit
§ 1 patient had only 2 days of antimicrobial therapy
• 7 Patients had sufficient pharmacokinetic data for analysis
Ambrose PG, Anon JB, Owen J, Van Wart S, McPhee ME, Bhavnani SM, Piedmonte M, Jones RN. Use of pharmacodynamic endpoints in te evaluation of gatifloxacin for the treatment of acute maxillary sinusitis. Clin Infect Dis 2004;38:1513-1520 .

RESULTS Gatifloxacin Exposure: Plasma vs. Sinus Aspirate
Ambrose PG, Anon JB, Owen J, Van Wart S, McPhee ME, Bhavnani SM, Piedmonte M, Jones RN. Use of pharmacodynamic endpoints in te evaluation of gatifloxacin for the treatment of acute maxillary sinusitis. Clin Infect Dis 2004;38:1513-1520.

RESULTS Microbiologic Outcome at End of Therapy
Ambrose PG, Anon JB, Owen J, Van Wart S, McPhee ME, Bhavnani SM, Piedmonte M, Jones RN. Use of pharmacodynamic endpoints in te evaluation of gatifloxacin for the treatment of acute maxillary sinusitis. Clin Infect Dis 2004;38:1513-1520.

RESULTS Time to Eradication
Ambrose PG, Anon JB, Owen J, Van Wart S, McPhee ME, Bhavnani SM, Piedmonte M, Jones RN. Use of pharmacodynamic endpoints in te evaluation of gatifloxacin for the treatment of acute maxillary sinusitis. Clin Infect Dis 2004;38:1513-1520.

Levo Short Course CAP Study

Levo Short Course CAP Study
Stratum I = PSI classes III+IV+V
Stratum II = PSI classes I+II
Dunbar et al. Clin Infect Dis 2003;37:752-760

Chastre Study: Short vs Long-Term Rx for Nosocomial Pneumonia
Chastre J et al. JAMA 2003;290:2588-2598
Patients with non-fermenting GNB did have a higher recurrence rate in the 8-d group, implying that eradication had not occurred (40.6% vs 25.4%)
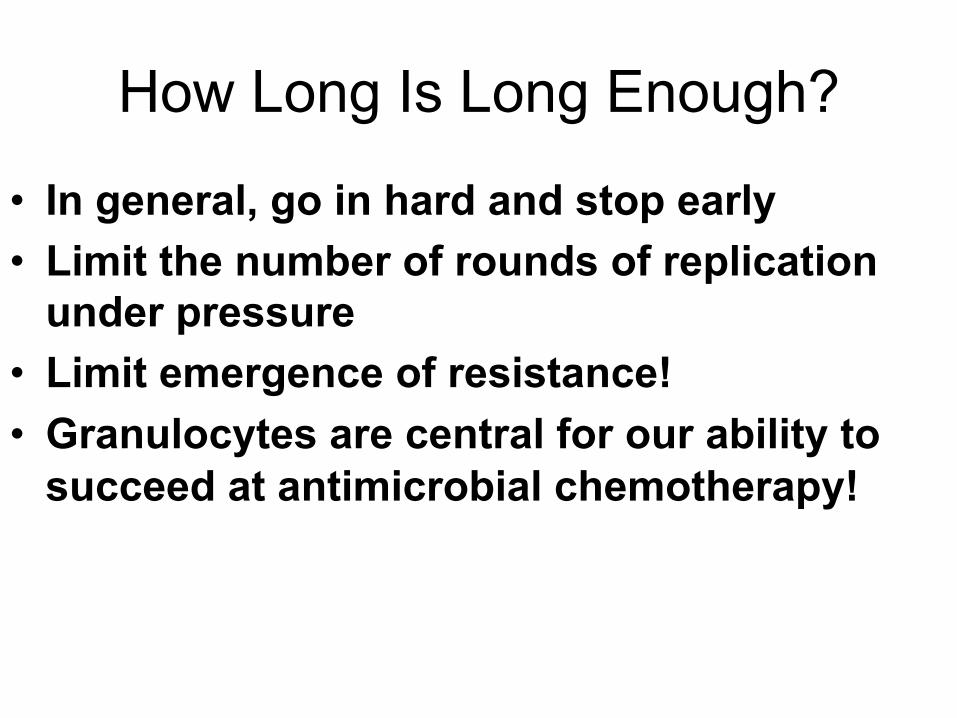
How Long Is Long Enough?
• In general, go in hard and stop early • Limit the number of rounds of replication
under pressure • Limit emergence of resistance! • Granulocytes are central for our ability to
succeed at antimicrobial chemotherapy!
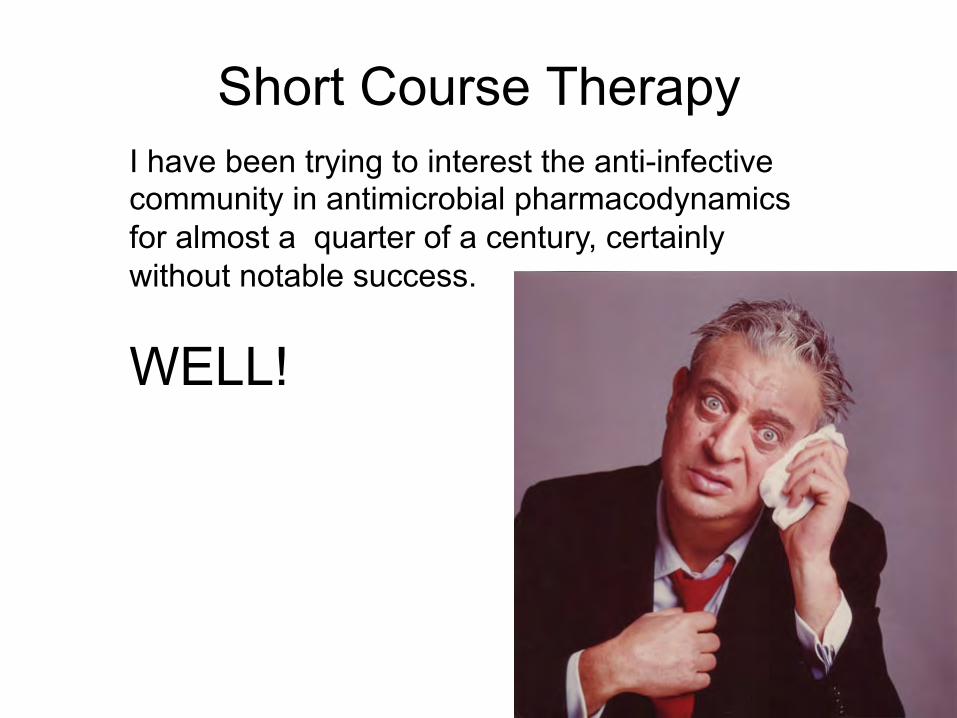
Short Course Therapy I have been trying to interest the anti-infective community in antimicrobial pharmacodynamics for almost a quarter of a century, certainly without notable success.
WELL!

George George

Thanks for Your Attention!
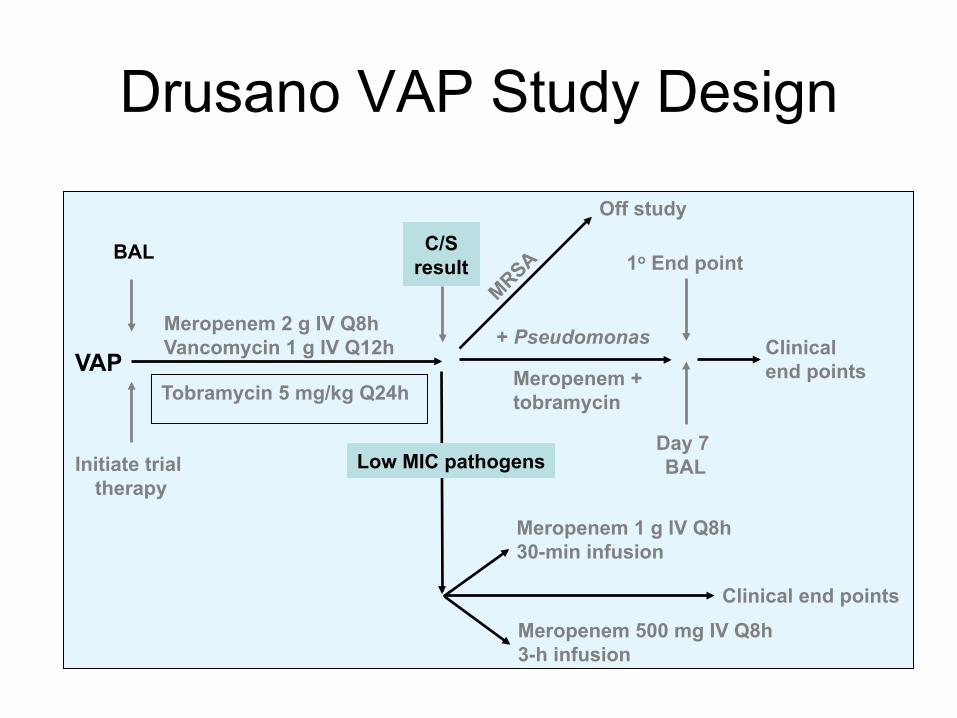
Drusano VAP Study Design
VAP
BAL
Initiate trial therapy
Meropenem 2 g IV Q8h Vancomycin 1 g IV Q12h
Tobramycin 5 mg/kg Q24h
C/S result
Off study
Low MIC pathogens
+ Pseudomonas
Day 7 BAL
1o End point
Meropenem + tobramycin
Clinical end points
Meropenem 1 g IV Q8h 30-min infusion
Meropenem 500 mg IV Q8h 3-h infusion
Clinical end points

Drusano VAP Study Design So, what were the hypotheses tested? • High-dose meropenem plus an aminoglycoside
would have a salutary effect on the emergence of resistance in P. aeruginosa
• No other resistance would emerge in other Gram-negative bacilli, except for Acinetobacter spp.
• Organism clearance would occur by day 7 • For organisms other than nonfermentors (and
MRSA), low-dose (500 mg) meropenem would be as effective as 1000 mg Q8h

Drusano VAP Study Design Meropenem 2 g
Plus Tobramycin
Meropenem 1 g 30-min Infusion
Meropenem 0.5 g 3-h Infusion
All pathogens/ patients
1/14 (7.1%) / 1/9 (11.1%)
0/28 (0%) / 0/14 (0%)
1/22 (4.5%) / 1/13 (7.7%)
P. aeruginosa 1/9 (11.1%) — —
Acinetobacter — — 1/2 (50%)

Drusano VAP Trial –Persistence by Day 7 by Lavage or PSB
• Hypothesis 3: Except for non-fermentative GNB, there was a high rate of documented eradication at day 7 Non-Pseudomonas/Non-Acinetobacter Group 1 Group 2 Group 3 5/5 (100%) 20/22 (90.9%) 13/15 (86.7%) Overall Clearance 38/42 (90.5%) Pseudomonas/Acinetobacter Groups 1 and 3 3/11 (27.3%)
Journal of Clinical Investigation 2003;112:275-285 & Nature Reviews Microbiology 2004;2:289-300 Jumbe et al J Clin Invest 2003;112:275-285
0 mg/kg
90 mg/kg
215 mg/kg 600 mg/kg

Peripheral (thigh) Compartment (Cp)
Central Blood Compartment (Cc) IP
injection
kcp kpc
+ Bacteria (XT/R)
f(c)
dCc= kaCa+kpcCp-kcpCc-keCc dt
ke
dXS=KGS x XS x L - fKS(CcH ξ) x XS
dt dXR= KGR x XR x L- fKR(Cc
H ξ) x XR dt
Kmax ξ •CcH ξ
C H ξ
50ξ+CcH ξ
fψξ(CcHξ)=
Y1=XT=XS+XR Y2=XR
[4]
[5]
[6]
[7]
[8]
, ψ=K and ξ = S,R
[2]
L = (1- (XR + XS)/POPMAX)
[9] dCp = kcpCc - kpc Cp
dt [3]
dCa= -kaCa dt [1]

RESULTS Gatifloxacin Exposure: Plasma vs. Sinus Aspirate
Ambrose PG, Anon JB, Owen J, Van Wart S, McPhee ME, Bhavnani SM, Piedmonte M, Jones RN. Use of pharmacodynamic endpoints in te evaluation of gatifloxacin for the treatment of acute maxillary sinusitis. Clin Infect Dis 2004;38:1513-1520.