Monitoring and Modeling of ROG at California Dairies · PDF fileMonitoring and Modeling of ROG...
26
Monitoring and Modeling of ROG at California Dairies Charles Krauter: Professor [email protected] Dave Goorahoo: Research Scientist Barry Goodrich: Research Engineer Matt Beene: Graduate Student Center for Irrigation Technology, Plant Science Dept. College of Agricultural Sciences & Technology California State University, Fresno, CA, 93740
Transcript of Monitoring and Modeling of ROG at California Dairies · PDF fileMonitoring and Modeling of ROG...
Monitoring and Modeling ofROG at California Dairies
Charles Krauter: [email protected] Goorahoo: Research ScientistBarry Goodrich: Research EngineerMatt Beene: Graduate StudentCenter for Irrigation Technology, Plant Science Dept.College of Agricultural Sciences & TechnologyCalifornia State University, Fresno, CA, 93740
CSU Fresno Air Quality Projects Related to Dairy Operations
ROG Sampling and Analysis for Dairies and Natural Soil/Vegetation In CaliforniaPrinciple Investigators: Charles Krauter and Dave Goorahoo, CITCooperators: Derek Dormedy, CSU Fresno Chemistry Department and Chris Potter andSteve Klooster, Ames Research Center - NASA, Moffet FieldBegun 5/1/02, to be completed 6/30/04Funded by the California Air Resources Board
Monitoring Ammonia, Methane and Other Emissions In Real Time At Dairies andOther Agricultural OperationsPrinciple Investigators: Dave Goorahoo and Charles Krauter, CSUF-CITBegun 7/1/02, to be completed 12/31/06Funded by the CSU-Agricultural Research Initiative
Dairy Air Quality Monitoring–An Investigation of the Occurrence and Mitigation ofAmmonia, Particulates and Ozone Precursors Associated With California DairiesPrinciple Investigators: Charles Krauter, California State University Fresno, CA; andTheresa Cassel, Crocker Nuclear Engineering Lab, UC Davis, CACooperators: Dave Goorahoo, Center for Irrigation Technology, CSU FresnoDerek Dormedy, Chemistry Department, CSU FresnoSteven Klooster, California State University Monterey Bay, CAJohn Pisano, Center for Environmental Research, UC Riverside, CAChristopher Potter, NASA Ames Research Center, Moffett Field, CABegun 7/1/03, to be completed 6/30/07 Funded by the CSU-ARI
Very Preliminary ConclusionsSome initial hypotheses are supportedby these first data sets:• The animal holding areas (free-stalls and
exercise corrals) are a larger source ofROG than the lagoons by a factor of 2 - 4.
• The seasonal variability of ROG emissionsmay not be as large as the summer vs.winter levels of ammonia.
• Dairy management may be linked to ROGemissions from both the corrals and thelagoon.

ROG sampling and modeling at selecteddairies in the San Joaquin Valley
• 1. Select dairies – about 2000 cows withflush-lane, free stall, lagoon systems.

ROG sampling and modeling at selecteddairies in the San Joaquin Valley
• 1. Select dairies – about 2000 cows withflush-lane, free stall, lagoon systems.
• 2. Determine sampling procedure – collect airsamples upwind of the dairy and downwind ofeach significant dairy process.
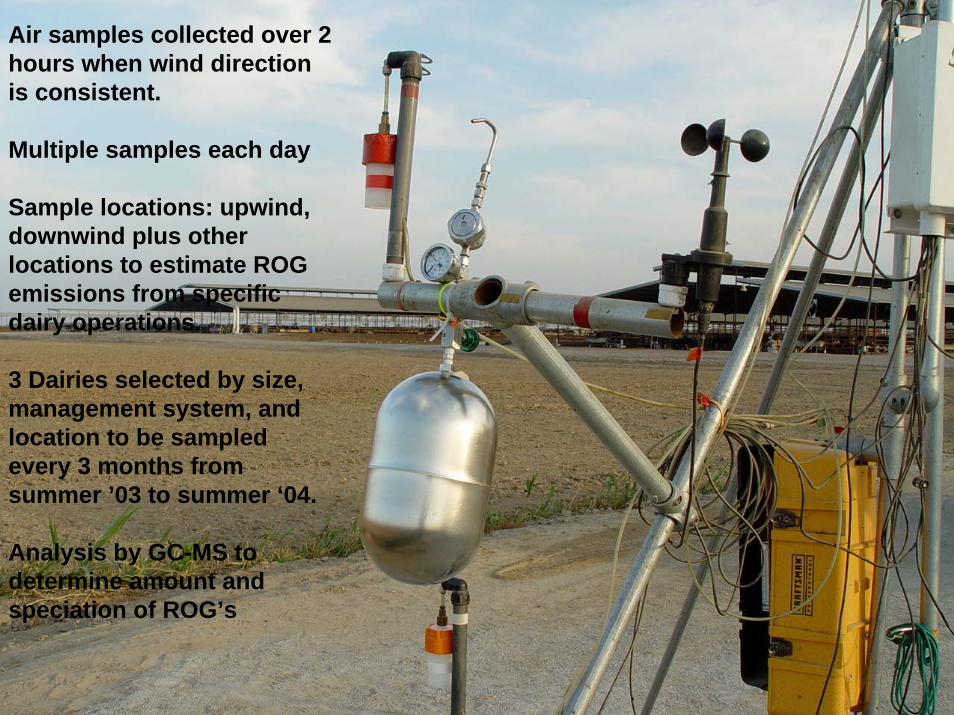
Air samples collected over 2hours when wind directionis consistent.
Multiple samples each day
Sample locations: upwind,downwind plus otherlocations to estimate ROGemissions from specificdairy operations.
3 Dairies selected by size,management system, andlocation to be sampledevery 3 months fromsummer ’03 to summer ‘04.
Analysis by GC-MS todetermine amount andspeciation of ROG’s
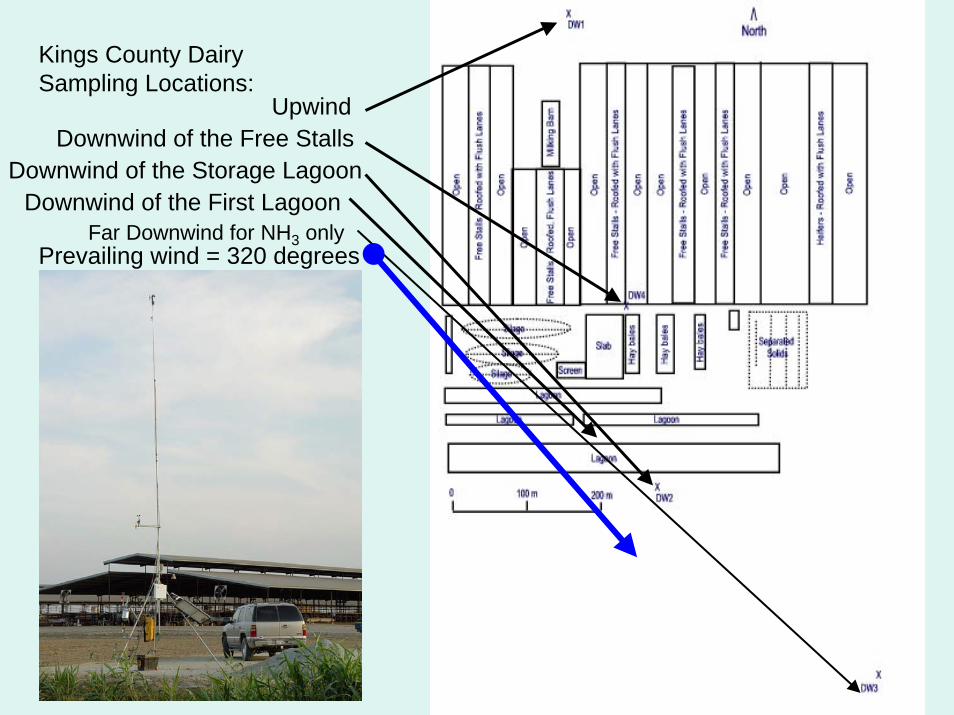
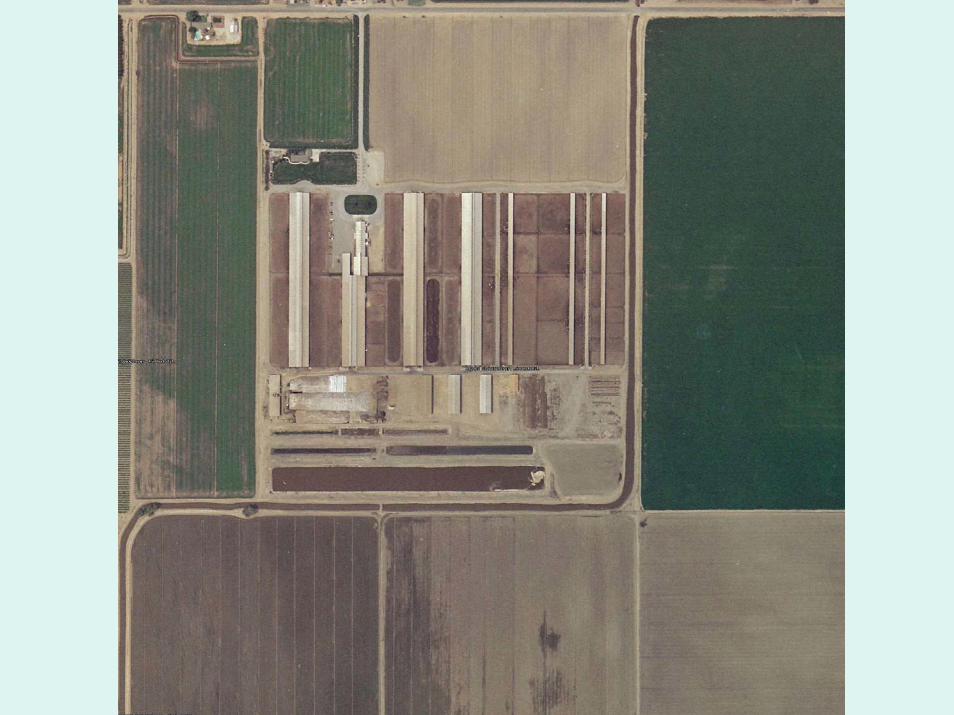
Kings County DairySampling Locations:
Prevailing wind = 320 degrees
UpwindDownwind of the Free Stalls
Downwind of the Storage Lagoon
Far Downwind for NH3 onlyDownwind of the First Lagoon

ROG sampling and modeling at selecteddairies in the San Joaquin Valley
• 1. Select dairies – about 2000 cows with flush-lane,free stall, lagoon systems.
• 2. Determine sampling procedure – collect airsamples upwind of the dairy and downwind of eachsignificant dairy process.
• 3. Analyze samples – GCMS analysis of each fieldsample utilizing an appropriate standard to identifyand determine the quantity of each gas.
• 4. Model emissions – estimate emissions from eachdairy process by determining the net concentrationfrom the upwind-downwind difference and model theemission using a Gaussian plume model (ISC-STv3)
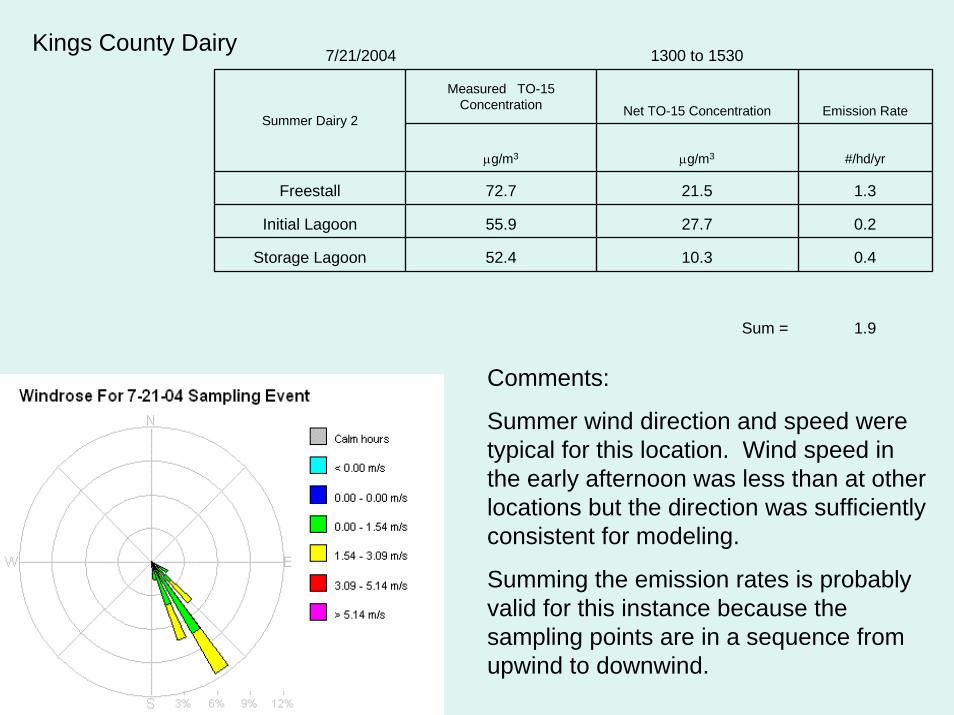
1.9Sum =
0.410.352.4Storage Lagoon
0.227.755.9Initial Lagoon
1.321.572.7Freestall
#/hd/yrµg/m3µg/m3
Emission RateNet TO-15 Concentration
Measured TO-15Concentration
Summer Dairy 2
1300 to 15307/21/2004Kings County Dairy
Comments:
Summer wind direction and speed weretypical for this location. Wind speed inthe early afternoon was less than at otherlocations but the direction was sufficientlyconsistent for modeling.
Summing the emission rates is probablyvalid for this instance because thesampling points are in a sequence fromupwind to downwind.
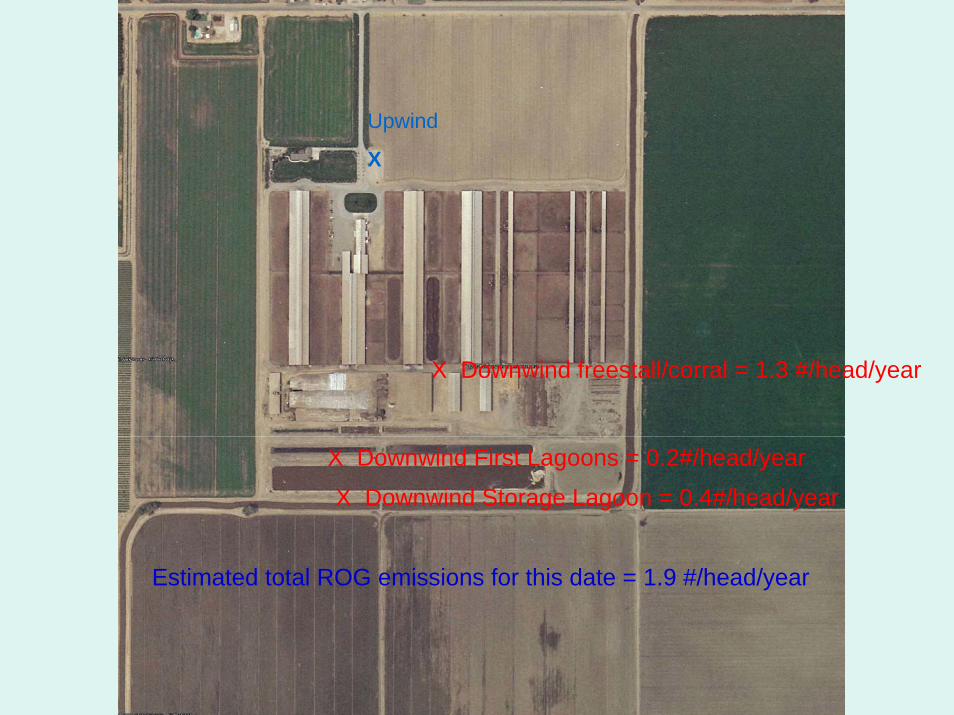
Upwind
X
X Downwind freestall/corral = 1.3 #/head/year
X Downwind First Lagoons = 0.2#/head/year
X Downwind Storage Lagoon = 0.4#/head/year
Estimated total ROG emissions for this date = 1.9 #/head/year
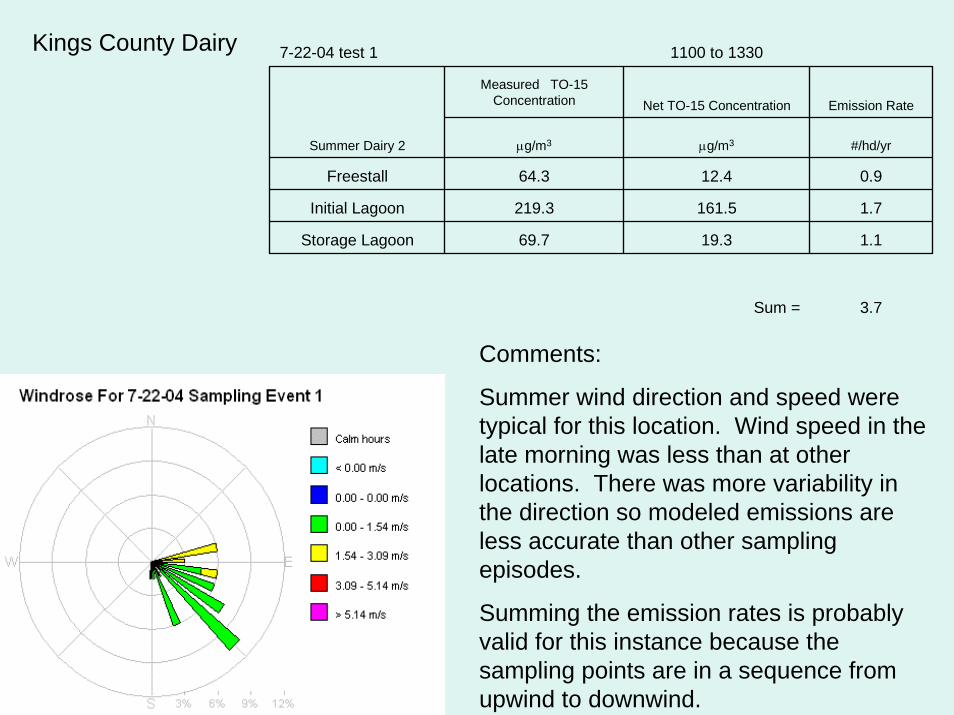
3.7Sum =
1.119.369.7Storage Lagoon
1.7161.5219.3Initial Lagoon
0.912.464.3Freestall
#/hd/yrµg/m3µg/m3
Emission RateNet TO-15 ConcentrationMeasured TO-15
Concentration
Summer Dairy 2
1100 to 13307-22-04 test 1Kings County Dairy
Comments:
Summer wind direction and speed weretypical for this location. Wind speed in thelate morning was less than at otherlocations. There was more variability inthe direction so modeled emissions areless accurate than other samplingepisodes.
Summing the emission rates is probablyvalid for this instance because thesampling points are in a sequence fromupwind to downwind.
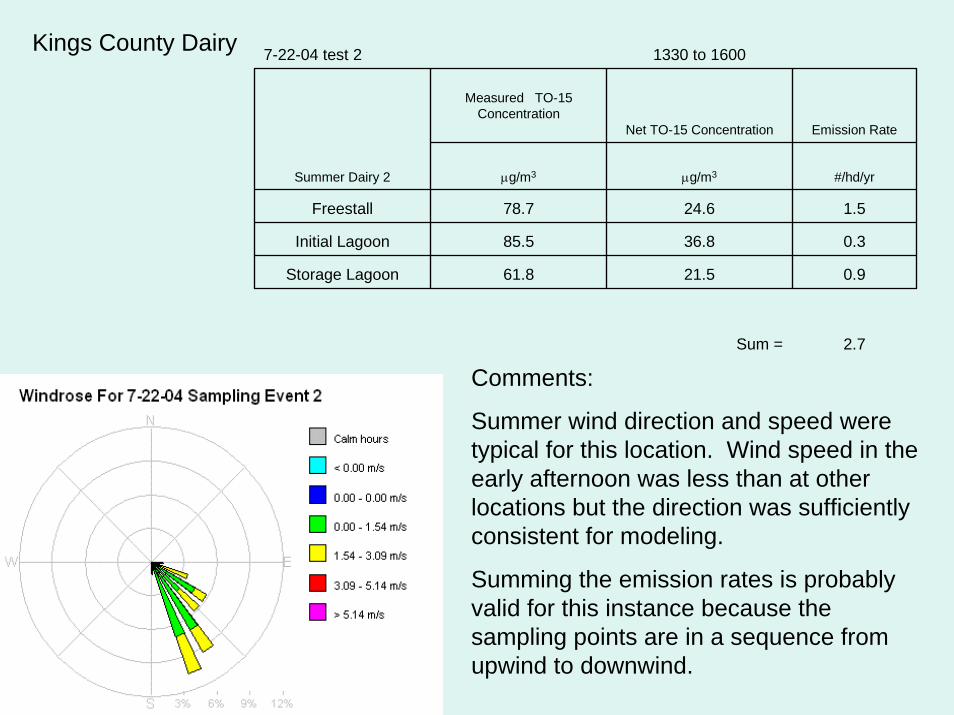
2.7Sum =
0.921.561.8Storage Lagoon
0.336.885.5Initial Lagoon
1.524.678.7Freestall
#/hd/yrµg/m3µg/m3
Emission RateNet TO-15 Concentration
Measured TO-15Concentration
Summer Dairy 2
1330 to 16007-22-04 test 2Kings County Dairy
Comments:
Summer wind direction and speed weretypical for this location. Wind speed in theearly afternoon was less than at otherlocations but the direction was sufficientlyconsistent for modeling.
Summing the emission rates is probablyvalid for this instance because thesampling points are in a sequence fromupwind to downwind.
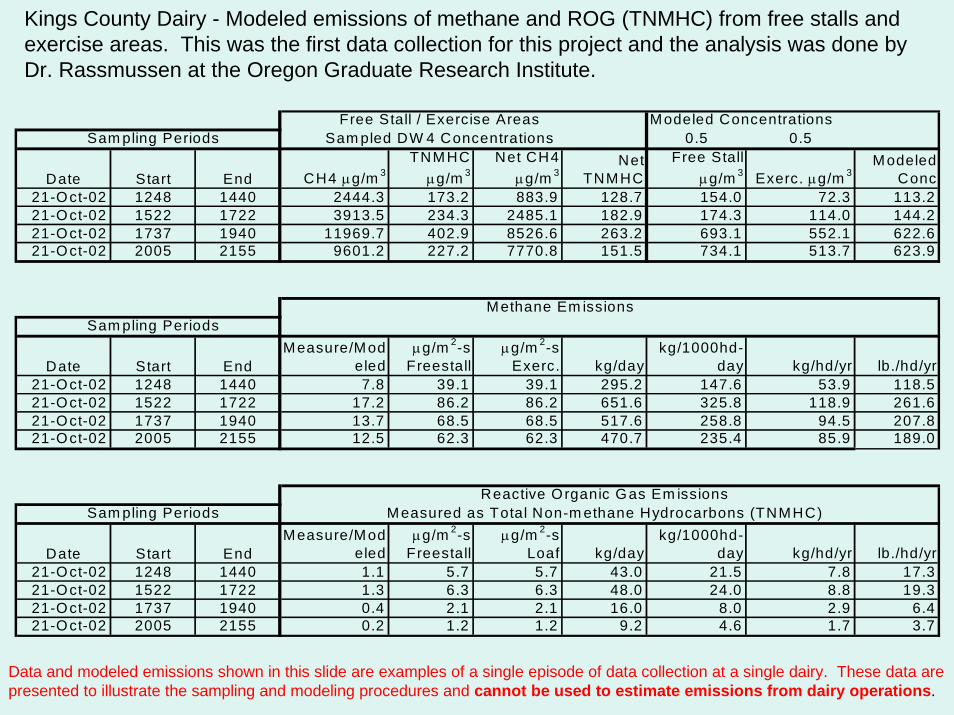
Kings County Dairy - Modeled emissions of methane and ROG (TNMHC) from free stalls andexercise areas. This was the first data collection for this project and the analysis was done byDr. Rassmussen at the Oregon Graduate Research Institute.
Free Stall / Exercise Areas Modeled ConcentrationsSam pling Periods Sam pled DW 4 Concentrations 0.5 0.5
Date Start End CH4 µg/m 3TNMHC
µg/m 3Net CH4
µg/m 3Net
TNMHCFree Stall
µg/m 3 Exerc. µg/m 3Modeled
Conc21-Oct-02 1248 1440 2444.3 173.2 883.9 128.7 154.0 72.3 113.221-Oct-02 1522 1722 3913.5 234.3 2485.1 182.9 174.3 114.0 144.221-Oct-02 1737 1940 11969.7 402.9 8526.6 263.2 693.1 552.1 622.621-Oct-02 2005 2155 9601.2 227.2 7770.8 151.5 734.1 513.7 623.9
Methane Em issionsSam pling Periods
Date Start EndMeasure/Mod
eledµg/m 2-s
Freestallµg/m 2-s
Exerc. kg/daykg/1000hd-
day kg/hd/yr lb./hd/yr21-Oct-02 1248 1440 7.8 39.1 39.1 295.2 147.6 53.9 118.521-Oct-02 1522 1722 17.2 86.2 86.2 651.6 325.8 118.9 261.621-Oct-02 1737 1940 13.7 68.5 68.5 517.6 258.8 94.5 207.821-Oct-02 2005 2155 12.5 62.3 62.3 470.7 235.4 85.9 189.0
Reactive Organic Gas Em issionsSam pling Periods Measured as Total Non-m ethane Hydrocarbons (TNMHC)
Date Start EndMeasure/Mod
eledµg/m 2-s
Freestallµg/m 2-s
Loaf kg/daykg/1000hd-
day kg/hd/yr lb./hd/yr21-Oct-02 1248 1440 1.1 5.7 5.7 43.0 21.5 7.8 17.321-Oct-02 1522 1722 1.3 6.3 6.3 48.0 24.0 8.8 19.321-Oct-02 1737 1940 0.4 2.1 2.1 16.0 8.0 2.9 6.421-Oct-02 2005 2155 0.2 1.2 1.2 9.2 4.6 1.7 3.7
Data and modeled emissions shown in this slide are examples of a single episode of data collection at a single dairy. These data arepresented to illustrate the sampling and modeling procedures and cannot be used to estimate emissions from dairy operations.
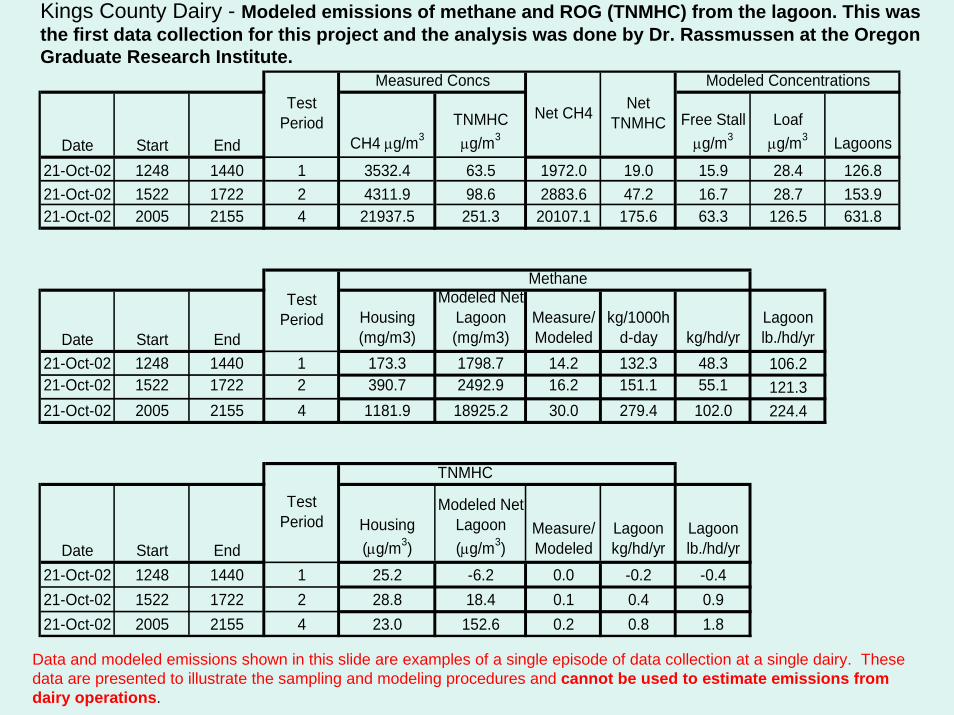
Kings County Dairy - Modeled emissions of methane and ROG (TNMHC) from the lagoon. This wasthe first data collection for this project and the analysis was done by Dr. Rassmussen at the OregonGraduate Research Institute.
Date Start End CH4 µg/m3TNMHC µg/m3
Free Stall µg/m3
Loaf µg/m3 Lagoons
21-Oct-02 1248 1440 1 3532.4 63.5 1972.0 19.0 15.9 28.4 126.821-Oct-02 1522 1722 2 4311.9 98.6 2883.6 47.2 16.7 28.7 153.921-Oct-02 2005 2155 4 21937.5 251.3 20107.1 175.6 63.3 126.5 631.8
Methane
Date Start EndHousing (mg/m3)
Modeled Net Lagoon (mg/m3)
Measure/ Modeled
kg/1000hd-day kg/hd/yr
Lagoon lb./hd/yr
21-Oct-02 1248 1440 1 173.3 1798.7 14.2 132.3 48.3 106.221-Oct-02 1522 1722 2 390.7 2492.9 16.2 151.1 55.1 121.321-Oct-02 2005 2155 4 1181.9 18925.2 30.0 279.4 102.0 224.4
TNMHC
Date Start EndHousing (µg/m3)
Modeled Net Lagoon (µg/m3)
Measure/Modeled
Lagoon kg/hd/yr
Lagoon lb./hd/yr
21-Oct-02 1248 1440 1 25.2 -6.2 0.0 -0.2 -0.421-Oct-02 1522 1722 2 28.8 18.4 0.1 0.4 0.921-Oct-02 2005 2155 4 23.0 152.6 0.2 0.8 1.8
Test Period
Test Period
Test Period
Modeled ConcentrationsMeasured Concs
Net CH4 Net TNMHC
Data and modeled emissions shown in this slide are examples of a single episode of data collection at a single dairy. Thesedata are presented to illustrate the sampling and modeling procedures and cannot be used to estimate emissions fromdairy operations.
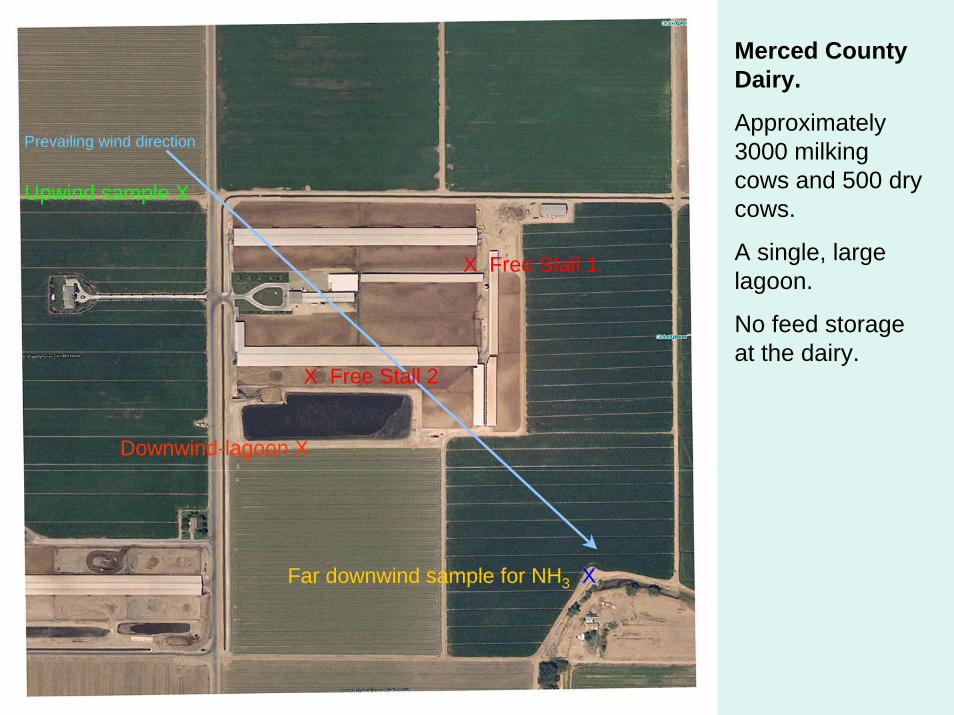
Prevailing wind direction
Upwind sample X
Downwind-lagoon X
Far downwind sample for NH3 X
X Free Stall 1
X Free Stall 2
Merced CountyDairy.
Approximately3000 milkingcows and 500 drycows.
A single, largelagoon.
No feed storageat the dairy.
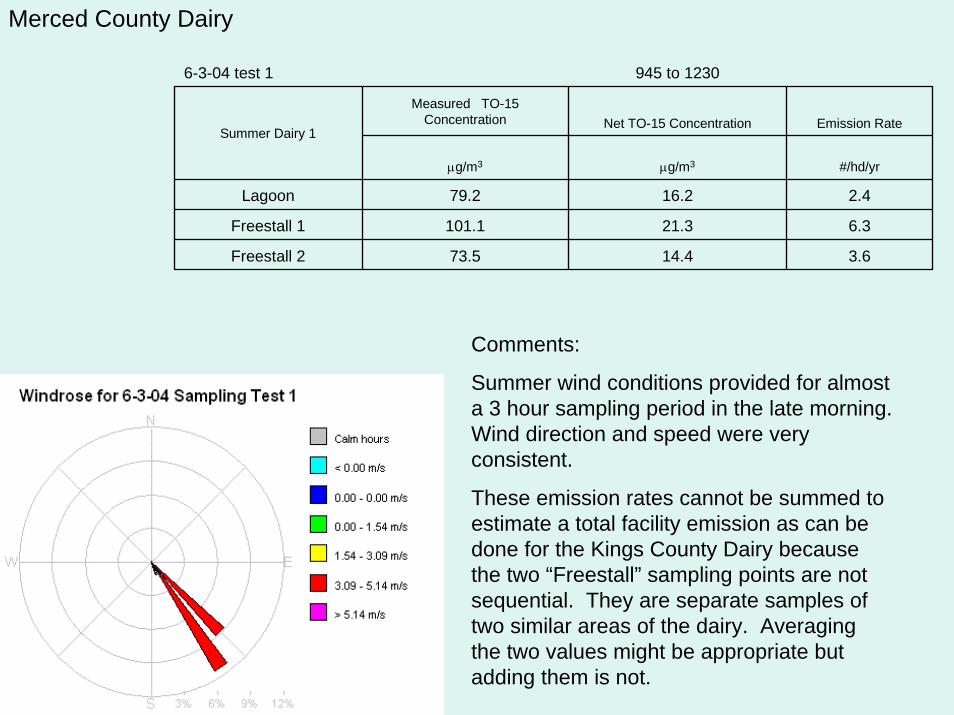
3.614.473.5Freestall 2
6.321.3101.1Freestall 1
2.416.279.2Lagoon
#/hd/yrµg/m3µg/m3
Emission RateNet TO-15 ConcentrationMeasured TO-15
ConcentrationSummer Dairy 1
945 to 12306-3-04 test 1
Comments:
Summer wind conditions provided for almosta 3 hour sampling period in the late morning.Wind direction and speed were veryconsistent.
These emission rates cannot be summed toestimate a total facility emission as can bedone for the Kings County Dairy becausethe two “Freestall” sampling points are notsequential. They are separate samples oftwo similar areas of the dairy. Averagingthe two values might be appropriate butadding them is not.
Merced County Dairy
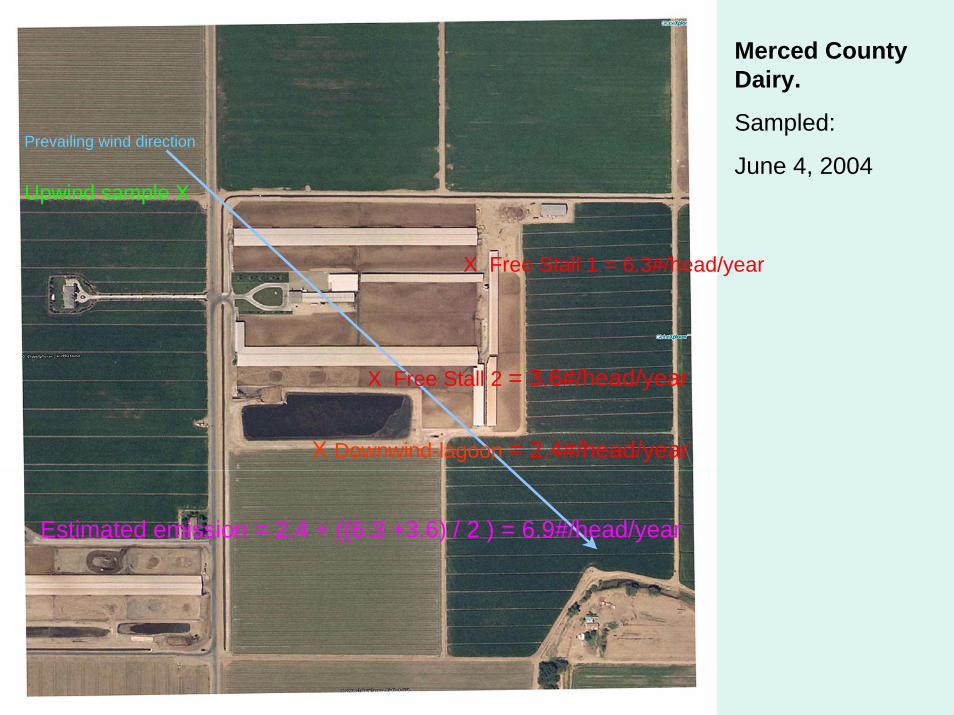
Prevailing wind direction
Upwind sample X
X Downwind-lagoon = 2.4#/head/year
X Free Stall 1 = 6.3#/head/year
X Free Stall 2 = 3.6#/head/year
Merced CountyDairy.
Sampled:
June 4, 2004
Estimated emission = 2.4 + ((6.3 +3.6) / 2 ) = 6.9#/head/year
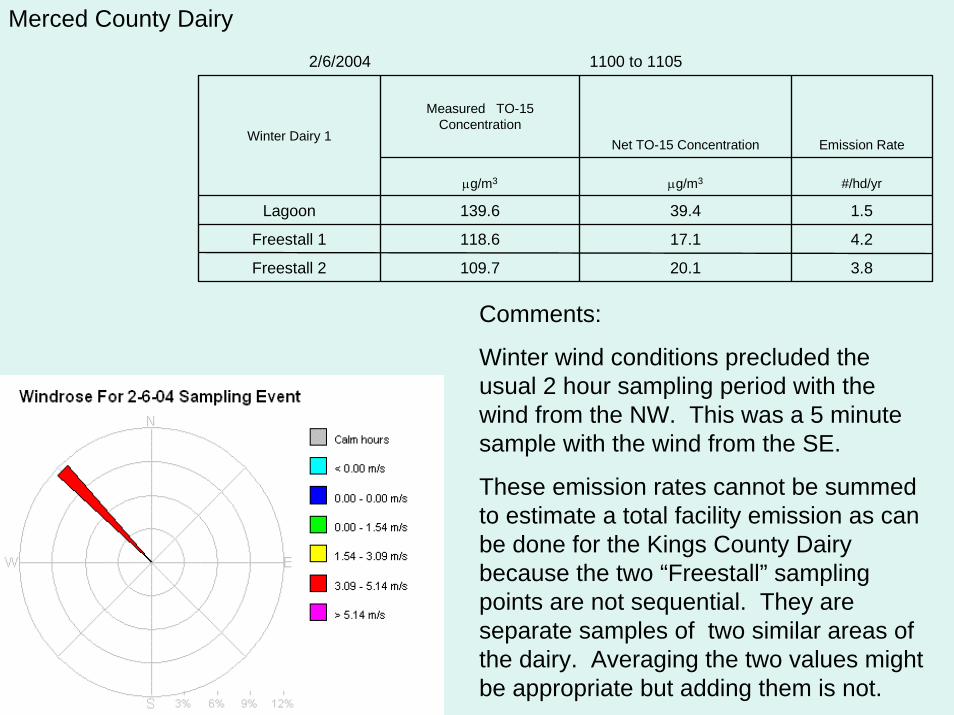
3.820.1109.7Freestall 2
4.217.1118.6Freestall 1
1.539.4139.6Lagoon
#/hd/yrµg/m3µg/m3
Emission RateNet TO-15 Concentration
Measured TO-15Concentration
Winter Dairy 1
1100 to 11052/6/2004
Merced County Dairy
Comments:
Winter wind conditions precluded theusual 2 hour sampling period with thewind from the NW. This was a 5 minutesample with the wind from the SE.
These emission rates cannot be summedto estimate a total facility emission as canbe done for the Kings County Dairybecause the two “Freestall” samplingpoints are not sequential. They areseparate samples of two similar areas ofthe dairy. Averaging the two values mightbe appropriate but adding them is not.
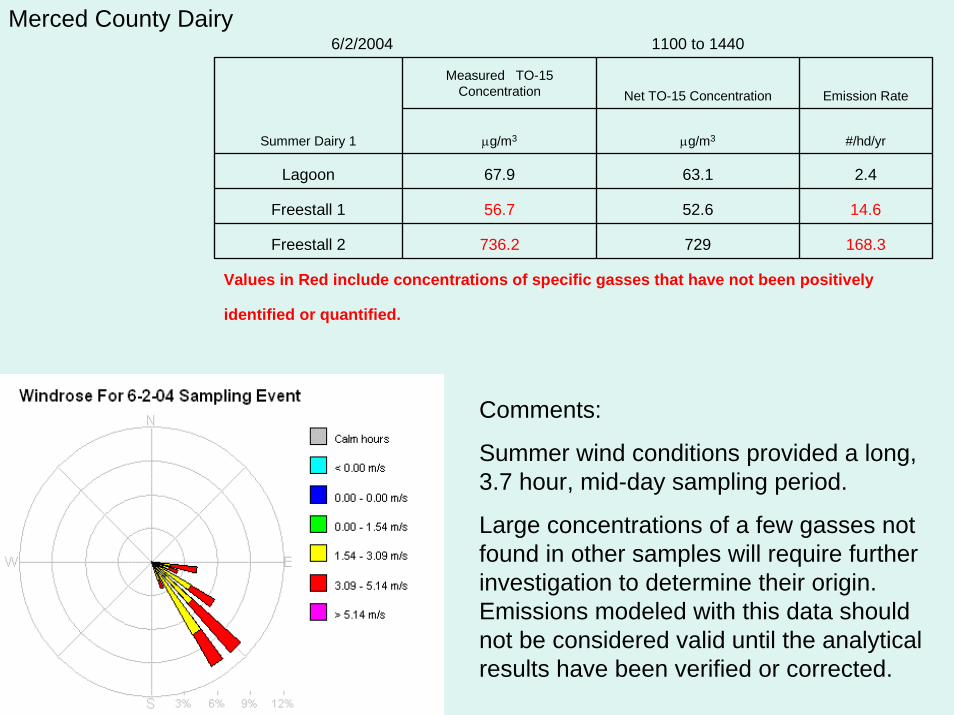
identified or quantified.
Values in Red include concentrations of specific gasses that have not been positively
168.3729736.2Freestall 2
14.652.656.7Freestall 1
2.463.167.9Lagoon
#/hd/yrµg/m3µg/m3
Emission RateNet TO-15 ConcentrationMeasured TO-15
Concentration
Summer Dairy 1
1100 to 14406/2/2004Merced County Dairy
Comments:
Summer wind conditions provided a long,3.7 hour, mid-day sampling period.
Large concentrations of a few gasses notfound in other samples will require furtherinvestigation to determine their origin.Emissions modeled with this data shouldnot be considered valid until the analyticalresults have been verified or corrected.

identified or quantified.
Values in Red include concentrations of specific gasses that have not been positively
20.586.2111.0Freestall 2
19.167.590.3Freestall 1
17.7345.5431.5Lagoon
#/hd/yrµg/m3µg/m3
Emission RateNet TO-15 Concentration
Measured TO-15Concentration
Summer Dairy 1
1300 to 15006-3-04 test 2
Comments:Summer wind conditions provided a normal2 hour sampling period in the late morning.Wind speed and direction were veryconsistent.Large concentrations of a few gasses notfound in other samples will require furtherinvestigation to determine their origin.Emissions modeled with this data shouldnot be considered valid until the analyticalresults have been verified or corrected.
Merced County Dairy
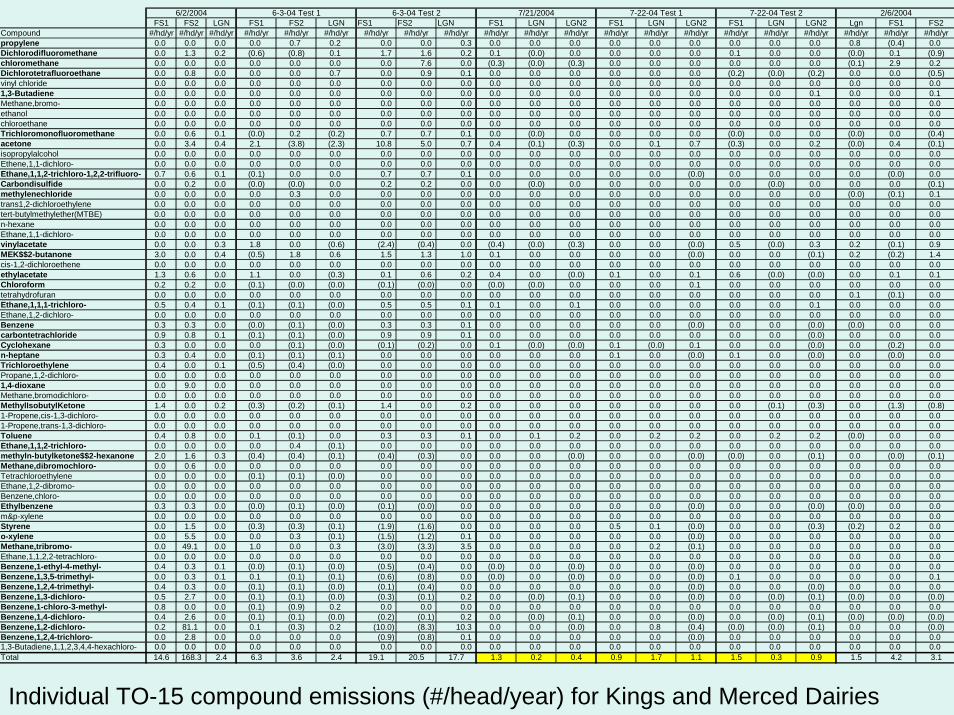
FS1 FS2 LGN FS1 FS2 LGN FS1 FS2 LGN FS1 LGN LGN2 FS1 LGN LGN2 FS1 LGN LGN2 Lgn FS1 FS2Compound #/hd/yr #/hd/yr #/hd/yr #/hd/yr #/hd/yr #/hd/yr #/hd/yr #/hd/yr #/hd/yr #/hd/yr #/hd/yr #/hd/yr #/hd/yr #/hd/yr #/hd/yr #/hd/yr #/hd/yr #/hd/yr #/hd/yr #/hd/yr #/hd/yrpropylene 0.0 0.0 0.0 0.0 0.7 0.2 0.0 0.0 0.3 0.0 0.0 0.0 0.0 0.0 0.0 0.0 0.0 0.0 0.8 (0.4) 0.0Dichlorodifluoromethane 0.0 1.3 0.2 (0.6) (0.8) 0.1 1.7 1.6 0.2 0.1 (0.0) 0.0 0.0 0.0 0.0 0.1 0.0 0.0 (0.0) 0.1 (0.9)chloromethane 0.0 0.0 0.0 0.0 0.0 0.0 0.0 7.6 0.0 (0.3) (0.0) (0.3) 0.0 0.0 0.0 0.0 0.0 0.0 (0.1) 2.9 0.2Dichlorotetrafluoroethane 0.0 0.8 0.0 0.0 0.0 0.7 0.0 0.9 0.1 0.0 0.0 0.0 0.0 0.0 0.0 (0.2) (0.0) (0.2) 0.0 0.0 (0.5)vinyl chloride 0.0 0.0 0.0 0.0 0.0 0.0 0.0 0.0 0.0 0.0 0.0 0.0 0.0 0.0 0.0 0.0 0.0 0.0 0.0 0.0 0.01,3-Butadiene 0.0 0.0 0.0 0.0 0.0 0.0 0.0 0.0 0.0 0.0 0.0 0.0 0.0 0.0 0.0 0.0 0.0 0.1 0.0 0.0 0.1Methane,bromo- 0.0 0.0 0.0 0.0 0.0 0.0 0.0 0.0 0.0 0.0 0.0 0.0 0.0 0.0 0.0 0.0 0.0 0.0 0.0 0.0 0.0ethanol 0.0 0.0 0.0 0.0 0.0 0.0 0.0 0.0 0.0 0.0 0.0 0.0 0.0 0.0 0.0 0.0 0.0 0.0 0.0 0.0 0.0chloroethane 0.0 0.0 0.0 0.0 0.0 0.0 0.0 0.0 0.0 0.0 0.0 0.0 0.0 0.0 0.0 0.0 0.0 0.0 0.0 0.0 0.0Trichloromonofluoromethane 0.0 0.6 0.1 (0.0) 0.2 (0.2) 0.7 0.7 0.1 0.0 (0.0) 0.0 0.0 0.0 0.0 (0.0) 0.0 0.0 (0.0) 0.0 (0.4)acetone 0.0 3.4 0.4 2.1 (3.8) (2.3) 10.8 5.0 0.7 0.4 (0.1) (0.3) 0.0 0.1 0.7 (0.3) 0.0 0.2 (0.0) 0.4 (0.1)isopropylalcohol 0.0 0.0 0.0 0.0 0.0 0.0 0.0 0.0 0.0 0.0 0.0 0.0 0.0 0.0 0.0 0.0 0.0 0.0 0.0 0.0 0.0Ethene,1,1-dichloro- 0.0 0.0 0.0 0.0 0.0 0.0 0.0 0.0 0.0 0.0 0.0 0.0 0.0 0.0 0.0 0.0 0.0 0.0 0.0 0.0 0.0Ethane,1,1,2-trichloro-1,2,2-trifluoro- 0.7 0.6 0.1 (0.1) 0.0 0.0 0.7 0.7 0.1 0.0 0.0 0.0 0.0 0.0 (0.0) 0.0 0.0 0.0 0.0 (0.0) 0.0Carbondisulfide 0.0 0.2 0.0 (0.0) (0.0) 0.0 0.2 0.2 0.0 0.0 (0.0) 0.0 0.0 0.0 0.0 0.0 (0.0) 0.0 0.0 0.0 (0.1)methylenechloride 0.0 0.0 0.0 0.0 0.3 0.0 0.0 0.0 0.0 0.0 0.0 0.0 0.0 0.0 0.0 0.0 0.0 0.0 (0.0) (0.1) 0.1trans1,2-dichloroethylene 0.0 0.0 0.0 0.0 0.0 0.0 0.0 0.0 0.0 0.0 0.0 0.0 0.0 0.0 0.0 0.0 0.0 0.0 0.0 0.0 0.0tert-butylmethylether(MTBE) 0.0 0.0 0.0 0.0 0.0 0.0 0.0 0.0 0.0 0.0 0.0 0.0 0.0 0.0 0.0 0.0 0.0 0.0 0.0 0.0 0.0n-hexane 0.0 0.0 0.0 0.0 0.0 0.0 0.0 0.0 0.0 0.0 0.0 0.0 0.0 0.0 0.0 0.0 0.0 0.0 0.0 0.0 0.0Ethane,1,1-dichloro- 0.0 0.0 0.0 0.0 0.0 0.0 0.0 0.0 0.0 0.0 0.0 0.0 0.0 0.0 0.0 0.0 0.0 0.0 0.0 0.0 0.0vinylacetate 0.0 0.0 0.3 1.8 0.0 (0.6) (2.4) (0.4) 0.0 (0.4) (0.0) (0.3) 0.0 0.0 (0.0) 0.5 (0.0) 0.3 0.2 (0.1) 0.9MEK$$2-butanone 3.0 0.0 0.4 (0.5) 1.8 0.6 1.5 1.3 1.0 0.1 0.0 0.0 0.0 0.0 (0.0) 0.0 0.0 (0.1) 0.2 (0.2) 1.4cis-1,2-dichloroethene 0.0 0.0 0.0 0.0 0.0 0.0 0.0 0.0 0.0 0.0 0.0 0.0 0.0 0.0 0.0 0.0 0.0 0.0 0.0 0.0 0.0ethylacetate 1.3 0.6 0.0 1.1 0.0 (0.3) 0.1 0.6 0.2 0.4 0.0 (0.0) 0.1 0.0 0.1 0.6 (0.0) (0.0) 0.0 0.1 0.1Chloroform 0.2 0.2 0.0 (0.1) (0.0) (0.0) (0.1) (0.0) 0.0 (0.0) (0.0) 0.0 0.0 0.0 0.1 0.0 0.0 0.0 0.0 0.0 0.0tetrahydrofuran 0.0 0.0 0.0 0.0 0.0 0.0 0.0 0.0 0.0 0.0 0.0 0.0 0.0 0.0 0.0 0.0 0.0 0.0 0.1 (0.1) 0.0Ethane,1,1,1-trichloro- 0.5 0.4 0.1 (0.1) (0.1) (0.0) 0.5 0.5 0.1 0.1 0.0 0.1 0.0 0.0 0.0 0.0 0.0 0.1 0.0 0.0 0.0Ethane,1,2-dichloro- 0.0 0.0 0.0 0.0 0.0 0.0 0.0 0.0 0.0 0.0 0.0 0.0 0.0 0.0 0.0 0.0 0.0 0.0 0.0 0.0 0.0Benzene 0.3 0.3 0.0 (0.0) (0.1) (0.0) 0.3 0.3 0.1 0.0 0.0 0.0 0.0 0.0 (0.0) 0.0 0.0 (0.0) (0.0) 0.0 0.0carbontetrachloride 0.9 0.8 0.1 (0.1) (0.1) (0.0) 0.9 0.9 0.1 0.0 0.0 0.0 0.0 0.0 0.0 0.0 0.0 (0.0) 0.0 0.0 0.0Cyclohexane 0.3 0.0 0.0 0.0 (0.1) (0.0) (0.1) (0.2) 0.0 0.1 (0.0) (0.0) 0.1 (0.0) 0.1 0.0 0.0 (0.0) 0.0 (0.2) 0.0n-heptane 0.3 0.4 0.0 (0.1) (0.1) (0.1) 0.0 0.0 0.0 0.0 0.0 0.0 0.1 0.0 (0.0) 0.1 0.0 (0.0) 0.0 (0.0) 0.0Trichloroethylene 0.4 0.0 0.1 (0.5) (0.4) (0.0) 0.0 0.0 0.0 0.0 0.0 0.0 0.0 0.0 0.0 0.0 0.0 0.0 0.0 0.0 0.0Propane,1,2-dichloro- 0.0 0.0 0.0 0.0 0.0 0.0 0.0 0.0 0.0 0.0 0.0 0.0 0.0 0.0 0.0 0.0 0.0 0.0 0.0 0.0 0.01,4-dioxane 0.0 9.0 0.0 0.0 0.0 0.0 0.0 0.0 0.0 0.0 0.0 0.0 0.0 0.0 0.0 0.0 0.0 0.0 0.0 0.0 0.0Methane,bromodichloro- 0.0 0.0 0.0 0.0 0.0 0.0 0.0 0.0 0.0 0.0 0.0 0.0 0.0 0.0 0.0 0.0 0.0 0.0 0.0 0.0 0.0MethylIsobutylKetone 1.4 0.0 0.2 (0.3) (0.2) (0.1) 1.4 0.0 0.2 0.0 0.0 0.0 0.0 0.0 0.0 0.0 (0.1) (0.3) 0.0 (1.3) (0.8)1-Propene,cis-1,3-dichloro- 0.0 0.0 0.0 0.0 0.0 0.0 0.0 0.0 0.0 0.0 0.0 0.0 0.0 0.0 0.0 0.0 0.0 0.0 0.0 0.0 0.01-Propene,trans-1,3-dichloro- 0.0 0.0 0.0 0.0 0.0 0.0 0.0 0.0 0.0 0.0 0.0 0.0 0.0 0.0 0.0 0.0 0.0 0.0 0.0 0.0 0.0Toluene 0.4 0.8 0.0 0.1 (0.1) 0.0 0.3 0.3 0.1 0.0 0.1 0.2 0.0 0.2 0.2 0.0 0.2 0.2 (0.0) 0.0 0.0Ethane,1,1,2-trichloro- 0.0 0.0 0.0 0.0 0.4 (0.1) 0.0 0.0 0.0 0.0 0.0 0.0 0.0 0.0 0.0 0.0 0.0 0.0 0.0 0.0 0.0methyln-butylketone$$2-hexanone 2.0 1.6 0.3 (0.4) (0.4) (0.1) (0.4) (0.3) 0.0 0.0 0.0 (0.0) 0.0 0.0 (0.0) (0.0) 0.0 (0.1) 0.0 (0.0) (0.1)Methane,dibromochloro- 0.0 0.6 0.0 0.0 0.0 0.0 0.0 0.0 0.0 0.0 0.0 0.0 0.0 0.0 0.0 0.0 0.0 0.0 0.0 0.0 0.0Tetrachloroethylene 0.0 0.0 0.0 (0.1) (0.1) (0.0) 0.0 0.0 0.0 0.0 0.0 0.0 0.0 0.0 0.0 0.0 0.0 0.0 0.0 0.0 0.0Ethane,1,2-dibromo- 0.0 0.0 0.0 0.0 0.0 0.0 0.0 0.0 0.0 0.0 0.0 0.0 0.0 0.0 0.0 0.0 0.0 0.0 0.0 0.0 0.0Benzene,chloro- 0.0 0.0 0.0 0.0 0.0 0.0 0.0 0.0 0.0 0.0 0.0 0.0 0.0 0.0 0.0 0.0 0.0 0.0 0.0 0.0 0.0Ethylbenzene 0.3 0.3 0.0 (0.0) (0.1) (0.0) (0.1) (0.0) 0.0 0.0 0.0 0.0 0.0 0.0 (0.0) 0.0 0.0 (0.0) (0.0) 0.0 0.0m&p-xylene 0.0 0.0 0.0 0.0 0.0 0.0 0.0 0.0 0.0 0.0 0.0 0.0 0.0 0.0 0.0 0.0 0.0 0.0 0.0 0.0 0.0Styrene 0.0 1.5 0.0 (0.3) (0.3) (0.1) (1.9) (1.6) 0.0 0.0 0.0 0.0 0.5 0.1 (0.0) 0.0 0.0 (0.3) (0.2) 0.2 0.0o-xylene 0.0 5.5 0.0 0.0 0.3 (0.1) (1.5) (1.2) 0.1 0.0 0.0 0.0 0.0 0.0 (0.0) 0.0 0.0 0.0 0.0 0.0 0.0Methane,tribromo- 0.0 49.1 0.0 1.0 0.0 0.3 (3.0) (3.3) 3.5 0.0 0.0 0.0 0.0 0.2 (0.1) 0.0 0.0 0.0 0.0 0.0 0.0Ethane,1,1,2,2-tetrachloro- 0.0 0.0 0.0 0.0 0.0 0.0 0.0 0.0 0.0 0.0 0.0 0.0 0.0 0.0 0.0 0.0 0.0 0.0 0.0 0.0 0.0Benzene,1-ethyl-4-methyl- 0.4 0.3 0.1 (0.0) (0.1) (0.0) (0.5) (0.4) 0.0 (0.0) 0.0 (0.0) 0.0 0.0 (0.0) 0.0 0.0 0.0 0.0 0.0 0.0Benzene,1,3,5-trimethyl- 0.0 0.3 0.1 0.1 (0.1) (0.1) (0.6) (0.8) 0.0 (0.0) 0.0 (0.0) 0.0 0.0 (0.0) 0.1 0.0 0.0 0.0 0.0 0.1Benzene,1,2,4-trimethyl- 0.4 0.3 0.0 (0.1) (0.1) (0.0) (0.1) (0.4) 0.0 0.0 0.0 0.0 0.0 0.0 (0.0) 0.0 0.0 (0.0) 0.0 0.0 0.0Benzene,1,3-dichloro- 0.5 2.7 0.0 (0.1) (0.1) (0.0) (0.3) (0.1) 0.2 0.0 (0.0) (0.1) 0.0 0.0 (0.0) 0.0 (0.0) (0.1) (0.0) 0.0 (0.0)Benzene,1-chloro-3-methyl- 0.8 0.0 0.0 (0.1) (0.9) 0.2 0.0 0.0 0.0 0.0 0.0 0.0 0.0 0.0 0.0 0.0 0.0 0.0 0.0 0.0 0.0Benzene,1,4-dichloro- 0.4 2.6 0.0 (0.1) (0.1) (0.0) (0.2) (0.1) 0.2 0.0 (0.0) (0.1) 0.0 0.0 (0.0) 0.0 (0.0) (0.1) (0.0) (0.0) (0.0)Benzene,1,2-dichloro- 0.2 81.1 0.0 0.1 (0.3) 0.2 (10.0) (8.3) 10.3 0.0 0.0 (0.0) 0.0 0.8 (0.4) (0.0) (0.0) (0.1) 0.0 0.0 (0.0)Benzene,1,2,4-trichloro- 0.0 2.8 0.0 0.0 0.0 0.0 (0.9) (0.8) 0.1 0.0 0.0 0.0 0.0 0.0 (0.0) 0.0 0.0 0.0 0.0 0.0 0.01,3-Butadiene,1,1,2,3,4,4-hexachloro- 0.0 0.0 0.0 0.0 0.0 0.0 0.0 0.0 0.0 0.0 0.0 0.0 0.0 0.0 0.0 0.0 0.0 0.0 0.0 0.0 0.0Total 14.6 168.3 2.4 6.3 3.6 2.4 19.1 20.5 17.7 1.3 0.2 0.4 0.9 1.7 1.1 1.5 0.3 0.9 1.5 4.2 3.1
7-22-04 Test 1 7-22-04 Test 2 2/6/20046/2/2004 6-3-04 Test 1 6-3-04 Test 2 7/21/2004
Individual TO-15 compound emissions (#/head/year) for Kings and Merced Dairies
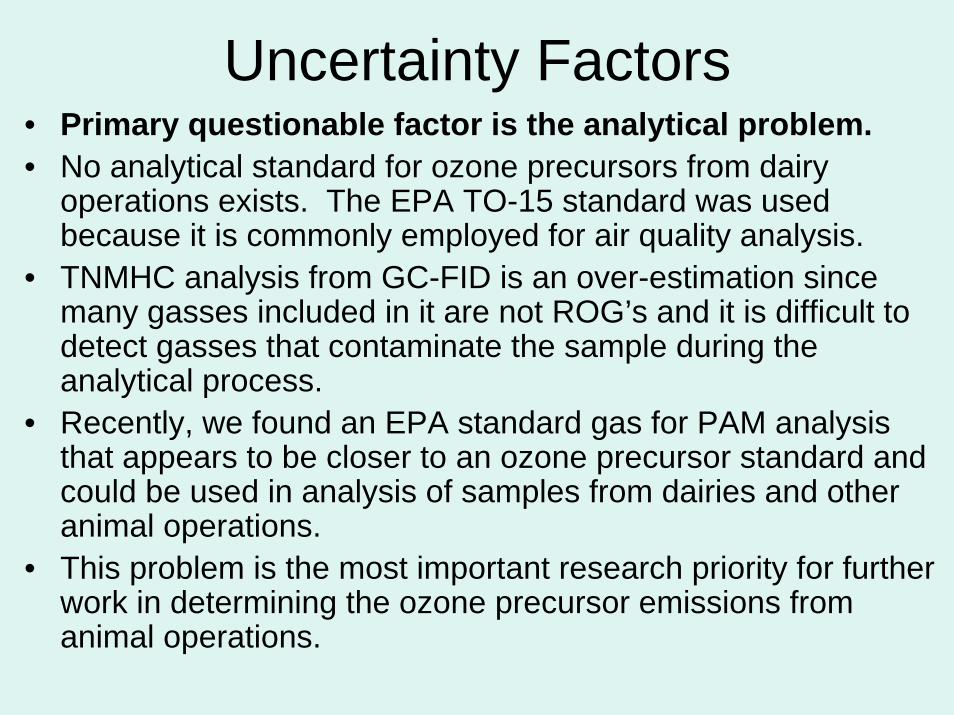
Uncertainty Factors• Primary questionable factor is the analytical problem.• No analytical standard for ozone precursors from dairy
operations exists. The EPA TO-15 standard was usedbecause it is commonly employed for air quality analysis.
• TNMHC analysis from GC-FID is an over-estimation sincemany gasses included in it are not ROG’s and it is difficult todetect gasses that contaminate the sample during theanalytical process.
• Recently, we found an EPA standard gas for PAM analysisthat appears to be closer to an ozone precursor standard andcould be used in analysis of samples from dairies and otheranimal operations.
• This problem is the most important research priority for furtherwork in determining the ozone precursor emissions fromanimal operations.
Uncertainty Factors• Secondary questionable factors include:• Requirement for consistent wind direction and
speed for modeling of results.• Wide range of management levels at dairies.• Sampling problems related to the analytical
difficulties.• Seasonal variability• Influence of upwind and surrounding
agricultural operations.
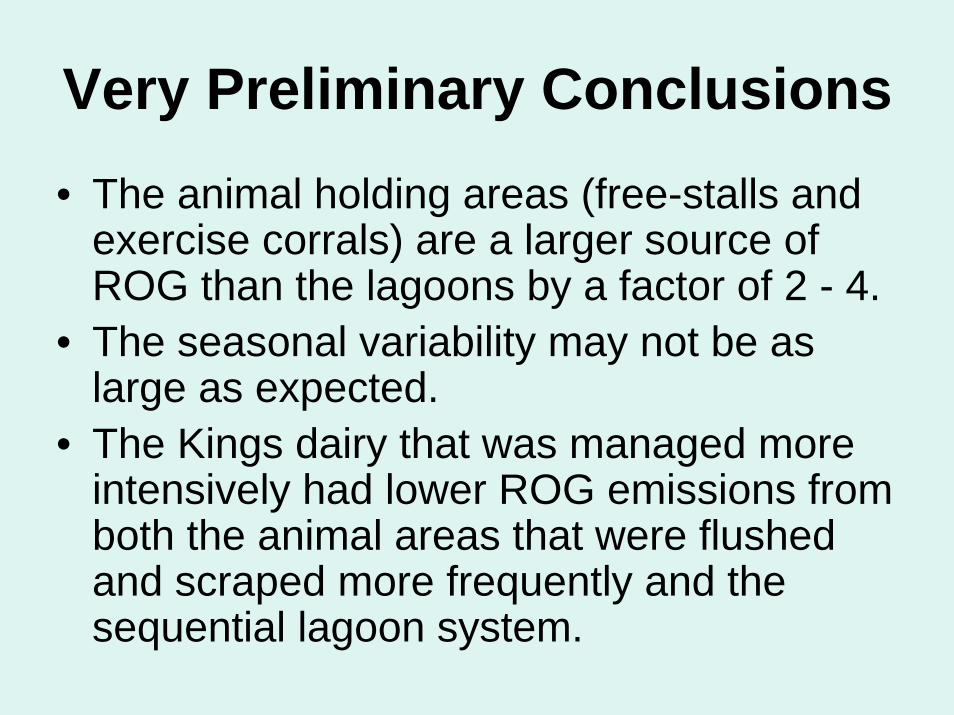
Very Preliminary Conclusions• The animal holding areas (free-stalls and
exercise corrals) are a larger source ofROG than the lagoons by a factor of 2 - 4.
• The seasonal variability may not be aslarge as expected.
• The Kings dairy that was managed moreintensively had lower ROG emissions fromboth the animal areas that were flushedand scraped more frequently and thesequential lagoon system.
Monitoring and Modeling ofROG at California Dairies
Charles Krauter, M. Beene, B. Goodrich and D. GoorahooCenter for Irrigation Technology, Plant Science Dept.College of Agricultural Sciences & TechnologyCalifornia State University, Fresno, CA, [email protected]
QUESTIONS?