Modelling the joint variability of grain size and chemical ...
14
Modelling the joint variability of grain size and chemical composition in sediments M.R. Bloemsma a, ⁎, M. Zabel c , J.B.W. Stuut b, c , R. Tjallingii b , J.A. Collins c , G.J. Weltje a a Delft University of Technology, Faculty of Civil Engineering and Geosciences, Department of Geotechnology, Stevinweg 1, NL-2628CN Delft, The Netherlands b Royal Netherlands Institute of Sea Research (NIOZ), Department of Marine Geology, Landsdiep 4, NL-1797SZ 't Horntje (Texel), The Netherlands c MARUM — Center for Marine Environmental Sciences, University of Bremen, Leobener Strasse, D-28359 Bremen, Germany abstract article info Article history: Received 18 July 2011 Received in revised form 14 March 2012 Accepted 16 April 2012 Available online 26 April 2012 Keywords: Partial least squares Multi-proxy analysis Compositional data analysis Geochemical proxies Singular value decomposition Provenance The geochemical composition of siliciclastic sediments correlates strongly with grain size. Hence, geochem- ical composition may serve as a grain-size proxy. In the absence of grain-size variations, geochemical data of siliciclastic sediments may be used to characterise size-independent processes, i.e., sediment provenance, weathering, mixing, shape/density sorting and diagenesis. In general, however, geochemical data sets contain both types of information. In order to formalise interpretation of geochemical data, we propose a mathemat- ical method to decompose the total geochemical variability of a series of genetically related specimens into a grain-size dependent (the shared signal) and a grain-size independent part (the residual signal). The former may serve as a proxy for grain size whereas the latter represents geochemical variability that would have been observed if all sediments would have had the same grain-size distribution. The two data sets are jointly decomposed by means of Partial Least Squares (PLS) and orthogonal projection. Subsequently, the presence of significant grain-size independent geochemical variability in the residual signal is determined in a statis- tically rigorous manner using a χ 2 -test. Using a synthetic example, we show that the residual record effec- tively reveals an imposed provenance signal which could not have been resolved from the geochemical or grain-size data sets individually. We analysed the relation between grain size and geochemical composition in three Quaternary marine sed- iment cores located offshore West Africa and South America (GeoB7920-2, GeoB9508-5 and GeoB7139-2). Both sites are characterised by biogenic sediment input, in addition to fluvial and aeolian sediment input from the continent. It was found that all cores show a strong, but different correlation between the mean grain size and the bulk geochemical composition. These results demonstrate that geochemical grain-size proxies are empirical and site-specific. It was also found that the geochemical and grain-size data in cores GeoB7920-2 and GeoB7139-2 do not contain unique information, whereas in core GeoB9508-5 Ti varies in- dependently from the grain size. This residual Ti-signal correlates with the transport mechanism, as demon- strated by statistically different values of aeolian and fluvial-dominated sediments. However, a unique interpretation of this residual signal in terms of the postulated grain-size independent mechanisms could not be provided without additional information. We conclude that the proposed model facilitates identification and validation of different element ratios as grain-size proxies and, more importantly, as proxies for size-independent processes. For this reason, the model paves the way for rigorous analysis of multi-proxy data, which are widely used in palaeoceanographic and palaeoclimatic research. © 2012 Elsevier B.V. All rights reserved. 1. Introduction Geochemical analysis is a powerful method of quantifying bulk sediment properties. It may be used to characterise the composition of the parent rock, or the climatic-physiographic conditions under which the sediment was formed (Pettijohn et al., 1987; Johnsson, 1993; Basu, 2003; Weltje and von Eynatten, 2004). Alternatively, it may be used to assess compositional modifications caused by weathering, sorting, mixing and diagenesis (McLennan et al., 1993; Nesbitt and Young, 1996; Amorosi et al., 2002; Dinelli et al., 2007; Pe-Piper et al., 2008). Because geochemical variation typically reflects the superposition of these factors, independent information is often required to resolve them individually. This applies specifically to analysis of clastic sediments, where we can postulate multiple equally plausible hypotheses explaining the observed compositional data. It is well known that grain size and geochemical composition of clastic sediments are highly correlated. The tight connection between grain size and bulk chemistry is a consequence of the processes which govern the generation of sediments from crystalline rocks. Chemical weathering leads to release of unstable elements as solutes, while Sedimentary Geology 280 (2012) 135–148 ⁎ Corresponding author. E-mail address: [email protected] (M.R. Bloemsma). 0037-0738/$ – see front matter © 2012 Elsevier B.V. All rights reserved. doi:10.1016/j.sedgeo.2012.04.009 Contents lists available at SciVerse ScienceDirect Sedimentary Geology journal homepage: www.elsevier.com/locate/sedgeo
Transcript of Modelling the joint variability of grain size and chemical ...
Sedimentary Geology 280 (2012) 135–148
Contents lists available at SciVerse ScienceDirect
Sedimentary Geology
j ourna l homepage: www.e lsev ie r .com/ locate /sedgeo
Modelling the joint variability of grain size and chemical composition in sediments
M.R. Bloemsma a,⁎, M. Zabel c, J.B.W. Stuut b,c, R. Tjallingii b, J.A. Collins c, G.J. Weltje a
a Delft University of Technology, Faculty of Civil Engineering and Geosciences, Department of Geotechnology, Stevinweg 1, NL-2628CN Delft, The Netherlandsb Royal Netherlands Institute of Sea Research (NIOZ), Department of Marine Geology, Landsdiep 4, NL-1797SZ 't Horntje (Texel), The Netherlandsc MARUM — Center for Marine Environmental Sciences, University of Bremen, Leobener Strasse, D-28359 Bremen, Germany
⁎ Corresponding author.E-mail address: [email protected] (M.R. Bloe
0037-0738/$ – see front matter © 2012 Elsevier B.V. Alldoi:10.1016/j.sedgeo.2012.04.009
a b s t r a c t
a r t i c l e i n f oArticle history:Received 18 July 2011Received in revised form 14 March 2012Accepted 16 April 2012Available online 26 April 2012
Keywords:Partial least squaresMulti-proxy analysisCompositional data analysisGeochemical proxiesSingular value decompositionProvenance
The geochemical composition of siliciclastic sediments correlates strongly with grain size. Hence, geochem-ical composition may serve as a grain-size proxy. In the absence of grain-size variations, geochemical dataof siliciclastic sediments may be used to characterise size-independent processes, i.e., sediment provenance,weathering, mixing, shape/density sorting and diagenesis. In general, however, geochemical data sets containboth types of information. In order to formalise interpretation of geochemical data, we propose a mathemat-ical method to decompose the total geochemical variability of a series of genetically related specimens into agrain-size dependent (the shared signal) and a grain-size independent part (the residual signal). The formermay serve as a proxy for grain size whereas the latter represents geochemical variability that would havebeen observed if all sediments would have had the same grain-size distribution. The two data sets are jointlydecomposed by means of Partial Least Squares (PLS) and orthogonal projection. Subsequently, the presenceof significant grain-size independent geochemical variability in the residual signal is determined in a statis-tically rigorous manner using a χ2-test. Using a synthetic example, we show that the residual record effec-tively reveals an imposed provenance signal which could not have been resolved from the geochemical orgrain-size data sets individually.We analysed the relation between grain size and geochemical composition in three Quaternary marine sed-iment cores located offshore West Africa and South America (GeoB7920-2, GeoB9508-5 and GeoB7139-2).Both sites are characterised by biogenic sediment input, in addition to fluvial and aeolian sediment inputfrom the continent. It was found that all cores show a strong, but different correlation between the meangrain size and the bulk geochemical composition. These results demonstrate that geochemical grain-sizeproxies are empirical and site-specific. It was also found that the geochemical and grain-size data in coresGeoB7920-2 and GeoB7139-2 do not contain unique information, whereas in core GeoB9508-5 Ti varies in-dependently from the grain size. This residual Ti-signal correlates with the transport mechanism, as demon-strated by statistically different values of aeolian and fluvial-dominated sediments. However, a uniqueinterpretation of this residual signal in terms of the postulated grain-size independent mechanisms couldnot be provided without additional information.We conclude that the proposed model facilitates identification and validation of different element ratios asgrain-size proxies and, more importantly, as proxies for size-independent processes. For this reason, themodel paves the way for rigorous analysis of multi-proxy data, which are widely used in palaeoceanographicand palaeoclimatic research.
© 2012 Elsevier B.V. All rights reserved.
1. Introduction
Geochemical analysis is a powerful method of quantifying bulksediment properties. It may be used to characterise the compositionof the parent rock, or the climatic-physiographic conditions underwhich the sediment was formed (Pettijohn et al., 1987; Johnsson,1993; Basu, 2003; Weltje and von Eynatten, 2004). Alternatively, itmay be used to assess compositional modifications caused by
msma).
rights reserved.
weathering, sorting, mixing and diagenesis (McLennan et al., 1993;Nesbitt and Young, 1996; Amorosi et al., 2002; Dinelli et al., 2007;Pe-Piper et al., 2008). Because geochemical variation typically reflectsthe superposition of these factors, independent information is oftenrequired to resolve them individually. This applies specifically toanalysis of clastic sediments, where we can postulate multiple equallyplausible hypotheses explaining the observed compositional data.
It is well known that grain size and geochemical composition ofclastic sediments are highly correlated. The tight connection betweengrain size and bulk chemistry is a consequence of the processes whichgovern the generation of sediments from crystalline rocks. Chemicalweathering leads to release of unstable elements as solutes, while

136 M.R. Bloemsma et al. / Sedimentary Geology 280 (2012) 135–148
stable elements such as Al remain in the solid phase (e.g., Nesbitt andYoung, 1984). Consider for instance chemical weathering of K-feldspar:
2KAlSi3O8 þ 3H2O→Al2 Si2O5ð Þ OHð Þ4 þ 4SiO2 þ 2K OHð ÞK‐feldspar þwater→kaolinite þ silica þ solutes
Since kaolinite particles are relatively fine grained, whereas the K-feldspar grains are of sand size, chemical alteration is accompanied bytextural modification of the sediment. If the K-feldspar and kaoliniteare transported away from their source area and deposited in a sedi-mentary basin, the resulting product is a sediment with a spatiallyvariable grain-size distribution. If we sample this material at differentlocalities, we expect Si/Al of the bulk sediment to correlate positivelywith mean grain size. Quite often, the objective of geochemical anal-ysis is not to approximate grain size, but to provide a unique compo-sitional fingerprint of the sediment for the purpose of paleoclimate orprovenance reconstruction. In such cases, we would like to eliminatethe size-dependency from our data.
A method to eliminate variation of bulk grain-size distribution fromsediment geochemical analysis is to analyse a narrow size fraction(Weltje and Brommer, 2011). In the above example, the compositionof a narrow size fraction would be constant across the basin. However,reality is generally more complicated. If we assume that the extent ofweathering in the source area of the sediment has varied over time,we expect that the composition of a narrow size fraction extractedfrom samples taken at different stratigraphic levels records this varia-tion. For example, the Si/Al ratio within the sand fraction will correlatepositively with the extent of weathering, whereas the Si/Al ratio of theclay fractionwill correlate negativelywith the extent of weathering. Be-cause separation of samples into narrow size fractions is time consum-ing and expensive, we should try to find more practical ways ofeliminating the grain-size bias from geochemical data.
In marine geosciences it is commonplace to use a so-called multi-proxy approach to infer paleo-climatological signals. In this approach,high-resolution records of physical and chemical properties, for ex-ample grain-size distribution and bulk chemical composition, aremeasured on the same sediment core. Subsequently, these data aredisplayed side by side to highlight consistency between two datasets, or to illustrate patterns of variability unique to each data set. Awidely accepted method to select the relevant signals (i.e., the rele-vant element ratios and/or grain-size parameters) from multivariatedata sets is not yet in place, and the same applies to generic proce-dures to examine the internal consistency of selected proxies. Inthis contribution, we propose a fully quantitative and formal methodfor simultaneous analysis of multiple data sets. Our analysis of the re-lation between the geochemical composition and grain-size distribu-tion of sediment will serve to illustrate the implications of theproposed statistical framework for multi-proxy analysis.
2. Material and methods
2.1. Materials
We use three marine soft-sediment cores from the margin off WestAfrican and Chile to investigate geochemical variationwith grain size inlithogenic sediments. These cores are well suited for testing this varia-tion since both West Africa and Chile receive a considerable amountof sediment from the continent, transported by wind and rivers (e.g.,Sarnthein et al., 1981; Stuut et al., 2007). In addition, both areas arecharacterised by strong year-round upwelling, resulting in a consider-able biogenic sediment input (Haslett and Smart, 2006; De Pol-Holzet al., 2007).
Cores GeoB9508-5 and GeoB7920-2 were retrieved from the con-tinental margin off West Africa, and core GeoB7139-2 was retrievedfrom the margin off Chile (Fig. 1). Core GeoB9508-5 (15 °30N/17 °57W, 2384 m water depth) is approximately 9.5 m long and
was obtained during RV Meteor cruise M65/1 (Mulitza and cruiseparticipants, 2006). Core GeoB7920-2 (20 °45N/18 °35W 2278 mwater depth) is approximately 16 m long and was retrieved duringRV Meteor cruise M53/1 (Meggers and cruise participants, 2002).The Chilean core GeoB7139-2 (30 ∘12S/71 ∘59W) was retrieved dur-ing the PUCK expedition on RV Sonne in 2001 (Hebbeln and cruiseparticipants, 2001) and is approximately 8 m long. In all three cores,the sedimentswere datedusing stable oxygen isotopes and radiocarbondates, which show that they date back to 57 kyr BP (GeoB9508-5;Mulitza et al., 2008), 118 kyr BP (GeoB7920-2; Tjallingii et al., 2008)and 65 kyr BP (GeoB7139-2; De Pol-Holz et al., 2007).
Marine sediment cores have served as a valuable source of informa-tion to infer Late Quaternary variations in paleoclimatic conditions inboth South America (e.g., Lamy et al., 1998) and West Africa (e.g.,Tjallingii et al., 2008). Climatic conditions have been inferred fromgrain-size records (e.g., Holz et al., 2004; Stuut and Lamy, 2004;Tjallingii et al., 2008) and from geochemical records (e.g., Haslett andDavies, 2006; Mulitza et al., 2008), in addition to various combinationsof sediment properties (e.g., Kaiser et al., 2008; Romero et al., 2008).
InWest Africa, present-day samples from fluvial and aeolian sourcesshow that aeolian dust is relatively coarse grained, compared to fluvialsediment (Gac and Kane, 1986; Stuut et al., 2005). Grain-size variationsin the lithogenic fraction ofmarine cores are therefore considered to re-flect the transporting mechanism (Sarnthein, 1978; Koopmann, 1981;Holz et al., 2004; Stuut et al., 2007). Proximal to the source, sedimentwith a grain size below 6 μm is typically assumed to be of fluvial origin,whereas sediment coarser than 6 μm is assumed to be transported bywind (Koopmann, 1981; Lamy et al., 1998; Holz et al., 2004). Neverthe-less, if transport distances are relatively long, the typically large grainsize of the aeolian dust may be reduced by proximal to distal fining(e.g., Weltje and Prins, 2003; Stuut et al., 2005). The same information(i.e., transporting medium, its energy and transport distance) may becontained in geochemical signals; Boyle (1983) postulated Al/Ti as a ge-neric grain-size proxy because it is controlled by the concentration ofheavy minerals transported along with the coarse fraction. For this rea-son, downcore variations in Al/Ti were considered a proxy for aridityand/or wind strength (Yarincik et al., 2000).
Besides the shared information, geochemical records are consid-ered to contain additional information regarding source area charac-teristics. Sediment that is derived from chemically weatheredterrain typically has high Al and Fe concentrations (Moreno et al.,2006; Mulitza et al., 2008), which may therefore serve as a proxyfor humidity (Sarnthein, 1978; deMenocal et al., 1993). Schneideret al. (1997) interpreted elevated Al/K towards the tropics as beinginduced by enrichment in kaolinite relative to K-feldspar as a resultof increased chemical weathering intensity. Yarincik et al. (2000)used the same ratio as a proxy for the amount of illite relative to ka-olinite which is also considered to be controlled by the intensity ofchemical weathering. Compared to West Africa, the effect of chemicaland physical weathering on the geochemical composition of sedi-ments from the continent is low, due to short transport distancesand arid climate conditions (Lamy et al., 2000). Because this impliesthat the sediments retain their initial composition, geochemical re-cords from this area may serve as a tracer for parent rock lithology(Lamy et al., 1998; Klump et al., 2000; Lamy et al., 2000).
2.2. Analytical methods
Samples for grain-size analysis were acquired every 5 cm for coresGeoB9508-5 (n=191) and GeoB7920-2 (n=330), and every 2 cm incore GeoB7139-2 (n=389). The siliciclastic sediment fraction was iso-lated by dissolving carbonate, organic matter and biogenic opal in HCl,H2O2 and NaOH, respectively. The samples were heated with about300 mg of Na4P2O7·10H2O directly before measuring to avoid the for-mation of aggregates in the fine-grained fraction. The grain-size distri-bution was determined with a Coulter LS200 laser particle sizer,

GeoB7139-2
GeoB7920
GeoB9508-5
BA
Fig. 1. Location of the cores used in this study. Core GeoB7139-2 was retrieved off the Chilean coast (inset A), whereas cores GeoB9508-5 and GeoB7920-2 were retrieved off theWest-African coast (inset B). The insets are derived from the ETOPO1 topographical map (Amante and Eakins, 2008).
137M.R. Bloemsma et al. / Sedimentary Geology 280 (2012) 135–148
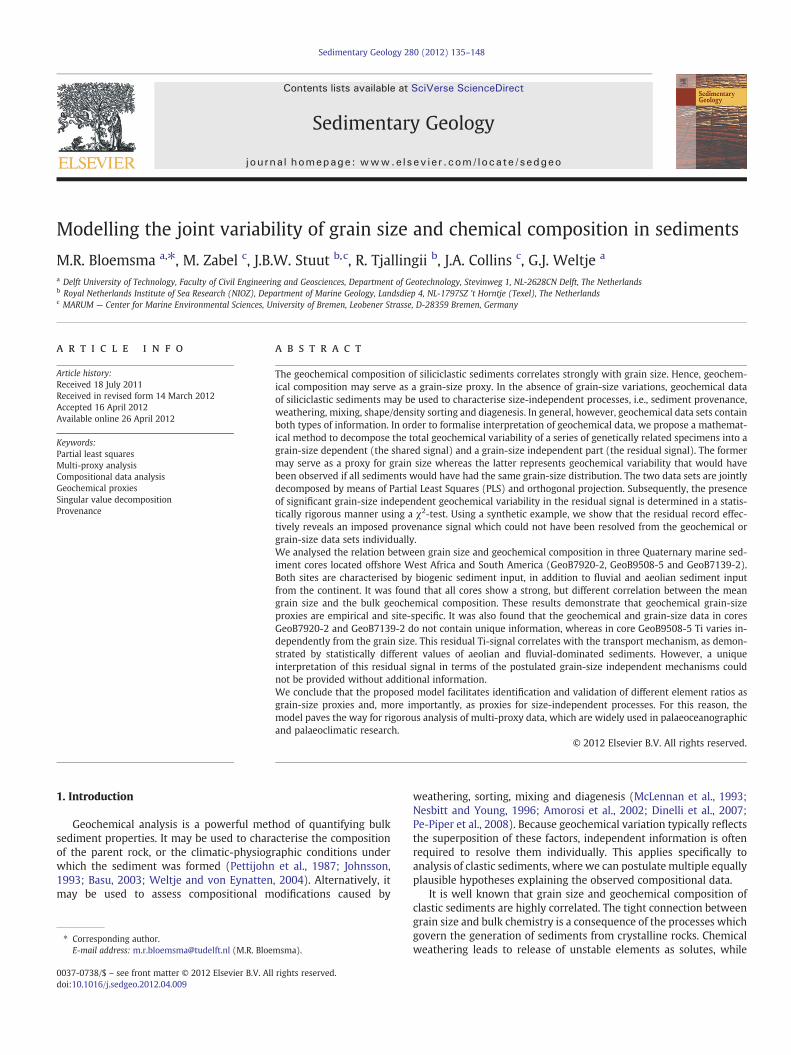
which detects grains in the range from 0.4 to 2000 μm (i.e., between 11and -1 phi-units) (Fig. 2).
All cores have been scanned with an Avaatech core scanner (e.g.,Richter et al., 2006) at a 2 cm resolution, a source current of 10 kV andameasurement time of 30 s. Themeasured XRF spectra were convertedto a record of net element intensities using the WinAxil software pack-age (Vekemans et al., 1994). In order to be able to convert the elementintensities to concentrations, quantitative geochemical analysis ofpowdered sediment samples was carried out with a portable SpectroXepos Analyzer (Wien et al., 2005). For core GeoB9508-05, 229 sampleswere geochemically analysed, whereas the geochemical reference datasets of GeoB7920-2 and GeoB7139-2 comprise 168 and 20 samples,respectively.
2.3. Data pre-processing
Quantitative calibration of the XRF core scanning records was per-formed using the log-ratio calibration equation (LRCE) (Weltje andTjallingii, 2008). The predictive power of each alternative calibrationmodel (i.e., linearmodels with a certain denominator element) is empir-ically quantified by the taking the median of the squared discrepanciesbetween the predicted and the reference geochemical composition. Wecalculate these discrepancies using leave-one-out cross-validation(LOOCV) (Geisser, 1993). As a result, they account for all factors influenc-ing the deviation between XRF core scanning records and destructiveanalysis (e.g., difference in analysed sample volume). A detailed descrip-tion of these factors is provided by Tjallingii et al. (2007).
Based on the Aitchison distance between predicted and referencecomposition, we select the optimal denominator element for each core,which are Si (GeoB7139-2), Al (GeoB7920-2) and Fe (GeoB9508-5). Forthese calibration models, the LOOCV median squared discrepancies ofthe different log-ratios are shown in the upper diagonal of Table 1. Thelower diagonal shows half of the width of 95% confidence limits, whichare directly derived from the variances in the upper diagonal (seeWeltje and Tjallingii, 2008).
To analyse the relation between grain size and geochemical compo-sition, we use samples of which both grain size and geochemical com-position were measured. Because the resolution of the grain size
analysis is different from that of the core scan, a subset of the grain-size and bulk geochemical data meets these requirements, namely 185(GeoB7139-2), 163 (GeoB7920-2) and 92 (GeoB9508-5) samples.
In order to make application of log-ratio analysis to the grain sizedata possible, we removed the zero-valued channels. In this study, allchannels of the grain-size distribution which contain a zero in any ofthe observations are amalgamated with an adjacent channel that con-tains only positive values. Generally this leaves more than 80% of thechannels unchanged. Given the high level of redundancy in grain-sizedata (Weltje and Prins, 2003), we consider this step as having a negligi-ble effect on the information content of the data.
3. Modelling approach
3.1. Conceptual model
From a theoretical perspective, the information provided by tex-tural and geochemical data may be subdivided into (1) informationshared by the two records, (2) information unique to the geochemicalrecord, and (3) information unique to the grain-size record. The par-titioning of the geochemical and grain-size variability into these threeindependent components is illustrated in Fig. 3A. The significance ofeach of these three parts will be discussed below.
If a series of sediment samples has been derived from a singlesource area in which the extent of chemical weathering did not varysignificantly over time, most variation in bulk chemical compositionmay be attributed to fractionation during entrainment, transport,and deposition. Hence, if it were possible to apply a “grain-size correc-tion” to the bulk chemical composition of this hypothetical data set, theresidual geochemical composition would not show any significantdowncore variation. Such a one-to-one correspondence betweengrain-size and geochemistry implies that the geochemical record carriesno unique information and the bulk chemical composition can be accu-rately predicted from the grain-size distribution and vice versa.
In reality this one-to-one correspondence between compositionand grain size will be an exception, and a single grain-size distribu-tion may correspond to different geochemical signatures. Various
138 M.R. Bloemsma et al. / Sedimentary Geology 280 (2012) 135–148
mechanisms for generating size-independent geochemical variabilitymay be envisaged (see Fig. 3):
1. Chemical weathering: if the degree of chemical weathering variesover time at a single locality, the residual Si/Al ratio will correlatepositively with the extent of weathering. Similar trends will bepresent in other element ratios (Calvert and Pederson, 2007;Xiong et al., 2010).
2. Hydraulic/aerodynamic sorting: sediment-forming minerals in thesilt to sand fraction span a wide range of densities (from 2.6 toabout 5.0 g/cm3) and shapes (spherical to platy). Mineral grainswhich are susceptible to size-independent fractionation (i.e., de-pletion and enrichment not mirrored in the bulk grain-size distri-bution) must have a combination of density and shape whichdeviates strongly from the bulk, and be present in small propor-tions. Chemical elements which exclusively reside in suchminerals(e.g., Ti and Zr) are therefore excellent tracers of fractionation.
3. Mixing: if different source areas shed sediments with distinct geo-chemical signatures within a given grain-size range, the residualgeochemical signal represents the variation of mixing coefficientsof these compositionally distinct sediment types.
B
A
C
2 4 6 8 10 120
0.02
0.04
0.06
0.08
Grain size [φ]
Pro
port
ion
[−]
2 4 6 8 10 120
0.02
0.04
0.06
0.08
2 4 6 8 10 120
0.02
0.04
0.06
0.08
Grain size [φ]
Pro
port
ion
[−]
Pro
port
ion
[−]
Grain size [φ]
Fig. 2. Grain size distributions of samples from cores GeoB7139-2 (A), GeoB7920-2 (B)and GeoB9508-5 (C).
4. Diagenesis: if the degree of diagenetic modification varies across aseries of samples with similar grain-size distributions, a size-independent signal will be generated. Examples include dissolutionand precipitation at different stratigraphic levels within a core.
For the sake of completeness, one should also consider occurrenceof grain-size variations which do not correspond to geochemicalvariability (Fig. 3), which might be the case if rocks have been me-chanically ground by glaciers, or mechanically weathered by wind-action. However, even under glacial or extremely arid conditions,geochemical variability was found to be accompanied by grain-sizevariations (Nesbitt and Young, 1996; Solano-Acosta and Dutta,2005). We therefore consider this a theoretical possibility ratherthan something which merits further investigation.
3.2. Statistical model
If we can remove the shared variability from grain size and geochem-ical data (the gray part in Fig. 3A), the residual recordmay reveal patternswhich cannot be distinguished in the original record. We propose a ge-neric approach to achieve this, based on the assumption that amonotonicrelation exists between grain size and geochemical composition. Grain-size distributions and geochemical compositions are both compositionalin nature (values are non-negative by definition, and the sum over allgrain size classes, or all chemical constituents, should equal unity),which requires that we model them as log-ratios (Aitchison, 1986).More specifically, we use a centred log-ratio (clr) transformation sothat classical multivariate methods can be used to explore their relation.
Linear models of log-ratio transformed variables (i.e., log-ratio linearmodels) are compatible with trends of compositional variability of sedi-ments induced by variation in weathering conditions and grain size(e.g., von Eynatten et al., 2003; Tolosana-Delgado and von Eynatten,2008). Exceptions to this compatibility were raised by Tolosana-Delgadoand von Eynatten (2010)who foundnonlinearity in the ‘intrinsic’ relationbetween chemistry and composition, derived from chemical analyses ofnarrow size fractions. However, since we focus only on the relation be-tweenbulk grain size andbulk chemistry,which is typicallymore smooth,we consider the log-ratio linear suitable to model their relation.
A graphical illustration of the model we introduce in this contribu-tion is shown in Fig. 3B. The model establishes two bases (coordinatesystems) which maximise the joint variability of grain size and geo-chemical composition. We derive these bases using Partial LeastSquares (PLS) (e.g., see Martens and Naes, 1989). By projecting bothdatasets onto their basis vectors, we obtain the scores on each vector.
Table 1The upper diagonal shows the median variances between the observed geochemistryand the geochemistry predicted on the basis of the XRF core scan. The lower diagonalshows the 95% confidence limits corresponding to these residual variances.
Al Fe K Si Ti
GeoB7139-2Al – 0.0020 0.0003 0.0014 0.0019Fe 0.0784 – 0.0032 0.0008 0.0035K 0.0322 0.0995 – 0.0016 1.7470Si 0.0660 0.0504 0.0695 – 0.0012Ti 0.0759 0.1039 2.3280 0.0621 –
GeoB7920-2Al – 0.0024 0.0039 0.0072 0.0039Fe 0.0792 – 0.0068 0.0157 0.0056K 0.1030 0.1319 – 0.0049 0.0041Si 0.1383 0.2034 0.1139 – 0.0154Ti 0.1025 0.1211 0.1049 0.1990 –
GeoB9508-5Al – 0.0046 0.0032 0.0015 0.0021Fe 0.1119 – 0.0033 0.0056 0.0033K 0.0930 0.0954 – 0.0019 0.0032Si 0.0642 0.1239 0.0716 – 0.0055Ti 0.0750 0.0949 0.0931 0.1223 –

Grain size variability (X) Geochemical variability (Y)
X\Y Y\XX Y
0 1 2 3 4
1
3
5
7
X1
X2
0 1 2 3 4 5
0
2
4
6
4
Y2
Y1
Grain size (X1, X2) Geochemistry (Y1, Y2)
A
B
Fig. 3. In A, we illustrate geochemical and grain-size variabilities in the form of a Venn-diagram. The variability shared by both data sets is indicated by X∩Y, which is highlighted ingray. In contrast to this shared component, the variability unique to the geochemical data is the portion that potentially holds relevant signals (e.g., provenance). The unique geo-chemical variability is indicated by Y \X, representing the residual geochemical variability. As shown in B, the shared signals are derived by an orthogonal projection of each data seton a set of basis vectors. The direction of these basis vectors is such that they jointly maximise the common covariance in the two data sets. The residual signal may then be obtainedby subtracting the shared signals from their corresponding raw data set.
139M.R. Bloemsma et al. / Sedimentary Geology 280 (2012) 135–148
If the scores of the grain-size and geochemical data on the k-th basisvector correlate significantly, we project both data sets on theircorresponding bases to obtain their shared signals. Subsequently, thevariability unique to each data set (i.e., the residual signal) is derivedby subtracting the shared signals from their corresponding rawdata set.
The number of orthogonal components that are removed is a hyper-parameter, andmay take on any value between zero (the rawgeochem-ical, and grain-size data) andN−1, withN being theminimumnumberof variables (either grain-size classes or chemical elements). For everyorder k, a χ2-test is used to decide whether the residual variance of alog-ratio of elements X and Y (i.e., log(X/Y)) deviates significantlyfrom the error variance of the corresponding geochemical signal.More detailed information about the mathematical model may befound in the Appendix.
4. Synthetic examples
To illustrate the working principle of the model, we will discusstwo synthetic examples. These examples reflect limiting cases; onedataset (dataset 1) reflects the case where compositional variabilityis only induced by grain size variations, whereas the other dataset
(dataset 2) reflects the case where compositional variability is in-duced by both grain-size variations and provenance.
4.1. Synthetic example 1
The first step in acquiring a synthetic dataset is stochastic simulationof grain-size distributions. These distributions are constructed to belognormal, with a random mean and a standard deviation that isproportional to the mean. We impose a standard deviation of fine-grained sedimentswhich is larger than that of coarse-grained sediments.The fact that these two parameters are perfectly correlated implies thatthe rank of the grain-size data is one. In order to simulate bulk chemicalcomposition, we postulate a log-ratio linear relation between composi-tion and grain size (see Fig. 4A). This relation must be transformedback into proportions using the inverse clr-transformation in order toobtain the function which depicts element concentrations as a functionof grain size (see Fig. 4B). The bulk chemical composition is thenobtained by multiplying this function with the grain size distribution.This provides a unique bulk geochemical composition for any givengrain size distribution. As a final step, these bulk chemical compositionsare clr-transformed and noise is added.

140 M.R. Bloemsma et al. / Sedimentary Geology 280 (2012) 135–148
Fig. 5A shows the simulated grain-size record, whereas Fig. 5Bshows the final bulk geochemical record, expressed in proportions.The residual grain-size and geochemical signals are shown in Fig. 5 (Cand D). Since the rank of the grain-size data is one, and the geochem-istry is directly inferred from the grain size, the shared signal carriedby the first vectors in both solution spaces explains all systematic var-iation. As a consequence, Fig. 5D reflects only the superimposed noise,centred around the mean bulk chemical composition. We derive thedominant signal in the residual and the shared geochemical signalusing Principal Component Analysis (PCA). The Principal Components(PCs) are obtained by means of a Singular Value Decomposition(SVD) (Press et al., 1994). Figs. 5E and 5F show the scores on PC1 ofthe shared and the residual signal, respectively. Gray bars represent95% confidence limits derived from the imposed noise. Note that inthe PC1 scores of the residual geochemical signal, the proportion ofobservations plotting outside of these limits is around 5%, whichleads to the conclusion that there is no significant geochemicalvariability. The scores of the shared geochemical signal, on the otherhand, show significantly more exceedences, indicating a strongcorrelation between the shared geochemical signal and the grain size.
Although the individual records of grain size and bulk chemistry(Fig. 5, A and B) display variation which may be difficult to interpret,the model returns that they contain the same information, i.e., thecommon size-composition trend. Using the model, this commontrend was successfully eliminated from the data without any priorknowledge.
A
C
B
D
0 5 10−6
−4
−2
0
2
4
Grain size [φ]
clr−
com
posi
tion
AlCaFeKMgSiSrTi
0 5 10−6
−4
−2
0
2
4
Grain size [φ]
clr−
com
posi
tion
AlCaFeKMgSiSrTi
Fig. 4. In the synthetic example, the fingerprints of source 1 and source 2 are parameterisedratio linear functions can be transformed back to proportions by means of the inverse clr-t
4.2. Synthetic example 2
In the second example, we increased the complexity of the simulat-ed data by imposing random mixing of two distinct sediment sources.The size-composition function of the additional source is shown inFig. 4 (C and D). The grain size distributions were simulated accordingto the procedure outlined in example 1, and therefore contain no infor-mation about provenance (Fig. 6B). A real-world analog of this exampleis a river with two tributaries, draining different parent-rock types. Weassume that the proportional contribution of the tributaries have variedover time and we repeatedly sampled the river-mouth sediments. Thegrain-size distributions of these sediments reflect the hydrodynamicconditions under which the sediments have been transported, andthus contain no information regarding provenance.
As shown in Figure 6B, dataset 2 exhibits a geochemical recordwhich does not appear to be very different from that of dataset 1.This is not surprising because the size-composition functions of thetwo sources are very similar (see Fig. 4). As a result, differences in-duced by variations in the source are overshadowed by variability in-duced by grain size variations. In contrast to example 1, the residualgeochemical record suggests significant variability independentfrom the grain size (Fig. 6D). This is confirmed by the scores on PC1of the residual geochemical record, which exceed the 95% confidenceinterval of the superimposed noise. Without knowing the underlyingstructure, we would therefore conclude that there is evidence forgrain-size independent geochemical variability.
0 5 100
0.2
0.4
0.6
0.8
1
Grain size [φ]
Fra
ctio
n of
bul
k [−
]
AlCaFeKMgSiSrTi
0 5 100
0.2
0.4
0.6
0.8
1
Grain size [φ]
Fra
ctio
n of
bul
k [−
]
AlCaFeKMgSiSrTi
by a log-ratio linear function between grain size and composition (A and C). These log-ransformation (B and D).

A B C D E F
gs [φ]0 5 10
0
1
2
3
4
5
6
7
8
9
10
0
1
2
3
4
5
6
7
8
9
10
0
1
2
3
4
5
6
7
8
9
10
0
1
2
3
4
5
6
7
8
9
10
0
1
2
3
4
5
6
7
8
9
10
0
1
2
3
4
5
6
7
8
9
100 0.5 1
Proportion [−]0 0.5 1
Proportion [−]
AlCaFeKMgSiSrTi
gs [φ]0 5 10 −0.1 0 0.1
Score [−]−2 0 2
Score [−]
Fig. 5. This figure shows synthetic dataset 1 (n=250), reflecting one provenance. Plots A and B show the grain size distributions and geochemical record, respectively. The residualgrain size and geochemical signals are shown in C and D, respectively. The first principal component scores of the shared geochemical signal is shown in E, whereas plot F shows thefirst principal component scores of the residual geochemical signal. In Fig. 6E and 6F, a gray bar represents a 95% confidence interva,l derived from the imposed noise. Note thatapproximately 5% of the residual PC1 scores (F) are located outside the 95% confidence interval.
141M.R. Bloemsma et al. / Sedimentary Geology 280 (2012) 135–148
If our aim is to infer either grain size or provenance from the rawgeochemical data, a straightforward approach is to analyse thescores on PC1 (i.e., the main direction of variance). Fig. 7A showsthe relation between these scores and the mean grain size, whereasFig. 7B shows the relation between these scores and the provenance(i.e., the contribution from source 1). In both cases there is a weakcorrelation.
Instead of using the rawdata,wemay also use themodel outcome toderive proxies for both grain size and provenance; PC1 scores of theshared geochemical record represent the grain-size proxy, whereasthe residual geochemical record may serve as a provenance proxy. Therelation between the grain-size proxy, and the grain size and (known)source contributions, respectively, are shown in Fig. 7 (C and D). Fig. 7Cdemonstrates that the grain-size proxy correlates strongly with themean grain size and does not contain any provenance information. Theprovenanceproxy (Fig. 7, E and F), on the other hand, varies independent-ly from the mean grain size, but records the known changes in prove-nance perfectly.
5. Results
We applied the model to the data sets corresponding to the threeQuaternary marine sediment cores. However, before studying themodel outcome, we analyse the correlation structure between com-position and the mean grain size in each of the three cores (see Fig.8). The steepness of the fitted log-ratio linear models of coresGeoB7920-2 and GeoB9508-5 in particular, demonstrate that the geo-chemical composition strongly depends on the mean grain size. Basedon these plots, we also conclude that our data shows no systematic
departures from the compositional linear trend, which justifies theuse of a log-ratio linear approach.
Fig. 8D shows Pearson's correlation coefficients between the differ-ent log-ratio-transformed chemical elements and the mean grain size.In addition, the correlation coefficients between the mean grain sizeand the PC1 scores, derived from the raw geochemical data, areshown. In core GeoB9508-5, the high correlation coefficient (>0.9) be-tween these PC1 scores and themean grain size demonstrates the largeportion of redundancy between geochemistry and grain size. In coreGeoB7139-2, on the other hand, the correlation coefficient of 0.15shows that grain-size control on the geochemical variability is low;only Ti shows a fairly strong (negative) correlation with the meangrain size. It should be noted, though, that the total geochemical vari-ance in this core is also very low.
After applying the proposed model to the three cores, significancetests on the residual records (α=5%) allows us to identify additivelog-ratio pairs which show significant residual variability (see Table 2).The residual signals having the highest signal-to-noise ratio are shownin Figs. 9 and 10. In contrast to the synthetic example, the residuals areplotted without their mean added, so they simply reflect the differencebetween modeled and observed signals. An exception is made fork=0; since these patterns are by definition only a centred version ofthe input data, we show the raw data instead.
The downcore plots demonstrate that the variance of the residuals islargely controlled by the number of removed components (the order ofthe residuals). In addition, the cores show a marked difference, in thesense that the third-order residual geochemical signal strength rangesfrom weak (GeoB7920), to strong (GeoB9508-5). Note that the limitednumber of chemical elements (D=5) used in our study limits themax-imum number of removed shared signals to four.

A B C D E F
gs [φ]0 5 10
0
1
2
3
4
5
6
7
8
9
10
0
1
2
3
4
5
6
7
8
9
10
0
1
2
3
4
5
6
7
8
9
10
0
1
2
3
4
5
6
7
8
9
10
0
1
2
3
4
5
6
7
8
9
10
0
1
2
3
4
5
6
7
8
9
100 0.5 1
Proportion [−]0 0.5 1
Proportion [−]
AlCaFeKMgSiSrTi
gs [φ]0 5 10 −2 0 2
Score [−]−2 0 2
Score [−]
Fig. 6. This figure shows the data and model outcome of synthetic dataset 2 (n=250), which is constructed by random mixing of two different provenances. Figure 6 A shows thegrain-size distributions and Fig. 6B shows the geochemical record. The residual grain size and geochemical record are shown in C and D, respectively. The first principal componentof the shared geochemical signal is shown in E, whereas plot F shows the first principal component scores of the residual geochemical signal. In both E and F, a gray bar represents a95% confidence interval derived from the imposed noise. Note that the residual PC1 scores (F) exceed the 95% confidence interval at almost every stratigraphic level.
142 M.R. Bloemsma et al. / Sedimentary Geology 280 (2012) 135–148
6. Discussion
6.1. Correlation between composition and grain size
The correlation coefficients in Fig. 8D show that in coresGeoB7920-2 and GeoB9508-5, Al and Fe correlate positively with themean grain size whereas Si correlates negatively with the meangrain size. These trends are in line with typical chemical weatheringtrends, leading to relative enrichment of clay-minerals (reflected byAl and Fe) in the fine fraction, and enrichment of quartz (reflectedby Si) in the coarse fraction. In core GeoB7139-2 the correlation struc-ture is different, in the sense that Si shows a weak, but positive corre-lation with the mean grain size. Moreover, Ti is the only elementclosely linked to grain size, reflected by the highly negative correlationwith the mean grain size in phi-units.
The weak grain-size control on the geochemical composition in thiscore may be due to continental climate conditions. Core GeoB7139-2 issituated close to the Atacama desert, which is characterised by extremearidity (Stuut and Lamy, 2004; Kaiser et al., 2008). The absence of chem-ical weathering under arid conditions implies that the size-compositiontrend primarily reflects mechanical weathering, whose impact on thesize-composition trend is apparently small. The weak, but positivecorrelation between Si and the mean grain size may be attributable toadditional input of biogenic silica, which obviously disturbs the initialsize-composition trend of the terrestrially derived sediments.
Based on these results, we may select a proxy for grain size bychoosing a ratio of an element showing a high correlation coefficient,and an element showing a very low (i.e., negative) correlation coeffi-cient with the mean grain size. This yields Al/Ti (GeoB7139-2), Ti/Si(GeoB7920-2) and Fe/Si (GeoB9508-5). Differences among these
proxies illustrate the empirical nature of grain-size proxies, andother geochemically-based proxies in general.
6.2. Residuals analysis
In order to evaluate themodeling results in a statistically correctman-ner,we analyse only the residual log-ratios forwhich the significance testyields a p-value smaller thanα (=5%). (see Table 2). The test yields that,depending on the order, the cores reflect residual patterns of Ti(GeoB9508-5), K (GeoB7920) and Al/K (GeoB7139-2). Whereas in thesynthetic example, the number of dimensions of the grain-size datawas exactly known, in reality this is certainly not the case. It is obviousthat the more shared signals we remove from the data, the smaller thevariance of the residual records. The limitations of our data are reachedat D−1, which equals four in these data set (we measured only five ele-ments). At this point, there is still some residual grain-size variability.
Following the principle of parsimony, we should stop subtractingsignals when the shared grain size variability is within acceptable limitsof the measured grain variability, or when the k-th order shared grainsize signal does not correlate with the k-th order shared geochemicalsignal. This means that quantitative control on the model outcomedoes not only require uncertainties of the geochemical data, but alsoof the grain size data. Unfortunately, we can only infer the uncertaintiesassociated with the geochemical data, meaning that we are not able toidentify the ‘true’ order of the residuals. However, we can interpretthe results for the different cores relative to each other.
The downcore records in Figs. 9 and 10 suggest that from these threecores, GeoB9508-5 contains the strongest residual signals. The same isreflected by the large number of log-ratios that are identified as signif-icant (Table 2). We also observe that within one model order, Al/Ti,

BA
DC
FE
0 20
2
4
6
8
10
PC1 score (raw geochem.)
Mea
n gr
ain
size
[φ]
0 2 40
0.2
0.4
0.6
0.8
1
2
4
6
8
10
PC1 score (shared geochem.)
Mea
n gr
ain
size
[φ]
0 1 20
0.2
0.4
0.6
0.8
1
0 1 2
0 1 2
0
2
4
6
8
10
Mea
n gr
ain
size
[φ]
0 1 20
0.2
0.4
0.6
0.8
1
PC1 score (residual geochem.)
PC1 score (raw geochem.)
PC1 score (shared geochem.)
PC1 score (residual geochem.)
Fig. 7. Crossplots in plots A and B show the PC1 scores of the raw geochemical data against the mean grain size, and the contribution from source 1, respectively. Note that the rawPC1 scores correlate poorly with both provenance and grain size. Plot C, on the other hand, shows that the correlation between the shared geochemical signal scores and the meangrain size is strong. Similarly, plot F shows that residual scores correlate strongly with the contribution from source 1.
143M.R. Bloemsma et al. / Sedimentary Geology 280 (2012) 135–148
Fe/Ti and Si/Ti are highly correlated. This suggests that the residual var-iability is attributable to changes in Ti, rather than the other elements.Apparently, sediments with a constant grain-size distribution have dif-ferent Ti-concentrations. This result is supported by analyses of present-day dust samples collected off northwest Africa; dust samples with thesame mean grain size showed different Al/Ti values (Log(Al/Ti)∼ [2.65,2.9]; Stuut et al., 2005). Moreover, the variability of these Al/Tivalues is in the same range as the residuals observed in this study.
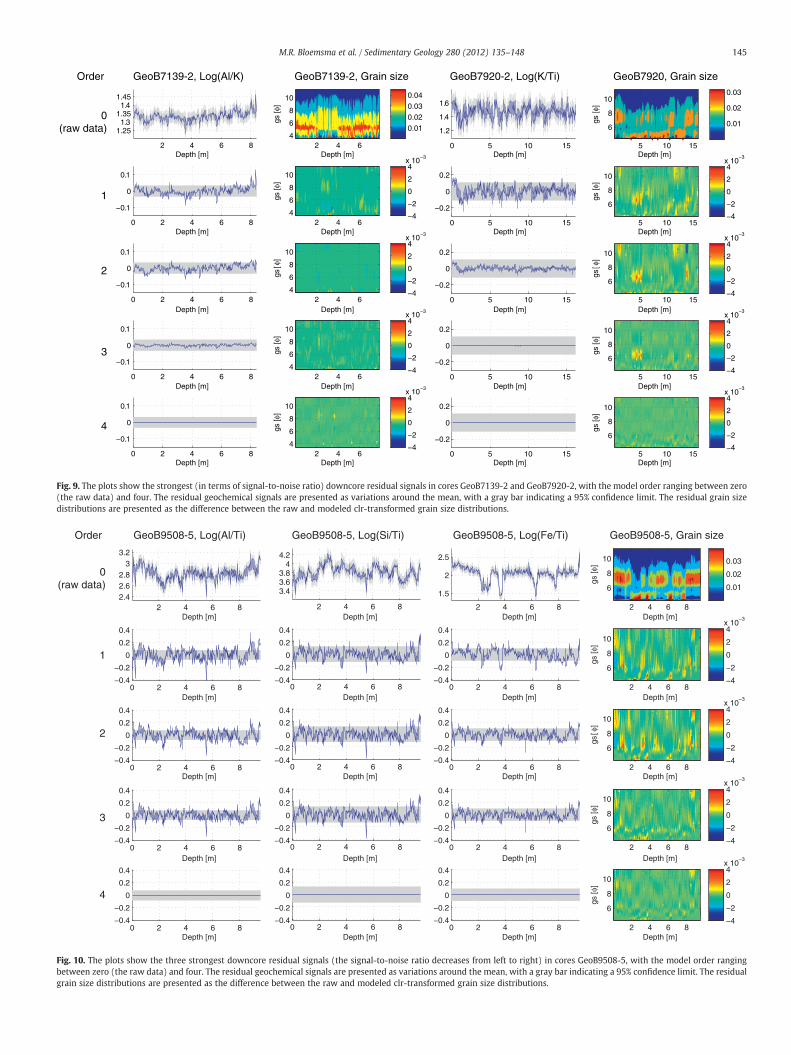
Finally we observe that for every alternative model (i.e., modeloutcome of a certain order), the residual Al/Ti, Fe/Ti and Si/Tishow several profound dips, suggesting a relative Ti-enrichment.Based on the consistency of this pattern among the differentmodel orders, the plausibility of Ti reflecting residual variabilityand the fact that the fit to the grain size exhibits no significant im-provements when subtracting four instead of three components, weassume that the ‘true order’ of the residuals in core GeoB9508-5 isthree. For this order we obtain significant Al/Ti, Fe/Ti, Si/Ti, as wellas K/Si residuals.
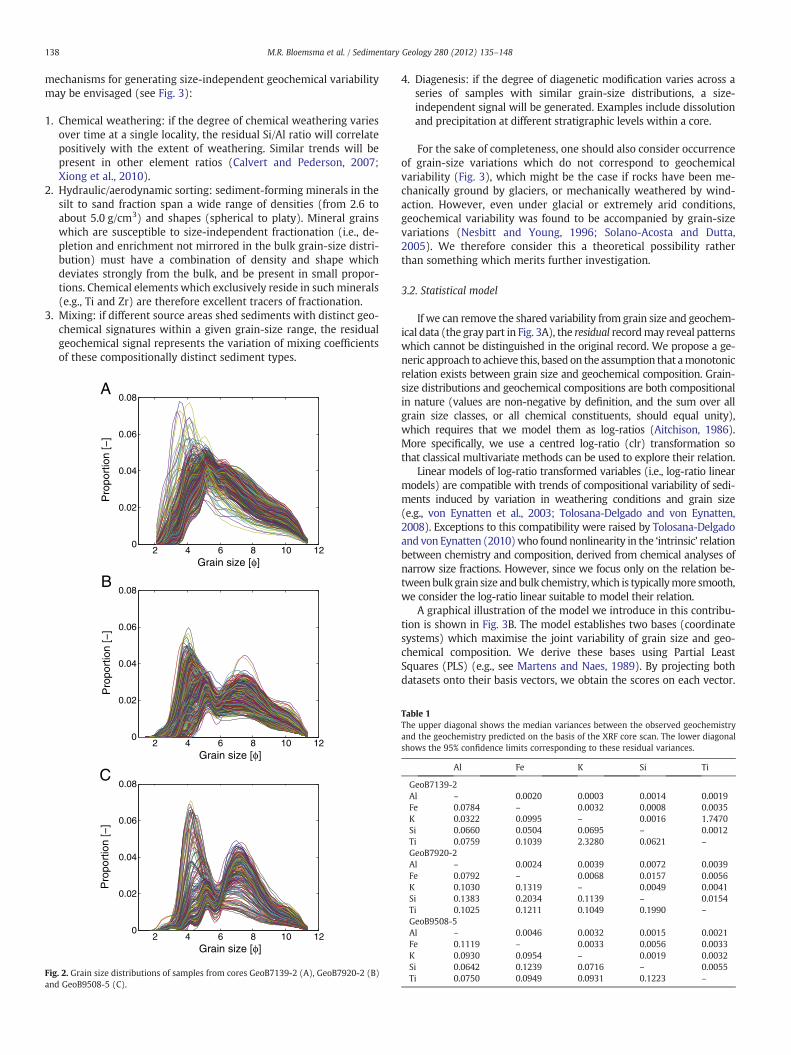
The residual grain size signals in cores GeoB7139-2 and GeoB7920-2(Fig. 9) suggest that at least three common patterns should be removedto obtain a grain-size invariant geochemical record. At this point, thereare no significant residual geochemical signals present in the data (seeTable 1). As a result, we conclude that these cores contain no significantresidual geochemical variability.
6.3. Paleo-climatological interpretation
In order to relate the residuals to the proposed size-independentmechanisms, mineralogical information is indispensable. Althoughmineralogical data is not available, chemical elements can be associatedwith mineral phases, though with a varying level of confidence. In coreGeoB9508-5, K most likely, but not exclusively, resides in K-feldsparwhereas Si resides in detrital quartz and possibly in opal. Because (1)the signal-to-noise ratio of the associated residual signal (i.e., K/Si) is60-80% smaller than that of the Ti residuals, and (2) we cannot link

AlFe
KSi
Ti
C
A B
GeoB7139−2 GeoB7920−2
GeoB9508−5
D
Cor
rela
tion
coef
ficie
nt [-
]
4 5 6 7 80
0.2
0.4
0.6
0.8
1
Mean grain size [φ]
4 5 6 7 8Mean grain size [φ]
4 5 6 7 8Mean grain size [φ]
Pro
port
ion
[−]
0
0.2
0.4
0.6
0.8
1
Pro
port
ion
[−]
0
0.2
0.4
0.6
0.8
1
Pro
port
ion
[−]
Al Fe K Si Ti PC1−1
−0.8
−0.6
−0.4
−0.2
0
0.2
0.4
0.6
0.8
1
Fig. 8. The chemical composition as function of the mean grain size of cores GeoB7139‐2 (A), GeoB7920-2 (B) and GeoB9508-5 (C). The line passing through the observations re-flects the least-squares solution to a log-ratio linear model. The correlation between the different clr-transformed chemical components and the mean grain size is shown in D. Inaddition, the correlation coefficients between the mean grain size and the first principal component of the raw clr-transformed geochemical data are shown.
144 M.R. Bloemsma et al. / Sedimentary Geology 280 (2012) 135–148
these elements to minerals with an acceptable level of confidence, wedo not attempt to interpret this residual signal.
Ti can bemore confidently associated withmineral phases; it is con-sidered to be of exclusively terrigenous origin (Murray and Leinen,1996) and mostly resides in heavy minerals such as sphene, rutile andanatase (Spears and Kanaris-Sotiriou, 1976). These minerals have ahigh density relative to minerals such as quartz, feldspars and clays,which make up the bulk of siliciclastic sediments. Although Ti-richheavy minerals are considered essentially inert components (Young andNesbitt, 1998), authigenic formation of these minerals have been de-scribed under highly specific conditions (Goldberg and Arrhenius,1958; Pe-Piper et al., 2011). However, given the fact that the observed
Table 2The significant residuals of the different cores (α=5%). A ‘*’ indicates that all elements(except the numerator) exhibit significant residuals.
Core Order Significant residuals
GeoB7139-2 1 Al/KGeoB7139-2 2 Al/KGeoB7139-2 3 NoneGeoB7139-2 4 NoneGeoB7920-2 1 K/Ti, K/AlGeoB7920-2 2 NoneGeoB7920-2 3 NoneGeoB7920-2 4 NoneGeoB9508-5 1 Al/*, Ti/*, K/SiGeoB9508-5 2 Al/Si, Ti/*, K/SiGeoB9508-5 3 Al/Ti, Fe/Ti, Si/Ti, K/SiGeoB9508-5 4 None
Al/Ti are approximately equal to Al/Ti values found in othermarine sed-iment cores located in the Atlantic (Zabel et al., 1999), we consider dia-genetic modification a highly unlikely cause for the observed Tiresiduals. This implies that they may be explained by any of the postu-lated grain-size independent processes that take place before deposi-tion such as weathering, density/shape sorting and mixing.
In the area of core GeoB9508-5, contrasting patterns of depositionhave been linked to climate changes (Mulitza et al., 2008). Dry andcold periods were characterised by strong winds and low fluvial sed-iment input, whereas the opposite holds for relatively warm andhumid intervals (e.g., Sarnthein, 1978; deMenocal et al., 1993).Hence, we are dealing with a situation in which the grain-size charac-teristics of the sediments, and therefore also their transport mecha-nisms, are likely to correlate with provenance. We make use of thisknowledge by dividing the residual geochemical data set intoaeolian-dominated, fluvial-dominated, and mixed sediments sam-ples, based on the median grain size (P50 of the cumulative grainsize distributions) with cutoffs set at 5.5 and 6.5 phi-units(Fig. 11A). The relation between transport mechanism and residualTi/Al is shown in Fig. 11B. With the null hypothesis being that theLog(Ti/Al) in the fluvial and aeolian source are samples from identicaldistributions having the same median, we estimate the probabilityunder the null hypothesis using a Wilcoxon rank sum test(Hollander and Wolfe, 1973). Based on this p-value and a significancelevel of 5%, we conclude that the third-order Ti/Al residuals are relat-ed to the transport mechanism (and therefore also the Al/Ti residuals,because log-ratios are symmetrical Weltje and Tjallingii, 2008).
We can postulate several scenarios that may have produced theresidual patterns, which differ with respect to the underlying
GeoB7139-2, Log(Al/K) GeoB7920-2, Log(K/Ti)GeoB7139-2, Grain size GeoB7920, Grain size
2 4 6 8
1.251.3
1.351.4
1.45
Depth [m] Depth [m] Depth [m] Depth [m]
Depth [m] Depth [m] Depth [m] Depth [m]
Depth [m] Depth [m] Depth [m] Depth [m]
Depth [m] Depth [m] Depth [m] Depth [m]
Depth [m] Depth [m] Depth [m] Depth [m]
0 2 4 6 8
−0.1
0
0.1
0 2 4 6 8
−0.1
0
0.1
0 2 4 6 8
−0.1
0
0.1
0 2 4 6 8
−0.1
0
0.1
gs [φ
]
2 4 64
6
8
10
0.01
0.020.030.04
gs [φ
]
2 4 64
6
8
10
−4
−2
0
2
4x 10
gs [φ
]
2 4 64
6
8
10
−4
−2
0
2
4x 10
gs [φ
]
2 4 64
6
8
10
−4
−2
0
2
4x 10
gs [φ
]
2 4 64
6
8
10
−4
−2
0
2
4x 10
−3
−3
−3
−3
5 10 15
1.2
1.4
1.6
0
0
5 10 15
−0.2
0
0.2
0 5 10 15
−0.2
0
0.2
0 5 10 15
−0.2
0
0.2
0 5 10 15
−0.2
0
0.2
gs [φ
]
5 10 15
6
8
10
0.01
0.02
0.03
gs [φ
]
5 10 15
6
8
10
−4
−2
0
2
4x 10
−3
gs [φ
]
5 10 15
6
8
10
−4
−2
0
2
4x 10
−3
gs [φ
]
5 10 15
6
8
10
−4
−2
0
2
4x 10
−3
gs [φ
]
5 10 15
6
8
10
−4
−2
0
2
4x 10
−3
0(raw data)
1
2
3
4
Order
Fig. 9. The plots show the strongest (in terms of signal-to-noise ratio) downcore residual signals in cores GeoB7139-2 and GeoB7920-2, with the model order ranging between zero(the raw data) and four. The residual geochemical signals are presented as variations around the mean, with a gray bar indicating a 95% confidence limit. The residual grain sizedistributions are presented as the difference between the raw and modeled clr-transformed grain size distributions.
0(raw data)
1
2
3
4
GeoB9508-5, Log(Si/Ti)GeoB9508-5, Log(Al/Ti)Order GeoB9508-5, Grain sizeGeoB9508-5, Log(Fe/Ti)
2 4 6 82.42.62.8
33.2
Depth [m] Depth [m] Depth [m] Depth [m]
Depth [m] Depth [m] Depth [m] Depth [m]
Depth [m] Depth [m] Depth [m] Depth [m]
Depth [m] Depth [m] Depth [m] Depth [m]
Depth [m] Depth [m] Depth [m] Depth [m]
0 2 4 6 8−0.4
−0.2
0
0.2
0.4
0 2 4 6 8−0.4
−0.2
0
0.2
0.4
−0.4
−0.2
0
0.2
0.4
−0.4
−0.2
0
0.2
0.4
−0.4
−0.2
0
0.2
0.4
−0.4
−0.2
0
0.2
0.4
−0.4
−0.2
0
0.2
0.4
−0.4
−0.2
0
0.2
0.4
−0.4
−0.2
0
0.2
0.4
−0.4
−0.2
0
0.2
0.4
−0.4
−0.2
0
0.2
0.4
−0.4
−0.2
0
0.2
0.4
0 2 4 6 8
0 2 4 6 8
2 4 6 8
3.43.63.8
44.2
0 2 4 6 8
0 2 4 6 8
0 2 4 6 8
0 2 4 6 8
2 4 6 8
1.5
2
2.5
0 2 4 6 8
0 2 4 6 8
0 2 4 6 8
0 2 4 6 8
gs [φ
]
2 4 6 8
6
8
10
0.01
0.02
0.03
gs [φ
]
2 4 6 8
6
8
10
−4
−2
0
2
4x 10
−3
gs [φ
]
2 4 6 8
6
8
10
−4
−2
0
2
4x 10
−3
gs [φ
]
2 4 6 8
6
8
10
−4
−2
0
2
4x 10
−3
gs [φ
]
2 4 6 8
6
8
10
−4
−2
0
2
4x 10
−3
Fig. 10. The plots show the three strongest downcore residual signals (the signal-to-noise ratio decreases from left to right) in cores GeoB9508-5, with the model order rangingbetween zero (the raw data) and four. The residual geochemical signals are presented as variations around the mean, with a gray bar indicating a 95% confidence limit. The residualgrain size distributions are presented as the difference between the raw and modeled clr-transformed grain size distributions.
145M.R. Bloemsma et al. / Sedimentary Geology 280 (2012) 135–148

A B
Flu
vial
pr
oven
ance
Aeo
lian
prov
enan
ce
−3.1 −3 −2.9 −2.8 −2.7 −2.6 −2.5Log(Ti / Al)
0 2 4 6 8 104
4.5
5
5.5
6
6.5
7
7.5
8
Depth [m]
Med
ian
grai
n si
ze [φ
]
Fig. 11. As indicated in A, we partitioned the data into fluvial, aeolian andmixed provenance, based on themedian grain size. For both the fluvial and aeolian sediment, we show the residualTi/Al in plot B. Based on the p-value derived from theWilcoxon rank sum test, and a significance level of 5%, we conclude that the third-order residuals are related to the transportingmedium.
146 M.R. Bloemsma et al. / Sedimentary Geology 280 (2012) 135–148
assumptions. If, for instance, the sediment deposited in the sink hasbeen exclusively derived from one source, and the conditions underwhich the sediment was transported were constant in time, the resid-ual signal reflects varying climatic conditions in the source area(s). Analternative scenario is that the residuals reflect the different areasthat have served as a source, rather than varying conditions withinthe source area(s). In both cases, the underlying assumption is thatthe sediment is transport-invariant, i.e., that it has been transportedunder the same hydro- and aerodynamic conditions (Weltje, 2004).Another scenario is that the residual variability is induced by mixingof fluvial and aeolian sediment and/or sorting processes during eitherriver- or wind-transport. This scenario is characterised by the as-sumption of "provenance-invariance".
It is evident that, without additional constraints, there is nounique solution to this problem. Even when adopting the (strong) as-sumption that the source area and the climatic conditions were con-stant in time, we cannot ascribe the residuals to either selectivetransport or mixing. This is due to the fact that preferential entrain-ment of Ti-bearing minerals in the windblown sediment due to in-creased wind strength (Sarnthein, 1978; Rea, 1994) will have thesame effect on Ti residuals as mixing of Ti-rich windblown sedimentand Ti-poor riverine sediment having a constant geochemical compo-sition. Moreover, Stuut et al. (2005) showed that even on a shorttime-scale (days), both source area and pathway length (which con-trols selective transport) substantially vary, which means that assum-ing provenance-invariance, as well as transport-invariance, are bothnot defendable. We therefore conclude that, on the basis of thesedata, it is impossible to unambiguously interpret the residuals interms of the proposed grain-size independent mechanisms.
6.4. General discussion
In the analysed cores, the elements showing the strongest correla-tion with the mean grain size were Ti (GeoB7139-2) and Si(GeoB7920-2 and GeoB9508-5). In addition, Ti was designated asthe main residual component in GeoB9508-5. This leads to the con-clusion that geochemistry-based proxies for mean grain size dependon the specific setting, which automatically implies that the same istrue for geochemistry-based proxies considered to be associatedwith other processes. We showed that, using the model and a set ofoverlapping grain-size and geochemical observations, these proxiescan be identified in a robust way. However, whether or not signals as-sociated with the size-independent processes can be inferred fromthe data depends on the magnitude of this signal, relative to the un-certainty in both data sets. Likewise, more significant signals may
appear if the uncertainty of the input data will be reduced. Further-more, applying the model to a more comprehensive set of geochem-ical variables is more likely to reveal informative residual patterns.
As for the interpretation of bulk geochemical records in general, inter-pretation of the residuals is difficult because they may reflect numerousdifferent processes. In addition, elements cannot always be uniquely as-sociated with a single mineral. We can thus not provide a ‘cookbook’for the interpretation of the residuals. However, by correcting the datafor grain size, at least one hypothesis can be eliminated, i.e., that the geo-chemistry only reflects grain-size variations.
7. Conclusions
The joint analysis of bulk geochemical records and grain-size dis-tributions allows us to decompose the geochemical record into agrain-size independent and a grain-size related part. This methodtherefore facilitates identification of grain-size proxies, and interpre-tation of residual geochemical signals in terms of weathering, shape/density sorting, mixing and diagenesis. Differences between the size-compositional trends highlight the need for empirical models; incore GeoB7139-2 (offshore Chile) Ti and Si were, respectively, strongand weak proxies for the mean grain size whereas in coreGeoB9508-5 (offshore Senegal) it was the other way around. More-over, the model showed that the residual Ti in the case of coreGeoB9508-5 varies independently of the grain size, and discriminatesbetween the two known sources (fluvial and aeolian). Several hypoth-eses were postulated on the basis of this model outcome althoughthey could not be confirmed nor rejected without additional informa-tion. From the synthetic example and the case study we conclude thatmulti-proxy analysis can be formalised using multivariate methods(e.g., Partial Least Squares). However, to apply the methodology in fu-ture studies, comprehensive quantification of the uncertainties ingrain-size and geochemical data is necessary.
Acknowledgments
Inka Meyer is thanked for laboratory assistance during size separa-tion of the sediment samples. M.R. Bloemsma gratefully acknowledgesfunding by Wintershall. G.J. Weltje acknowledges financial support ofthe Hanse Institute for Advanced Study, Delmenhorst, Germany, for ini-tiating this research during a stay as Research Fellow in Ocean Sciences.We thank editor Hilmar von Eynatten, Georgia Pe-Piper, David Piper,Raimon Tolosana-Delgado and an anonymous reviewer for their con-structive comments.

147M.R. Bloemsma et al. / Sedimentary Geology 280 (2012) 135–148
Appendix A. Joint modelling of grain size and geochemicalcomposition
Bulk chemistry and grain-size distribution are both compositionaldata. The compositional nature of a data set spanning D componentsimplies that (Aitchison, 1986):
x ¼ ðx1; x2; ::::xDÞ′; xi > 0;XDi¼1
¼ κ ðA:1Þ
where κ may be 1, 100 or 1.000.000, depending on the units of mea-surement. The constant-sum and positivity constraint make that aD-part compositional dataset x={x1,x2,x3,…xD} does not span areal space RD, but the so called D-part simplex, or SD, which hasrank D–1.
From a modelling perspective, the most important implication ofthe compositional nature is that classical statistical methods cannotbe applied. Instead, processing of compositional data should bedone using log-ratio transformations, or log-ratios. For multivariatestatistical analysis, the data should be centred log-ratio (clr) trans-formed (Aitchison, 1986):
y ¼ clr xð Þ ¼ logx1g xð Þ ; log
x2g xð Þ ;…; log
xDg xð Þ
� �ðA:2Þ
where g(x) denotes the geometric mean over all components.The objective of this study is to decompose the geochemical re-
cord into a part which is correlated with grain size, and a partwhich varies independently from the grain size. We achieve this byfinding a basis Q in RD (the clr-transformed geochemical solutionspace) which maximizes the geochemical variance explained by thegrain size. A multivariate method to maximize the common covari-ance, and obtain this basis Q, is Partial Least Squares, or PLS (Woldet al., 1982), which is the method being used in this study.
If we have measured both the grain-size distribution X (L grain-size classes) and the geochemical composition Y (D variables) of aset of m specimens, we fit the model on data matrices X* and Y*which contain the grain size and bulk chemical composition of thisset of samples, respectively. If the mean is subtracted from thesedata matrices, we obtain Xc * and Yc *. In this study, we then use theSIMPLS algorithm (de Jong, 1993) to calculate the PLS matrix decom-position:
Xc� ¼ T�PT
Yc� ¼ U�QT ðA:3Þ
where T and U are the m×D and m×L scores, and P and Q are theloadings of size D×D and L×L, respectively. To ensure the decompo-sition to be orthogonal, the bases P and Q are orthogonalised usingSingular Value Decomposition (Press et al., 1994) after which thescore matrices T* and U* are recalculated (for the methodology, seeEq. A.5). Then, we determine the maximum number of componentsthat may be removed by performing a test on the correlation betweenthe scores T* and U*. Significance of correlation between the geochem-ical and grain-size scores on the k-th basis vector (i.e., the k-th col-umn of T* and U*) is tested using the following criterion (Kendalland Stuart, 1973):
rj jffiffiffiffiffiffiffiffiffiffiffiffim−21−r2
s> t−1 m−2; pð Þ: ðA:4Þ
We derive r for any order k, where r is Pearson's correlation coef-ficient between the k-th column of T∗ and U∗ (i.e. the projection of thedata on the k-th basis vector). The right-hand side is the inverse t-
distribution with probability p and m−2 degrees of freedom. Givena level of confidence α and p=1−α, we remove the first k sharedsignals if for k, the criterion in Eq. A.4 is met.
Now the model order and the model parameters (i.e., the linearbases) are calculated, we can apply the model to all grain-size andgeochemical observations in the data set, i.e., also the observations re-lated to samples contained in either the grain-size or the geochemicaldata set. Because PT and QT are both orthonormal, it holds that(PT)−1=(PT)T=P and (QT)−1=(QT)T=Q. This, in turn, means thatthe scores of all observed grain-size distributions and geochemicalcompositions on their corresponding bases can be derived by matrixproduct:
T ¼ XcPU ¼ YcQ
ðA:5Þ
Subsequently, the shared signal in both datasets of rank k can bederived by means of a reduced-rank approximation. This impliesthat we use only the first k columns of both the loadings P and Q,and the scores T and U:
X c
� �k¼ TkP
Tk
Y c
� �k¼ UkQ
Tk
ðA:6Þ
The ‘residuals’ are obtained by subtracting the common variabilityin both data sets from the input data:
X c
� �k¼ Xc− X c
� �k
Y c
� �k¼ Yc− Y c
� �k
ðA:7Þ
Finally, we may add the mean again to form ðXÞk and ðY Þk, so thatthe residual signals centre around the mean of their correspondingraw data matrix.
References
Aitchison, J., 1986. The Statistical Analysis of Compositional Data, 1st Edition. Chapmanand Hall, London.
Amante, C., Eakins, B.W., 2008. ETOPO1 1 Arc-Minute Global Relief Model: Procedures,Data Sources and Analysis. National Geophysical Data Center, NESDIS, NOAA, U.S.Department of Commerce. (map publicly available at: http://www.ngdc.noaa.gov/mgg/global/global.html).
Amorosi, A., Centineo, M.C., Dinelli, E., Lucchini, F., Tateo, F., 2002. Geochemical andmineralogical variations as indicators of provenance changes in Late Quaternarydeposits of SE Po Plain. Sedimentary Geology 151, 273–292.
Basu, A., 2003. A perspective on quantitative provenance analysis. In: Valloni, R., Basu,A. (Eds.), Quantitative Provenance Studies in Italy, Memorie Descrittive della CartaGeologica dell'Italia, Vol. 64, pp. 11–22.
Boyle, E.A., 1983. Chemical accumulation variations under the Peru Current during thepast 130,000 years. Journal of Geophysical Research 88 (C12), 7667–7680. http://dx.doi.org/10.1029/JC088iC12p07667.
Calvert, S.E., Pederson, T.F., 2007. Elemental proxies for palaeoclimatic and pal-aeoceanographic variability in marine sediments: interpretation and Application.In: Hillaire-Marcel, C., de Vernal, A. (Eds.), Proxies in Late Cenozoic Paleo-ceanography. Developments in Quaternary Research, vol. 1. Elsevier Science, Am-sterdam, pp. 567–644.
de Jong, S., 1993. SIMPLS: an alternative approach to partial least squares regression.Chemometrics and Intelligent Laboratory Systems 18, 251–263.
De Pol-Holz, R., Ulloa, O., Lamy, F., Dezileau, L.P.S., Hebbeln, D., 2007. Late Quaternaryvariability of sedimentary nitrogen isotopes in the eastern South Pacific Ocean.Paleoceanography 22, pA2207.
deMenocal, P.B., Ruddiman,W.F., Pokras, E.M., 1993. Influences of high- and low‐latitudepro-cesses on African terrestrial climate: Pleistocene eolian records from equitorial Atlanticocean drilling program Site 663. Paleoceanography 8, 209–242.
Dinelli, E., Tateo, F., Summa, V., 2007. Geochemical and mineralogical proxies for grainsize in mudstones and siltstones from the Pleistocene and Holocene of the Po Riveralluvial plain, Italy. In: Arribas, J., Critelli, S., Johnsson, M. (Eds.), Sedimentary Prov-enance and Petrogenesis: Perspectives from Petrography and Geochemistry: Geo-logical Society of America Special Papers, pp. 25–36.
Gac, J.Y., Kane, A., 1986. Le fleuve Senegal: I. Bilan hydrologique et flux continentaux dematieres particulaire a l'embouchure. Sciences Géologiques Bulletin 39, 99–130.
Geisser, S., 1993. Predictive Inference: An Introduction. Chapman and Hall, New York.Goldberg, E.D., Arrhenius, G.O.S., 1958. Chemistry of pacific pelagic sediments. Geo-
chimica et Cosmochimica Acta 13, 153–212.

148 M.R. Bloemsma et al. / Sedimentary Geology 280 (2012) 135–148
Haslett, S.K., Davies, C.F.C., 2006. Late Quaternary climate-ocean changes in westernNorth Africa: offshore geochemical evidence. Transactions of the Institute of BritishGeographers 31, 34–52.
Haslett, S.K., Smart, C.W., 2006. Late Quaternary upwelling off tropical NW Africa: newmicropalaeontological evidence from ODP Hole 658C. Journal of Quaternary Sci-ence 21, 259–269.
Hebbeln, D., cruise participants, 2001. PUCK, Report and Preliminary Results of R/VSonne cruise 156, Valparaiso (Chile)-Talcahuano (Chile), March 29–May 14,2001. Univ. Bremen, Bremen, Germany.
Hollander, M., Wolfe, D.A., 1973. Nonparametric Statistical Methods. Wiley.Holz, C., Stuut, J.-B.W., Henrich, R., 2004. Terrigenous sedimentation processes along
the continental margin off NW Africa: implications from grain-size analysis of sea-bed sediments. Sedimentology 51, 1145–1154.
Johnsson, M.J., 1993. The system controlling the composition of clastic sediments. In:Johnsson, M.J., Basu, A. (Eds.), Processes Controlling the Composition of ClasticSediments: Geological Society of America Special Paper, 284, pp. 1–19.
Kaiser, J., Schefuss, E., Lamy, F., Mohtadi, M., Hebbeln, D., 2008. Glacial to Holocenechanges in sea surface temperature and coastal vegetation in north central Chile:high versus low latitude forcing. Quaternary Science Reviews 27, 2064–2075.
Kendall, M.G., Stuart, A., 1973. The Advanced Theory of Statistics, Volume 2: Inferenceand Relationships. Griffin, London.
Klump, J., Hebbeln, D., Wefer, G., 2000. The impact of sediment provenance on barium-based productivity estimates. Marine Geology 169, 259–271.
Koopmann, B., 1981. Sedimentation von Saharastaub im subtropischen Nordatlantikwahrend der letzten 25.000 Jahre. Meteor Forschungsergeb., Reihe C, 35, pp. 23–59.
Lamy, F., Hebbeln, D., Wefer, G., 1998. Terrigenous sediment supply along the Chileancontinental margin: modern regional patterns of texture and composition. Geolog-ische Rundschau 87, 477–494.
Lamy, F., Klump, J., Hebbeln, D., Wefer, G., 2000. Late Quaternary rapid climate changein northern Chile. Terra Nova 12, 8–13.
Martens, H., Naes, T., 1989. Multivariate Calibration. Wiley, Chicester.McLennan, S.M., Hemming, S., McDaniel, D.K., Hanson, G.N., 1993. Geochemical ap-
proaches to sedimentation, provenance and tectonics. In: Johnsson, M., Basu, A.(Eds.), Processes Controlling the Composition of Clastic Sediments: Geological So-ciety of America, Special Papers, 285, pp. 21–40.
Meggers, H., cruise participants, 2002. Report and Preliminary Results of Meteor cruiseM 53/1, Limasol — Las Palmas — Mindelo, 30.03–03.05.2002. Univ. Bremen, Bre-men, Germany.
Moreno, T., Querol, X., Castillo, S., Alastuey, A., Cuevas, E., Herrmann, L., Mounkaila, M.,Elvira, J., Gibbons, W., 2006. Geochemical variations in aeolian mineral particlesfrom the Sahara-Sahel Dust Corridor. Chemosphere 65, 261–270.
Mulitza, S., cruise participants, 2006. Report and Preliminary Results of R/V METEOR CruiseM65/1, Dakar-Dakar, 11.06.2005-01.07.2005. Univ. Bremen, Bremen, Germany.
Mulitza, S., Prange, M., Stuut, J.-B., Zabel, M., von Dobeneck, T., Itambi, A.C., Nizou, J.,Schulz, M., Wefer, G., 2008. Sahel megadroughts triggered by glacial slowdownsof Atlantic meridional overturning. Paleoceanography 23, PA4206. http://dx.doi.org/10.1029/2008PA001637.
Murray, R.W., Leinen, M., 1996. Scavenged excess aluminum and its relationship tobulk titanium in biogenic sediment from the central equatorial Pacific Ocean.Geochim. Cosmochim. Acta 60, 3869–3878.
Nesbitt, H.W., Young, G.M., 1984. Prediction of some weathering trends of plutonic andvolcanic rocks based on thermodynamic and kinetic considerations. Geochimica etCosmochimica Acta 48, 1523–1548.
Nesbitt, H.W., Young, G.M., 1996. Petrogenesis of sediments in the absence of chemicalweathering: effects of abrasion and sorting on bulk composition and mineralogy.Sedimentology 43, 341–358.
Pe-Piper, G., Triantaffyllidis, S., Piper, D.J.W., 2008. Geochemical identification of clasticsediment provenance from known sources of similar geology: the CretaceousScotian basin, Canada. Journal of Sedimentary Research 78, 595–607.
Pe-Piper, G., Karim, A., Piper, D.J.W., 2011. Authigenesis of titania minerals and the mo-bility of Ti, new evidence from pro-deltaic sandstones, cretaceous Scotian Basin,Canada. Journal of Sedimentary Research 81, 762–773.
Pettijohn, F.J., Potter, P.E., Siever, R., 1987. Sand and Sandstone, Second Edition. Springer,New York.
Press, W.H., Teukolsky, S.A., Vetterling, W.T., Flannery, B.P., 1994. Numerical Recipes inFORTRAN: The Art of Scientific Computing, Second Edition. Cambridge UniversityPress, Cambridge.
Rea, D.K., 1994. The paleoclimatic record provided by Eolian deposition in the deep sea:the geologic history of wind. Geophysics 32, 159–195.
Richter, T.O., Van der Gaast, S., Koster, B., Vaars, A., Gieles, R., de Stigter, H., de Haas, H.,van Weering, T.C.E., 2006. The Avaatech XRF core scanner: technical descriptionand applications to NE Atlantic sediments. In: Rothwell, R.E. (Ed.), New Techniquesin Sediment Core Analysis. Special Publication, Vol. 267. Geological Society, London,pp. 39–50.
Romero, O.E., Kim, J.H., Donner, B., 2008. Submillennial-to-millennial variability of dia-tom production off Mauritania, NW Africa during the last glacial cycle. Paleo-ceanography 23, PA3218. http://dx.doi.org/10.1029/2008PA001601.
Sarnthein, M., 1978. Sand deserts during glacial maximum and climatic optimum. Na-ture 272, 43–45.
Sarnthein, M., Tetzlaff, G., Koopmann, B., Wolter, K., Pflaumann, U., 1981. Glacial andinterglacial wind regimes over the eastern subtropical Atlantic and north-westAfrica. Nature 293, 193–196. http://dx.doi.org/10.1038/293193a0.
Schneider, R.R., Price, B., Müller, P.J., Kroon, D., Alexander, I., 1997. Monsoon relatedvariations in Zaire (Congo) sediment load and influence of fluvial silicate supplyon marine productivity in the east equatorial Atlantic during the last 200,000years. Paleoceanography 12, 463–481.
Solano-Acosta, W., Dutta, P.K., 2005. Unexpected trend in the compositional maturityof second-cycle sand. Sedimentary Geology 178, 275–283.
Spears, D.A., Kanaris-Sotiriou, R., 1976. Titanium in some Carboniferous sedimentsfrom Great Britain. Geochimica et Cosmochimica Acta 40, 345–351.
Stuut, J.-B.W., Lamy, F., 2004. Climate variability at the southern boundaries of theNamib (southwestern Africa) and Atacama (northern Chile) coastal deserts duringthe last 120,000 yr. Quaternary Research 62, 301–309.
Stuut, J.-B., Zabel, M., Ratmeyer, V., Helmke, P., Schefuss, E., Lavik, G., Schneider, R.,2005. Provenance of present-day Eolian dust collected off North-Africa. Journal ofGeophysical Research 110. http://dx.doi.org/10.1029/2004JD005161.
Stuut, J.-B., Kasten, S., Lamy, F., Hebbeln, D., 2007. Sources and modes of terrigenoussediment input to the Chilean continental slope. Quaternary International 161,67–76.
Tjallingii, R., Röhl, U., Kölling, M., Bickert, T., 2007. Influence of the water content on X-ray fluorescence core-scanning measurements in soft marine sediments. Geo-chemistry, Geophysics, Geosystems 8. http://dx.doi.org/10.1029/2006GC001393.
Tjallingii, R., Claussen, M., Stuut, J.-B., Fohlmeister, J., Jahn, A., Bickert, T., Lamy, F., Röhl,U., 2008. Coherent high- and low-latitude control of the northwest African hydro-logical balance. Nature Geoscience 1 (10), 670–675.
Tolosana-Delgado, R., von Eynatten, H., 2008. Grain-size control on petrographic com-position of sediments: compositional regression and rounded zeros. MathematicalGeosciences 41, 869–886.
Tolosana-Delgado, R., von Eynatten, H., 2010. Simplifying compositional multiple re-gression: application to grain size controls on sediment geochemistry. Computersand Geosciences 36, 577–589.
Vekemans, B., Janssens, K., Vincze, L., Adams, F., van Espen, P., 1994. Analysis of X-rayspectra by iterative least squares (AXIL): new developments. X-ray Spectrometry23, 278–285.
von Eynatten, H., Barceló-Vidal, C., Pawlowsky Glahn, V., 2003. Modelling composition-al change: the example of chemical weathering of granitoid rocks. MathematicalGeology 35 (3), 231–251. http://dx.doi.org/10.1023/A:1023835513705.
Weltje, G.J., 2004. A quantitative approach to capturing the compositional variability ofmodern sands. Sedimentary Geology 171, 59–77.
Weltje, G.J., Brommer, M.B., 2011. Sediment-budget modelling of multi-sourced basinfills: application to recent deposits of the western Adriatic mud wedge (Italy).Basin Research 23, 291–308.
Weltje, G.J., Prins, M.A., 2003. Muddled or mixed? Inferring palaeoclimate from sizedistributions of deep-sea clastics. Sedimentary Geology 162, 39–62.
Weltje, G.J., Tjallingii, R., 2008. Calibration of XRF core scanners for quantitative geo-chemical logging of sediment cores: theory and application. Earth and PlanetaryScience Letters 274, 423–438.
Weltje, G.J., von Eynatten, H., 2004. Quantitative provenance analysis of sediments re-view and outlook. Sedimentary Geology 171, 1–11.
Wien, K., Wissmann, D., Külling, M., Schulz, H.D., 2005. Fast application of X-ray fluo-rescence spectrometry aboard ship: how good is the new portable Spectro Xeposanalyzer? Geo-Marine Letters 25-4, 248–264.
Wold, S., Martens, H., Wold, H., 1982. The multivariate calibration problem in chemis-try solved by the PLS method. In: Ruhe, A., Kagstrom, B. (Eds.), Proc. Conf. MatrixPencils. Springer Verlag, Heidelberg, pp. 286–293.
Xiong, S., Ding, Z., Zhu, Y., Lu, H., 2010. A ~ 6 Ma chemical weathering history, the grainsize dependence of chemical weathering intensity, and its implications for prove-nance change of Chinese loess-red clay deposit. Quaternary Science Reviews 29,1911–1922.
Yarincik, K.M., Murray, R.W., Peterson, L.C., 2000. Climatically sensitive eolian andhemipelagic deposition in the Cariaco Basin, Venezuela, over the past 578,000years: Results from Al/Ti and K/Al. Paleoceanography 15, 210–228.
Young, G.M., Nesbitt, H.W., 1998. Processes controlling the distribution of Ti and Al inweathering profiles, siliciclastic sediments and sedimentary rocks. Journal of Sedi-mentary Research 68 (3), 448–455.
Zabel, M., Bickert, T., Dittert, L., Häse, R.R., 1999. Significance of the sedimentary Al:Tiratio as an indicator for variations in the circulation patterns of the equatorialNorth Atlantic. Paleoceanography 14 (6), 789–799.