RESEARCH Open Access Grain iron and zinc density in ... there exists a wealth of literature on...
12
RESEARCH Open Access Grain iron and zinc density in pearl millet: combining ability, heterosis and association with grain yield and grain size Anand Kanatti 1,2 , Kedar N Rai 1* , Kommineni Radhika 2 , Mahalingam Govindaraj 1 , Kanwar L Sahrawat 1 and Aluri S Rao 1 Abstract Genetics of micronutrients and their relationships with grain yield and other traits have a direct bearing on devising effective strategies for breeding biofortified crop cultivars. A line × tester study of 196 hybrids and their 28 parental lines of pearl millet (Pennisetum glaucum (L.) R.Br.) showed large genetic variability for Fe and Zn densities with predominantly additive gene action and no better-parent heterosis. Hybrids with high levels of Fe and Zn densities, involved both parental lines having significant positive general combining ability (GCA), and there were highly significant and high positive correlations between performance per se of parental lines and their GCAs. There was highly significant and high positive correlation between the Fe and Zn densities, both for performance per se and GCA. Fe and Zn densities had highly significant and negative, albeit weak, correlations with grain yield and highly significant and moderate positive correlation with grain weight in hybrids. These correlations, however, were non-significant in the parental lines. Thus, to breed hybrids with high Fe and Zn densities would require incorporating these micronutrients in both parental lines. Also, simultaneous selection for Fe and Zn densities based on performance per se would be highly effective in selecting for GCA. Breeding for high Fe and Zn densities with large grain size will be highly effective. However, combining high levels of these micronutrients with high grain yield would require growing larger breeding populations and progenies than breeding for grain yield alone, to make effective selection for desirable recombinants. Keywords: Pearl millet; Micronutrients; Grain yield; Genetic variability; Hybrids; Heterosis; Correlation Introduction Micronutrient malnutrition resulting from dietary defi- ciency of one or more micronutrients has been recog- nized as a serious human health problem worldwide. The most striking of these are iron (Fe) and zinc (Zn) deficiencies that rank 9 th and 11 th , respectively, among the top 20 risk factors contributing to global burden of disease (WHO 2002). Pharmaceutical supplementation, industrial fortification and dietary diversification are some of the interventions that have been used to address this problem. Notwithstanding the recurring cost, the impact of supplementation and fortification in the develop- ing countries remains limited because of poor infrastructure and delivery system (Stein et al. 2005). Dietary diversification raises an issue of diverse food affordability since a sharp in- crease in food prices will have a large impact on poor house- holds. It also has problem of consumer acceptance in case dietary diversification calls for including foods which are not a part of conventional diets. Biofortification of staple crops, especially for mineral micronutrients, is a sustainable and cost-effective approach. It has great promise for improving the mineral nutritional status and health of poor populations in both rural and urban areas of the developing world (Bouis 2003). Biofortified cultivars of staple crops improved for mineral micronutrients are also readily acceptable to consumers as their adoption does not call for change in dietary habits. Pearl millet (Pennisetum glaucum (L.) R. Br.) is a major warm-season cereal grown on 28 million ha for grain and fodder production in some of the most marginal areas of * Correspondence: [email protected] 1 International Crops Research Institute for Semi-Arid Tropics (ICRISAT), Patancheru, Hyderabad 502324, Telangana, India Full list of author information is available at the end of the article a SpringerOpen Journal © 2014 Kanatti et al.; licensee Springer. This is an Open Access article distributed under the terms of the Creative Commons Attribution License (http://creativecommons.org/licenses/by/4.0), which permits unrestricted use, distribution, and reproduction in any medium, provided the original work is properly credited. Kanatti et al. SpringerPlus 2014, 3:763 http://www.springerplus.com/content/3/1/763
Transcript of RESEARCH Open Access Grain iron and zinc density in ... there exists a wealth of literature on...

a SpringerOpen Journal
Kanatti et al. SpringerPlus 2014, 3:763http://www.springerplus.com/content/3/1/763
RESEARCH Open Access
Grain iron and zinc density in pearl millet:combining ability, heterosis and association withgrain yield and grain sizeAnand Kanatti1,2, Kedar N Rai1*, Kommineni Radhika2, Mahalingam Govindaraj1, Kanwar L Sahrawat1
and Aluri S Rao1
Abstract
Genetics of micronutrients and their relationships with grain yield and other traits have a direct bearing on devisingeffective strategies for breeding biofortified crop cultivars. A line × tester study of 196 hybrids and their 28 parentallines of pearl millet (Pennisetum glaucum (L.) R.Br.) showed large genetic variability for Fe and Zn densities withpredominantly additive gene action and no better-parent heterosis. Hybrids with high levels of Fe and Zn densities,involved both parental lines having significant positive general combining ability (GCA), and there were highlysignificant and high positive correlations between performance per se of parental lines and their GCAs. Therewas highly significant and high positive correlation between the Fe and Zn densities, both for performance perse and GCA. Fe and Zn densities had highly significant and negative, albeit weak, correlations with grain yieldand highly significant and moderate positive correlation with grain weight in hybrids. These correlations, however,were non-significant in the parental lines. Thus, to breed hybrids with high Fe and Zn densities would require incorporatingthese micronutrients in both parental lines. Also, simultaneous selection for Fe and Zn densities based on performanceper se would be highly effective in selecting for GCA. Breeding for high Fe and Zn densities with large grain sizewill be highly effective. However, combining high levels of these micronutrients with high grain yield would requiregrowing larger breeding populations and progenies than breeding for grain yield alone, to make effective selection fordesirable recombinants.
Keywords: Pearl millet; Micronutrients; Grain yield; Genetic variability; Hybrids; Heterosis; Correlation
IntroductionMicronutrient malnutrition resulting from dietary defi-ciency of one or more micronutrients has been recog-nized as a serious human health problem worldwide.The most striking of these are iron (Fe) and zinc (Zn)deficiencies that rank 9th and 11th, respectively, amongthe top 20 risk factors contributing to global burden ofdisease (WHO 2002). Pharmaceutical supplementation,industrial fortification and dietary diversification aresome of the interventions that have been used to addressthis problem. Notwithstanding the recurring cost, theimpact of supplementation and fortification in the develop-ing countries remains limited because of poor infrastructure
* Correspondence: [email protected] Crops Research Institute for Semi-Arid Tropics (ICRISAT),Patancheru, Hyderabad 502324, Telangana, IndiaFull list of author information is available at the end of the article
© 2014 Kanatti et al.; licensee Springer. This is aAttribution License (http://creativecommons.orin any medium, provided the original work is p
and delivery system (Stein et al. 2005). Dietary diversificationraises an issue of diverse food affordability since a sharp in-crease in food prices will have a large impact on poor house-holds. It also has problem of consumer acceptance in casedietary diversification calls for including foods which are nota part of conventional diets. Biofortification of staple crops,especially for mineral micronutrients, is a sustainable andcost-effective approach. It has great promise for improvingthe mineral nutritional status and health of poor populationsin both rural and urban areas of the developing world (Bouis2003). Biofortified cultivars of staple crops improved formineral micronutrients are also readily acceptable toconsumers as their adoption does not call for changein dietary habits.Pearl millet (Pennisetum glaucum (L.) R. Br.) is a major
warm-season cereal grown on 28 million ha for grain andfodder production in some of the most marginal areas of
n Open Access article distributed under the terms of the Creative Commonsg/licenses/by/4.0), which permits unrestricted use, distribution, and reproductionroperly credited.

Kanatti et al. SpringerPlus 2014, 3:763 Page 2 of 12http://www.springerplus.com/content/3/1/763
the arid and semi-arid tropical regions of Asia and Africa.In these regions, pearl millet is a major source of dietaryenergy and mineral micronutrients. India is the largest pro-ducer of this crop with >9 million ha area and 8.5 milliontons of grain production (Yadav et al. 2012). The contribu-tion of pearl millet to the total Fe and Zn intake from allfood sources has been reported to very widely vary acrossrural India. For instance, it was observed to be contributing19-63% of the total Fe intake and 16-56% of the total Znintake in parts of Rajasthan, Maharashtra and Gujaratstates (Parthasarathy Rao et al. 2006). Large genetic vari-ability for Fe and Zn density observed in the breeding lines,improved populations and germplasm (Velu et al. 2007,2008a; Rai et al. 2012) provides for good prospects to breedimproved pearl millet cultivars with elevated levels of thesemicronutrients. The International Crops Research Institutefor the Semi-Arid Tropics (ICRISAT), supported by Har-vestPlus Challenge Program of the Consultative Group onInternational Agricultural Research (CGIAR), and in part-nership with the public and private sector breeding pro-gram in India, has undertaken a major initiative to develophigh-yielding hybrids with high levels of Fe and Zn densityin pearl millet.Pearl millet is a highly cross-pollinated crop with open-
pollinated varieties (OPVs) and hybrids as the two broadcultivar options. Hybrids are the most dominant cultivarsin India, occupying >70% of area under improved pearlmillet cultivars, with OPVs cultivated on limited scales. Apreliminary study showed about two-fold differencesfor Fe and Zn densities among pearl millet hybridsunder cultivation in India, with Fe density varying from31 to 61 mg kg−1 and Zn density varying from 32 to54 mg kg−1 (Rai et al. 2013). An understanding of thenature of genetic variability and heterosis will have adirect bearing on devising effective hybrid breedingstrategies for Fe and Zn density. There is limited infor-mation on genetic variability and heterosis for Fe andZn density in pearl millet (Velu et al. 2011b; Govindarajet al. 2013). While improving the Fe and Zn densities, it isimportant that genetic gains for these micronutrients arenot made at the expense of grain yield and grain size. Themain objective of this research was to examine the natureof genetic variability in relation to heterosis for Fe and Zndensity. Since, there exists a wealth of literature on geneticvariability and heterosis for grain yield and grain size(Khairwal et al. 1999), genetic variability and heterosis forthese two traits were studied in the specific context oftheir associations with Fe and Zn densities.
Material and methodsGenetic materialsFourteen maintainer lines (B-lines) used to as femaleparents (F), 14 restorer lines (R-lines) used as male par-ents (M), and 196 hybrids produced by F ×M crosses
during the 2010 summer season were included in thisstudy. The parental lines of the hybrids were of diverseparentage (Table 1) with wide range of Fe and Zn dens-ities, and differed for grain yield and various agronomictraits such as plant height, tillering, panicle size and1000-grain weight.
Field trialsThe hybrids and parents were planted on 17-July dur-ing the 2011 rainy season (July to October) and on24-January during 2012 summer season (January toApril) at ICRISAT, Patancheru. Monthly mean tempera-tures varied from 20°C to 31°C and relative humidity from50% to 93% during the rainy crop season. In the summercrop season, monthly mean temperatures varied from16°C to 40°C and relative humidity from 22% to 79%.Both trials were planted in randomized complete blockdesign (RCBD) with three replications but in adjacentblocks. Sowing was done by tractor-mounted 4-coneplanter (7100 US model). Each entry was planted intwo rows of 2 m length, spaced at 75 cm between rowsin rainy season and 60 cm in summer season. Over-planted plots were thinned 15 d after planting to singleplants spaced 15 cm apart within each row. A basaldose of 100 kg of diammonium phosphate (18% N and46% P) was applied at the time of field preparation and100 kg of urea (46% N) was applied as top dressingwithin 2 to 4 d after thinning. Fields were irrigated at 7to 10 d intervals in summer crop season and twice inrainy crop season to ensure no moisture stress. All therecommended agronomic practices were followed forgood crop growth. At the time of planting, four wellspread representative soil samples were collected fromthe experimental fields from 0–30 cm layer and laterbulked to prepare one composite sample for micronu-trient analysis.The plots of all the entries were harvested at or after
physiological maturity (85–90 days after planting). Dur-ing harvest, main panicles of five random plants fromeach plot were harvested and stored separately in a clothbag to produce clean grain samples for micronutrientanalysis. The remaining panicles of the plot were har-vested as a bulk. These panicles were sundried for 10 to15 days. While threshing, five separately harvested pani-cles mentioned above were manually threshed first andapproximately 20 g of grains were collected for Fe andZn analysis. The left over grains from these panicleswere added to the bulk grain produced by threshing allthe panicles of the plot in a multi-head machine thresher.The grain yield, including the 20 g sample taken formicronutrient analysis, was recorded for each plot andconverted to t ha−1for grain yield analysis. A random sam-ple of 200 grains for each entry was weighed to determine1000-grain weight.

Table 1 Parentage of inbred lines used in line (female) ×tester (male) study
IDa Female/Maleparentsb
Parentagec
Female parents
1 ICMB 88004 Togo-11-5-2 selection
2 ICMB 92111 (81B× 843B)-11-1-1-B
3 ICMB 92888 (843B× ICMPS 900-9-3-2-2)-41-2-6-2-2
4 ICMB 93222 (26B× 834B)-11-2-B-B
5 ICMB 97111 HTBC-48-B-1-1-1-1
6 ICMB 98222 ARD-288-1-10-1-2(RM)-5
7 ICMB 02555 ICMV 87901-175-2-3-2-B-1
8 ICMB 04888 [(843B× ICTP 8202-161-5)-20-3-B-B-3× B-linesbulk]-2-B-1-3
9 ICMB 05555 [(BSECBPT/91-39× SPF3/S91-116)-15-2-1-4-4×B-lines bulk]-1-B-4-1
10 ICMB 07555 [(843B× ICTP 8202-161-5)-20-3-B-B-3× B-linesbulk]-2-B-1
11 ICMB 07777 {ICMB 99555× [(78-7088/3/SER3 AD//B282/(3/4 EB) × PBLN/S95-359)-19-5-B-B]}-13-2-B-B-B-B
12 ICMB 07999 (HTBC-48-B-1-1-1-5× B-line bulk)-25-1-B-B
13 ICMB 08222 [78-7088/3/SER3 AD//B282/(3/4)EB× PBLN/S95-359]-19-2-B-1-B-B-3
14 ICMB 08333 [ICMB 97444× (843B× 405B)-4]-1-2-B-B-B
Male parents
15 PRP 1 (EERC-HS-29)-B-12-4-1-1
16 PRP 2 (EERC-HS-34)-B-7-2-3-2
17 PRP 3 LaGrap C2-S1-38-2-1-1-1
18 PRP 4 (MC 94 C2-S1-3-2-2-2-1-3-B-B× SDMV 90031S1-93-3-1-1-3-2-B-2)-B-23-2-2
19 PRP 5 AIMP 92901 S1-15-1-2-3-B-2-B-25-1-1
20 PRP 6 (MC 94 C2-S1-3-2-2-2-1-3-B-B× AIMP 92901S1-488-2-1-1-4-B-B)-B-8-3-1-3-B-B
21 PRP 7 Jakhrana × SRC II S2-215-3-2-1-B-3
22 PRP 8 (ICMS 7704-S1-127-5-1 × RCB-2 Tall )-B-19-3-2-1-1-1-B
23 PRP 9 MRC S1-9-2-2-B-B-4-B-B
24 IPC 616 [J 260-1× 700557-1-4-10-5-1]-1-2-1-3
25 IPC 843 [(J 834× 700516)]-1-4-4-2-4
26 IPC 1178 (A 836× J 1798-32-2-2)-5-1-1
27 IPC 1354 EICP 8103–5 (Duplicate 001349)
28 IPC 390 (F4FC 1498-1-1-3× J 104)-11-2-1-1aID 1–14 female lines (B lines) and 15–28 male lines (R lines); bICMBICRISAT Millet B-line; PRP Potential Restorer Parent; IPC ICRISAT PollinatorCollection; cICMPS ICRISAT Millet Pollinator for Smut resistance; HTBCHigh-Tillering B-Composite; ARD Appa Rao, Rai and Djaney; ICMV ICRISATMillet Variety; ICTP ICRISAT Togo Patancheru; BSECBPT Bold-Seeded EarlyComposite Best Population Progeny Trial; EB Ex-Bornu; SPF3 Seed Parent F3Progeny; PBLN Potential B-line Nursery; EERC Extra-Early Restorer Composite;LaGrap Large Grain Population; MC Medium Composite; SDMV SADCC MilletVariety; AIMP Aurangabad ICRISAT Millet Population; ICMS ICRISAT MilletSynthetic; MRC Mandor Restorer Composite; EICP Elite ICRISAT Pollinator.
Kanatti et al. SpringerPlus 2014, 3:763 Page 3 of 12http://www.springerplus.com/content/3/1/763
Micronutrient analysisGrain Fe and Zn densities were analyzed at the CharlesRenard Analytical Laboratory, ICRISAT, Patancheru, Indiafollowing the method described by Wheal et al. (2011).The ground samples were digested in closed tubes; and Feand Zn in the digests were analyzed using InductivelyCoupled Plasma Optical Emission Spectrometry (ICP-OES). Briefly, grain samples were finely ground and ovendried at 60°C for 48 h before analyzing them for Fe andZn. Ground sample (0.2 g) was transferred to 25 mL poly-prophelene PPT tubes; digestion was initiated by adding2.0 mL of concentrated nitric acid (HNO3) and 0.5 mL of30% hydrogen peroxide (H202). Tubes were vortexed toensure the entire sample was wetted, and then pre-digested overnight at room temperature. Tubes were vor-texed again before placing them into the digestion blockand initially heated at 80°C for 1 hour, followed by digest-ing at 120°C for 2 hours. After digestion, the volume ofthe digest was made to 25 mL using distilled water; andthe content was agitated for 1 minute by vortex mixer.The digests were filtered and Fe and Zn densities were de-termined using ICP-OES. Care was taken at each step toavoid any contamination of the grains with dust particlesand any other extraneous matter (Stangoulis and Sison2008). The soil samples were analyzed for extractable Feand Zn content by Atomic Absorption Spectroscopy(AAS) as described by Lindsay and Norvell (1978). Themean soil Fe and Zn contents extractable with DiethyleneTriamine Pentaacetic Acid (DTPA) were respectively, 13.0and 7.2 mg kg−1 in the rainy season, and 12.1 and 4.5 mgkg−1in the summer season. These Fe and Zn contents inthe soil were far above the critical levels required byplants (2.6 to 4.5 mg kg−1 for Fe content, and 0.6 to1.0 mg kg−1 for Zn content) (Tisdale et al. 1993; Sahrawatand Wani 2013).
Statistical analysisAll the data were analyzed using Statistical AnalysisSystems (SAS) version 9.2 (SAS Institute Inc. 2004).ANOVA for individual environments and pooled ANOVAover the two environments were performed usingGeneralized Linear Model procedures following arandom-effects model (Steel and Torrie 1980; Hallauerand Miranda 1981; McIntosh 1983). All effects wereconsidered as random in the combined analysis ofvariance and Satterthwaite’s approximation was usedto obtain the appropriate degrees of freedom for thesynthesized F-test (Satterthwaite 1941, 1946). Line ×tester model for female ×male hybrid (Kempthorne 1957)was used to obtain estimates of general combining ability(GCA) for male and female parents as well as specificcombining ability (SCA) effects for hybrids. From the ana-lysis of combining ability ANOVA, variances attributed togeneral combining ability (σ2GCA) and specific combining
Kanatti et al. SpringerPlus 2014, 3:763 Page 4 of 12http://www.springerplus.com/content/3/1/763
ability (σ2SCA) were derived (Kaushik et al. 1984) to estimatethe predictability ratio 2σ2GCA/(2σ
2GCA + σ2SCA) following
Baker (1978). The estimates of mid-parent heterosis(MPH) and better-parent heterosis (BPH) were derived forindividual environments as well as for the mean of twoenvironments following Hallauer and Miranda (1981).The tests of significance for MPH and BPH were done via“t” test. The Pearson correlation coefficient among thetraits was calculated using the PROC CORR procedure.
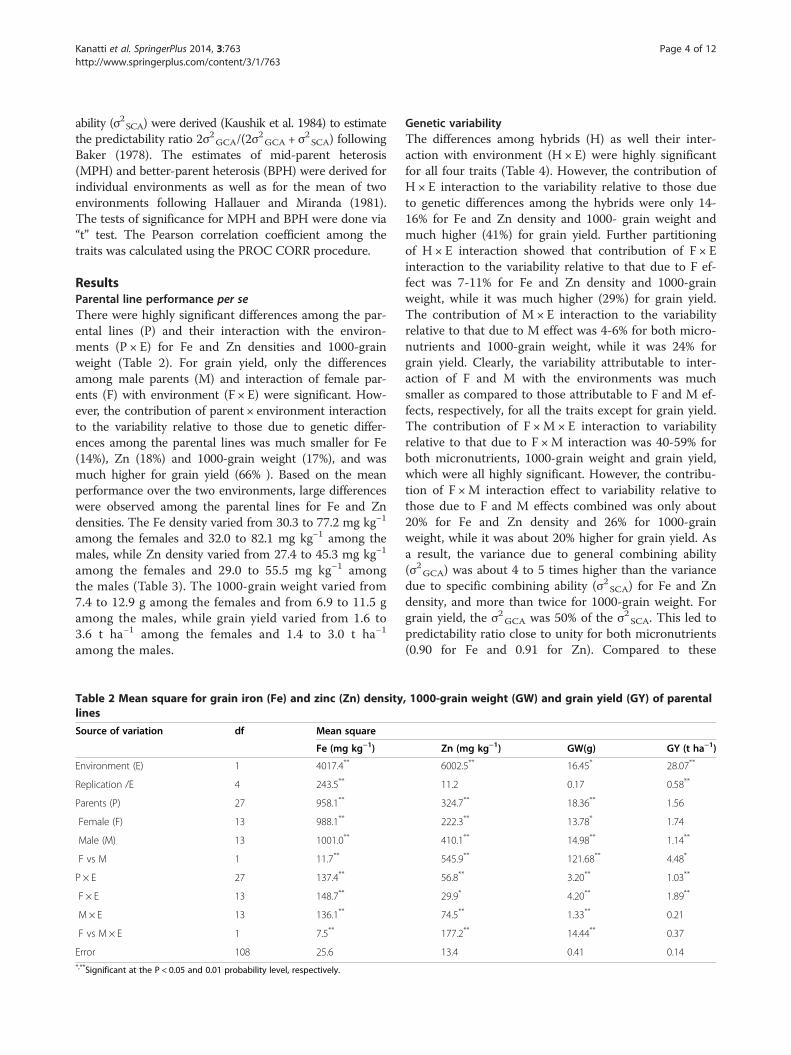
ResultsParental line performance per seThere were highly significant differences among the par-ental lines (P) and their interaction with the environ-ments (P × E) for Fe and Zn densities and 1000-grainweight (Table 2). For grain yield, only the differencesamong male parents (M) and interaction of female par-ents (F) with environment (F × E) were significant. How-ever, the contribution of parent × environment interactionto the variability relative to those due to genetic differ-ences among the parental lines was much smaller for Fe(14%), Zn (18%) and 1000-grain weight (17%), and wasmuch higher for grain yield (66% ). Based on the meanperformance over the two environments, large differenceswere observed among the parental lines for Fe and Zndensities. The Fe density varied from 30.3 to 77.2 mg kg−1
among the females and 32.0 to 82.1 mg kg−1 among themales, while Zn density varied from 27.4 to 45.3 mg kg−1
among the females and 29.0 to 55.5 mg kg−1 amongthe males (Table 3). The 1000-grain weight varied from7.4 to 12.9 g among the females and from 6.9 to 11.5 gamong the males, while grain yield varied from 1.6 to3.6 t ha−1 among the females and 1.4 to 3.0 t ha−1
among the males.
Table 2 Mean square for grain iron (Fe) and zinc (Zn) densitylines
Source of variation df Mean square
Fe (mg kg−1)
Environment (E) 1 4017.4**
Replication /E 4 243.5**
Parents (P) 27 958.1**
Female (F) 13 988.1**
Male (M) 13 1001.0**
F vs M 1 11.7**
P × E 27 137.4**
F × E 13 148.7**
M × E 13 136.1**
F vs M × E 1 7.5**
Error 108 25.6*,**Significant at the P < 0.05 and 0.01 probability level, respectively.
Genetic variabilityThe differences among hybrids (H) as well their inter-action with environment (H × E) were highly significantfor all four traits (Table 4). However, the contribution ofH × E interaction to the variability relative to those dueto genetic differences among the hybrids were only 14-16% for Fe and Zn density and 1000- grain weight andmuch higher (41%) for grain yield. Further partitioningof H × E interaction showed that contribution of F × Einteraction to the variability relative to that due to F ef-fect was 7-11% for Fe and Zn density and 1000-grainweight, while it was much higher (29%) for grain yield.The contribution of M × E interaction to the variabilityrelative to that due to M effect was 4-6% for both micro-nutrients and 1000-grain weight, while it was 24% forgrain yield. Clearly, the variability attributable to inter-action of F and M with the environments was muchsmaller as compared to those attributable to F and M ef-fects, respectively, for all the traits except for grain yield.The contribution of F ×M × E interaction to variabilityrelative to that due to F ×M interaction was 40-59% forboth micronutrients, 1000-grain weight and grain yield,which were all highly significant. However, the contribu-tion of F ×M interaction effect to variability relative tothose due to F and M effects combined was only about20% for Fe and Zn density and 26% for 1000-grainweight, while it was about 20% higher for grain yield. Asa result, the variance due to general combining ability(σ2GCA) was about 4 to 5 times higher than the variancedue to specific combining ability (σ2SCA) for Fe and Zndensity, and more than twice for 1000-grain weight. Forgrain yield, the σ2GCA was 50% of the σ2SCA. This led topredictability ratio close to unity for both micronutrients(0.90 for Fe and 0.91 for Zn). Compared to these
, 1000-grain weight (GW) and grain yield (GY) of parental
Zn (mg kg−1) GW(g) GY (t ha−1)
6002.5** 16.45* 28.07**
11.2 0.17 0.58**
324.7** 18.36** 1.56
222.3** 13.78* 1.74
410.1** 14.98** 1.14**
545.9** 121.68** 4.48*
56.8** 3.20** 1.03**
29.9* 4.20** 1.89**
74.5** 1.33** 0.21
177.2** 14.44** 0.37
13.4 0.41 0.14
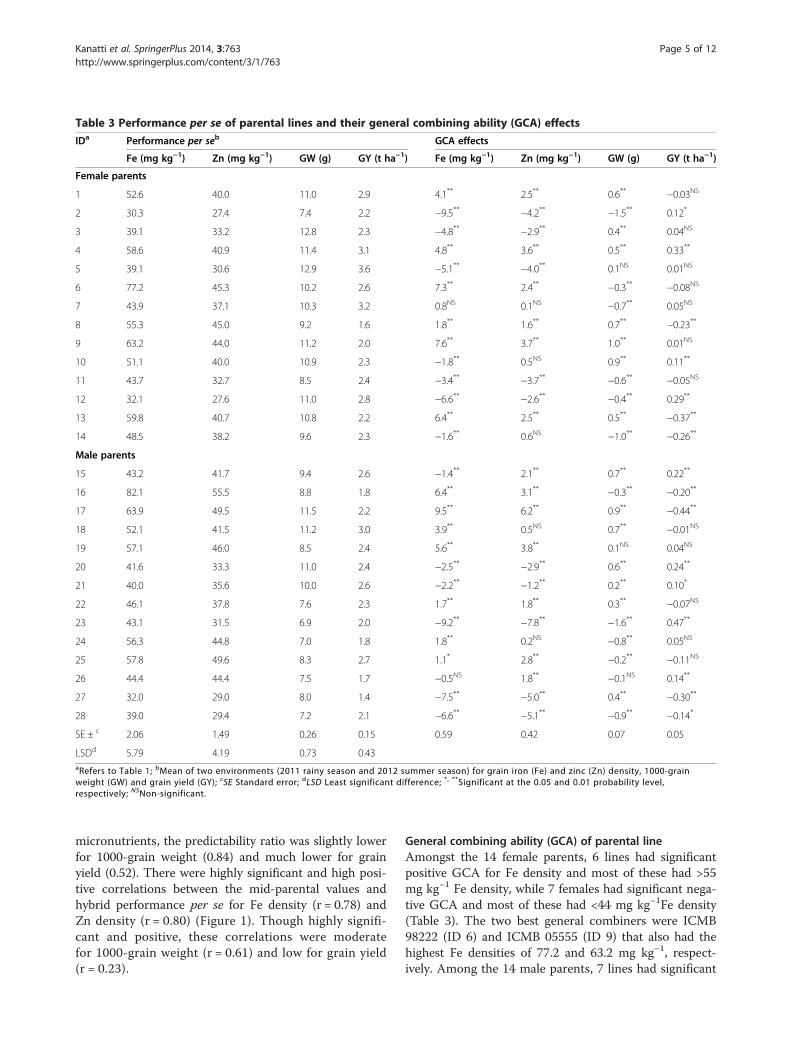
Table 3 Performance per se of parental lines and their general combining ability (GCA) effects
IDa Performance per seb GCA effects
Fe (mg kg−1) Zn (mg kg−1) GW (g) GY (t ha−1) Fe (mg kg−1) Zn (mg kg−1) GW (g) GY (t ha−1)
Female parents
1 52.6 40.0 11.0 2.9 4.1** 2.5** 0.6** −0.03NS
2 30.3 27.4 7.4 2.2 −9.5** −4.2** −1.5** 0.12*
3 39.1 33.2 12.8 2.3 −4.8** −2.9** 0.4** 0.04NS
4 58.6 40.9 11.4 3.1 4.8** 3.6** 0.5** 0.33**
5 39.1 30.6 12.9 3.6 −5.1** −4.0** 0.1NS 0.01NS
6 77.2 45.3 10.2 2.6 7.3** 2.4** −0.3** −0.08NS
7 43.9 37.1 10.3 3.2 0.8NS 0.1NS −0.7** 0.05NS
8 55.3 45.0 9.2 1.6 1.8** 1.6** 0.7** −0.23**
9 63.2 44.0 11.2 2.0 7.6** 3.7** 1.0** 0.01NS
10 51.1 40.0 10.9 2.3 −1.8** 0.5NS 0.9** 0.11**
11 43.7 32.7 8.5 2.4 −3.4** −3.7** −0.6** −0.05NS
12 32.1 27.6 11.0 2.8 −6.6** −2.6** −0.4** 0.29**
13 59.8 40.7 10.8 2.2 6.4** 2.5** 0.5** −0.37**
14 48.5 38.2 9.6 2.3 −1.6** 0.6NS −1.0** −0.26**
Male parents
15 43.2 41.7 9.4 2.6 −1.4** 2.1** 0.7** 0.22**
16 82.1 55.5 8.8 1.8 6.4** 3.1** −0.3** −0.20**
17 63.9 49.5 11.5 2.2 9.5** 6.2** 0.9** −0.44**
18 52.1 41.5 11.2 3.0 3.9** 0.5NS 0.7** −0.01NS
19 57.1 46.0 8.5 2.4 5.6** 3.8** 0.1NS 0.04NS
20 41.6 33.3 11.0 2.4 −2.5** −2.9** 0.6** 0.24**
21 40.0 35.6 10.0 2.6 −2.2** −1.2** 0.2** 0.10*
22 46.1 37.8 7.6 2.3 1.7** 1.8** 0.3** −0.07NS
23 43.1 31.5 6.9 2.0 −9.2** −7.8** −1.6** 0.47**
24 56.3 44.8 7.0 1.8 1.8** 0.2NS −0.8** 0.05NS
25 57.8 49.6 8.3 2.7 1.1* 2.8** −0.2** −0.11NS
26 44.4 44.4 7.5 1.7 −0.5NS 1.8** −0.1NS 0.14**
27 32.0 29.0 8.0 1.4 −7.5** −5.0** 0.4** −0.30**
28 39.0 29.4 7.2 2.1 −6.6** −5.1** −0.9** −0.14*
SE ± c 2.06 1.49 0.26 0.15 0.59 0.42 0.07 0.05
LSDd 5.79 4.19 0.73 0.43aRefers to Table 1; bMean of two environments (2011 rainy season and 2012 summer season) for grain iron (Fe) and zinc (Zn) density, 1000-grainweight (GW) and grain yield (GY); cSE Standard error; dLSD Least significant difference; *, **Significant at the 0.05 and 0.01 probability level,respectively; NSNon-significant.
Kanatti et al. SpringerPlus 2014, 3:763 Page 5 of 12http://www.springerplus.com/content/3/1/763
micronutrients, the predictability ratio was slightly lowerfor 1000-grain weight (0.84) and much lower for grainyield (0.52). There were highly significant and high posi-tive correlations between the mid-parental values andhybrid performance per se for Fe density (r = 0.78) andZn density (r = 0.80) (Figure 1). Though highly signifi-cant and positive, these correlations were moderatefor 1000-grain weight (r = 0.61) and low for grain yield(r = 0.23).
General combining ability (GCA) of parental lineAmongst the 14 female parents, 6 lines had significantpositive GCA for Fe density and most of these had >55mg kg−1 Fe density, while 7 females had significant nega-tive GCA and most of these had <44 mg kg−1Fe density(Table 3). The two best general combiners were ICMB98222 (ID 6) and ICMB 05555 (ID 9) that also had thehighest Fe densities of 77.2 and 63.2 mg kg−1, respect-ively. Among the 14 male parents, 7 lines had significant

Table 4 Mean square for hybrids and genetic components
Source of variation df Mean squarea
Fe (mg kg−1) Zn (mg kg−1) GW(g) GY (t ha−1)
Environment (E) 1 22524.5** 48885.5** 313.2** 25.12**
Replication/E 4 62.6 858.3** 9.1** 19.26**
Hybrids (H) 195 401.7** 164.7** 7.7** 1.15**
Female (F) 13 2574.9** 720.9** 48.6** 3.27*
Male (M) 13 2470.6** 1325** 42.9** 4.66**
F × M 169 77.0** 32.9** 1.8** 0.72**
H × E 195 55.4** 26.2** 1.1** 0.47**
F × E 13 174.8** 62.3** 5.3** 0.93**
M × E 13 111.9** 72.9** 2.1** 1.12**
F × M × E 169 41.6** 19.7* 0.7** 0.38**
Error 780 29.5 15.1 0.4 0.25
Genetic components
σ 2GCA
b 27.9 11.2 0.49 0.03
σ 2SCA
c 5.9 2.2 0.18 0.06
PR = (2σ 2GCA)/(2σ 2
GCA + σ2SCA) 0.90 0.91 0.84 0.52aGrain iron (Fe) and zinc (Zn) density, 1000-grain weight (GW) and grain yield (GY); bσ 2
GCA Variance attributed to general combining ability; cσ 2SCA Variance
attributed to specific combining ability; PR Predictability ratio; *,**Significant at the 0.05 and 0.01 probability level, respectively.
Kanatti et al. SpringerPlus 2014, 3:763 Page 6 of 12http://www.springerplus.com/content/3/1/763
positive GCA and most of these had >56 mg kg−1Fedensity, while 6 lines had significant negative GCA andall these had <44 mg kg−1 Fe density. The two bestgeneral combiners were PRP 3 (ID 17) and PRP 2 (ID16) that also had the highest Fe densities of 63.9 and82.1 mg kg−1, respectively. Female and male lines con-sidered together, there was highly significant and highpositive correlation between the Fe density of paren-tal lines per se and their GCA for this trait (r = 0.86;
20
30
40
50
60
70
80
90
20 30 40
Mid-parent Fe and Z
Hyb
rid
Fe
and
Zn
dens
itie
s (m
g kg
-1)
Figure 1 Relationship between mid-parental and hybrid values. Mean
p <0.01). Broadly similar patterns were observed forthe Zn density. Thus, 6 female parents had significantand positive GCA and all these females had ≥40 mgkg−1 Zn density, while 5 female parents had signifi-cant negative GCA and all these females had <34 mgkg−1 Zn density. Seven male parents had significant andpositive GCA and most of these had >41 mg kg−1Zn dens-ity, while 5 male parents had significant negative GCAand all of these had <36 mg kg−1 Zn density. There was
50 60 70
n densities (mg kg-1)
FeZn
- - - - - - - - - -___________
of two environment for grain iron (Fe) and zinc (Zn) densities.
Kanatti et al. SpringerPlus 2014, 3:763 Page 7 of 12http://www.springerplus.com/content/3/1/763
highly significant and high positive correlation betweenthe Zn density of parental lines per se and their GCA forthis trait as well (r = 0.85; p <0.01). Such a strong relation-ship between the performance per se of the parental linesand their GCA was not observed for 1000-grain weight(r = 0.59) and there was no significant correlation be-tween these two performance parameters for grain yield.
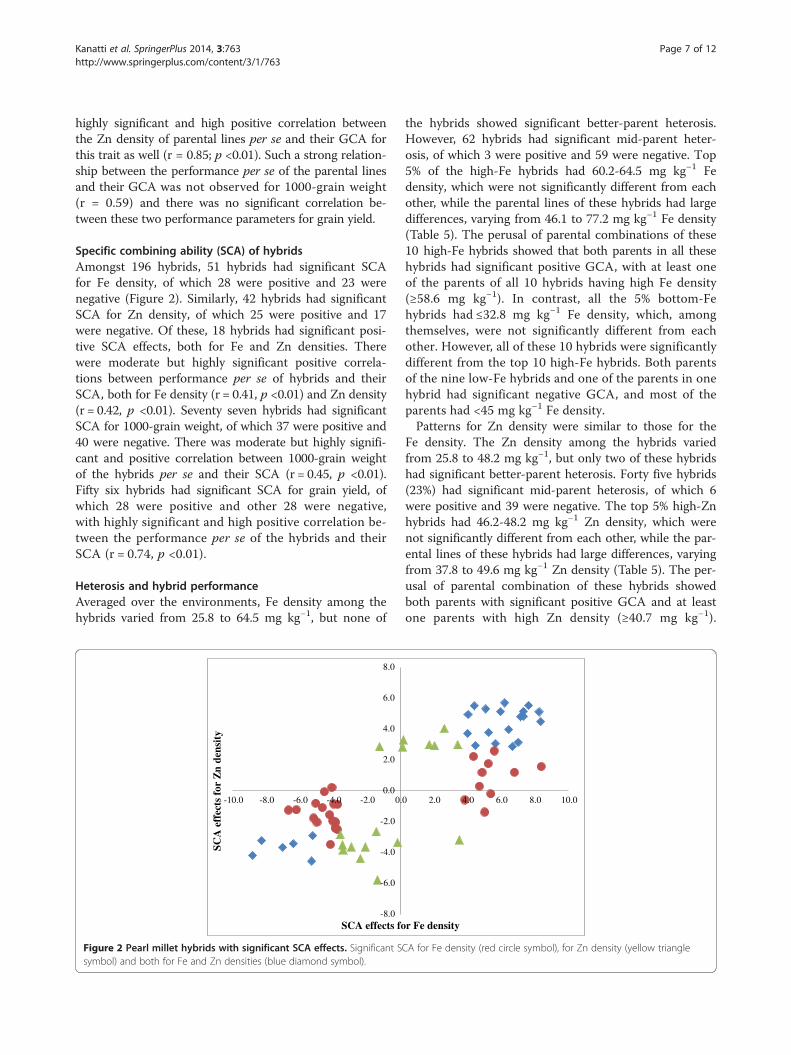
Specific combining ability (SCA) of hybridsAmongst 196 hybrids, 51 hybrids had significant SCAfor Fe density, of which 28 were positive and 23 werenegative (Figure 2). Similarly, 42 hybrids had significantSCA for Zn density, of which 25 were positive and 17were negative. Of these, 18 hybrids had significant posi-tive SCA effects, both for Fe and Zn densities. Therewere moderate but highly significant positive correla-tions between performance per se of hybrids and theirSCA, both for Fe density (r = 0.41, p <0.01) and Zn density(r = 0.42, p <0.01). Seventy seven hybrids had significantSCA for 1000-grain weight, of which 37 were positive and40 were negative. There was moderate but highly signifi-cant and positive correlation between 1000-grain weightof the hybrids per se and their SCA (r = 0.45, p <0.01).Fifty six hybrids had significant SCA for grain yield, ofwhich 28 were positive and other 28 were negative,with highly significant and high positive correlation be-tween the performance per se of the hybrids and theirSCA (r = 0.74, p <0.01).
Heterosis and hybrid performanceAveraged over the environments, Fe density among thehybrids varied from 25.8 to 64.5 mg kg−1, but none of
-8.0
-6.0
-4.0
-2.0
0.0
2.0
4.0
6.0
8.0
-10.0 -8.0 -6.0 -4.0 -2.0 0.
SCA
eff
ects
for
Zn
dens
ity
SCA effects fo
Figure 2 Pearl millet hybrids with significant SCA effects. Significant Ssymbol) and both for Fe and Zn densities (blue diamond symbol).
the hybrids showed significant better-parent heterosis.However, 62 hybrids had significant mid-parent heter-osis, of which 3 were positive and 59 were negative. Top5% of the high-Fe hybrids had 60.2-64.5 mg kg−1 Fedensity, which were not significantly different from eachother, while the parental lines of these hybrids had largedifferences, varying from 46.1 to 77.2 mg kg−1 Fe density(Table 5). The perusal of parental combinations of these10 high-Fe hybrids showed that both parents in all thesehybrids had significant positive GCA, with at least oneof the parents of all 10 hybrids having high Fe density(≥58.6 mg kg−1). In contrast, all the 5% bottom-Fehybrids had ≤32.8 mg kg−1 Fe density, which, amongthemselves, were not significantly different from eachother. However, all of these 10 hybrids were significantlydifferent from the top 10 high-Fe hybrids. Both parentsof the nine low-Fe hybrids and one of the parents in onehybrid had significant negative GCA, and most of theparents had <45 mg kg−1 Fe density.Patterns for Zn density were similar to those for the
Fe density. The Zn density among the hybrids variedfrom 25.8 to 48.2 mg kg−1, but only two of these hybridshad significant better-parent heterosis. Forty five hybrids(23%) had significant mid-parent heterosis, of which 6were positive and 39 were negative. The top 5% high-Znhybrids had 46.2-48.2 mg kg−1 Zn density, which werenot significantly different from each other, while the par-ental lines of these hybrids had large differences, varyingfrom 37.8 to 49.6 mg kg−1 Zn density (Table 5). The per-usal of parental combination of these hybrids showedboth parents with significant positive GCA and at leastone parents with high Zn density (≥40.7 mg kg−1).
0 2.0 4.0 6.0 8.0 10.0
r Fe density
CA for Fe density (red circle symbol), for Zn density (yellow triangle

Table 5 Performance per se of hybrids and parental lines, and GCA of parents for 5% top and 5% bottom rankinghybrids
Fe (mg kg−1) Zn (mg kg−1)
Hybrida Performance per seb GCAc Hybrida Performance per seb GCAc
P1 P2 F1 P1 P2 P1 P2 P1 P2 F1 P1 P2 P1 P2
Top 5% hybrids
13 × 19 64.5 59.8 57.1 6.4** 5.6** 4 × 22 48.2 40.9 37.8 3.6** 1.8**
6 × 19 63.8 77.2 57.1 7.3** 5.6** 13 × 19 48.1 40.7 46.0 2.5** 3.8**
6 × 17 63.3 77.2 63.9 7.3** 9.5** 8 × 17 47.9 45.0 49.5 1.6** 6.2**
13 × 17 63.1 59.8 63.9 6.4** 9.5** 1 × 25 46.9 40.0 49.6 2.5** 2.8**
9 × 17 61.3 63.2 63.9 7.6** 9.5** 13 × 22 46.8 40.7 37.8 2.5** 1.8**
9 × 22 61.2 63.2 46.1 7.6** 1.7** 9 × 17 46.7 44.0 49.5 3.7** 6.2**
6 × 18 61.2 77.2 52.1 7.3** 3.9** 13 × 17 46.5 40.7 49.5 2.5** 6.2**
4 × 17 61.1 58.6 63.9 4.8** 9.5** 6 × 17 46.5 45.3 49.5 2.4** 6.2**
13 × 18 60.9 59.8 52.1 6.4** 3.9** 4 × 17 46.4 40.9 49.5 3.6** 6.2**
6 × 25 60.2 77.2 57.8 7.3** 1.1* 6 × 25 46.2 45.3 49.6 2.4** 2.8**
Bottom 5% hybrids
5 × 23 32.8 39.1 43.1 −5.1** −9.2** 5 × 28 28.1 30.6 29.4 −4.0** −5.1**
2 × 20 31.8 30.3 41.6 −9.5** −2.5** 5 × 27 27.8 30.6 29.0 −4.0** −5.0**
14 × 23 31.7 48.5 43.1 −1.6** −9.2** 3 × 23 27.5 33.2 31.5 −2.9** −7.8**
10 × 28 30.7 51.1 39.0 −1.8** −6.6** 11 × 23 27.4 32.7 31.5 −3.7** −7.8**
2 × 28 30.6 30.3 39.0 −9.5** −6.6** 2 × 28 27.2 27.4 29.4 −4.2** −5.1**
3 × 27 30.5 39.1 32.0 −4.8** −7.5** 12 × 23 26.8 27.6 31.5 −2.6** −7.8**
2 × 27 30.5 30.3 32.0 −9.5** −7.5** 3 × 27 26.7 33.2 29.0 −2.9** −5.0**
12 × 27 29.7 32.1 32.0 −6.6** −7.5** 5 × 23 26.2 30.6 31.5 −4.0** −7.8**
2 × 22 29.2 30.3 46.1 −9.5** 1.7** 2 × 23 25.9 27.4 31.5 −4.2** −7.8**
2 × 23 25.8 30.3 43.1 −9.5** −9.2** 7 × 23 25.8 37.1 31.5 0.1NS −7.8**
SE ±d 2.22 2.06 2.06 0.59 0.59 1.59 1.49 1.49 0.42 0.42
LSDe 6.16 5.79 5.79 4.40 4.19 4.19a1-28 ID of inbred lines detailed in the Table 1; bMean performance at two environments (2011 rainy season and 2012 summer season) for grain iron (Fe) and zinc(Zn) density. cGCA General combining ability effects; dSE Standard error; eLSD Least significant difference; * , **Significant at the 0.05 and 0.01 probability level,respectively; NSNon-significant.
Kanatti et al. SpringerPlus 2014, 3:763 Page 8 of 12http://www.springerplus.com/content/3/1/763
Conversely, 5% bottom-Zn hybrids had low range ofZn density (25.8-28.1 mg kg−1), which, among them-selves, were not significantly different from each other.However, all of these were significantly different fromthe top 5% high-Zn hybrids. Both parents of the nine low-Zn hybrids and one parent in one hybrid had significantnegative GCA. The 1000-grain weight of hybrids variedfrom 8.8 to 14.3 g with significant better- parent heterosisobserved in 110 hybrids. Similarly, grain yield of hybridsvaried from 2.3 to 5.0 t ha−1, with significant better-parentheterosis observed in 178 hybrids.
Character associationThere was a highly significant and high positive correl-ation (r = 0.88, p <0.01) between the Fe and Zn densityin the parental lines as well as in the hybrids (Table 6).Neither Fe nor Zn densities were correlated with grain
yield or with 1000-grain weight in the parental lines.However, both micronutrients had highly significantand moderate positive correlation with 1000-grain weight(r = 0.42 and 0.43, p <0.01) and significant but weeknegative correlation with grain yield (r = −0.29 and −0.26,p <0.01) in the hybrids. Highly significant and moderatepositive correlation between 1000-grain weight and grainyield was observed in the parental lines (r = 0.58, p <0.01),but it was not significant in hybrids. Interestingly, highlysignificant and high positive correlation was observed be-tween the GCA of Fe and GCA of Zn density in parentallines (r = 0.91, p <0.01), and SCA of Fe and SCA of Zndensity in hybrids (r = 0.71, p <0.01). Moderate and highlysignificant positive correlation was observed betweenthe GCA of 1000-grain weight and Fe density (r =0.51, p <0.01) and between the GCA of 1000-grainweight and Zn density (r = 0.54, p <0.01). The GCA of
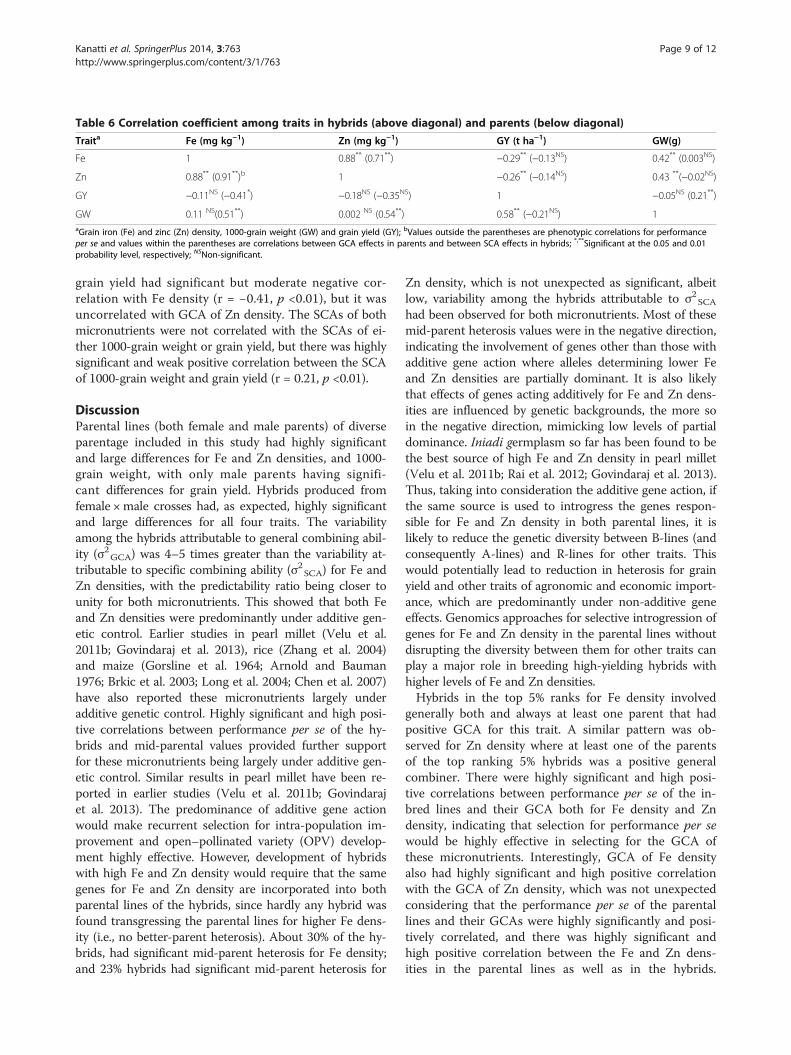
Table 6 Correlation coefficient among traits in hybrids (above diagonal) and parents (below diagonal)
Traita Fe (mg kg−1) Zn (mg kg−1) GY (t ha−1) GW(g)
Fe 1 0.88** (0.71**) −0.29** (−0.13NS) 0.42** (0.003NS)
Zn 0.88** (0.91**)b 1 −0.26** (−0.14NS) 0.43 **(−0.02NS)
GY −0.11NS (−0.41*) −0.18NS (−0.35NS) 1 −0.05NS (0.21**)
GW 0.11 NS(0.51**) 0.002 NS (0.54**) 0.58** (−0.21NS) 1aGrain iron (Fe) and zinc (Zn) density, 1000-grain weight (GW) and grain yield (GY); bValues outside the parentheses are phenotypic correlations for performanceper se and values within the parentheses are correlations between GCA effects in parents and between SCA effects in hybrids; *,**Significant at the 0.05 and 0.01probability level, respectively; NSNon-significant.
Kanatti et al. SpringerPlus 2014, 3:763 Page 9 of 12http://www.springerplus.com/content/3/1/763
grain yield had significant but moderate negative cor-relation with Fe density (r = −0.41, p <0.01), but it wasuncorrelated with GCA of Zn density. The SCAs of bothmicronutrients were not correlated with the SCAs of ei-ther 1000-grain weight or grain yield, but there was highlysignificant and weak positive correlation between the SCAof 1000-grain weight and grain yield (r = 0.21, p <0.01).
DiscussionParental lines (both female and male parents) of diverseparentage included in this study had highly significantand large differences for Fe and Zn densities, and 1000-grain weight, with only male parents having signifi-cant differences for grain yield. Hybrids produced fromfemale ×male crosses had, as expected, highly significantand large differences for all four traits. The variabilityamong the hybrids attributable to general combining abil-ity (σ2GCA) was 4–5 times greater than the variability at-tributable to specific combining ability (σ2SCA) for Fe andZn densities, with the predictability ratio being closer tounity for both micronutrients. This showed that both Feand Zn densities were predominantly under additive gen-etic control. Earlier studies in pearl millet (Velu et al.2011b; Govindaraj et al. 2013), rice (Zhang et al. 2004)and maize (Gorsline et al. 1964; Arnold and Bauman1976; Brkic et al. 2003; Long et al. 2004; Chen et al. 2007)have also reported these micronutrients largely underadditive genetic control. Highly significant and high posi-tive correlations between performance per se of the hy-brids and mid-parental values provided further supportfor these micronutrients being largely under additive gen-etic control. Similar results in pearl millet have been re-ported in earlier studies (Velu et al. 2011b; Govindarajet al. 2013). The predominance of additive gene actionwould make recurrent selection for intra-population im-provement and open–pollinated variety (OPV) develop-ment highly effective. However, development of hybridswith high Fe and Zn density would require that the samegenes for Fe and Zn density are incorporated into bothparental lines of the hybrids, since hardly any hybrid wasfound transgressing the parental lines for higher Fe dens-ity (i.e., no better-parent heterosis). About 30% of the hy-brids, had significant mid-parent heterosis for Fe density;and 23% hybrids had significant mid-parent heterosis for
Zn density, which is not unexpected as significant, albeitlow, variability among the hybrids attributable to σ2SCAhad been observed for both micronutrients. Most of thesemid-parent heterosis values were in the negative direction,indicating the involvement of genes other than those withadditive gene action where alleles determining lower Feand Zn densities are partially dominant. It is also likelythat effects of genes acting additively for Fe and Zn dens-ities are influenced by genetic backgrounds, the more soin the negative direction, mimicking low levels of partialdominance. Iniadi germplasm so far has been found to bethe best source of high Fe and Zn density in pearl millet(Velu et al. 2011b; Rai et al. 2012; Govindaraj et al. 2013).Thus, taking into consideration the additive gene action, ifthe same source is used to introgress the genes respon-sible for Fe and Zn density in both parental lines, it islikely to reduce the genetic diversity between B-lines (andconsequently A-lines) and R-lines for other traits. Thiswould potentially lead to reduction in heterosis for grainyield and other traits of agronomic and economic import-ance, which are predominantly under non-additive geneeffects. Genomics approaches for selective introgression ofgenes for Fe and Zn density in the parental lines withoutdisrupting the diversity between them for other traits canplay a major role in breeding high-yielding hybrids withhigher levels of Fe and Zn densities.Hybrids in the top 5% ranks for Fe density involved
generally both and always at least one parent that hadpositive GCA for this trait. A similar pattern was ob-served for Zn density where at least one of the parentsof the top ranking 5% hybrids was a positive generalcombiner. There were highly significant and high posi-tive correlations between performance per se of the in-bred lines and their GCA both for Fe density and Zndensity, indicating that selection for performance per sewould be highly effective in selecting for the GCA ofthese micronutrients. Interestingly, GCA of Fe densityalso had highly significant and high positive correlationwith the GCA of Zn density, which was not unexpectedconsidering that the performance per se of the parentallines and their GCAs were highly significantly and posi-tively correlated, and there was highly significant andhigh positive correlation between the Fe and Zn dens-ities in the parental lines as well as in the hybrids.
Kanatti et al. SpringerPlus 2014, 3:763 Page 10 of 12http://www.springerplus.com/content/3/1/763
Similar relationships between these micronutrients havebeen reported in earlier studies on pearl millet (Veluet al. 2008a, 2008b; Gupta et al. 2009; Rai et al. 2012;Govindaraj et al. 2013), and in other cereals, such as sor-ghum (Ashok Kumar et al. 2010, 2013), maize (Arnoldet al. 1977; Oikeh et al. 2003, 2004), rice (Stangouliset al. 2007; Anandan et al. 2011), wheat (Garvin et al.2006; Peleg et al. 2009; Zhang et al. 2010; Velu et al.2011a), and finger millet (Upadhyaya et al. 2011). Gen-omic studies in wheat (Peleg et al. 2009; Singh et al.2010), rice (Stangoulis et al. 2007), common bean (Cichyet al. 2009; Blair et al. 2009) and pearl millet (Kumar2011) have identified common and overlapping quantita-tive trait loci (QTL) for Fe and Zn densities. Thus, thepatterns for Fe and Zn densities were similar whether itis with respect to the nature of genetic variability andheterosis, or with respect to the relationship betweenthe parental lines and their GCA. This could likely resultfrom similar physiological processes involved at one ormore stages from soil uptake to loading in the grains,and tight linkage of some of the genes contributing tothe major part of genetic variability for these micronutri-ents. It would appear that effective simultaneous selec-tion for Fe and Zn densities in pearl millet can be madewith respect to all these performance parameters, andapplication of genomics tools can significantly acceleratethis process.High predictability ratio and highly significant and high
positive correlation between the mid-parental values andhybrid performance was indicative of predominantly addi-tive genetic variation for 1000-grain weight. In contrast,moderate predictability ratio and low, though signifi-cant, correlation between the mid-parental values andhybrid performance was indicative of predominantlynon-additive genetic variation for grain yield. Severalstudies in pearl millet have reported predominantlyadditive genetic variability for 1000-grain weight and pre-dominantly non-additive genetic variability for grain yield(Khairwal et al. 1999). The relative importance of additiveand non-additive variation for these two traits were alsoreflected in heterosis patterns as 56% of the hybrids hadsignificant better-parent heterosis with highly significantbut moderate correlation between the hybrid performanceper se and SCA for 1000-grain weight. In comparison,91% hybrids showed significant better-parent heterosis forgrain yield and there was highly significant and high posi-tive correlation between the performance of hybrids per seand their SCA.Both Fe and Zn densities were not correlated either
with 1000-grain weight or with grain yield in the paren-tal lines, which indicates that parental lines with high Feand Zn density can be developed without compromisingon grain size and grain yield. In hybrids, however, Feand Zn densities had a highly significant and moderate
positive correlation with 1000-grain weight. While someof the earlier studies in pearl millet (Velu et al. 2007,2008a, 2008b) have reported significant positive correl-ation of Fe and Zn with 1000-grain weight, other studieshave reported no correlation of Fe and Zn densities with1000-grain weight ( Gupta et al. 2009; Rai et al. 2012).This indicated that high Fe and Zn densities can be eas-ily combined with large grain size. The Fe and Zn densitieshad highly significant though weak negative correlationwith grain yield. Earlier studies in pearl millet hybrids (Raiet al. 2012), wheat (Garvin et al. 2006; Morgounov et al.2007; Shi et al. 2008; Zhao et al. 2009), sorghum (Reddyet al. 2005) and maize (Bänziger and Long 2000) reportedsignificant negative relationship between micronutrientsand yield. In the present study, however, these correlationswere weak enough in the magnitude, indicating that ifthese were the results of adverse genetic associations, high-yielding hybrids with high Fe and Zn densities can be bredby making selection for these traits in larger segregatingpopulations and progenies as compared to those used forbreeding for grain yield alone. These weak negative rela-tionships resulting from dilution effects, however, cannotbe ruled out and, therefore, this subject merits furtherinvestigation.
ConclusionsGenetic variability both for Fe and Zn densities was pre-dominantly under additive genetic control, implying thatintra-population improvement for these micronutrientsis likely to be highly effective. However, breeding hybridswith high levels of Fe and Zn densities will require in-corporating them in both parental lines, and applica-tion of genomics tools may significantly accelerate thisprocess. Highly significant and high positive correl-ation between performance per se of parental line andtheir general combining ability (GCA) both for Fe andZn densities showed that parental lines of potential hy-brids with high GCA can be effectively selected basedon their performance per se, thus enhancing the breed-ing efficiency. Lack of correlation of Fe and Zn dens-ities with grain yield in inbred lines, but significantnegative (although low) correlation in hybrids meritsfurther investigation as these results have direct bear-ing on the efficiency of breeding high-yielding hybridswith high levels of Fe and Zn densities.
AbbreviationsFe: Iron; Zn: Zinc; PR: Predictability ratio; GCA: General combining ability;SCA: Specific combining ability; r: Correlation coefficient.
Competing interestsThe authors declare that they have no competing interests.
Authors’ contributionsAK carried out all aspects of the experiment from seed preparation toplanting, data recording, grain sample preparation for laboratory analysis,statistical analysis, and preparation of final draft of the manuscript. KNR as

Kanatti et al. SpringerPlus 2014, 3:763 Page 11 of 12http://www.springerplus.com/content/3/1/763
co-advisor of this research, provided seed materials, helped in design of theexperiment with respect to crossing and field layout, suggested the analysesrequired, and helped AK during the revision process to develop final versionof the manuscript. KR as major advisor of this research, helped in developingthe framework of this research, and made suggestions for two rounds ofrevision of the draft prepared by AK. MG coordinated with the analyticallaboratory for analysis of grain samples for Fe and Zn densities, andassisted in the interpretation of results. KLS supervised the analysis ofgrain samples for Fe and Zn densities in his laboratory. ASR assisted AK incrop management and data recording. All authors read and approved thefinal manuscript.
Authors’ detailsAK: Ph.D. Research Scholar and KR (Ph.D.): Associate Professor at ProfessorJayashankar Telangana State Agricultural University, Rajendranagar,Telangana, India; KNR (Ph.D.) and MG (Ph.D.): Millet Breeders; KLS (Ph.D.): SoilScientist, ASR (M.Sc.): Scientific Officer at International Crops ResearchInstitute for the Semi-Arid Tropics (ICRISAT), Telangana, India.
AcknowledgementsThe research reported here forms part of Ph.D. thesis of Anand Kanatti,submitted to Professor Jayashankar Telangana State Agricultural University,Hyderabad 500 030, Telangana, India. It was supported by a grant fromHarvestPlus Challenge Program of the CGIAR.
Author details1International Crops Research Institute for Semi-Arid Tropics (ICRISAT),Patancheru, Hyderabad 502324, Telangana, India. 2Department ofGenetics and Plant Breeding, College of Agriculture, Professor JayashankarTelangana State Agricultural University, Rajendranagar, Hyderabad 500030, Telangana, India.
Received: 15 July 2014 Accepted: 10 December 2014Published: 26 December 2014
ReferencesAnandan A, Rajiv G, Eswaran R, Prakash M (2011) Genotypic variation and
relationships between quality traits and trace elements in traditional andimproved rice (Oryza sativa L.) genotypes. J Food Sci 76(4):H122–H130,doi:10.1111/ j.1750-3841.2011.02135.x
Arnold JM, Bauman LF (1976) Inheritance and interrelationships among maizekernel traits and elemental contents. Crop Sci 16:439–440, doi:10.2135/cropsci1976.0011183X00 1600030034x
Arnold JM, Bauman LF, Aycock HS (1977) Interrelations among protein, lysine, oil,certain mineral element concentrations, and physical kernel characteristics intwo maize populations. Crop Sci 17:421–425
Ashok Kumar A, Reddy BVS, Sahrawat KL, Ramaiah B (2010) Combatingmicronutrient malnutrition: Identification of commercial sorghum cultivarswith high grain iron and zinc. J SAT Agric Res 8:1–5
Ashok Kumar A, Reddy BVS, Ramaiah B, Sahrawat KL, Pfeiffer WH (2013) Geneeffects and heterosis for grain iron and zinc concentration in sorghum[Sorghum bicolor (L.) Moench]. Field Crop Res 146:86–95, DOI: 10.1016/j.fcr.2013.03.001
Baker RJ (1978) Issues in diallel analysis. Crop Sci 18(4):533–536Bänziger M, Long J (2000) The potential for increasing the iron and zinc density
of maize through plant breeding. Food Nutr Bull 21:397–400Blair MW, Astudillo C, Grusak M, Graham R, Beebe S (2009) Inheritance of seed
iron and zinc content in common bean (Phaseolus vulgaris L.). Mol Breed23:197–207
Bouis HE (2003) Micronutrient fortification of plants through plant breeding: canit improve nutrition in man at low cost? Proc Nutr Soc 62:403–411
Brkic I, Simic D, Zdunic Z, Jambrovic A, Ledencan T, Kovacevic V, Kadar I (2003)Combining abilities of Corn-Belt inbred lines of maize for mineral content ingrain. Maydica 48:293–297
Chen F, Chun L, Song J, Mi G (2007) Heterosis and genetic analysis of ironconcentration in grains and leaves of maize. Plant Breed 126:107–109,doi:10.1111/j.1439-0523.2006.01289.x
Cichy KA, Caldas GV, Snapp SS, Blair MW (2009) QTL analysis of seed iron, zinc,and phosphorus levels in an Andean bean population. Crop Sci 49:1742–1750,doi:10.2135/cropsci2008.10.0605
Garvin DF, Welch RM, Finley JW (2006) Historical shifts in the seed mineralmicronutrient concentration of US hard red winter wheat germplasm. J SciFood Agric 86:2213–2220
Gorsline GW, Thomas WI, Baker DE (1964) Inheritance of P, K, mg, Cu, B, Zn, Mn,Al, and Fe concentrations by corn (Zea mays L.) leaves and grain. Crop Sci4:207–210
Govindaraj M, Rai KN, Shanmugasundaram P, Dwivedi SL, Sahrawat KL, MuthaiahAR, Rao AS (2013) Combining ability and heterosis for grain iron and zincdensities in pearl millet. Crop Sci 53:507–517, doi:10.2135/cropsci2012.08.0477
Gupta SK, Velu G, Rai KN, Sumalini K (2009) Association of grain iron and zinccontent with grain yield and other traits in pearl millet (Pennisetum glaucum(L.) R. Br.). Crop Improv 36:4–7
Hallauer AR, Miranda JB (1981) Quantitative genetics in maize breeding, 1st edn.Iowa State University Press, Ames
Kaushik LS, Singh DP, Paroda RS (1984) Line × tester analysis for fixed effectmodel in cotton (Gossypiumhirsutum L.). Theor Appl genet 68:487–491
Kempthorne O (1957) An introduction to genetic statistics. John Wiley & Sons,New York
Khairwal IS, Rai KN, Andrews DJ, Harinarayana G (eds) (1999) Pearl milletbreeding. Oxford and IBH Publishing, New Delhi
Kumar S (2011) Development of new mapping population and marker-assistedimprovement of iron and zinc grain density in pearl millet [Pennisetumglaucum (L.) R. Br.]. Dissertation, Swami Keshwanand Rajasthan AgriculturalUniversity, Bikaner
Lindsay WL, Norvell WA (1978) Development of a DTPA test for zinc, iron,manganese and copper. Soil Sci Soc Am J 42:421–428
Long JK, Banziger M, Smith ME (2004) Diallel analysis of grain iron and zincdensity in southern african-adapted maize inbreds. Crop Sci 44:2019–2026
McIntosh MS (1983) Analysis of combined experiments. Agron J 75:153–155Morgounov A, Gomez-Becerra HF, Abugalieva A, Dzhunusova M, Yessimbekova
M, Muminjanov H, Zelenskiy Y, Ozturk L, Cakmak I (2007) Iron and zinc graindensity in common wheat grown in central Asia. Euphytica 155:193–203
Oikeh SO, Menkir A, Maziya-Dixon B, Welch R, Glahn RP (2003) Assessment ofconcentrations of iron and zinc and bioavailable iron in grains of earlymaturing tropical maize varieties. J Agric Food Chem 51:3688–3694,doi:10.1021/jf0261708
Oikeh SO, Menkir A, Maziya-Dixon B, Welch RM, Glahn RP, GauchJr G (2004)Environmental stability of iron and zinc concentrations in grain of eliteearly-maturing tropical maize genotypes grown under field conditions.J Agric Sci 142:543–551, doi:10.1017/S0021859604004733
Parthasarathy Rao P, Birthal PS, Reddy BVS, Rai KN, Ramesh S (2006) Diagnosticsof sorghum and pearl millet grains-based nutrition in India. Int SorghumMillets Newsl 47:93–96
Peleg Z, Cakmak I, Ozturk L, Yazici A, Jun Y, Budak H, Korol AB, Fahima T, SarangaY (2009) Quantitative trait loci conferring grain mineral nutrientconcentrations in durum wheat × wild emmer wheat RIL population. TheorAppl genet 119:353–369, doi:10.1007/s00122-009-1044-z
Rai KN, Govindaraj M, Rao AS (2012) Genetic enhancement of grain iron and zinccontent in pearl millet. Qual Assur Saf Crop 4:119–125, doi:10.1111/j.1757-837X.2012.00135.x
Rai KN, Yadav OP, Rajpurohit BS, Patil HT, Govindaraj M, Khairwal IS, Rao AS, ShivadeH, Pawar VY, Kulkarni MP (2013) Breeding pearl millet cultivars for high irondensity with zinc density as an associated trait. J SAT Agric Res 11:1–7
Reddy BVS, Ramesh S, Longvah T (2005) Prospects of breeding for micronutrientsand β-carotene-dense sorghums. Int Sorghum Millets Newsl 46:10–14
Sahrawat KL, Wani SP (2013) Soil testing as a tool for on-farm fertilitymanagement: experience from the semi-arid zone of India. Commun Soil SciPlant Anal 44:1011–1032
SAS Institute Inc. (2004) SAS/STAT 9.2 user’s guide. SAS Institute Inc, CarySatterthwaite FE (1941) Synthesis of variance. Psychometrika 6:309–316Satterthwaite FE (1946) An approximate distribution of estimates of variance
components. Biometrics Bull 2:110–114Shi R, Li H, Tong Y, Jing R, Zhang F, Zou C (2008) Identification of quantitative
trait locus of zinc and phosphorus density in wheat (Triticum aestivum L.)grain. Plant Soil 306:95–104
Singh K, Chhuneja P, Tiwari VK, Rawat N, Neelam K, Aggarwal R, Malik S, Keller B,Dhaliwal HS (2010) Mapping of QTL for grain iron and zinc content in diploid Agenome wheat and validation of these loci in U and S genomes. Paperpresented at: Plant and Animal genomes XVIII Conference. San Diego
Stangoulis J, Sison C (2008) Crop sampling protocols for micronutrient analysis.Harvest Plus Tech Monogr Ser 7
Kanatti et al. SpringerPlus 2014, 3:763 Page 12 of 12http://www.springerplus.com/content/3/1/763
Stangoulis JCR, Huynh BL, Welch RM, Choi EY, Graham RD (2007) Quantitative traitloci for phytate in rice grain and their relationship with grain micronutrientcontent. Euphytica 154:289–294, doi:10.1007/s10681-006-9211-7
Steel RDG, Torrie JH (1980) Principles and procedures of statistics: a biometricalapproach, 2nd edn. McGraw-Hill, Inc, New York, NY
Stein AJ, Meenakshi JV, Qaim M, Nestel P, Sachdev HPS, Bhutta ZA (2005)Analyzing the health benefits of biofortified staple crops by means of thedisability-adjusted life years approach: a handbook focusing on iron, zinc andvitamin A. Harvest Plus Technical Monograph 4. IFPRI and CIAT, Washington,http://www.harvestplus.org/sites/default/files/tech04.pdf
Tisdale SL, Nelson WL, Beaton JB (1993) Soil fertility and fertilizers, 5th edn.Macmillan Pub. Co, New York
Upadhyaya HD, Ramesh S, Shivali S, Singh SK, Varshney SK, Sarma NDRK,Ravishankar CR, Narasimhudu Y, Reddy VG, Sahrawat KL, Dhanalakshmi TN,Mgonja MA, Parzies HK, Gowda CLL, Singh S (2011) Genetic diversity forgrain nutrients contents in a core collection of finger millet (Eleusinecoracana (L.) gaertn.) germplasm. Field Crop Res 121:42–52,doi:10.1016/j.fcr.2010.11.017
Velu G, Rai KN, Muralidharan V, Kulkarni VN, Longvah T, Raveendran TS (2007)Prospects of breeding bio fortified pearl millet with high grain iron and zinccontent. Plant Breed 126:182–185, doi:10.1111/j.1439-0523.2007.01322.x
Velu G, Rai KN, Sahrawat KL, Sumalini K (2008a) Variability for grain iron and zinccontents in pearl millet hybrids. J SAT Agric Res 6:1–4
Velu G, Rai KN, Sahrawat KL (2008b) Variability for grain iron and zinc content ina diverse range of pearl millet populations. Crop Improv 35:186–191
Velu G, Ortiz-Monasterio I, Singh RP, Payne T (2011a) Variation for grainmicronutrients in wheat core collections accession of diverse origin. Asian JCrop Sci 3:43–48, doi:10.3923/ ajcs.2011.43.48
Velu G, Rai KN, Muralidharan V, Longvah T, Crossa J (2011b) Gene effects andheterosis for grain iron and zinc density in pearl millet (Pennisetum glaucum(L.) R. Br). Euphytica 180:251–259, doi:10.1007/s10681-011-0387-0
Wheal MS, Fowles TO, Palmer LT (2011) A cost-effective acid digestion methodusing closed polypropylene tubes for inductively coupled plasma opticalemission spectrometry (ICP-OES) analysis of plant essential elements. AnalMethods 3:2854–2863
WHO (2002) Reducing risks and promoting healthy life. The World Health Report.World Health Organization, Geneva, pp 168–233
Yadav OP, Rai KN, Rajpurohit BS, Hash CT, Mahala RS, Gupta SK, Shetty HS,Bishnoi HR, Rathore MS, Kumar A, Sehgal S, Raghvani KL (2012) Twenty-fiveyears of pearl millet improvement in India. All India Coordinated Pearl MilletImprovement Project, Jodhpur
Zhang MW, Guo BJ, Peng ZM (2004) Genetic effects on Fe, Zn, Mn and Pcontents in Indica black pericarp rice and their genetic correlations withgrain characteristics. Euphytica 135:315–323
Zhang Y, Song Q, Yan J, Tang J, Zhao R, Zhang Y, He Z, Zou C, Ortiz-Monasterio I(2010) Mineral element concentrations in grains of Chinese wheat cultivars.Euphytica 174:303–313, doi:10.1007/s10681-009-0082-6
Zhao FJ, Su YH, Dunham SJ, Rakszegi M, Bedo Z, McGrath SP, Shewry PR (2009)Variation in mineral micronutrient concentrations in grain of wheat lines ofdiverse origin. J Cereal Sci 49:290–295
doi:10.1186/2193-1801-3-763Cite this article as: Kanatti et al.: Grain iron and zinc density in pearlmillet: combining ability, heterosis and association with grain yield andgrain size. SpringerPlus 2014 3:763.
Submit your manuscript to a journal and benefi t from:
7 Convenient online submission
7 Rigorous peer review
7 Immediate publication on acceptance
7 Open access: articles freely available online
7 High visibility within the fi eld
7 Retaining the copyright to your article
Submit your next manuscript at 7 springeropen.com