Soft & Transparent Surface Measurement Using 3D Profilometry
Upload
dinhnguyetCategory
view
214download
0
i
ASSESSMENT OF CLINICAL AND IN VITRO WEAR OF A NANO-HYBRID
COMPOSITE RESIN BY NON-CONTACT PROFILOMETRY
by
Courtney Michelson
Dr. John Burgess, CHAIR
Dr. Daniel Givan
Dr. Jack Lemons
Dr. Mark Litaker
Dr. Amjad Javed
A THESIS
Submitted to the graduate faculty of The University of Alabama at Birmingham,
in partial fulfillment of the requirements for the degree of
Master of Science
BIRMINGHAM, ALABAMA
2010

ii
Copyright by
Courtney Michelson
2010

iii
ASSESSMENT OF CLINICAL AND IN VITRO WEAR OF A NANO-HYBRID
COMPOSITE RESIN BY NON-CONTACT PROFILOMETRY
Courtney Michelson
MASTER OF SCIENCE IN CLINICAL DENTISTRY
ABSTRACT
The purpose of this study was to measure and compare the volumetric wear loss
(mm3) and linear depth (μm) values of in vitro specimens and in vivo restorations of a
highly filled BisGMA nano-hybrid composite resin system using a 3-D non-contact
surface profilometer. Twenty-one restorations were placed in a clinical trial. Impressions,
casts, and scans (PROSCAN 2000) were made at baseline and one year. Images were
superimposed (PROFORM Software) and values were obtained for volume and depth
loss. Sixteen wear specimens of the same material used in the clinical trial were prepared
in the laboratory under standardized conditions. The specimens were subjected to
200,000 or 400,000 (n=8) cycles in the Alabama Wear Testing Device. The specimens
were scanned (PROSCAN 2000) before and after wear and the images were
superimposed (PROFORM Software) to determine volumetric and depth wear loss
values.
Results showed that the wear patterns varied greatly between the two groups
which the investigators concluded were due to the large amount of confounding variables
present in a clinical study. It was inappropriate to analyze the differences between the
two groups and therefore, the data was analyzed within groups. Conclusions were made
on how to better standardize future clinical trials and ways the in vitro testing device can
more accurately portray conditions in the oral cavity.

iv
ACKNOWLEDGMENTS
Dr. John Burgess –Thank you for taking a chance on me. I am forever grateful for
the opportunities that you have given me and the things that you have exposed me to, to
say the least. You are an incredible teacher, mentor, and inspiration. Your constant
optimism and eagerness to better the dental research field has made this an exciting place
to work the past two years. You have shown me how to be a knowledgeable and
insightful researcher. I have a passion that I will continue. You have taught me so much
and I am honored to be one of your students.
Dr. Daniel Givan – You have taught me so much (don’t panic!) and guided me
through this thesis so much. I am so thankful for your constant support and guidance
when I needed it the most throughout this process. You were always available and
excited to discuss wear processes or create apparatuses with me. I will never forget you
taking the time to give me one-on-one lessons of dentistry 101 to make sure I would be
on the same page (or close enough to it) as everyone else so that I could actively
participate in discussions.
Dr. Jack Lemons – It is an honor to be one of your students. You have taught me
new ways to think about and approach a concept or situation. Your humbleness is
inspiring. You are always so proud of us and encouraging. Thank you for teaching me
how to be a better researcher and writer.
Dr. Mark Litaker – Thank you so much for teaching me about statistics and
helping me over the past two years. Thank you for your patience in these final weeks of
re-working and re-running data.
Dr. Amjad Javed – Thank you for your guidance on making sure that everything
with the graduate school and thesis has gone on without any problems. Your input and
kindness is much appreciated.

v
Dr. Deniz Cakir – Thank you for your patience and understanding with all of my
questions. You have always been a wonderful teacher and friend. You were such a big
part of my experience here and I am grateful for all of your assistance through it all
Preston Beck – You have been such an integral part of my thesis. You have been
so encouraging and always offering to help in any way possible. Thank you for your
insightful knowledge on every machine we possess in the lab. If it was not for you, the
Proscan probably would have been dead a few months ago along with my thesis. Thank
you for keeping all of the above alive.
Ian and Gowri –Two of my best friends. I was so intimidated when I started this
program. Instead of making me feel like I was in over my head, you took my under your
wings and taught me so much; not only tremendous amounts of dental knowledge, but
also so much about your unique cultures. We are such an incredible team. Anytime I
ever doubted myself, you both were there encouraging me and keeping me on track with
you both. I am at this point because of you.
Nate, Ben, Ann, and Unger – Thank you for being such wonderful friends and
resources throughout this entire process. Thank you for always being there for me and
teaching me so much during this experience.
To My Incredible Family: Mom, Dad, Jennifer, and Mama Elaine – Thank you for
your patience and understanding through this entire process (especially towards the end).
You have been so supportive. Thank you for always loving me and having confidence in
me. You continue to make everything possible for me. Thank you for everything, and I
love you all so very much.

vi
DEDICATION
This thesis is dedicated to everyone who encouraged, supported, and believed in
me throughout this entire process and made this such an incredible and wonderful
experience for me.

vii
TABLE OF CONTENTS
Page
ABSTRACT .................................................................................................................. iii
ACKNOWLEDGMENTS .............................................................................................. iv
DEDICATION ............................................................................................................... vi
LIST OF TABLES ......................................................................................................... ix
LIST OF FIGURES ......................................................................................................... x
INTRODUCTION ........................................................................................................... 1
Composite Background ............................................................................................. 1
Wear Background ..................................................................................................... 5
Methods of Measuring Wear ..................................................................................... 9
Contact vs. Non-Contact Profilometers ................................................................... 11
Accuracy and Precision ........................................................................................... 12
In Vitro Devices ...................................................................................................... 14
In Vitro vs. In Vivo .................................................................................................. 19
OBJECTIVES AND HYPOTHESES ............................................................................ 21
MATERIALS and METHODS ...................................................................................... 23
In Vivo Protocol ..................................................................................................... 23
Impressions ............................................................................................................ 28
Disinfection ........................................................................................................... 29
Casts ...................................................................................................................... 29
Bases ..................................................................................................................... 30
Measuring Wear .................................................................................................... 32
In Vivo Data Analysis ............................................................................................ 34
In Vitro Specimen Preparation ............................................................................... 34
Determination of In Vitro Wear.............................................................................. 36
In Vitro Data Analysis............................................................................................ 37
RESULTS ..................................................................................................................... 38

viii
TABLE OF CONTENTS (Continued)
Page
DISCUSSION ............................................................................................................... 40
SUGGESTIONS FOR FUTURE RESEARCH .............................................................. 44
LIST OF REFERENCES ............................................................................................... 46
APPENDICES
A IRB APPROVAL ........................................................................................ 51
B In Vivo Scans at Baseline, 1 year, and Superimposition of Restoration ........ 55
C In Vitro SUPERIMPOSITION .................................................................... 77

ix
LIST OF TABLES
Page
1 Study Characteristics .......................................................................................... 23
2 Inclusion Criteria ............................................................................................... 24
3 Exclusion Criteria .............................................................................................. 24
4 Materials used in vivo......................................................................................... 27
5 Materials used in vitro ........................................................................................ 34
6 Results ............................................................................................................... 38
7 In Vivo Results ................................................................................................... 38
8 In Vitro Results .................................................................................................. 39

x
LIST OF FIGURES
Page
1 Movement of muscles and mandible during chewing .......................................... 5
2 Two-Body Wear .................................................................................................. 7
3 Three-Body Wear................................................................................................. 7
4 OHSU Wear Simulator ...................................................................................... 15
5 BIOMAT Wear Simulator .................................................................................. 15
6 Minnesota Wear Simulator ................................................................................. 16
7 ACTA Wear Simulator....................................................................................... 16
8 Zurich Wear Simulator ....................................................................................... 17
9 Original Drawings of Alabama Wear Simulator ................................................. 18
10 Alabama Wear Machine ..................................................................................... 18
11 Sandwich Technique .......................................................................................... 26
12 Polyvinyl Siloxane Impression ........................................................................... 29
13 Final Cast ........................................................................................................... 30
14 Dental surveyor with acrylic .............................................................................. 31
15 Apparatus to standardize bases ........................................................................... 31
16 Final standardized bases ..................................................................................... 32
17 Proscan 2000...................................................................................................... 32
18 Composite build-up ............................................................................................ 35
19 Prepared Wear Specimen ................................................................................... 36
20 Specimen after subjection to wear ...................................................................... 36

1
INTRODUCTION
Composite Background
Concerns with the release of mercury toxicity from amalgam and the demand for
more esthetic tooth-colored restorations led to the introduction of polymer matrix
reinforced composite resins in the early 1960’s1. Composites were introduced as an
alternative to silicate cements and unfilled acrylic resin materials, since restorations
composed of these materials had limited clinical longevity2. A dental composite is a
highly cross linked polymeric material reinforced by a dispersion of amorphous silica,
glass, crystalline, or organic resin filler particles bonded to the matrix by a coupling agent
that can be transformed from a fluid or putty-like material into a tooth-like solid for direct
or indirect restorations3. Since the creation of bisphenol glycidyl dimethacrylate (bis-
GMA) by Bowen in 1962, composite resins have been used as the primary choice for
many esthetic dental restorations4. Currently more than 50% of all directly placed
posterior restorations are composites5.
Applications of early composites showed significant problems with secondary
caries and wear4. The first clinical trials performed in the early 1970’s that measured the
effectiveness of composite resin as posterior restorations reported that composites had
poor wear resistance and did not last more than 3-5 years3. Early generations of
composites were highly susceptible to three-body wear, occlusal contacts, and attrition
showing higher rates of wear across the entire restoration6.
Composites can be classified by their monomer (BisGMA, TegDMA, UDMA),
filler loading (size of filler particles-macro, micro, nano, or hybrid), curing type (light,
visible, or dual), or viscosity (condensable or flowable). Composites are most commonly

2
classified based on their filler particle size in a system created by Lutz7. These
classifications are as follows: macro 1-100μm, micro 0.04-0.1 μm, and nano 0.01-0.04
μm7.
First generations of dental composites were traditional macro-filled. They were
prepared by crushing large inorganic quartz, glass with barium, strontium, borosilicate, or
ceramics into 8-100µm particles2. The early structural dental composites were 60-75%
filler by weight, were easily stained, and accumulated plaque easily8. Their coefficient of
thermal expansion was 2-10 times greater than tooth structure leading to micro-leakage,
post-operative sensitivity, and recurrent decay2. All macro-filled composites lost filler
particles while polishing, which made it difficult to attain and maintain smooth surfaces.
Early generations of composites were unable to withstand occlusal forces in the oral
cavity and had poor wear resistance.
In an attempt to improve the polishability and wear resistance of composites, in
1977 Vivadent introduced micro-filled composites with 0.01-0.1μm fused silica particles
made from silicon dioxide where the dental composite was 40-50% filler by weight4.
Micro-filled composite resin had organic silica particle fillers and organic
prepolymerized particles. They had pre-cured filler particles included in the matrix which
decreased the amount of shrinkage and improved polishing properties. These softer, less
resistant particles showed reduced wear rates by staying partially embedded in the surface
as opposed to the macro-fillers that were plucked from the surface2. The search for an
ideal composite resin continued.
The late 1980’s saw a transition to hybrid composites, which were a combination
of macro-fillers and 7-15% micro-filler particulates, producing 75-80% filled by weight4.

3
Adding microfills hardened the matrix which decreased fracture crack formation. The
higher filler loading of hybrids decreased interparticle distance which improved wear.
They had good polishability and better wear resistance. Hybrids became the first
composites judged to be broadly successful for use in posterior regions.
Nano-filled composites are composed of particles that are less than 0.1μm average
diameter. They have been introduced more recently as a way to increase the amount of
filler loading and increase physio-mechanical properties. Nano-hybrids are a blend of
nano filler and smaller grinds and give a wider range of fillers. They allow for higher
filler loading and therefore have lower shrinkage rates of 1.8-2.3% volume, are easier to
polish, and retain gloss long but not as long as the microfilled resins.
Other categories of composites are based on their viscosity: flowable and
condensable. Flowable, low viscosity, composites are composed of inorganic fillers and
dimethacrylates4. They have high polymerization shrinkage rates and decreased wear
resistance due to their low filler content.
As composite resins have evolved and the filler particle size decreased, wear
resistance and polishability increased. Therefore, some say that the ideal composite
would be highly filled with small particles; however this is hard to obtain since a larger
surface area could cause an increase in viscosity and altered properties for clinical
placement. This is the problem with fillers and is why they have to have a range in
addition smaller particles. The nanoscale has low fracture toughness which is why
nanoclusters were developed.
Since dental composites were created, they have been evolving and have
continued to improve their physio-mechanical properties. Over the past decade, the main

4
focus has turned to minimizing polymerization shrinkage as it is one of the main clinical
concerns because it can lead to microleakage, adhesion failure, enamel microcracks, gap
formation, and post-operative sensitivity. To reduce shrinkage and stresses, several
methods have been tested (increment placement techniques, bulk curing, light curing
methods). However none of these proved to be affective. Therefore, manufacturers have
manipulated the chemistries to create low-shrink/low-stress materials. Though they have
been very promising in the shrinkage aspect, they need improvement in physical and
mechanical properties (toughness, hardness, wear).
One of these low-shrinkage materials is Surefil SDR (DENTSPLY Caulk). Surefil
SDR is a stress decreasing resin that is a typical BisGMA composite resin, yet it has a
polymerization modulator that increases the polymerization time and reduces the stresses
produced while polymerizing. It is a translucent flowable composite that has a 4mm
depth of cure. It is designed to be placed as a base beneath a conventional composite
resin restoration, such as Esthet-X HD, a high definition micro matrix restorative
material. Esthet-X HD was designed for replacement of missing occlusal/facial enamel. It
is a visible cured, radiopaque composite restorative material for anterior and posterior
restorations of primary and permanent teeth. It has handling characteristics typical of a
conventional microhybrid composite, allowing easy placement and anatomic
sculptability, which provides a durable and esthetic surface. The resin matrix consists of a
Bis-GMA adduct, a Bis-EMA adduct, and triethylene glycol dimethacrylate,
Camphorquinone (CQ), photoinitiator, stabilizer pigments. The filler combination
consists of barium fluoroborosilicate glass with a mean particle size below 1μm and
nanofiller silica (particle size 0.04μm). According to the manufacturer, Esthet-X HD has

5
the polishability of a microfilm and the resin matrix of an advanced hybrid. By reducing
the size of particles of glass fillers and precisely controlling the particle distribution,
Esthet-X HD gives better polish properties throughout the material in less time with less
effort. This increases the visual display of the restoration and increases the gloss score.
This material was chosen for inclusion in this study because there was a clinical trial
going on looking at the physio-mechanical properties of Esthet-X HD placed on top of
SurefilSDR in the Biohorizons Research Clinic at the University of Alabama School of
Dentistry.
Wear Background
Muscles of mastication have been shown to produce active forces that are
perpendicular and tangential to the occlusal surfaces of teeth by guiding the movement of
the mandible in relation to the upper jaw (Figure 1). These forces are responsible, in part,
for the wear of composite resins in the mouth. The ratio of the force of friction between
the two surfaces and the force pressing them together is the coefficient of friction9. The
coefficient of friction changes with materials, and during mastication, the coefficient can
be lower due to lubrication from foods, drinks, and saliva10
.
Figure 1. Movement of muscles and mandible during chewing
Wearing of tooth surfaces has significant clinical consequences both esthetically
and functionally. Increasing levels of tooth wear are significantly associated with age.

6
The predicted percentage of adults presenting with severe tooth wear increased from 3%
at 20 years old to 17% in patients 70 years old and older11
. The teeth most severely
affected by wear are mandibular molars, but the most commonly affected teeth are
anteriors11
.
Wear of materials at occlusal surfaces can lead to systemic and functional
complications, e.g., worn micro- or nano-size fill particles can be swallowed or inhaled
and can accumulate into tissues which can further lead to diseases12
. During mastication
most composite particles that are disintegrated have a diameter smaller than 100μm,
which was found to be the critical threshold values for the absorption of particles in the
lungs and intestines12
. However, no published studies were found reporting that the
absorbed particles from composites put patients at a health risk with regard to toxic or
mutagenic effects.
Wear is a very complex process that involves extrinsic and intrinsic factors.
Excessive wear may lead to premature failure and replacement of the restorations.
Therefore, it is imperative that restorative composite materials be wear resistant. Wear is
defined as the progressive loss of material through the contact of two or more surfaces in
motion. The general wear equation is defined as:
Wear = Volume loss = (k x F x d) / H
where k is a dimensionless constant, F is the occlusal force perpendicular to the surfaces
at contact, d is the sliding distance, and H is the indentation hardness of the contacting
surfaces13
.
Wear is sometimes classified as either adhesive, abrasive, fatigue, or corrosive.
Adhesive wear occurs when two smooth surfaces contact and slide across each other, as

7
when an occlusal cusp contacts a composite restoration. The loss of material occurs when
electrostatic bonds form between the two surfaces and the softer material adheres to the
harder material.
Another type of wear is abrasive wear which is produced when asperities on the
harder surface fracture asperities on the softer surface. Abrasive wear is categorized as
either two- or three-body. Two-body wear is surface to surface wear and occurs at
occlusal contact points (Figure 2). Three-body wear occurs during mastication when
particles are free to translate and rotate between the two surfaces (Figure 3). A third-body
such as a particle of food can be caught between the maxillary and mandibular teeth
during chewing. When the food bolus is broken down, the particles may become trapped
between the teeth. This is more commonly seen in occlusal contact-free areas.
Figure 2. Two-Body Wear
Figure 3. Three-Body Wear

8
Other forms of wear can be classified as fatigue and corrosive processes. Fatigue
is the loss of material due to cyclic loading which produces microcracks at or below the
surface of the material. These cracks grow as the material is repeatedly deformed over
time. Corrosive wear is caused by the chemical alteration of a surface. In the oral
environment, this may be caused by acidic drinks, food, saliva, microorganisms, or acidic
bodily fluids in the oral cavity sometimes introduced in patients with bulimia. The
chemicals present in the oral cavity may also breakdown the matrix of the composite
restorative material and make the composite more susceptible to wear.
The control of occlusal wear for composites has improved over the years. When
early and more recent clinical trials are compared, it is seen that current posterior
composites wear at a rate of 10-50μm/year compared to 80-100μm/year as shown in
clinical trials taken place two decades ago14
. Prospective studies on clinical wear have
shown logarithmic curve patterns with magnitudes decreasing with time, which
demonstrate more wear early in the life of the restoration which decreases as a function
of time15
. As the composite has less occlusal contact due to wear out of occlusion, the
composite resin wears less. The teeth still contact which holds the occlusion and allows
this separation and slowing of the wear. According to the ADA Specification adaptation
to the ISO Standard for composite wear, a composite should not lose more than
0.05mm/year along occlusal surfaces16,17
.
Wear has been shown to occur mostly in three regions on teeth: occlusal contact
areas (OCA), contact-free areas (CFA), and at inter-proximal areas (IP). Most clinical
and in vitro studies measure wear in OCA and CFA regions. Wear that takes place in
9
contact free areas is referred to as generalized wear. Wear that occurs at occlusal contacts
is referred to as localized wear.
Limited data dealing with interproximal wear in the laboratory are available
Interproximal wear has been shown to be a problem in Class II restorations. It can lead to
the loss of proximal contact areas which can result in food impaction, periodontal
attachment, and loss of bone. Schmidlin, et. al, reported aproximal wear loss on two
composite materaials using a two-body wear simulator18
. Wendt et. al, found that wear at
proximal contacts existed at a higher rate than occlusal surfaces. He proposed that this
was caused by the restoration always being in contact with the adjacent tooth and with
little access for the curing light to polymerize all of the material19
. However, other
prospective clinical trials do not support the observations that interproximal wear results
in open proximal contacts20,21
.
Methods of Measuring Wear
Wear loss can be quantified using depth, area, and volume. Depth is associated
with loss of vertical height, and has been shown to be dependent on occlusal forces and
varies with time. Historically, depth was used to compare wear because early composite
showed rapid wear which exposed the cavosurface margin which was then used as a
measurement reference. The most indicative laboratory parameters for comparing resin
composites using simulated localized wear is loss of vertical height and the total
volumetric loss of the restorative material22
.
Most clinical trials measuring posterior composite resin wear have utilized the
United States Public Health Service (USPHS) direct method or the indirect Leinfelder
method23
. Each method has its own limitations, for example, the USPHS, also known as

10
the Ryge criteria, is the most universally used method for measuring wear because this
procedure does not require special equipment24
. This is a non-parametric test based on
three well-defined categories (Alpha, Bravo, Charlie) to visually assess wear where:
Alpha indicates that there is no wear present; Bravo signifies that there is visible wear;
and Charlie represents excessive wear. The restoration should be replaced for a Charlie
rating. 3 years after placement of restoration, no more than 10% of the restorations can be
rated Charlie25
. The main disadvantages of using this system to assess wear loss are that it
is time consuming and subjective26
. The USPHS approach does not detect minor loss in
wear and gives values that are not parametric and therefore cannot be analyzed by some
statistical methods25
.
Another widely used measure is the Leinfelder method, which has been listed as
quick and inexpensive27
. A series of calibrated standard casts with preset increasing wear
depths of 100μm are used. The relative amount of wear is determined by comparing the
cast of the restored tooth to the standardized casts to find which one is most similar. The
accuracy of this method depends on uniform wear across the surface of the restoration
and provides a measure of altered vertical height. Disadvantages of the Leinfelder
method are that wear tends to be underestimated28
and the inter-evaluator error can be
around 0.05mm29
. Studies have shown that most clinical evaluators detect occlusal
cavosurface margins after 150-175μm of material has been worn away27
.
Moffa and Lugassy expanded on the Leinfelder method. The M-L system used 18
cylinder-shaped specimens with carefully machined offsets in 25μm increments in the
center of the dies30
. Vivadent combined the Leinfelder and M-L scales to create better
precision when identifying wear.

11
In a study performed by Leinfelder et. al, results from the USPHS system
indicated significant wear loss between the 3rd
and 4th
year after placement of some
restorations while the Leinfelder method showed that the majority of wear was observed
in the first two years27
. This finding indicated that 2 year clinical studies were sufficient
for measuring wear of composites. Taylor, et. al confirmed that high initial wear rates and
early changes could not be detected by the USPHS system26
.
Results show that wear is underestimated during visual depth evaluations such as
the USPHS and Leinfelder methods31,32
. Recent advances in technology offer faster and
more accurate methods which have been developed to quantify wear loss such as
stereomicroscopes, scanning electron microscopes, computerized 3-D microscopes, and
contact and non-contact profilometers33,34,35
. These methods utilize before and after 3-D
images of the restorations that are superimposed by maximizing the overlap of common
based on the unaltered surface topography of the overall images. The overlap from the
aligned surfaces is then subtracted to reveal the amount of material loss representing
wear. However, these methods require specialized software and instrumentation.
Contact vs. Non-Contact Profilometers
Various types of surface profilometers are listed to be accurate and easy to use36
.
Scanners that profile the topography of occlusal surfaces of teeth are classified as contact
or non-contact. Most contact profilers use different sized (0.1mm or larger) spherical
tipped styli. This scanning system has high accuracy, high repeatability, low cost, and is
not affected by the color and light reflecting properties of the material37
. However, this
method is time consuming, and has the potential for the stylus to alter the surface of the
material being scanned38
.

12
Most non-contact profilometers use a laser or light source for analyses. They
require an opaque and reflecting material surface. A digital camera-like system in the
profilometer captures images as the light source moves across the surface. Non-contact
profilers can also be categorized as line, area, point, and volume scanners (CT scans).
Non-contact line laser systems scan the surface using a straight line path along the
surface. Area scanners are similar to line scanners except that they develop a pattern
covering an area of the surface and use triangulation, interferometry, and phase shifting
to calculate surface points. Point scanners have the highest resolution but because of
repeated images, take the longest time to scan. Volume scanners are called computer
tomography (CT) scans with radiographic systems exposing patients to radiation. CT
systems are relatively expensive.
Accuracy and Precision
Accuracy is defined as how close the measured value is to the actual
(international standard) value. Precision is defined as the degree of repeatability of the
measurement technique. Ideally a system will be both accurate and precise. However, if a
methodology introduces a bias, it can be a precise method that is not accurate. Biases can
be corrected through several methods for calibration. Accuracy is necessary when
measuring clinical wear because dental restoration wear is measured on such a small
scale.
If measurements are done indirectly using stone cast replicas, then the accuracy of
the impression and replica materials must also be considered along with the scanner
accuracy as part of the overall system accuracy determination39
. Factors that limit the
accuracy of impressions are limited working time, material dimensional stability, use or

13
not of tray adhesives, selection of tray type, material tear resistance, and disinfection
methods. According to ANSI/ADA Specification No. 25 (ISO 6873), there are four types
of pure gypsum products: Type II (model plaster), Type III (dental stone), Type IV (high-
strength stone), and Type V (high-strength/high-expansion stone). Type IV is listed as the
dental stone most widely used for the fabrication of casts and dies because of higher
strength and lower setting expansion magnitudes. According to the ADA Specification
25, 2 hours after mixing, the setting expansion should be 0.0-0.10%. However delayed
linear expansion and contractions of gypsum products have been measured up to 120
hours after mixing and setting. The accuracy of the casts therefore is dependent on a
known and predictable amount of long-term stability and expansion magnitudes.
The accuracy of the scanner is just as important as the accuracy of the surface
being scanned. During scanning, the measurement of each of the data points collected
depends on the shape of the surface and the angle that the beam from the scanner makes
to the surface40,41
. The greater the angle the surface makes to the scanner’s line of sight
the less accurate the measurement42
. It is important to know how well the digitized
surface represents the true surface. The reproducibility of the alignment method for the
test surfaces also has been shown to affect accuracy. This is a very important factor,
especially where distortion can occur during the impression step or when creating the
replica models. If distortion occurs, it is unlikely that they will be identical on both the
baseline and one year model surfaces; therefore, the quality of alignment will be
decreased.

14
In Vitro Devices
As manufacturers try to develop or improve existing materials, materials are
placed in clinical trials, which are expensive and can last up to two to three years to
obtain meaningful clinical data. By the time a study has been carried out, newer products
could have been developed. Consequently, numerous investigators have tried to develop
in vitro devices that are capable of predicting clinical performance in a timelier manner.
Several mechanical testing systems (machines) have been created to simulate in
vivo occlusal wear on the influence of test materials. The FDA established guidelines for
non-clinical laboratory studies including: equipment should be calibrated and its
maintenance defined and ensured so that the generation, measurement, and assessment of
data should be adequately tested, calibrated, and/or standardized (No. 58.63)43
.
Machines for the simulation of dental wear provide reproducible chewing patterns
where force, gliding path, and number of chewing cycles are controlled. The machines
and support systems offer controls to vary pH, temperature, antagonist material, contact
area, frequency of load cycles, load/force, slurry medium, lubrication and friction,
duration of tooth contact, sliding speed, and wear measurement technique. All of which
have been shown to affect wear rates. However, available machines do not take into
account the presence/absence of a periodontal ligament which absorbs some of the forces
and influences motions during mastication. Due to the complexities of recreating the
mechanisms and properties of the oral cavity, no in vitro device can fully simulate in vivo
conditions. Therefore,an important purpose of these machines is to serve as a comparison
of materials and to rank restorative materials according to their wear resistance.

15
Literature review shows that many have created machines to induce wear, e.g., OHSU,
BIOMAT, Minnesota, ACTA, Zurich, Willytec, and Alabama.
The Oregon Health Sciences University Oral Wear Simulator (OHSU) simulates
wear by loading at 70N for attrition and at 20N abrasion44
(Figure 4). The machine also
includes a multi-mode simulator, poppy seeds + polymethylmethacrylate (PMMA) bead
medium, enamel and a conical stylus. Studies with the OHSU suggest 50,000 to 100,000
cycles at a frequency of 1.2 Hz44
.
Figure 4. OHSU Wear Simulator
The BIOMAT wear simulator uses independent weights for applications of force
(loading), 37°C water as the medium, and 304SS alloy counter-body as the
stylus45
(Figure 5). A 20 MPa force is exerted to produce a contact stress, and a variable
shock absorbing layer is present45
.
Figure 5. BIOMAT Wear Simulator

16
The Minnesota wear simulator (MTS) uses enamel as the stylus, water as the
medium, and a hydraulic system for controlled loading46
(Figure 6). Contact stress and
speed can all be adjusted on this machine. A force of 13.35 N is exerted during loading46
.
Figure 6. Minnesota Wear Simulator
The ACTA machine uses two metal discs that rotate against each other at
different speeds using 15-20N force47
(Figure 7). Rice/millet seeds are used in the
medium and the machine is spring loaded47
.
Figure 7. ACTA Wear Simulator
The Zurich computer-controlled masticator exerts a 49N force at a frequency of
1.7Hz48
(Figure 8). Specimens are set in a water medium using enamel as the antagonist.
Loading is by electro-magnetic control and includes an impact sliding movement48
.

17
Figure 8. Zurich Wear Simulator
The Willytec Munich wear machine produces a variable load profile and wear
path and has been used to simulate abrasive and attrition wear49
. A 50N force is exerted,
thermocycling is optional, and weights are used for loading. It is normally run with water
as the medium using enamel as an antagonists49
.
The University of Alabama Wear Simulator is a modification of the Leinfelder
type three-body wear device50
(Figures 9 and 10). Over the years there have been many
modifications of the original machine. In the first publication in 1989, a polyethylene
tape was used as intermediate substance, driven by a tape advancing system. The tape
was subsequently replaced by PMMA slurry. PMMA beads have been shown to produce
the maximum loss of material in the shortest amount of time. Also, they do not degrade in
water and they transfer the masticatory energy to the surface of the composite resin rather
than absorb it. The initial force used was 55N (12.4 lbs) which was increased to 75N
(16.8 lbs) during each cycle. This was consistent with conventional biting forces of 16.0
lbs51
. A 30° clockwise rotation was initiated as soon as the stylus touched the specimen
which was staged with the loading cycle. Originally, the restorative materials were
incorporated into extracted molars that were trimmed flat, which simulated generalized
wear. More recently, localized wear has been simulated by using ceramics (alumina and
zirconia) and stainless steel balls as the actuator against 4mm deep restorations that are

18
set into brass holders filled with acrylic resin50,52
. Most studies using the Alabama wear
machine are run from 100,000 to 400,000 cycles. The Alabama wear simulator in vitro
wear device is the most cited as determined by literature review.
Figure 9. Original drawings of Alabama Wear Simulator
Figure 10. Alabama Wear Machine
In overview, each of the machines varies in the way that they load and simulate
wear. Testing protocols and methods for measuring wear fluctuate for each machine and
testing site. Therefore, it is difficult to compare results from different machines. In 2006,
Heintz performed a round robin test with the ACTA, OHSU, Willytec and Zurich wear
devices using eight different composites53
. Prepared specimens were exchanged between
testing sites with each collecting and analyzing the data. This study concluded that the
relative ranks of the materials differed significantly between the wear devices53
.

19
In Vitro vs. In Vivo
Attempts to correlate in vivo and in vitro wear rates and magnitudes are difficult
because of the complexities of recreating the mechanisms and properties of the oral
cavity54
. In 1989, the Council on Dental Materials stated that in vitro (laboratory) and in
vivo (clinical) correlations have not yet been established from these machines. No in vitro
test can fully simulate in vivo conditions55
.
On the other hand, there have been articles published showing how well wear
simulation methods correspond to actual in vivo situations. In the early 1980’s, the
Minnesota wear simulator became the first in vitro wear machine to have a publication
correlating the two56
. After testing Brilliant D.I. composite and Dispersalloy amalgam,
they showed that 250,000 cycles corresponded to a year of in vivo function. Later, Lutz
and Krejci claimed that 1,200,000 cycles using the Zurich simulator corresponded to 5
years in vivo57
. They based their results on 4 year clinical data for 14 amalgam
restorations and 6-month data for 12 composite inlays57
. In the late 80’s, Leinfelder, et. al
reported that a modified Roulet simulator produced wear patterns similiar to generalized
wear in vivo50
. In 1999, Leinfelder and Suzuki reported that 400,000 cycles in the
Alabama wear simulator exhibiting generalized wear corresponded to 3 years of in vivo
function. They used a profilometer to trace the surfaces of the worn specimens51
. Depth
loss values for the specimens were compared to results obtained in previous clinical
studies with the same materials58
. Barkmeier, et. al, used a modified Leinfelder wear
simulator to produce localized wear59
. They used a MTS 3-D Profiler and AnSur3D
software to obtain values for P50 and Z100 composites after being cycled 100,000,
200,000, 300,000, and 400,000 times. Depth values from clinical trials performed at

20
Creighton University using the same materials were used for comparison. They
concluded that in vitro localized wear could be correlated to wear in the oral cavity52
. In
another study out of Creighton University, investigators compared specimens of P50 and
Z100 subjected to 100,000, 400,000, and 800,000 cycles in a generalized wear model.
Volume loss, maximum depth, and mean depth were all investigated. They reported that
simulated generalized wear correlated to clinical CFA wear22
.
In each of these studies, the investigators compared the results they obtained in
the laboratory to data from previous clinical trials using the same material. Although
these correlations were found, it is questionable how reliable they are. Therefore, this
goal of this study was to investigate the differences in the wear patterns and values of a
nano-hybrid composite resin system after one year of placement in an ongoing clinical
trial to controlled specimens prepared in the laboratory of the same material subjected to
200,000 and 400,000 cycles of three-body wear using the Alabama wear testing device.

21
OBJECTIVES AND HYPOTHESES
Objective: To measure and compare volumetric wear loss (mm3) and linear depth (μm)
values of in vitro specimens and in vivo restorations of a highly filled BisGMA nano-
hybrid composite resin system using a 3-D non-contact surface profilometer.
Hypothesis 1: Volume loss of wear (mm3) does not differ among tooth types, arches, or
face sides of in vivo restorations of a highly filled BisGMA composite resin system after
one year of placement.
Hypothesis 2: Linear depth of wear (μm) does not differ among tooth types, arches, or
face sides of in vivo restorations of a highly filled BisGMA composite resin system after
one year of placement.
Specific Aims 1 and 2: Casts of in vivo restorations of the same material were compared
at baseline and one year by a 3-D non-contact light profilometer. Volume loss (mm3) and
mean linear depth (μm) data were obtained for tooth type, arch, face side, and restoration
type and were compared and statistical differences were determined by
Hypothesis 3: There is no difference in volumetric wear loss of wear (mm3) of in vitro
specimens of a highly filled BisGMA composite resin system subjected to 200,000 and
400,000 cycles of wear.

22
Hypothesis 4: There is no difference in linear depth or wear (μm) of in vitro specimens
of a highly filled BisGMA composite resin system subjected to 200,000 and 400,000
cycles of wear.
Specific Aims 3 and 4: Using the same material, in vitro specimens subjected to 200,000
or 400,000 cycles of localized wear in the modified Alabama wear testing machine were
measured by a 3-D non-contact light profilometer. Volume loss (mm3) and mean linear
depth (μm) data were obtained and statistical differences were determined using pooled t-
tests if not significantly different (p > 0.10) and Sattertwaite adjustments if significantly
different (p < 0.10).
23
MATERIALS and METHODS
In Vivo Protocol
Subjects for the proposed follow-up study were recruited from the University of
Alabama at Birmingham dental clinics (University of Alabama at Birmingham
Institutional Review Board with a protocol number of #20072034-See Appendix 1). The
study was a single-center, non-blinded clinical trial with clinical evaluations at baseline
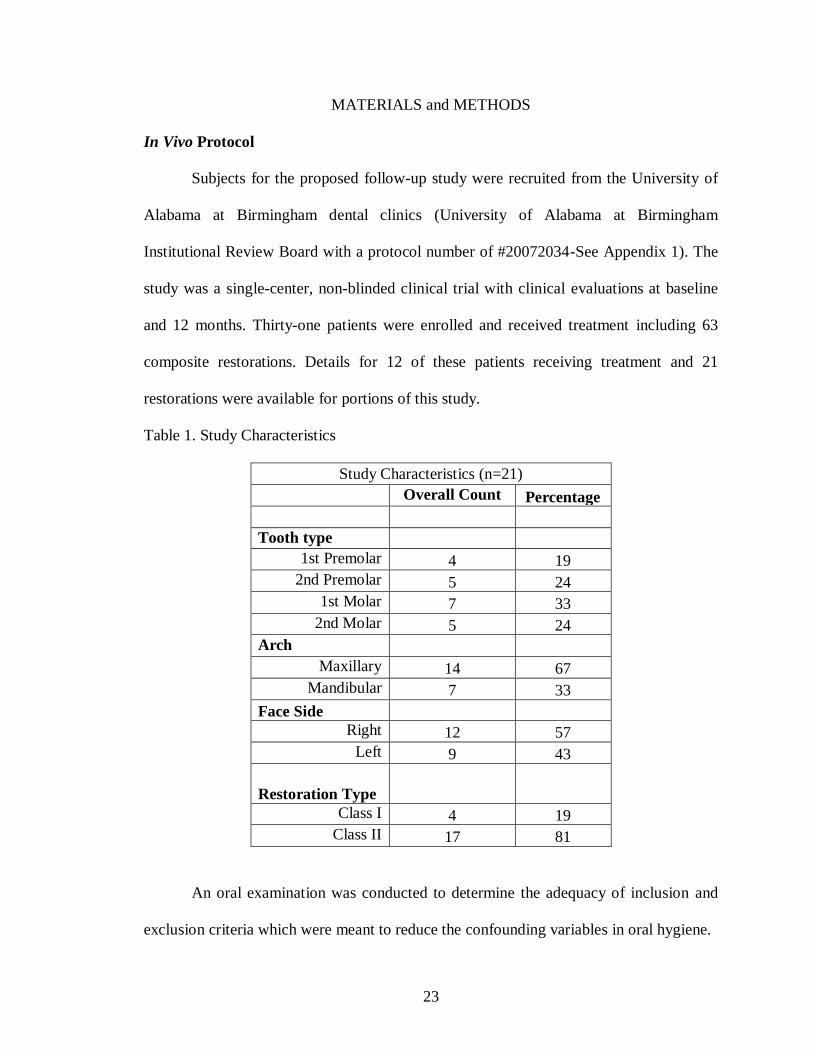
and 12 months. Thirty-one patients were enrolled and received treatment including 63
composite restorations. Details for 12 of these patients receiving treatment and 21
restorations were available for portions of this study.
Table 1. Study Characteristics
Study Characteristics (n=21)
Overall Count Percentage
Tooth type
1st Premolar 4 19
2nd Premolar 5 24
1st Molar 7 33
2nd Molar 5 24
Arch
Maxillary 14 67
Mandibular 7 33
Face Side
Right 12 57
Left 9 43
Restoration Type
Class I 4 19
Class II 17 81
An oral examination was conducted to determine the adequacy of inclusion and
exclusion criteria which were meant to reduce the confounding variables in oral hygiene.

24
Table 2. Inclusion criteria.
Inclusion criteria
1 19 years of age and older
2 Must have given written consent to participate in the trial
3 Must be in need of at least one posterior restoration (replacement restorations
are acceptable)
4 Must be in good general health
5 Must be available for the required post-operative follow-up visits
6 Restorations must have at least one contact in habitual closure with an opposing
natural or crowned tooth or a fixed bridge
7 Restorations must have a buccal to lingual/palatal width equal to or greater than
1/3 the distance from buccal to lingual/palatal cusp tips
Table 3. Exclusion criteria.
Exclusion criteria.
1 Does not meet all inclusion criteria
2 Has rampant uncontrolled caries or advanced untreated periodontal disease
3 Presents with any systemic or local disorders that contra-indicate the dental
procedures included in this study
4 Evidence of xerostomia
5 Evidence of systemic bruxing or clenching or in need of TMJ related therapy
6 Teeth with periapical pathology or exhibiting symptoms of pulpal pathology

25
7 Teeth exhibiting hypersensitivity that would not be expected to be relieved by
placement of restoration
8 Teeth that have been pulp capped
9 Teeth with near exposures (caries approaching the pulp)
10 Teeth with exposures during tooth preparation
11 Teeth requiring cusp replacement – buccal and lingual/palatal extensions are
acceptable
12 Women who are known to be pregnant or who are intending to become pregnant
over the duration of the study will not be excluded from the study. No
pregnancy test will be performed.
Investigators who performed the clinical assessments were trained in the method
of clinical examination. Investigators were trained on how to manipulate the material in
extracted or model teeth to become familiar with its handling properties. All study
procedures were explained to every subject, and every subject was provided written
consent to participate in the study. Each subject was screened for compliance with
inclusion/exclusion criteria specified in Tables 1 and 2. The patient was appointed for a
restorative appointment. Digital images were taken before restoration preparation. The
tooth to be restored was isolated with a rubber dam. The restoration was prepared using
330 and 245 burs. Any cavity preparations judged to be within 1mm of pulpal tissue
either clinically or radiographically were lined with a Ca(OH)2 containing-liner.
Phosphoric acid etchant was applied to enamel first and then dentin and agitated for 15
seconds, rinsed for 10 seconds, and dried with a high volume suction until enamel etch

26
pattern was seen. A total etch bonding system (Prime and Bond NT, DENTSPLY Caulk)
was applied to thoroughly wet all the tooth surfaces for 20 seconds. Excess solvent was
dried gently with dry air from dental syringe for 5 seconds until glossy surface appeared.
Bonding agent was cured for 20 seconds using G Light. Light output was checked
frequently to make sure it was greater than 750 mW/cm2. Sectional matrix or Tofflemire
retainer was used. Wedge and burnish matrix band were placed adjacent to contact. Low
viscosity Surefil SDR base material (DENTSPLY Caulk) was inserted and bulk filled (up
to 4mm) to within 1.5-2mm of the occlusal surface and cured with G Light (GC America)
for 20 seconds. Esthet-X HD was placed to complete the restoration and was photo-
initiated for 20 seconds with G Light. The method of placing a flowable composite under
a more wear-resistant capping material is referred to as the sandwich technique (Figure
11).
Figure 11. Sandwich Technique
Matrix band was removed and excess material was removed for gingival area
using a 12 blade. 3M finishing strips were used below the contact area. The gross contour
was removed with a 7404 bur or OS 2 (red, then yellow, and finally white). Anatomy was

27
established and refined with OS 1 bur. Embrasure areas were finished with Sof-Lex (3M
ESPE) discs. Rubber dam was removed and occlusion was adjusted with 7404, 7901, or
OS 2 burs. Finally, restoration was polished with Enhance POGO. Impressions were
disinfected using Biotrol and stored under ideal climatic conditions. First recall (baseline)
evaluation was within 10-15 days after restoration. A conventional impression was made.
Two trained examiners performed clinical assessments of the following at baseline:
fracture, proximal contact, marginal discoloration, marginal integrity, recurrent caries,
retention, sensitivity, and gingival index according to USPHS. The second recall
evaluation took place after twelve months of restoration. Conventional impression was
made. The same examiners performed the same clinical assessments as performed at the
baseline appointment.
Table 4: Materials used in vivo
Materials Manufacturer Lot No Expiration Date Shade
Curing time
Esthet-X HD DENTSPLY/Caulk
080718
R1039-1
080717
07/2011
02/2010
07/2011
A1
A2
A3
20 seconds
Material Manufacturer
Surefil SDR DENTSPLY Caulk
Prime & Bond NT DENTSPLY Caulk
Self adhesive Directed Flow Impression Tray 3M ESPE
Aquasil Ultra Heavy: Type 2: Medium bodied consistency DENTSPLY Caulk
Aquasil Ultra XLV: Type 3: Light-bodied DENTSPLY Caulk.

28
Fujirock Type 1V Die & model stone GC America
Mounting Stone Whip Mix Coroporation
Putty impression material 3M ESPE
Biotrol disinfectant solution Biotrol International
Impressions
The patient was comfortably seated in the dental chair and adjusted to a
convenient position. The dental assistant was instructed to load the Self adhesive
Directed Flow Impression Tray (3M ESPE St. Paul, MN) with Aquasil (DENTSPLY
International Inc. York, PA) Ultra Heavy: Type 2: Medium bodied consistency PVS
impression material starting from left molar area and following dentate region of the arch
through the right molar area avoiding entrapment of any air. The impression material was
dispensed from Pentamix 2 (3M ESPE St. Paul, MN) an automated machine. An air
spray was used to dry the teeth while the assistant was loading the impression tray, and
the facial surfaces of the teeth of interest were covered with Aquasil (DENTSPLY
International Inc. York, PA) Ultra XLV: Type 3: Light-bodied impression material
(cartridge) prior to insertion of the tray. Over the heavy body impression material, a
layer of light body was added in areas of interest to capture fine details. The impression
tray was inserted from the left side, and rotated into the mouth while retracting the cheek.
The impression tray was seated and slowly moved in contact with the teeth, using the
central incisors as guidance. This was done to avoid the entrapment of air into the
material. The tray was positioned using the subject’s nose as the reference point. Three

29
and half minutes after seating the tray, the impression was removed and disinfected
(Figure 12).
Figure 12. Polyvinyl Siloxane Impression
Disinfection
Biotrol disinfectant solution (Biotrol International, Salt lake City, UT) was
sprayed on the impression. The impression was then placed in a plastic bag with a code
written on it. The impressions were stored in a dry area.
Casts
The impressions were washed under tap water, and dried with air water syringe to
ensure there was no excess liquid. One hundred mg of Fujirock (GC America Alsip, IL)
Type IV Die & model stone was spatula mixed for 10 sec and followed by vacuum
mixing (Whip Mix Corporation, Model # 6500, Louisville, US) under 27 psi/ hg for 30-
40 sec with 20ml of tap water measured in a measuring cylinder at 23 ± 2 º C. According
to the manufacturer, Fujirock sets in 12 minutes and expands .08%. The color topaz was
chosen because it gave the best intensity during preliminary tests on the Proscan2000.
The mix was poured at an ambient temperature of 23 ± 2 º C and humidity of 34 ±1 %.

30
Using the stone vibrator set in slow mode the mixed stone was slowly poured into the
impression. The tray with the impression was placed in a slanting position with one
corner touching the vibrator. Care was taken not to touch the impression but the tray on
the vibrator to prevent distortion. A small amount of the stone was vibrated through the
impression to provide a thin wash of stone in the impression covering the depressions.
Subsequent stone was slowly added in small increments to fill the impression while
vibrating the impression. The impressions were not inverted. The casts were separated
from the impression trays after setting for 30 to 40 minutes (Figure 13). Patient codes
were assigned and written on the casts.
Figure 13. Final Cast
Bases
Since ProForm software was unable to compensate for more than a 6° difference
between the before and after images, the investigators in this study created an apparatus
to standardize the angulation between the bases of the baseline and one year casts. A
dental surveyor was used as the base for the apparatus. Acrylic was added to the end of
the pole and three distinctly different lines were cut into the acrylic (Figure 14).

31
Figure 14. Dental surveyor with acrylic
A base was poured up for the baseline cast using white Mounting Stone (ISO
type 3, Whip Mix Corporation). One hundred grams of Mounting Stone was spatula
mixed for 30-45 seconds with 26mL of tap water measured in a measuring cylinder at 23
± 2ºC. The Mounting Stone set in 5 minutes and expanded 0.08%. After the base had set,
putty impression material was placed on the occlusal surface extending lingually and
buccally over the cast. The acrylic covering part of the dental surveyor was lowered until
the acrylic lines were in the putty (Figure 15). This allowed the impressions of the same
patient to be standardized in the same angle along the Z axis.
Figure 15. Apparatus to standardize bases
After the putty had set, the baseline cast was removed from the apparatus and
replaced by the one year cast. The one year cast was then situated into the putty. The base

32
was then poured up for the one year using the same material as the baseline base (Figure
16). After setting, the casts were stored in plastic containers.
Figure 16. Final standardized bases
Measuring Wear
The casts were scanned using a non-contact 3-D surface profilometer measuring
instrument (Proscan2000, Scantron Industrial Products Ltd. Taunton, England) (Figure
17).
Figure 17. Proscan2000

33
The following are features of the Proscan2000:
1. Uses non-contact sensor technology which measures surfaces sensitive to the
influence of a contact technology and it does not experience problems with
penetration.
2. Has a resolution in height measurement as low as 5nm, measured at a rate of up to
1,000 points per second.
3. Proscan2000 scans the top surface of specimens over an area of up to 150mm x
100mm.
4. Uses a confocal multiplexing sensor with up to 0.005μm resolution.
5. Safe white light is transmitted through a lens, which has spectral aberration built
in. Takes the white light and divides it into the full spectral field, focusing each
different color frequency at a slightly different point through a defined measuring
range. When an object is placed within this range, only one particular color
frequency reflects back from the surface.
6. Information passes back into processor where a spectrometer analyzes the signal
and converts it to a measurement. Proscan combines these measurements with the
precise location of a moving X and Y linear table, giving three co-ordinates from
which a three dimensional profile is created.
7. Results of the surface profile appear immediately on the computer monitor and an
image of the graphical 3-D representation can be saved on the computer.
The cast was placed under the scanner with the point of interest tooth being
perpendicular to the field of vision. The step size was set at 20 μm. Then the sample rate

34
was set at 300Hz. The S29/12 sensor model was chosen because that is the best sensor for
measuring multiple teeth or a full arch. The S29/12 sensor has a measuring range o12mm,
resolution of .28μm, and uses chromatic, not triangulation, technology.
The image produced for each tooth was cropped so that only the area of the
restoration was used in the analysis (See Appendix 2). Scans for both assessment periods
for each restoration were superimposed on top of each other to determine the volumetric
wear of the material (ProForm software, Scantron Industrial Products Ltd. Taunton,
England). To achieve the goal of selecting the same points all the times, surface features
were selected and the casts were aligned to these features. This technique reduced the
error along the XY axes. The measurements were repeated two times on the same tooth
and recorded to check the operators’ reliability. Each of the casts was positioned carefully
to be able to reproduce the same axis orientation.
In Vivo Data Analysis
The statistical method used was mixed-model analysis of variance. Separate
analyses were conducted for volume and for depth, and for each of the potential predictor
variables tooth type, arch, face side, and restoration type. Patient was included as a
random effect in each model in order to account for correlation among multiple
measurements made on the same patient. Least-squares means were calculated in order to
adjust for unequal numbers of observations per patient.
In Vitro Specimen preparation
Table 5: Materials used in vitro
Materials Manufacturer Lot No Expiration Curing time Shade

35
Date
Group 1 (n=8)
200,000 cycles
Esthet-X HD
DENTSPLY/
Caulk
0907171 July 2012 20 seconds Y-E
Group 2 (n=8)
400,000 cycles
Esthet-X HD
DENTSPLY/
Caulk
0812301
December
2011
20 seconds A2
A cylindrical mold made of an impression material with diameter of 8mm and
height of 5mm was used to prepare the composite samples, 8 for each group. Composite
specimen was built up in 2 increments, 2mm each and cured with visible curing light
FusionTM
(Dentlight, TX, USA) 530mW/cm2, according to the required curing time by
the manufacturer (Figure 18). The specimens were prepared in a room with 40%
humidity and a temperature of 25°C. The top layer was cured through a glass slide which
was placed on composite to create a flat surface.
Figure 18. Composite build-up
Specimens were stored in the incubator at 37ºC for 24 hours after which they
were embedded in the center of brass holders (d=15mm) using a self curing acrylic
material (Flash Acrylic), creating a flat surface (Figure 19). They were polished using
600, 1200-grit SiC abrasive paper under water spray (for 2 minutes rotating 90° every 30
seconds) followed by finishing with 0.05µ alumina slurry and a polishing cloth using a

36
rotational polishing device for one minute (No: 233-0-1997, Buehler Ltd, Evanston, IL).
They were cleaned with an ultrasonic bath for 5 minutes using distilled water.
Figure 19. Prepared wear specimen
Determination of in vitro wear
The specimens were then subjected to wear using the Alabama Wear Testing
Device. The specimens were mounted in a water bath and a cylinder was placed around
each sample. A water-slurry of PMMA (15 grams of PMMA for 9 grams of water) was
poured into each cylinder, covering the specimens. The stainless steel antagonists (Type
440C; diameter=4.70mm; Rockwell hardness=58-65, Small Parts Inc.) were mounted in
spring-loaded styli and used with the PMMA slurry to simulate localized wear. The styli
were calibrated to be 75N using an Instron machine (INSTRON Model no:5565). At a
rate of 1.2 Hz (72cycles/min), the stainless steel stylus was vertically loaded onto the
specimen under a load of 75N (16.8 pounds). As soon as the maximum load was
achieved, the stylus rotated clockwise 30 degrees and then counter-rotated. The stylus
then moved vertically up into its original position. The entire cycling procedure was
carried out 200,000 and 400,000 times for 8 specimens (Figure 20).

37
Figure 20. Specimen after subjection to wear
Specimens were scanned using a non-contact 3D surface profilometer
(PROSCAN 2000, Scantron Industrial Products Ltd. Taunton, England). The pre- and
post-test surfaces were compared using ProForm software (Scantron Industrial Products
Ltd. Taunton, England-See Appendix 3). ProForm software provides conditions for
determining volume loss (mm3), the total volumetric loss of material from the profiled
surface, and maximum depth (μm), the lowest or deepest points from al the individual
scans. The wear measurements were based on differences observed between the before
and after data sets.
In Vitro Data Analysis
The volume and depth was compared between the two groups using t-tests.
Pooled t-tests were used when the group variances were not significantly different (p >
0.10). Satterthwaite adjustment was used when group variances were significantly
different (p < 0.10).

38
RESULTS
Table 6. Results (mean ± standard deviation)
Volume Loss (mm3) Mean Depth (μm)
In Vivo 1.791±.7583 489.25±236.73
In Vitro – 200,000 cycles .011±.0019 58.69±8.47
In Vitro – 400,000 cycles .017±.0025 76.38±16.53
Table 7. In Vivo Results (See Appendix 2 for Images)
Restoration
# Tooth Type Arch
Face
Side
Restoration
Type
Pt
Number
Volume
(mm3)
Depth
(μm)
1 1st Premolar Maxillary Right Class 2 1 0.484 279.46
2 2nd Premolar Maxillary Left Class 2 1 0.797 187.36
3 2nd Molar Mandibular Left Class 2 2 2.849 357.05
4 1st Premolar Maxillary Left Class 2 3 1.982 403.45
5 2nd Premolar Maxillary Left Class 2 3 3.088 842.91
6 1st Molar Maxillary Right Class 2 4 1.428 268.01
7 1st Molar Mandibular Right Class 2 4 2.748 540.53
8 2nd Molar Mandibular Right Class 2 4 2.804 370.11
9 1st Molar Maxillary Right Class 2 5 2.072 333.34
10 2nd Premolar Maxillary Right Class 2 5 1.309 519.12
11 2nd Molar Maxillary Right Class 1 6 2.156 900.45
12 2nd Molar Mandibular Right Class 1 6 1.423 279.26
13 1st Premolar Mandibular Left Class 2 7 1.339 372.2
14 2nd Premolar Mandibular Right Class 2 7 1.672 438.5
15 1st Molar Maxillary Left Class 2 8 1.846 538.35
16 1st Premolar Maxillary Left Class 2 9 1.849 546.84
17 1st Molar Maxillary Left Class 1 9 1.327 445.63
18 2nd Premolar Maxillary Left Class 1 10 0.656 353.08
19 2nd Molar Mandibular Right Class 2 10 2.924 400.92
20 1st Molar Maxillary Right Class 2 11 1.564 777.24
21 1st Molar Maxillary Right Class 2 12 1.292 1120.51
39
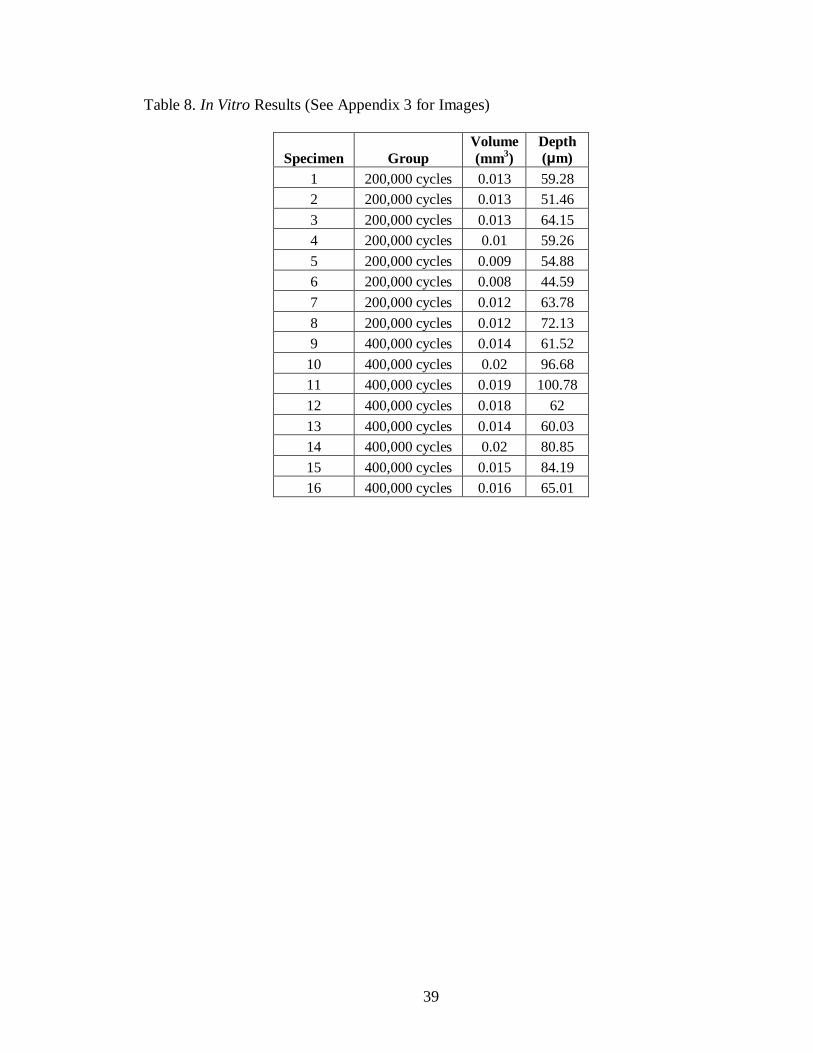
Table 8. In Vitro Results (See Appendix 3 for Images)
Specimen Group
Volume
(mm3)
Depth
(μm)
1 200,000 cycles 0.013 59.28
2 200,000 cycles 0.013 51.46
3 200,000 cycles 0.013 64.15
4 200,000 cycles 0.01 59.26
5 200,000 cycles 0.009 54.88
6 200,000 cycles 0.008 44.59
7 200,000 cycles 0.012 63.78
8 200,000 cycles 0.012 72.13
9 400,000 cycles 0.014 61.52
10 400,000 cycles 0.02 96.68
11 400,000 cycles 0.019 100.78
12 400,000 cycles 0.018 62
13 400,000 cycles 0.014 60.03
14 400,000 cycles 0.02 80.85
15 400,000 cycles 0.015 84.19
16 400,000 cycles 0.016 65.01

40
DISCUSSION
In this study, the investigators found that it was inappropriate to compare in vivo
and in vitro data due to the large amount of different parameters between the two groups.
Observations from the Proscan2000 images showed different wear patterns between the
two groups. The specimens that were prepared in the laboratory were standardized and
controlled. Therefore, their wear patterns consistently showed the same conical shape. On
the other hand, the restorations from the clinical trial showed varied amounts of wear
throughout the entire surface of the restorations. The Proscan images shoed inconsistent
wear patterns with different shapes and sizes. It was concluded that there were different
mechanisms of wear being exhibited and was therefore inappropriate to compare the two
groups statistically.
Clinical trials are expensive and time consuming, so companies rely on results
from laboratory testing. It is easier and less expensive yet less accurate to work outside of
the mouth where conditions are standardized. Researchers cannot take wear results
straight from in vitro studies and use them to predict the amount of in vivo wear. Results
from in vitro studies can only be used to rank and compare materials.
In this study, even with 21 restorations, there were too many variations in the
restorations to accurately correlate wear between the clinic and the standardized
laboratory specimens. There are many factors that limit the outcome of the results in a
clinical trial, especially one measuring wear. Patients ranged in age, sex, dietary and
smoking habits, chewing habits and patterns, dominate chewing side, caries risk
assessment, size of restoration, location of restoration, and bite force, all of which have
been proven to affect the amount of wear. Although all of the restorations were placed in

41
the posterior region, most of them were class 2 and only a few were class 1. Each
restoration varied in size and depth depending on how deep the caries extended. Another
factor that varies from individual to individual is biting force. It is generally found that
males can bite with more force (118-142 lbs) than can females (79-99 lbs)60
. There was a
mixture of males and females included in this study. The location of the restoration can
also have an effect on how much wear will occur. The current study included 1st and 2
nd
molars along with 1st and 2
nd premolars. It has been noted that the maximum amount of
force applied to a molar (91-198 lbs) is usually several times that which can be applied to
an incisor (29-51 lbs)61
. Another variable that influenced the analysis was the amount of
restorations each patient received. Some patients had up to three restorations placed in
their mouths. This multiple observations/patient influenced the results. Furthermore,
patients’ variations in dietary and chewing habits influence the wear resistance of the
restorative material. Food consistencies can have a significant impact on force. Anderson
measured bite force on carrots (30 lbs) versus mean (16 lbs)62
. Other confounding
variables in this study were amount of clinicians placing restorations, and the accuracy
and precision of impressions and casts. Due to all of these discrepancies between patients
and restorations, it was concluded that the in vivo and in vitro values could not properly
be compared to each other. Instead, the investigators made comparisons within the two
groups.
The 1st and 2
nd hypotheses looked at comparisons of volume and depth loss values
between tooth type, restoration type, arch, and face side of in vivo restorations. The 3rd
ad
4th hypotheses looked at the differences between volume and depth loss in the two in
vitro groups.

42
For the clinical data, the within-subject (intraclass) correlations ranged from 0,
which did not affect the results, to 0.2720, which is a substantial ICC and even with the
relatively small number of observations per person (mean = 1.75) resulted in a design
effect of approximately 1.2, corresponding to a reduction of power by approximately
20% relative to having the same number of observations on independent units (people).
Least-squares means accounted for bias due to the unequal numbers of observations. The
investigators failed to reject null hypothesis 1 that volume loss (mm3) does not differ
among tooth types, arches, or face sides of in vivo restorations. Also, the investigators
failed to reject null hypothesis 2 that linear depth (μm) does not differ among tooth types,
arches, or face sides of in vivo restorations. Not finding significant differences does not
argue for there being no association. The small sample size does not provide sufficient
power to justify a statement of equivalence. The magnitude of the differences was judged
by looking at the least square means for each analysis.
The investigators rejected null hypothesis 3 that there is no difference in
volumetric wear loss (mm3) of in vitro specimens of a highly filled BisGMA composite
resin system subjected to 200,000 and 400,000 cycles of wear. They also rejected null
hypothesis 4 that there is no difference in linear depth (μm) of in vitro specimens of a
highly filled BisGMA composite resin system subjected to 200,000 and 400,000 cycles of
wear. There were significant differences found between the two groups in both volume
and depth loss. This conclusion goes along with what was expected when the amount of
cycles was doubled.
Although it has been successfully used many times to scan and measure the wear
loss of in vitro specimens, this was the first time that the Proscan2000 was used for

43
clinical wear. The only time the Proscan2000 was found to be cited in the literature was
in a study where it was used to determine the surface roughness values of different
enamel conditioning techniques63
. In the beginning of this study, the goal was to scan all
of the restorations (baseline and one year) in the DENTSPLY/Caulk clinical trial. Due to
technical and time issues, in the end, a representative sample of the restorations was able
to be included in this study. On the other hand, this study did allow the investigators the
ability to see that the Proscan2000 could properly quantify wear loss in vivo.

44
SUGGESTIONS FOR FUTURE RESEARCH
After performing this study, the investigators suggest that the following variables
should be isolated in future clinical trials to make them more controlled: bite force,
dominant chewing side, occlusion (where occlusal cusps contact restoration), amount of
restorations per patient, age, and sex.
In the clinical portion of this study, the material being investigated was placed on
top of a flowable low-stress/shrinkage composite resin, Surefil SDR, which has a higher
modulus than Esthet-X HD. It would be interesting to investigate the role that the
flowable material played on the wear of the capping material. Since Surefil SDR was
filled in 4mm increments up to the CEJ, not every restoration was filled with the same
amount of Esthet-X HD. Some were capped over the Surefil SDR in 1, 2, or even 3 mm
increments. In the laboratory, the specimens were prepared by being set into acrylic
inside of brass holders. Future studies could include both materials being placed in the
brass holders.
It is important to note that improvements and modifications can be made to design
a device that will more accurately portray what is going on in the oral cavity and produce
comparable wear deficits to the ones found in vivo. This can be done by cycling of
medium, temperature, and pH. Future investigators should also look at changing the
mechanisms of the Alabama Wear Testing Device to a twist and slide rotation that would
closely simulate the chewing patterns in the oral cavity.
Future investigators can state that in 2010 Michelson, et. al tried to assess
differences in clinical and in vitro wear and found that the generation of the Alabama

45
Wear Testing Device used in this study does not directly correlate to what is occurring in
the mouth.
46
LIST OF REFERENCES
1. Burke FJ. Amalgam to tooth-coloured materials-implications for clinical practice
and dental education: governmental restrictions and amalgam-usage survey
results. J Dent 2004; 32(5):343-50.
2. Gladwin M, Bagby M. Clinical Aspects of Dental Materials: Theory, Practice,
and Cases. Lippincott Williams and Wilkins. 2nd
Edition.
3. Philips’ Science of Dental Materials: Anusavice. W.B. Saunders Company. 10th
Edition. Copyright 1996.
4. Albers H. Tooth-Colored Restoratives: Principles and Techniques. BC Decker
Inc. Elsevier. Copyright 2002. 9th Edition.
5. Jones DW. Has dental amalgam been torpedoed and sunk? J Den Res 2008;
87:101-2.
6. Wilder AD, May KN, Leinfelder KF. Three-year clinical study of UV-cured
composite resins in posterior teeth. J Prosthet Dent 1983;50(1):26-30.
7. Lutz F, Phillips RW. A classification and evaluation of composite resin systems. J
Prosthet Dent 1983; 50(4):480-8.
8. Weitman RT, Eames WB. Plaque accumulation on composite surfaces after
various finishing procedures. J Am Dent Assoc 1975. 91(1):101-6.
9. Szeri AZ, In: Larson RW, Dorfman M, editors. Tribology friction, lubrication,
and wear. McGraw-Hill Book Company; 1980, ISBN 0-07-062663-4.
10. Rabinowicz E. Friction and wear of materials. New York: John Wiley; 1965. p
167-179.
11. Spijker AV, Rodriguez M, Kreulen C, Bronkhorst E, Bartlett DW, Creugers NHJ.
Prevalence of Tooth Wear in Adults. Int J Prosthodont 2009; 22(1):35-42.
12. Gatti, AM. Biocompatibility of micro- and nano particles. Parts I and II.
Biomaterials 2002; 23:2381-7.
13. Archard JF. Contact and rubbing of flat surfaces. J Appl Phys 1953;24:981-8.
14. Soderholm KJ. Degradation mechanisms of dental resin composites in: Dental
material in vivo aging and related phenomena. Quintessence Books. Edited by
Eliades G, et al. 2003. (7):99-122.

47
15. Soderholm KJ, Lambrechts P, Sarrett D, Abe Y, Yang MC, Labella R. Clinical
wear performance of eight experimental dental composites over three years
determined by two measuring methods. Eur J Oral Sci 2001; 109:273-81.
16. Materials ACoD. Posterior composite resins: an update. Council on Dental
Materials, Instruments, and Equipment. J Am Dent Assoc 1986; 113:950-1.
17. ISO. Dental materials – guidance on testing of wear. Part 2. Wear by two-and/or
three-body contact. Technical Specification 2001; No. 14569-2.
18. Schmidlin PR, Pasqualetti T, Imfeld T, Besek M. An in vitro model for the
simulation of approximal wear. Schweiz Monatsschr Zahnmed 2003; 113(4):427-
38.
19. Wendt SL, Ziemiecki TL, Leinfelder KF. Proximal wear rates by tooth position of
resin composite restorations. J Dent 1996; 24:33-39.
20. Hickel R, Manhart J. Longevity of restorations in posterior teeth and reasons for
failure. J Adhes Dent 2001; 3;45-64.
21. El-Badrawy WA, Leung BW, El-Mowafy O. Rubo JH, Rubo MH. Evaluation of
proximal contacts of posterior composite restorations with four placement
techniques. J Can Dent Assoc 2003; 69:162-7.
22. Barkmeier W, Latta M, Erickson R, Lambrechts P. Comparison of laboratory and
clinical wear rates of resin composites. Quint Int. 2004; 35(4):269-74.
23. Delong R. Intra-oral restorative materials wear: Rethinking the current
approaches: How to measure wear. Dent Mater. 2006; 22:702-11.
24. Cvar JF, Ryge G. Criteria for the clinical evaluation of dental restorative
materials. USPHS Publication #790-2244. San Francisco: US Government
Printing Office; 1971.
25. Leinfelder KF. Evaluation of criteria used for assessing the clinical performance
of composite resins in posterior teeth. Quintes Int 1987; 18(8)531-6.
26. Taylor DF, Bayne SC, Sturdevant JR, Wilder AD. Comparison of direct and
indirect methods for analyzing wear of posterior composite restorations. Dent
Mater 1989; 5(3)157-60.
27. Leinfelder KF, Taylor DR, Barkmeier WW, Goldberg AJ. Quantitative
measurements of posterior composite resins. Dent Mater 1986; 2:198-201.

48
28. Peters MCRB, DeLong R, Pintado MR, Pallesen U, Quist V, Douglas WH.
Comparison of two measurement techniques for clinical wear. J Dent 1999;
27:479-85.
29. Bayne SC, Taylor DF, Rekow ED, Wilder AD, Heyann HO. Confirmation of
Leinfelder clinical wear standards. Dent Mater 1994; 10 (1) 11-8.
30. Lugassy AA, Moffa JP. Laboratory model for the quantification of clinical
occlusal wear. J Dent Res 1985; 64:181 (Abstract no 63).
31. Winkler MM, Lautenschlager EP, Boghosian A, Greener EH. Visual versus
mechanical wear measurement of dental composite resin. J Oral Rehabil 1996;
23(7)494-500.
32. Soderholm KJ, Roberts MJ, Antonson DE, Anusavice KJ, Mauderli AP, Sarrett
DC, Warren JW. Visual and Profilometric Wear Measurements. 1992; 50(2)121-
7.
33. Kawai K, Tsuchitani Y. Comparison of two methods for measuring generalized
wear of dental materials. J Osaka Univ Dent Sch 1994; 34:1-8.
34. Chuenarrom C, Benjakul P. Comparison between a profilometer and a measuring
microscope for measurement of enamel erosion. Jour of Oral Scie 2008;
50(4)475-479.
35. Perry R, Kugel G, Kunzelmann KH, Flessa HP, Estafan D. Composite restoration
wear analysis: conventional methonds vs. three dimensional laser digitizer. J Am
Dent Assoc 2000; 131 (10):1472-7.
36. Winkler MM, Lautenschlager EP, Boghosian A, Greener EH. An accurate and
simple method for the measurement of dental composite wear. J Oral Rehabil
1996; 23(7)486-93.
37. Bland JM, Altman DG. Measuring agreement in method comparison studies. Stat
Methods Med Res 1999; 8:135-160.
38. Fruhauf J. Problems of countour measuring on microstructures using a surface
profiler. Meas Sci Teachnol 1998; 9:293-6.
39. Delong R, Henizen M, Hodges JS, Ko CC, Douglas WH. Accuracy of a system
for creating 3D computer models of dental arches. J Dent Res 2003; 82(6):438-42.
40. Hewlett ER, Orro ME, Clark GT. Accuracy testing of three-dimensional
digitizing systems. Dent Mater 1992;8(1)49-53.

49
41. Jovanovski V, Lynch E. Analysis of the morphology of oral structures from 3D
co-ordinate data. Monogr Oral Sci 2000; 17:73-129.
42. Mehl A, Gloger W, Kunzelmann KH, Hickel R. A new optical 3-D device for the
detection of wear. J Dent Res 1997; 76(11)1799-1807.
43. FDA, Center for Devices and Radiological Health. Good Laboratory Practice
(GLP) (PART 58 52 FR 33780, 1978. Last revision 2004); 1978.
44. Condon J, Ferracane J. Evaluation of composite wear with a new multi-mode oral
wear simulator. Dent Mater 1996; 12:218-26.
45. Yap AUJ, Long FKL, Teoh SH, Hastings GW. Comparative wear rankings of
dental restoratives with the BIOMAT wear simulator. J of Oral Rehab 1999;
26:228-35.
46. Delong R, Douglas WH. Development of an artificial oral environment for the
testing of dental restoratives: bi-axial force and movement control. J Dent Res
1983; 62:32-6.
47. de Gee AJ, Pallav P. Occlusal wear simulation with the ACTA wear machine. J
Dent 1994; 22 Suppl 1:S21-7.
48. Krejc I, Reich T, Lutz F, Albertoni M. An in vitro test procedure for evaluating
dental restoration systems. 1. A computer controlled mastication simulator.
Schwiez Monatsschr Zahnmed 1990; 100:953-60.
49. Lambrechts P, Debels E, van Landuyt K, Peumans M, van Meerbeek B. How to
simulate wear? Overview of existing methods. Dent Mater 2006; 22:693-701.
50. Leinfelder KF, Beaudreau RW, Mazer RB. In vitro device for predicting clinical
wear. Quintessence Int 1989; 20 (10):755-61.
51. Proffit WR, Fields HW, Nixon WL. Occlusal forces in normal- and long-face
adults. J Dent Res 1983; 62:566-70.
52. Givan DA. Degradation of Experimental Composite Materials and In Vitro Wear
Simulation. (PhD Dissertation. UAB Department of Biomedical Engineering;
2001.
53. Heintz SD, Sappini G, Rousson V. Wear of ten dental restorative materials in five
wear simulators-Results of a round robin test. Dent Mater 2005; 21:304-17.
54. Sakaguchi RL, Douglas WH, DeLong R, Pintado MR. The wear of a posterior
composite in an artificial mouth: a clinical correlation. Dent Mater, 1986; 2:235-
40.

50
55. Ekfeldt A, Oilo G. Wear of prosthodontic materials-an in vivo study. J Oral
Rehabil 1990; 17:117-129.
56. Delong R, Sakaguchi RL, Douglas WH, Pintado MR. The wear of dental
amalgam in an artificial mouth: a clinical correlation. Dent Mater 1985;1(6)238-
42.
57. Lutz F, Krejci I. Mesio-occlusodistal amalgam restorations: quantitative in vivo
data up to 4 years. A data base for the development of amalgam substitutes. Quint
Int 1994; 25:185-90.
58. Leinfelder K, Suzuki S. In vitro wear device for determining posterior composite
wear. JADA 1999; 130:1347-53.
59. Barkmeier WW, Latta MA, Erickson RL, Wilwerwing TM. Wear simulations of
resin composites and the relationship to clinical wear. Op Dent 2008; 33(2):177-
82.
60. Brekhus PH: Stimulation of the muscles of mastication, J Dent Res 20:87-92,
1941.
61. Howell AH, Manly RS: An electronic strain gauge for measuring oral forces, J
Dent Res 27: 705-712, 1948.
62. Anderson DJ. Measurement of stress in mastication. J Dent Res 1956; 35:664.
63. Barkmeier WW, Erickson RL, Kimmes NS, Wilwerding TM. Effect of enamel
etching time on roughness and bond strength. Oper Dent 2006. 34(2):217-22.

51
Appendix 1: IRB Approval Forms

52

53

54

55
Appendix 2: In Vivo Scans at Baseline, 1 year,
and Superimposition of Restoration

56
Restoration #1

57
Restoration #2

58
Restoration #3

59
Restoration #4

60
Restoration #5

61
Restoration #6

62
Restoration #7

63
Restoration #8

64
Restoration #9

65
Restoration #10
Restoration #1
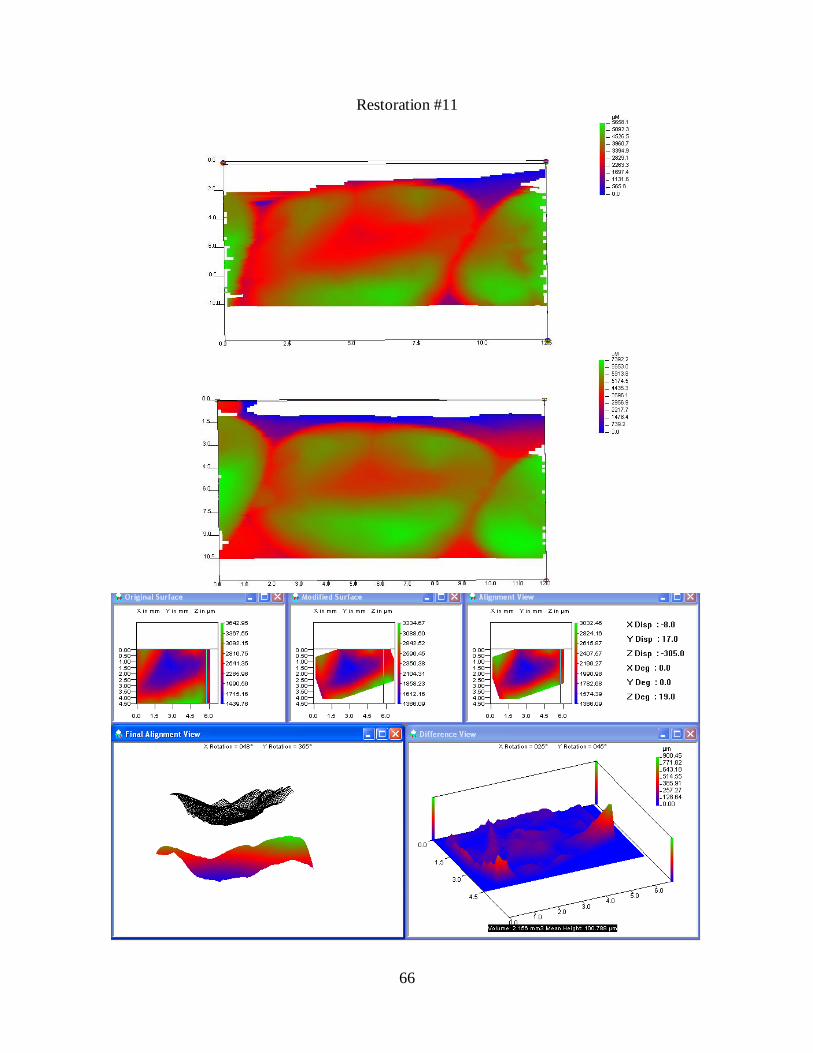
66
Restoration #11

67
Restoration #12

68
Restoration #13

69
Restoration #14

70
Restoration #15

71
Restoration #16

72
Restoration #17

73
Restoration #18
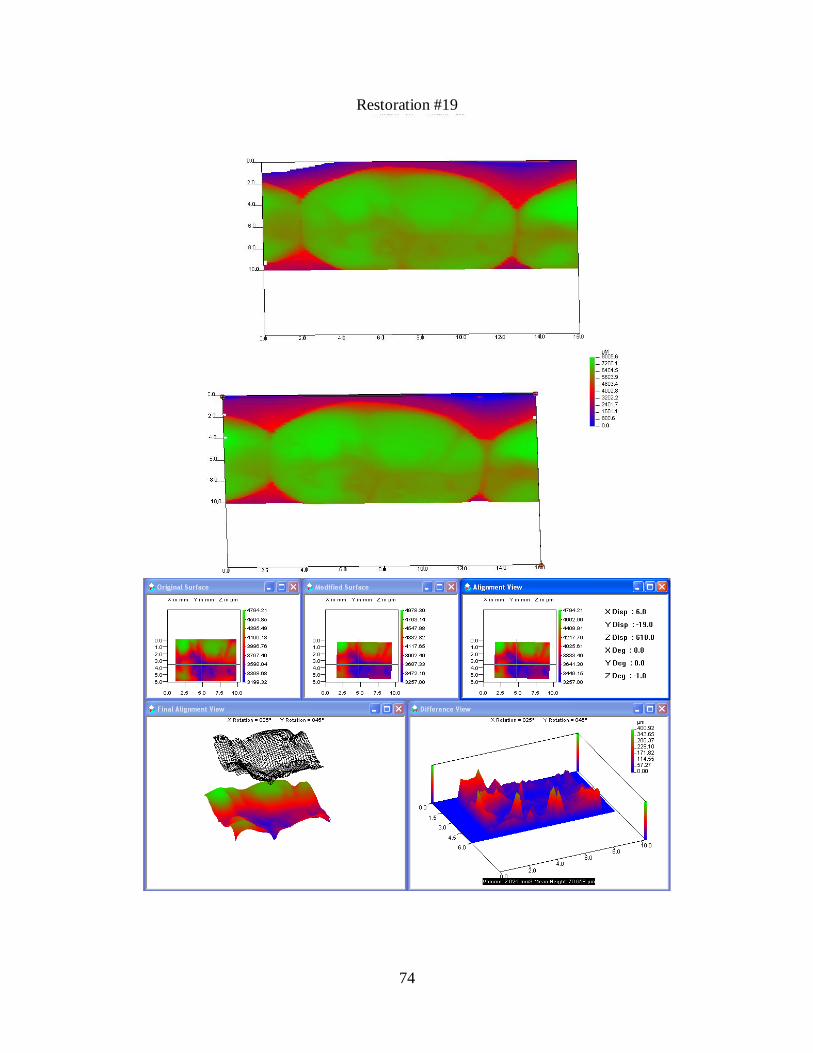
74
Restoration #19

75
Restoration #20

76
Restoration #21

77
Appendix 3: In Vitro Superimposition

78
Specimen 1 – 200,000 cycles
Specimen 2 – 200,000 cycles

79
Specimen 3 – 200,000 cycles
Specimen 4 – 200,000 cycles
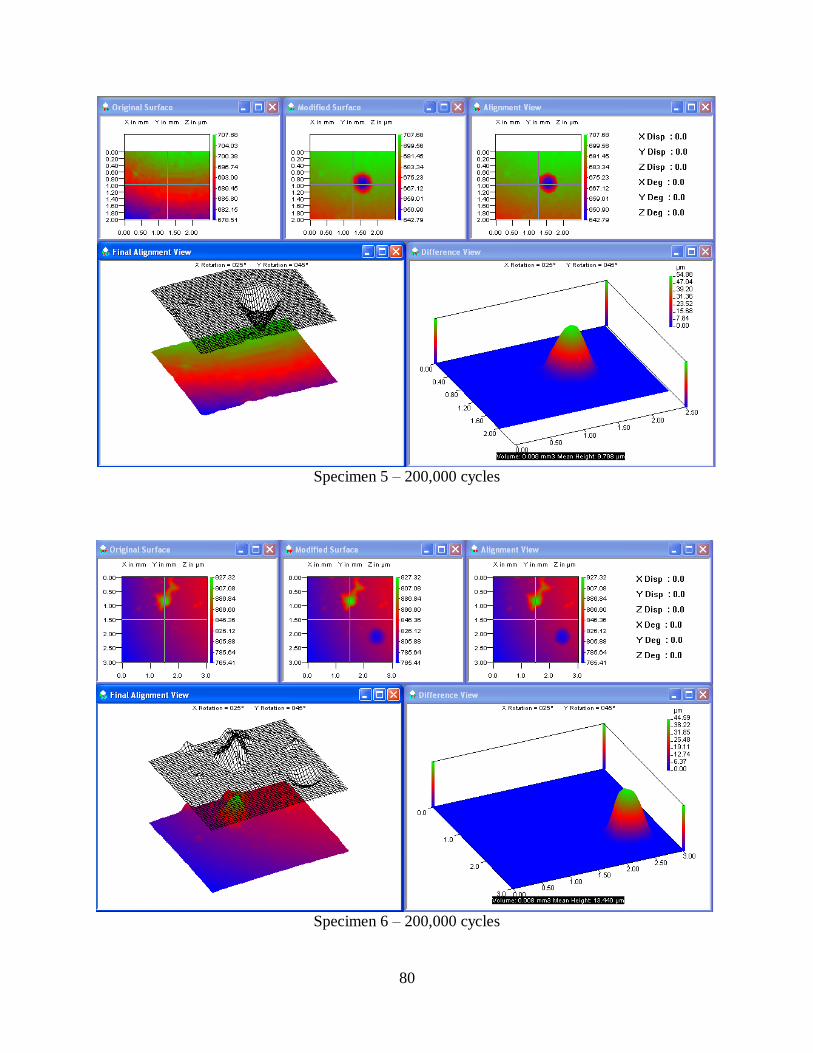
80
Specimen 5 – 200,000 cycles
Specimen 6 – 200,000 cycles
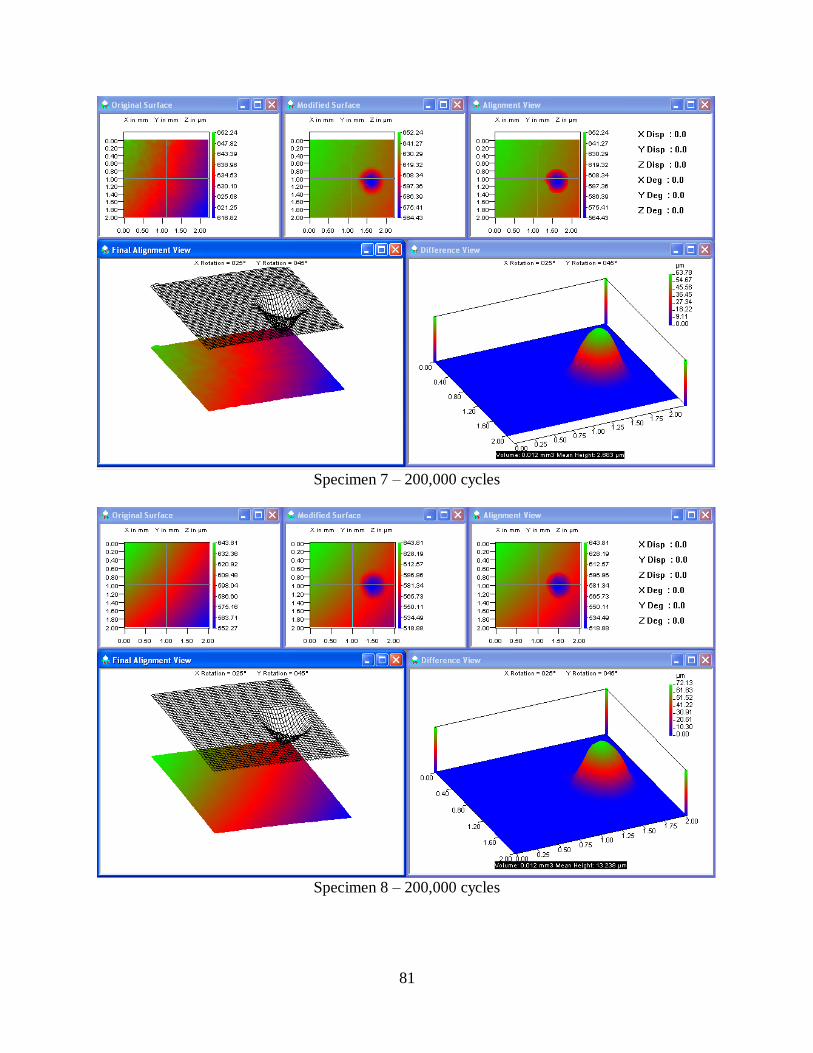
81
Specimen 7 – 200,000 cycles
Specimen 8 – 200,000 cycles

82
Specimen 1 – 400,000 cycles
Specimen 2 – 400,000 cycles

83
Specimen 3 – 400,000 cycles
Specimen 4 – 400,000 cycles

84
Specimen 5 – 400,000 cycles
Specimen 6 – 400,000 cycles

85
Specimen 7 – 400,000 cycles
Specimen 8 – 400,000 cycles