
MENA-U.S. - · PDF fileArab MENA and GAFTA Non-Arab MENA AGADIR COMESA OPEC US FTA EuroMed...
24
April 2015 Promoting Business between the U.S. and the MENA region MENA-U.S. Trade and Investment Report
Transcript of MENA-U.S. - · PDF fileArab MENA and GAFTA Non-Arab MENA AGADIR COMESA OPEC US FTA EuroMed...

April 2015
Promoting Business between the U.S. and the MENA region
MENA-U.S.Trade and Investment Report
1. Background on MENA MENA is an acronym for “Middle East and North Africa,” a geographicclassification for a group of countries extending from Morocco in northwestAfrica to Djibouti in southeast Africa, and Iran in southwest Asia. According tothe World Bank, the MENA region consists of 21 member countries, of which 18are Arab nations, in addition to the Islamic Republic of Iran, Malta and Israel.
Whichever definition of MENA is used, it is a region unique in its geopoliticalsetting and supported by a longstanding history of strategic internationaleconomic relations and strong political dialogue.
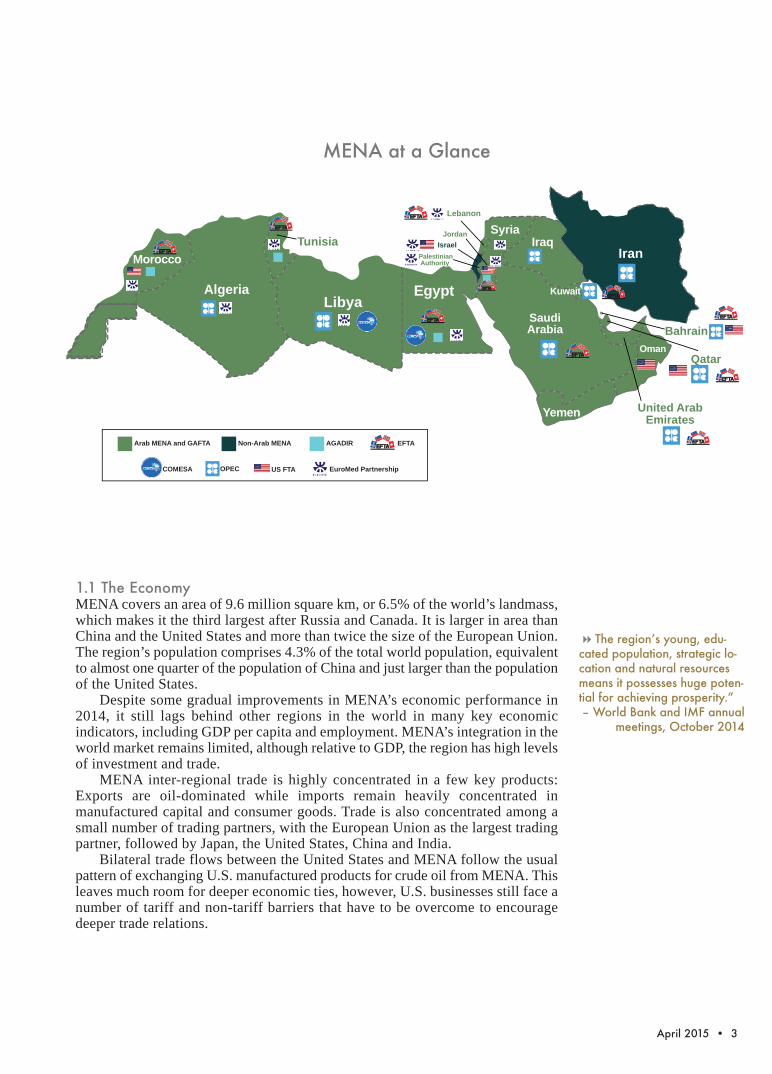
The MENA region is endowed with a wealth of natural petroleum resources(60% of world oil reserves and 45% of natural gas reserves) concentrated in theArabian Gulf and Maghreb and serving as important growth engines for thesecountries. Eight MENA countries are members of the Organization of PetroleumExporting Countries (OPEC), founded in 1960, while 10 Arab countries currentlycomprise the Organization of Arab Petroleum Exporting Countries (OAPEC),founded in 1968. All Arab MENA nations are members of the Arab League andthe Greater Arab Free Trade Area (GAFTA).
In this report, MENA refers to the 16 Arab countries of Algeria, Bahrain,Egypt, Iraq, Jordan, Kuwait, Lebanon, Libya, Morocco, Oman, Qatar, SaudiArabia, Syria, Tunisia, the United Arab Emirates (UAE) and Yemen, plus WestBank and Gaza. Within this group are three geopolitical blocs: the GulfCooperation Council (GCC), comprising Bahrain, Kuwait, Oman, Qatar, SaudiArabia and UAE; the Maghreb, comprising Algeria, Libya, Morocco and Tunisia;and the Mashreq comprising Lebanon, Syria and the former members of the now-defunct Arab Cooperation Council (ACC) Egypt, Iraq, Jordan and Yemen.
The focus here will be on recent trends in investment and trade between theUnited States and the nine members of the AmCham MENA Regional Council
— Algeria, Bahrain, Egypt, Jordan, Lebanon, Morocco, Tunisia, the UAE andWest Bank and Gaza.
2 • MENA-U.S. Trade and Investment Report
Promoting Business between the U.S. and the MENA region
MENA-U.S.Trade and Investment Report
April 2015 • 3
1.1 The Economy MENA covers an area of 9.6 million square km, or 6.5% of the world’s landmass,which makes it the third largest after Russia and Canada. It is larger in area thanChina and the United States and more than twice the size of the European Union.The region’s population comprises 4.3% of the total world population, equivalentto almost one quarter of the population of China and just larger than the populationof the United States.
Despite some gradual improvements in MENA’s economic performance in2014, it still lags behind other regions in the world in many key economicindicators, including GDP per capita and employment. MENA’s integration in theworld market remains limited, although relative to GDP, the region has high levelsof investment and trade.
MENA inter-regional trade is highly concentrated in a few key products:Exports are oil-dominated while imports remain heavily concentrated inmanufactured capital and consumer goods. Trade is also concentrated among asmall number of trading partners, with the European Union as the largest tradingpartner, followed by Japan, the United States, China and India.
Bilateral trade flows between the United States and MENA follow the usualpattern of exchanging U.S. manufactured products for crude oil from MENA. Thisleaves much room for deeper economic ties, however, U.S. businesses still face anumber of tariff and non-tariff barriers that have to be overcome to encouragedeeper trade relations.
44The region’s young, edu-cated population, strategic lo-cation and natural resourcesmeans it possesses huge poten-tial for achieving prosperity.” – World Bank and IMF annual
meetings, October 2014
r
Ethiopia
COMESA
Egypt-EU Partnership
Arab MENA and GAFTA
Sudan
COMESA and GAFTA
Non-Arab MENA
COMESA and GAFTA
Tunisia
Bahrain
Algeria
Morocco
Libya
IraqSyria
Kuwait
Qatar
Jordan
Oman
United ArabEmiratesYemen
SaudiArabia
Lebanon
Egypt
PalestinianAuthority
Iran
Arab MENA and GAFTA Non-Arab MENA AGADIR
COMESA OPEC US FTA EuroMed Partnership
Israel
EFTA
MENA at a Glance

4 • MENA-U.S. Trade and Investment Report
Trade and investment within MENA holds promising opportunities for growthand development. The U.S. is helping MENA in improving trade openness. InJordan, for example, the U.S. is working with customs authorities to smooth andexpedite the processing of goods at the borders. Similar projects in Egypt areunderway to computerize transactions so that patterns can be evaluated and dutiescould be quickly collected. The World Bank’s International Finance Corporation(IFC) MENA supports the region’s private sector by helping create jobs and drivesustainable and inclusive growth through a combination of investments andadvisory services.
1.2 The Economic OutlookGrowth forecasts for MENA for 2015 also vary between the oil exporters and oilimporters, with an overall projected growth rate of 3.2% in 2015 compared to2.6% in 2014 and 2.1% in 2013.
44MENA accounts for 4.3% ofworld population, which con-tributes to 3.8% of world GDPand 5.9% of global trade.
Source: Calculated from CIA and EIU
Total/ Average
Total Population (million) 314.18
Total Land Area (km2) 9,583,083
Average Population Density (people/km2) 233.44
Population Growth Rate 1.98%
Total Labor Force (million) 100.44
Top Three by Land Area (million km2)
Algeria 2.38
Saudi Arabia 2.15
Libya 1.76
Top Three by Population (million)
Egypt 82.1
Algeria 38.3
Morocco 33.0
Top Three by Population Density (people/km2)
Bahrain 1,729.06
West Bank and Gaza 731.10
Lebanon 565.63
Top Three by Labor Force (million)
Egypt 27.69
Morocco 11.73
Algeria 11.15
MENA Demographics (2013)
Algeria
Bahrain
Egypt
Iraq
Jordan
Kuwait
Lebanon
Libya
Morocco
Oman
Qatar
Saudi Arabia Syria
Tunisia
UAE
West Bank and Gaza
Yemen
-20%
0%
20%
40%
60%
80%
100%
120%
140%
-20% 20% 40% 60% 80% 100% 120% 140% 160% 180%
Shar
e of
FD
I Sto
ck in
GD
P (%
)
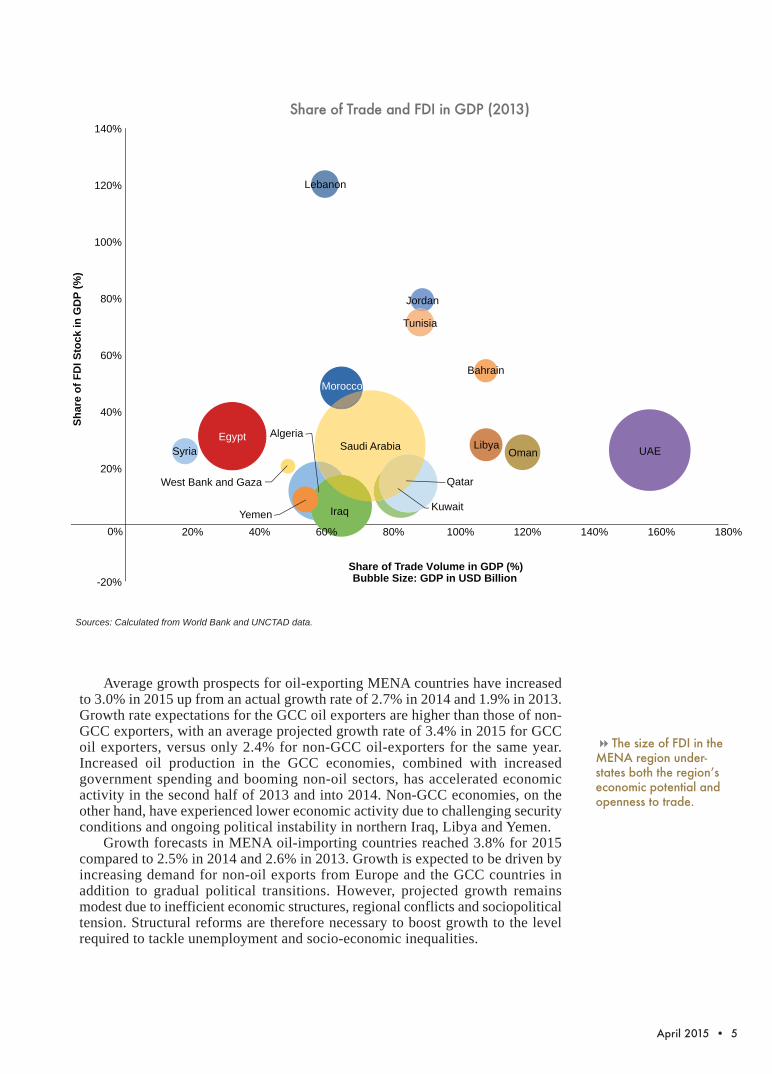
Share of Trade Volume in GDP (%) Bubble Size: GDP in USD Billion
Average growth prospects for oil-exporting MENA countries have increasedto 3.0% in 2015 up from an actual growth rate of 2.7% in 2014 and 1.9% in 2013.Growth rate expectations for the GCC oil exporters are higher than those of non-GCC exporters, with an average projected growth rate of 3.4% in 2015 for GCCoil exporters, versus only 2.4% for non-GCC oil-exporters for the same year.Increased oil production in the GCC economies, combined with increasedgovernment spending and booming non-oil sectors, has accelerated economicactivity in the second half of 2013 and into 2014. Non-GCC economies, on theother hand, have experienced lower economic activity due to challenging securityconditions and ongoing political instability in northern Iraq, Libya and Yemen.
Growth forecasts in MENA oil-importing countries reached 3.8% for 2015compared to 2.5% in 2014 and 2.6% in 2013. Growth is expected to be driven byincreasing demand for non-oil exports from Europe and the GCC countries inaddition to gradual political transitions. However, projected growth remainsmodest due to inefficient economic structures, regional conflicts and sociopoliticaltension. Structural reforms are therefore necessary to boost growth to the levelrequired to tackle unemployment and socio-economic inequalities.
April 2015 • 5
44The size of FDI in theMENA region under-states both the region’seconomic potential andopenness to trade.
Sources: Calculated from World Bank and UNCTAD data.
Share of Trade and FDI in GDP (2013)

6 • MENA-U.S. Trade and Investment Report
COUNTRY Index (out of 100) Regional RankMENA Investment and Trade Openness
Source: BMI, Trade and Investment Index, February 2015
44As it stands, intraregionaltrade among MENA countriesaccounted for just 10.1% oftheir total trade in 2013.
PPP: Purchasing Power ParitySource: IMF, January 2015, *Data from IMF, October 2014
MENA Economic Outlook Indicator Sub-Region 2011 2012 2013 2014 2015 2016GDP per Capita (USD at PPP)* GCC 69,195 70,918 70,763 71,641 73,134 74,889
Maghreb 10,413 13,750 13,206 12,481 13,495 14,816Mashreq and former ACC 10,949 11,380 11,608 11,689 12,002 12,577Arab MENA Average 30,186 32,016 31,859 31,937 32,877 34,094
Current GDP (billion USD at PPP)* GCC 2,559 2,756 2,911 3,089 3,287 3,498Maghreb 873 989 1,011 1,034 1,109 1,195Mashreq and former ACC 1,499 1,595 1,665 1,706 1,789 1,914Arab MENA Total 4,930 5,339 5,587 5,830 6,184 6,607
Real GDP Growth (%) GCC 7.1 5.3 4.3 3.8 3.8 3.5Maghreb -14.0 28.6 -1.0 -3.2 6.7 7.9Mashreq and former ACC 0.8 4.0 3.1 1.4 3.1 5.0Arab MENA Average -2.0 12.6 2.1 0.7 4.6 5.5
Current Account Balance (% of GDP) GCC 23.3 23.1 19.7 15.7 0.4 3.1Maghreb 0.9 4.3 -0.5 -10.8 -11.3 -6.9Mashreq and former ACC -3.7 -6.4 -6.9 -6.5 -6.5 -5.4Arab MENA Average 6.8 7.0 4.1 -0.5 -5.8 -3.1
Average Consumer Price Inflation (%) GCC 2.5 2.4 2.5 2.4 2.3 2.8Maghreb 6.2 5.5 3.5 2.9 3.2 3.6Mashreq and former ACC 9.6 6.9 6.6 5.2 5.2 5.2Arab MENA Average 6.1 4.9 4.2 3.5 3.6 3.9
Lebanon 91.5 1Jordan 66.9 2Tunisia 63 3Morocco 58.2 4 Bahrain 54.4 5UAE 53 6Libya 49.1 7Oman 40.7 8Qatar 35.7 9Saudi Arabia 29.5 10Yemen 25.8 11Kuwait 25.6 12Algeria 25.2 13Iraq 22.1 14Egypt 21.1 15Syria 12.1 16

April 2015 • 7
Oil export revenue losses for 2015 are expected to reach USD 300 billion forGCC countries and USD 90 billion for non GCC oil- exporters.
1.3 The Business EnvironmentAlthough some countries in the region have undertaken efforts to improve theirregulatory and business environments, international firms still face high levels ofbureaucracy and corruption, a lack of transparency, weak rule of law, anddifferences in business cultures.
The average regional ranking for MENA has deteriorated to 103 out of 189countries ranked in the World Bank’s Doing Business Report of 2015, from ahigher rank of 96 in 2013. This rank places the region below OECD countries,Europe and Central Asia, East Asia and Pacific, and Latin America; and aboveSouth Asia and Sub-Saharan Africa.
Within MENA, Morocco showed the greatest improvement in 2015, moving26 places up from its 2013 rank of 97, followed by Lebanon, which leaped 11places from 115, and Iraq, moving up nine places from 165. Syria had the largestdrop, moving 31 places down from its 2013 rank of 144. The best countries in theregion for doing business according to the World Bank’s 2015 report are the UAEand Saudi Arabia.
44Growth forecasts forthe MENA have been re-vised downwards due tothe rapid fall of oil prices,as crude oil prices de-clined by over 59% from$115 a barrel in mid-July2014 to less than $47 inmid-January 2015.
1.7 2.5 2.5 2.8 3.1 3.3 3.6 3.7 3.8 3.8 4.0 4.1 4.4 4.5
7.1
14.7
0.0
2.0
4.0
6.0
8.0
10.0
12.0
14.0
16.0
Kuwait Iraq Lebanon Saudi Arabia
Yemen Bahrain UAE Tunisia Egypt Jordan West Bank and
Gaza
Algeria Morocco Oman Qatar Libya
Ann
ual R
eal G
DP
Gro
wth
(%)
MENA Council Countries There are no growth forecasts for Syria.
Source: IMF, January 2015
2015 Growth Forecast in MENA Countries
44“The more freely thatprospective businessescan establish, grow andpartner with other busi-nesses, the faster theywill drive prosperity.”— Anne Patterson, U.S.Department of State,February 2014.

8 • MENA-U.S. Trade and Investment Report
Overall, MENA had the smallest share (40%) of economies implementingregulatory reforms in at least one area, according to the World Bank’s 2014 report.This can be linked to the ongoing political and socioeconomic instability in theregion. Trading across borders is one of the reform areas with much room forimprovement in several MENA countries, where there is a lack of appropriate portinfrastructure, inefficient port operations or a large number of required documents.
The UAE had the most reforms among MENA countries in 2015, improvingits rankings to become fourth worldwide in dealing with construction permits,getting electricity and property registration.
The Index of Economic Freedom by the Heritage Foundation measures theeconomic freedom in 186 countries based on 10 qualitative and quantitativefactors (freedoms), grouped into four broad categories: Rule of Law, whichincludes property rights and freedom from corruption; Limited Government,which refers to fiscal freedom and government spending; Regulatory Efficiency,measured through business freedom, labor freedom and monetary freedom; andOpen Markets, which includes trade freedom, investment freedom and financialfreedom. Each of the 10 economic freedoms is graded on a scale of 0 to 100 andaccording to the average grade, each country is given its Economic Freedom Rank.
44According to theWorld Bank, in 2015 UAEranked first worldwide intax collection, followed byQatar and Saudi Arabia.
RegionalRank 2015
Global Rank2015
Global Rank2014
GlobalRank 2013
Number of Reforms(2015)
UAE 1 22 25 26 3Bahrain 4 53 53 42 2Tunisia 5 60 56 50 2Morocco 7 71 68 97 1Lebanon 10 104 102 115 0Egypt 11 112 113 109 1Jordan 12 117 116 106 1West Bank and Gaza 14 143 139 135 1Algeria 16 154 147 152 1MENA - 103 99 96 12Source: World Bank, 2015
Data for Iraq, Libya, Syria and the West Bank and Gaza are not available. Israel ranked number 4 in the region. MENA Average includes only countrieswith available data.Source: Heritage Foundation, 2015
Ease of Doing Business in MENA Council Countries
MENA’s Index of Economic Freedom Rankings (2015)Country Name Global Regional Rank 2015 Average Score (0-100) Classification
Bahrain 18 1 73.4 Mostly FreeUAE 25 2 72.4 Mostly FreeQatar 32 3 70.8 Mostly FreeJordan 38 5 69.3 Moderately FreeOman 56 6 66.7 Moderately FreeKuwait 74 7 62.5 Moderately FreeSaudi Arabia 77 8 62.1 Moderately FreeMorocco 89 9 60.1 Moderately FreeLebanon 94 10 59.3 Mostly UnfreeTunisia 107 11 57.7 Mostly UnfreeEgypt 124 12 55.2 Mostly UnfreeYemen 133 13 53.7 Mostly UnfreeAlgeria 157 14 48.9 Mostly UnfreeMENA Average 79 -- 62.5 --
April 2015 • 9
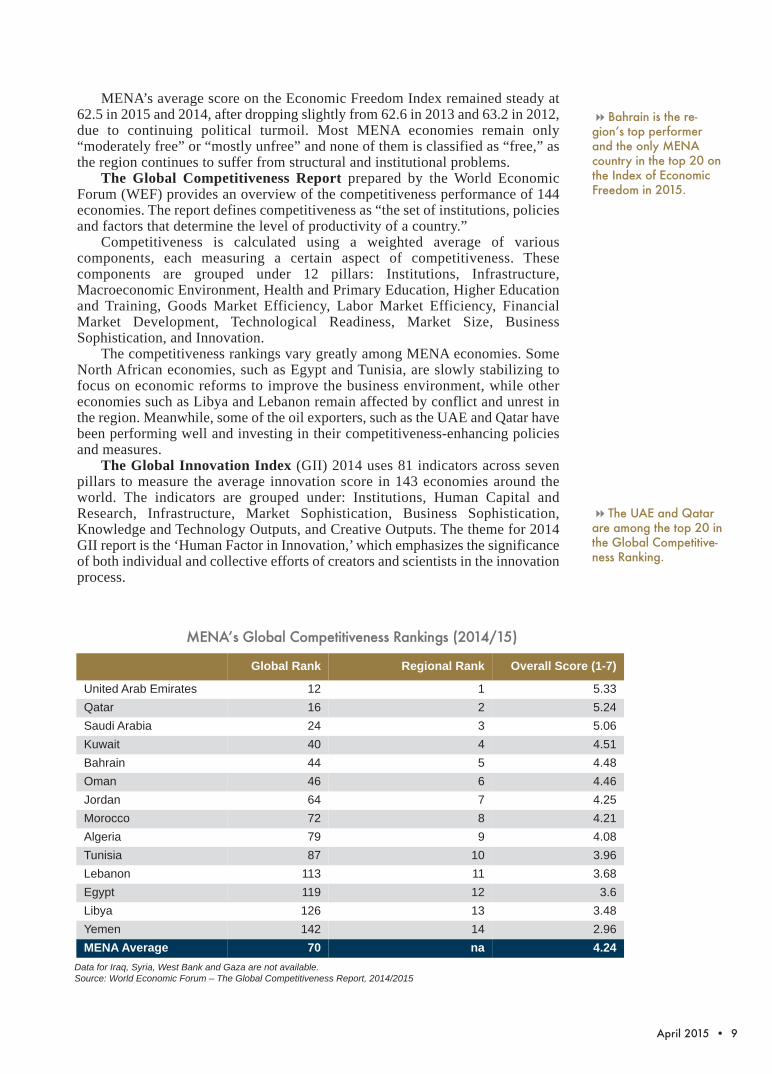
MENA’s average score on the Economic Freedom Index remained steady at62.5 in 2015 and 2014, after dropping slightly from 62.6 in 2013 and 63.2 in 2012,due to continuing political turmoil. Most MENA economies remain only“moderately free” or “mostly unfree” and none of them is classified as “free,” asthe region continues to suffer from structural and institutional problems.
The Global Competitiveness Report prepared by the World EconomicForum (WEF) provides an overview of the competitiveness performance of 144economies. The report defines competitiveness as “the set of institutions, policiesand factors that determine the level of productivity of a country.”
Competitiveness is calculated using a weighted average of variouscomponents, each measuring a certain aspect of competitiveness. Thesecomponents are grouped under 12 pillars: Institutions, Infrastructure,Macroeconomic Environment, Health and Primary Education, Higher Educationand Training, Goods Market Efficiency, Labor Market Efficiency, FinancialMarket Development, Technological Readiness, Market Size, BusinessSophistication, and Innovation.
The competitiveness rankings vary greatly among MENA economies. SomeNorth African economies, such as Egypt and Tunisia, are slowly stabilizing tofocus on economic reforms to improve the business environment, while othereconomies such as Libya and Lebanon remain affected by conflict and unrest inthe region. Meanwhile, some of the oil exporters, such as the UAE and Qatar havebeen performing well and investing in their competitiveness-enhancing policiesand measures.
The Global Innovation Index (GII) 2014 uses 81 indicators across sevenpillars to measure the average innovation score in 143 economies around theworld. The indicators are grouped under: Institutions, Human Capital andResearch, Infrastructure, Market Sophistication, Business Sophistication,Knowledge and Technology Outputs, and Creative Outputs. The theme for 2014GII report is the ‘Human Factor in Innovation,’ which emphasizes the significanceof both individual and collective efforts of creators and scientists in the innovationprocess.
44Bahrain is the re-gion’s top performerand the only MENAcountry in the top 20 onthe Index of EconomicFreedom in 2015.
44The UAE and Qatarare among the top 20 inthe Global Competitive-ness Ranking.
Data for Iraq, Syria, West Bank and Gaza are not available.Source: World Economic Forum – The Global Competitiveness Report, 2014/2015
MENA’s Global Competitiveness Rankings (2014/15)
Global Rank Regional Rank Overall Score (1-7)
United Arab Emirates 12 1 5.33Qatar 16 2 5.24Saudi Arabia 24 3 5.06Kuwait 40 4 4.51Bahrain 44 5 4.48Oman 46 6 4.46Jordan 64 7 4.25Morocco 72 8 4.21Algeria 79 9 4.08Tunisia 87 10 3.96Lebanon 113 11 3.68Egypt 119 12 3.6Libya 126 13 3.48Yemen 142 14 2.96MENA Average 70 na 4.24

10 • MENA-U.S. Trade and Investment Report
Among MENA countries, the UAE is the best performer, having taken majorsteps to diversify its economy. The UAE’s Vision of 2021 calls for the country totransform its economy into one where knowledge and innovation are the maindrivers of growth.
2. MENA-U.S. Trade TrendsGiven the recent developments in many of the MENA countries, enhanced tradeand investment ties with the U.S. can serve as an engine of growth anddevelopment in the region.
The U.S. has been intensifying its trade and investment relations with MENAin recent years with the main aim of achieving economic development, peace andstability. U.S. exports to MENA represented 4.4% of total U.S. exports, whereas3.7% of total U.S. imports were from MENA in 2014.
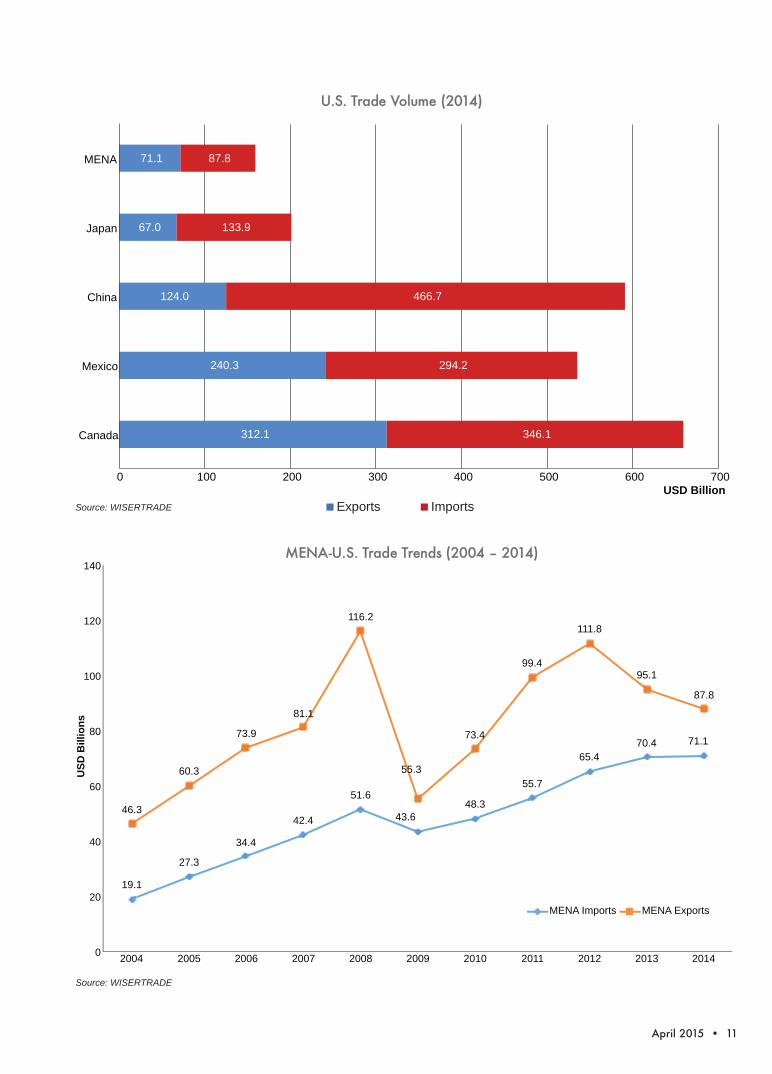
MENA is the sixth largest trading partner of the U.S., making up 4.0%(equivalent to USD 158.9 billion) of a total U.S. trading volume of USD 4.0trillion in 2014.
Although trade has been generally increasing between MENA and the U.S.since 2000 until 2012, recent developments have shown a decrease in the growthrate of total trade. MENA exports to the U.S. grew by a compound annual growthrate (CAGR) of only 8.0% since 2000 to reach USD 87.8 billion in 2014(compared to a CAGR of 11.5% from 2000 to 2011). A closer look at the recentdevelopments shows a negative CAGR of -11.35% of MENA exports to the U.S.between 2012 and 2014.
MENA imports from the U.S. grew by a CAGR of 11.1 % since 2000 to reachUSD 71.1 billion in 2014. MENA imports grew by a CAGR of 1.03% between2009 and 2014, compared to a CAGR of 17.9% between 2004 and 2009.
The largest regional exporter to the U.S. is Saudi Arabia with a share of 53.5%of total MENA exports to the U.S., while the largest importer is the UAE,accounting for 34.7% of total MENA imports from the U.S.
MENA’s Global Innovation Index Rankings (2014)
Data for Iraq, Syria, West Bank and Gaza are not available.Source: The Global Innovation Index, 2014
44“It is without a doubt that this year’stheme, the ‘Human Factor in Innovation’,is at the center of the UAE government’sVision 2021” – The GII Report 2014
44Saudi Arabia was theeighth largest exporterto the U.S. worldwide,while the UAE was the17th largest importerfrom the U.S. in 2014.
Global Rank Score (0-100)United Arab Emirates 36 43.2Saudi Arabia 38 41.6Qatar 47 40.3Bahrain 62 36.3Jordan 64 36.2Kuwait 69 35.2Oman 75 33.9Lebanon 77 33.6Tunisia 78 32.9Morocco 84 32.2Egypt 99 30Algeria 133 24.2Yemen 141 19.5MENA Average 77 33.8
April 2015 • 11
U.S. Trade Volume (2014)
312.1
240.3
124.0
67.0
71.1
346.1
294.2
466.7
133.9
87.8
0 100 200 300 400 500 600 700
Canada
Mexico
China
Japan
MENA
USD Billion
U.S. Trade Volume (2014)
Exports Imports
19.1
27.3
34.4
42.4
51.6
43.6 48.3
55.7
65.4 70.4 71.1
46.3
60.3
73.9
81.1
116.2
55.3
73.4
99.4
111.8
95.1
87.8
0
20
40
60
80
100
120
140
2004 2005 2006 2007 2008 2009 2010 2011 2012 2013 2014
USD
Bill
ions
MENA Imports MENA Exports
Source: WISERTRADE
MENA-U.S. Trade Trends (2004 – 2014)
Source: WISERTRADE

12 • MENA-U.S. Trade and Investment Report
374
1,290
503
850
1,060
2,014
2,068
2,052
6,490
5,174
22,113
2,639
3,649
2,105
18,679
58
72
225
521
965
975
991
1,357
1,410
1,657
2,799
4,629
11,437
13,710
47,038
0 5,000 10,000 15,000 20,000 25,000 30,000 35,000 40,000 45,000 50,000
Yemen, Syria, West Bank and Gaza
Lebanon
Libya
Tunisia
Bahrain
Oman
Morocco
Jordan
Egypt
Qatar
United Arab Emirates
Algeria
Kuwait
Iraq
Saudi Arabia
MENA-U.S. Trade by Country (2014)USD million
MENA Imports from U.S. MENA Exports to U.S.
MENA-U.S. Trade by Country (2014)USD Million
Source: WISERTRADE
Saudi Arabia, 53.5%
Iraq, 15.6%
Kuwait, 13.0%
Algeria, 5.3%
UAE, 3.2%
Qatar, 1.9%
Egypt, 1.6% Jordan, 1.5%
Morocco, 1.1%
Oman, 1.1%
Bahrain, 1.1%
Tunisia, 0.6% Libya, 0.3%
Lebanon, Yemen, Syria, West Bank and
Gaza, 0.1%
Total Value = USD 87.8 billion
MENA Exports to the U.S. (2014)
Source: WISERTRADE
April 2015 • 13
UAE, 31.1%
Saudi Arabia, 26.3% Egypt, 9.1%
Qatar, 7.3%
Kuwait, 5.1%
Algeria, 3.7%
Iraq, 3.0%
Morocco, 2.9%
Jordan, 2.9%
Oman, 2.8%
Lebanon, Yemen, Syria, West Bank and Gaza, 2.3%
Bahrain, 1.5% Tunisia, 1.2% Libya, 0.7%
Total Value = USD 71.8 billion
MENA Imports from the U.S. (2014)
Source: WISERTRADE
Other, 17.8%
Fertilizers, 17.1%
Special Classification Provisions, NESOI*,
12.6% Apparel Articles and Accessories, Knit or
Crochet, 12.3%
Aluminum and Articles, 10.9%
Apparel Articles and Accessories, not Knit, 9.9%
Natural Pearls, Precious Stones, Precious Metals,
Coin, 4.6%
Plastics and Articles, 4.4%
Organic Chemicals, 3.9%
Electric/ Sound/ TV Equipment and Parts, 3.4%
Articles of Iron or Steel, 3.2%
Total Value = USD 10.52 billion
MENA Non-Oil Exports to the U.S. by Commodity (2014)
*NESOI: Not Otherwise Specified or IndicatedSource: WISERTRADE

14 • MENA-U.S. Trade and Investment Report
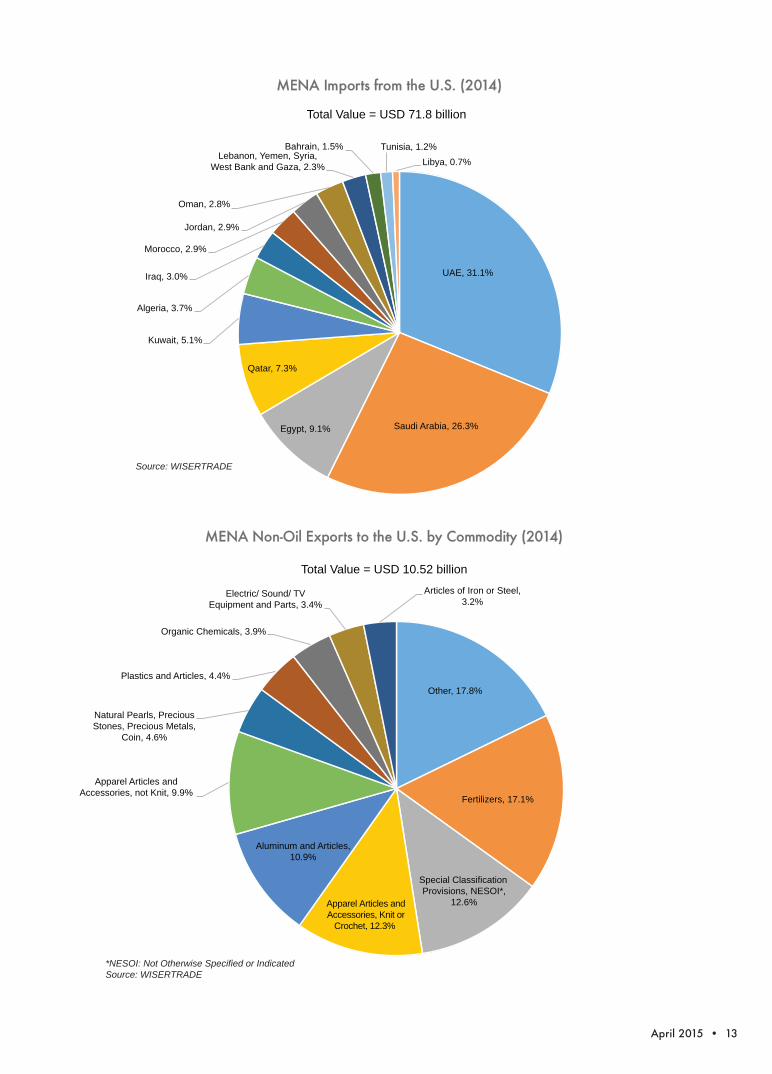
Although the total value of MENA exports to the U.S. (USD 87.8 billion)exceeded the total value of imports (USD 71.1 billion) in 2014, the non-oil MENAtrade balance is in favor of the U.S. Excluding oil and gas, MENA imports fromthe U.S. are 6.4 times the value of exports.
Top MENA imports from the U.S. are aircraft and spacecraft, vehicles, andindustrial machinery and computers. Top non-oil MENA exports to the U.S. arefertilizers, special classification provisions, and apparel articles and accessories.
Others, 22.1%
Aircraft, Spacecraft, Parts, 18.3%
Vehicles (except Railway or Tramway), and Parts, 16.7%
Industrial Machinery including Computers, 16.2%
Electric Machinery, Sound Equipment, TV Equipments, Parts, 9.3%
Mineral Fuel, Oil, Bitumin Substance, Mineral Wax, 4.6%
Optical, Photo, Medical or Surgical Instrments, 3.5%
Natural Pearls, Precious Stones, Precious Metals, Coin, 2.8%
Special Classification Provisions, NESOI, 2.4%
Cereals, 2.2%
Arms and Ammunition, Parts and Accessories, 1.9%
Total Value = USD 71.1 billion
MENA Imports from the U.S. by Commodity (2014)
Source: WISERTRADE
2.1 U.S. Trade with MENA Council CountriesThe UAE was the largest MENA Council importer from the U.S. in 2014 with ashare of 57.3% of total MENA Council imports from the U.S., while the largestexporter for the same period was Algeria with a share of 36.3% of total MENACouncil exports to the U.S.
2.2 U.S.-MENA Bilateral Free Trade AgreementsThe U.S. signed four Free Trade Agreements (FTAs) with Arab MENA countries,three of which are part of the MENA Council: Jordan in 2001, Morocco andBahrain in 2006 and Oman in 2008. Further FTA discussions, including thosewith Egypt and the UAE were put on hold in 2005 and 2007, respectively. FTAshave formed the framework for trade policy dialogues with the region with thegreater aim of assisting MENA’s integration in the world market and fostering itsdemocratic transitions and economic development.
44In 2014, AmChamMENA Council importsfrom the U.S. made up54.2% of total MENAimports, while its ex-ports comprised only14.5% of total MENAexports to the U.S.

April 2015 • 15
However, U.S. trade with MENA countries accounted for a small share oftotal U.S. trade: 4.0% of a total U.S. trading volume of USD 4.0 trillion during2014, leaving much room for deepening the trade relations. In May 2011, U.S.President Barack Obama announced the MENA Trade and Investment PartnershipInitiative (MENA-TIP), with a primary focus on Egypt, Jordan, Morocco andTunisia. This initiative aims at increasing U.S.-MENA trade and investment byfocusing on cooperation on investment, trade facilitation, support for small andmedium enterprises (SMEs), and regulatory practices and transparency.
2.3 Preferential Trade Agreements between MENA and the U.S.In addition to formal agreements to liberalize trade and investment, the U.S. relieson federal programs to encourage international trade and investment. For MENA,the most important programs include the Generalized System of Preferences(GSP) and the Qualifying Industrial Zones (QIZ) protocol.
The U.S. GSP was established by the Trade Act of 1974 and providespreferential duty-free entry for products from 122 beneficiary countries andterritories. The total value of GSP-eligible goods imported by the U.S. in 2014was USD 17.8 billion, of which USD 196.5 million (1.1%) were from the MENAcountries. Legal authorization of the GSP program expired on July 31, 2013, andthe U.S. Congress is considering legislation to renew the authorization of GSP, amove supported by the Obama Administration. The GSP statute automaticallyexpired for all beneficiary developing countries (except for AGOA-eligiblecountries) on July 31, 2013. If Congress desired to permanently suspend GSP dueto the cost of the program or to possible negative impact on U.S. companies, nolegislative action would be required.
Qualifying Industrial Zones (QIZs) were established by the U.S. Congress in1996 with the main purpose of supporting the Middle East peace process.
This program allows certain exports from the West Bank and Gaza Strip alongwith qualifying zones in Egypt and Jordan duty-free entrance in the U.S. Productseligible under this program must be manufactured in the West Bank and GazaStrip, or specified zones within Egypt and Jordan and must contain a certainpercentage of Israeli content. The protocol was signed by Jordan in 1998 and by
Total CountryExports to the
World
Total Country Exports tothe U.S.
Share of U.S.in CountryExports
Total CountryImports from
the World
Total CountryImports from
the U.S.
Share of U.S.in CountryImports
Algeria 65.0 4.8 7.39% 55.0 1.8 3.27%Bahrain 20.9 0.6 2.87% 14.4 1 6.96%Egypt 28.5 1.6 5.62% 58.3 5.2 8.92%Jordan 7.9 1.2 15.17% 21.9 2.1 9.60%Lebanon 4.5 0.1 2.04% 19.7 1.0 5.23%Morocco 21.8 1 4.58% 45.1 2.5 5.54%Tunisia 17.1 0.7 4.10% 24.3 0.9 3.71%UAE 379.0 2.3 0.61% 251.0 24.4 9.72%West Bank and Gaza* 1.2 0 0.00% 5.2 0.0 0.00%Total MENA Council 547.0 12.4 2.27% 497.0 39 7.85%Total MENA 1372.5 95.1 6.93% 870.4 70.4 8.09%
Source: WISERTRADE (based on country reports) and World Bank (Value in USD billion)*Source: ITC
44QIZs are consid-ered to be the mostadvantageous prefer-ence program offeredby the U.S. and offer-ing much-needed jobopportunities in labor-intensive industries.
MENA Council Merchandise Trade Flows (2013)MENA Exports MENA Imports

16 • MENA-U.S. Trade and Investment Report
Egypt in 2004.In order for products to be eligible for duty-free entry into the United States,
QIZ factories must add at least 35% to the value of the article. In Jordan, the 35%content must be divided into 11.7% from a Jordan QIZ, 8% from Israel (7% forhigh-tech goods) and the remainder may be fulfilled by content from a Jordan
Tunisia, 81.3
Egypt, 67.1
Lebanon, 40.3
Jordan, 5.5 Other MENA, 2.3
MENA GSP Exports (2014)
(USD million)
956.0
1,009.1 963.4
845.3 886.8
200.1
95.2 55.2 62.4
31.0
0
200
400
600
800
1,000
1,200
2010 2011 2012 2013 2014
USD
Mill
ion
Egypt Jordan
MENA GSP Exports (2014, USD million)
QIZ Export Trends
Source: USITC
Lebanon’s Top GSP Exports (% of GSP Exports)Not Reinforced Plastic Plates andSheets (except packaging), AluminumSheets, Plates and Foils, 22%Roasted Nuts and Peanut Butter, 17%Preserved Fruits and Vegetables, 14%
Egypt’s Top GSP Exports(% of GSP Exports)Preserved Fruits and Vegetables, 22%Aluminum Sheets, Plates and Foils, 9%Cut Stone and Stone Products, 8%
Tunisia’s Top GSP Exports(% of GSP Exports)Soybean Oil andOther Oil Seed, 42%Other Oilseed Products, 18%Roasted Nuts and PeanutButter, 17%
Source: USITC

April 2015 • 17
QIZ, Israel, the U.S. or West Bank and Gaza.For Egypt, the 35% minimum content can include costs incurred in Israel,
Egypt or the U.S. Egypt and Israel have agreed that each must contribute at leastone-third (11.7%) of the 35% minimum content requirement. However, the Israelicontent requirement was lowered to 10.5% in October 2007.
Recent developments in the QIZ export values between beneficiary countriesand the U.S. show a 4.9% increase of Egyptian exports in 2014 compared to theprevious year and a decrease of exports from Jordan and West Bank and Gaza by50.4 % and 31.3%, respectively.
3. MENA-U.S. Investment TrendsAfter experiencing a steep drop in FDI inflows in 2011 due to political turmoil, theMENA Council countries started to slowly attract more FDI inflows in 2012 toreach USD 28.6 billion (2.12% of total world FDI outflows). This was caused byan improved investment climate in some countries that have undertaken structuralreforms. One example is Morocco’s diversification efforts, which have helpedincrease FDI in high-value-added industries in the country. The increase in FDIinflows in MENA Council countries was also a result of the recovery of globaleconomic activity, especially in the EU.
845.3
886.8
62.4
31.0
1.7
1.2
800
820
840
860
880
900
920
940
2013 2014
USD
Mill
ion
Egypt Jordan West Bank and Gaza
QIZ Exports to the U.S.
Source: USITC
18 • MENA-U.S. Trade and Investment Report
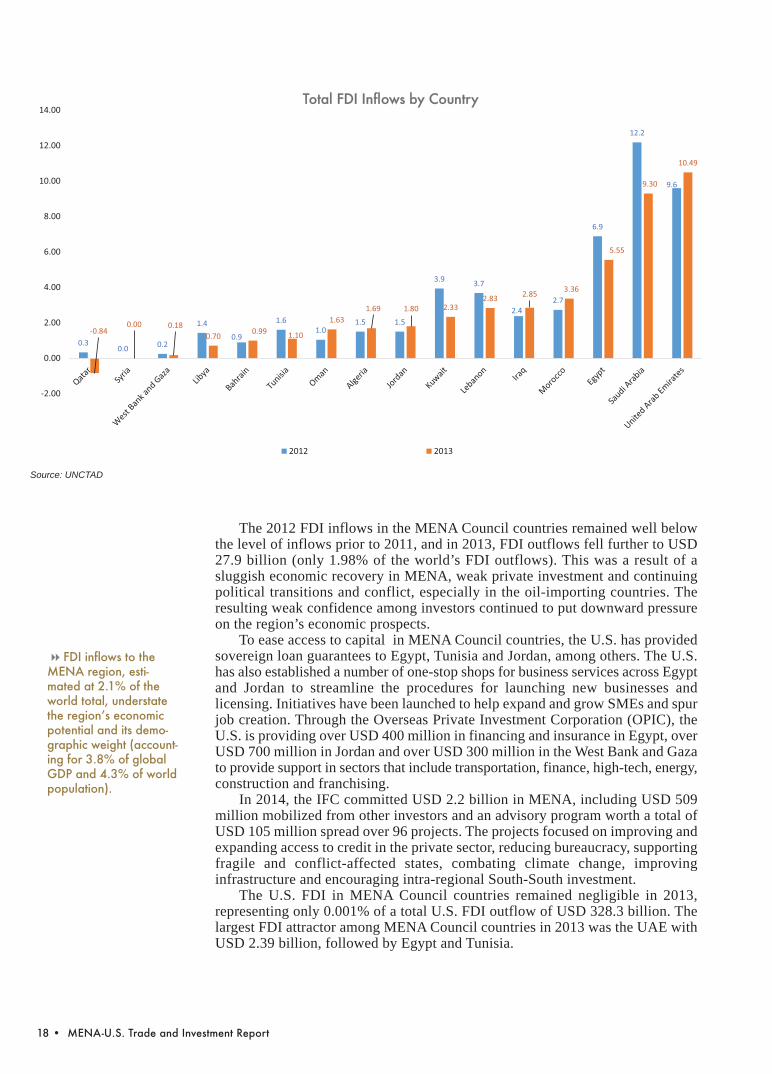
The 2012 FDI inflows in the MENA Council countries remained well belowthe level of inflows prior to 2011, and in 2013, FDI outflows fell further to USD27.9 billion (only 1.98% of the world’s FDI outflows). This was a result of asluggish economic recovery in MENA, weak private investment and continuingpolitical transitions and conflict, especially in the oil-importing countries. Theresulting weak confidence among investors continued to put downward pressureon the region’s economic prospects.
To ease access to capital in MENA Council countries, the U.S. has providedsovereign loan guarantees to Egypt, Tunisia and Jordan, among others. The U.S.has also established a number of one-stop shops for business services across Egyptand Jordan to streamline the procedures for launching new businesses andlicensing. Initiatives have been launched to help expand and grow SMEs and spurjob creation. Through the Overseas Private Investment Corporation (OPIC), theU.S. is providing over USD 400 million in financing and insurance in Egypt, overUSD 700 million in Jordan and over USD 300 million in the West Bank and Gazato provide support in sectors that include transportation, finance, high-tech, energy,construction and franchising.
In 2014, the IFC committed USD 2.2 billion in MENA, including USD 509million mobilized from other investors and an advisory program worth a total ofUSD 105 million spread over 96 projects. The projects focused on improving andexpanding access to credit in the private sector, reducing bureaucracy, supportingfragile and conflict-affected states, combating climate change, improvinginfrastructure and encouraging intra-regional South-South investment.
The U.S. FDI in MENA Council countries remained negligible in 2013,representing only 0.001% of a total U.S. FDI outflow of USD 328.3 billion. Thelargest FDI attractor among MENA Council countries in 2013 was the UAE withUSD 2.39 billion, followed by Egypt and Tunisia.
0.30.0 0.2
1.4
0.9
1.61.0
1.5 1.5
3.9 3.7
2.42.7
6.9
12.2
9.6
-0.840.00 0.18
0.70 0.99 1.10
1.631.69 1.80 2.33
2.83 2.85 3.36
5.55
9.30
10.49
-2.00
0.00
2.00
4.00
6.00
8.00
10.00
12.00
14.00
Total FDI Inflows to MENA
2012 2013
Total FDI Inflows by Country
Source: UNCTAD
44FDI inflows to theMENA region, esti-mated at 2.1% of theworld total, understatethe region’s economicpotential and its demo-graphic weight (account-ing for 3.8% of globalGDP and 4.3% of worldpopulation).
April 2015 • 19
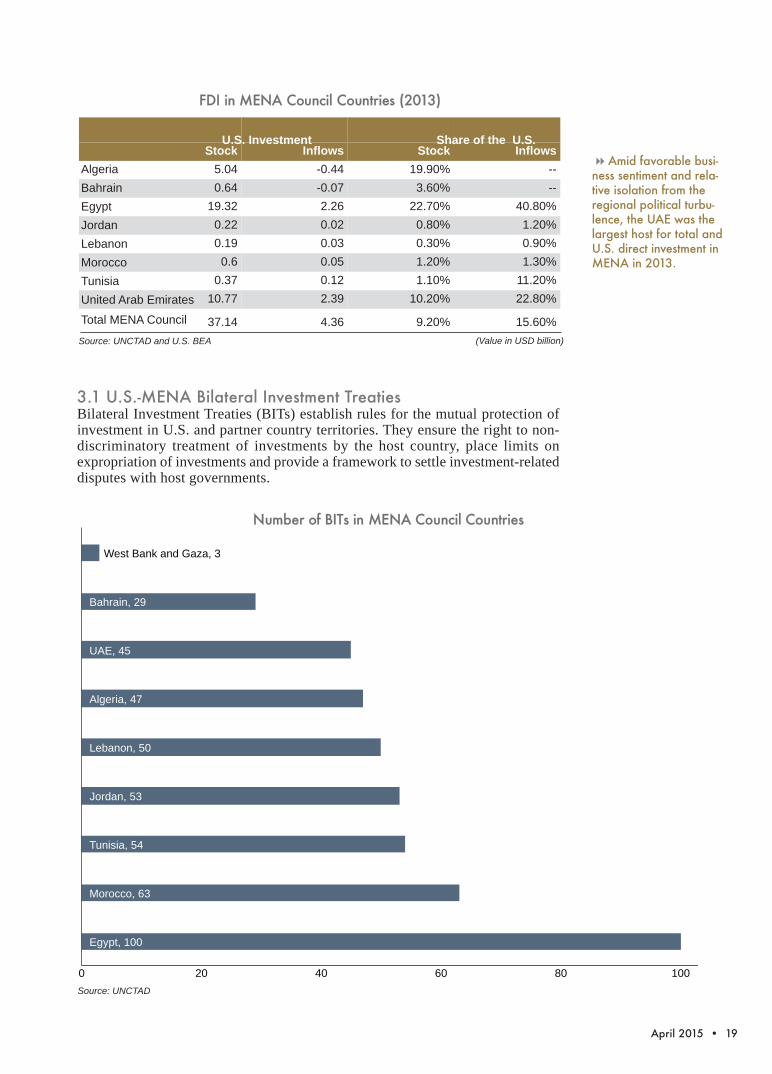
3.1 U.S.-MENA Bilateral Investment TreatiesBilateral Investment Treaties (BITs) establish rules for the mutual protection ofinvestment in U.S. and partner country territories. They ensure the right to non-discriminatory treatment of investments by the host country, place limits onexpropriation of investments and provide a framework to settle investment-relateddisputes with host governments.
FDI in MENA Council Countries (2013)
Source: UNCTAD and U.S. BEA
44Amid favorable busi-ness sentiment and rela-tive isolation from theregional political turbu-lence, the UAE was thelargest host for total andU.S. direct investment inMENA in 2013.
Stock Inflows Stock Inflows5.04 -0.44 19.90% --0.64 -0.07 3.60% --19.32 2.26 22.70% 40.80%0.22 0.02 0.80% 1.20%0.19 0.03 0.30% 0.90%0.6 0.05 1.20% 1.30%0.37 0.12 1.10% 11.20%10.77 2.39 10.20% 22.80%
37.14 4.36 9.20% 15.60%
Egypt, 100
Morocco, 63
Tunisia, 54
Jordan, 53
Lebanon, 50
Algeria, 47
UAE, 45
Bahrain, 29
West Bank and Gaza, 3
0 20 40 60 80 100 120
Number of BITs in MENA Council Countries
Source: UNCTAD
AlgeriaBahrainEgyptJordanLebanonMoroccoTunisiaUnited Arab Emirates
Total MENA Council
U.S. Investment Share of the U.S.
(Value in USD billion)

20 • MENA-U.S. Trade and Investment Report
The U.S. has 41 BITs in force, five of which are with MENA countries: TheBIT with Morocco entered into force in 1991, followed by Egypt and Tunisia,which entered into force in 1992 and 1993 respectively. The U.S.-Bahrain BITentered into force in 2001 and the most recent BIT within MENA was with Jordanin 2003.
In addition to these, the U.S. has signed Trade and Investment FrameworkAgreements (TIFAs) with Algeria, Bahrain, Egypt, Iraq, Kuwait, Lebanon, Libya,Oman, Qatar, Saudi Arabia, Tunisia, UAE and Yemen.
3.2 Leading Sectors for U.S. Business in MENA CouncilCountriesEconomic activity in MENA varies among its countries with a broad range ofsectors attracting FDI. Leading sectors for U.S. FDI in MENA range fromagricultural and manufacturing to energy and power, information andcommunication technology, infrastructure, machinery and equipment, andservices.
44U.S. PreferentialTrade and InvestmentAgreements withMENA: 4 FTAs, 5BITs and 13 TIFAs.
Algeria Bahrain Egypt Jordan Lebanon Morocco Tunisia UAE West Bankand Gaza
GDP at Market Prices(USD billion) 214.2 33.9 286.4 36.0 48.2 109.2 48.9 401.4 13.2
Real GDP Growth (%) 4.6 4.8 2.2 3.1 1.8 2.9 2.8 3.7 1
Population (million) 38.7 1.2 85.4 6.7 4.5 33.2 11 9.3 4.5
Current GDP per Capita(USD at PPP) 14,256 51,394 11,073 11,974 17,754 7,666 11,380 65,037 2,783
Unemployment (%) 10.8 4.1 13.4 12.2 6.5* 9.1 15.3 3.8 25
Consumer Price Inflation (%) 3 2.5 10.1 2.9 2.1 0.4 5.5 2.3 2
Total International Re-serves (USD billion) 184.3 5.5 15 13.8 49.4 21.1 7.6 74.7 na
Interest Rates (periodaverage lending rate) 8 5.9 11.8 9 7.2 6.3 na 5.3 7.2
FDI Inflows (USD billion) 1.69 0.99 5.55 1.8 2.83 3.36 1.1 10.49 0.18Average Exchange Ratein December 2014(Local Currency perUSD)
80.3 0.38 7.1 0.71 1507.5 8.38 1.64 3.67 3.55
*2013 data
Key Economic Indicators for MENA Council Countries (2014)
Source: EIU and IMF

April 2015 • 21
MENACouncilMember
Agriculture andManufacturing
Energy andPower ICT Infrastructure
and UtilitiesMachinery andEquipment Services
Algeria Agricultural Products
Oil/ Gas Hy-drocarbons
Information/ Commu-nication Technology
Public Works, Infrastructure Development,Water Resources,Safety/ SecuritySolutions
Healthcare
Bahrain*
Frozen/ ChilledBeef, Meat andPoultry, MotorVehicles/ VehicleParts, Comput-ers/ Peripherals
ElectricalPower Systems
Telecommunications Water Desalina-tion
Air Condition-ing/ Refrigera-tion Equipment,Medical Equip-ment/ Health-care
Financial Serv-ices, Educationand Training,Construction
Egypt AgriculturalProducts
ElectricityPower Sys-tems, Renew-able Energy
TelecommunicationsEquipment/ Services
Safety/ SecuritySystems, Water/Wastewater Re-sources
Medical Equip-ment/ Supply
Architecture/Construction/ En-gineering Serv-ices, Franchising
Jordan Agriculture Renewable Energy
Information/ Commu-nication Technology
Safety/ SecurityEquipment
HealthcareTechnology/Medical De-vices
Green Building,EnvironmentalTechnologies
Lebanon
Apparel, Auto-motive, Drugs/Pharmaceuti-cals, Agriculture
Medical Equipment
Education Services
Morocco Agricultural Products
Renewable Energy
InfrastructureProjects, Envi-ronmental Tech-nologies (WasteManagement/Water), Safety/Security
Aviation (Civil/Defense), Fran-chising, Health-care
Tunisia Agricultural Products
ElectricalPower Sys-tems, Renew-able Energy
TelecommunicationsEquipment/ Services
Aircraft/ AirportGround Support/Aeronautics
Pollution Con-trol Equipment,AutomotiveParts/ Services/Equipment
Architecture/Construction/ En-gineering Serv-ices, Insurance,Franchising
UAE
Automotive, Con-sumer Electron-ics, Cosmetics/Perfumes, Agri-cultural Sectors
Renewable Energy
Aircraft Parts/Services
Oil and GasField Machinery
Construction, Ed-ucation, Franchis-ing, HealthcareServices, Oil and Gas FieldServices
WestBank
Processed Food,Furniture, Agri-cultural Prod-ucts, BuildingMaterial
Energy TelecommunicationsEquipment
Business/ Con-struction Equip-ment/ MedicalEquipment
Franchising,Computers/ Pe-ripherals, Educa-tion TrainingServices
Leading Sectors for U.S. Investment and Trade
Sources: Country Commercial Guides (CCG), 2014*CCG, 2012
22 • MENA-U.S. Trade and Investment Report
AmCham MENA Regional Council Website:www.amchammena.org
Council Members
AMERICAN CHAMBER OF COMMERCE IN EGYPT(MENA COUNCIL PERMANENT SECRETARIAT)Tel: +202 3338-1050 • Fax: +202 3338-1060E-mail: [email protected]: www.amcham.org.eg
AMERICAN CHAMBER OF COMMERCE IN ABU DHABI(COUNCIL CHAIR 2013-2015)*Tel: +971 2631-3604 • Fax: +971 2633-0489E-mail: [email protected]: www.amchamabudhabi.org
AMERICAN CHAMBER OF COMMERCE IN BAHRAIN(COUNCIL VICE-CHAIR 2013-2015)*Tel: +973 1757-4743 • Fax: : +973 1752-2737E-mail: [email protected] Website: www.amcham.bh
AMERICAN CHAMBER OF COMMERCE IN ALGERIATel: +213 (0) 55001-0343, +213 (0) 66150-5045 E-mail: [email protected]: www.amcham-algeria.org
AMERICAN CHAMBER OF COMMERCE IN JORDANTel: +962 (6) 565-1860 • Fax: +962 (6) 565-1862E-mail: [email protected]: www.amcham.jo
AMERICAN LEBANESE CHAMBER OF COMMERCETel: +961 198-5330 • Fax: +961 198-5331E-mail: [email protected]: www.amcham.org.lb
AMERICAN CHAMBER OF COMMERCE IN MOROCCOTel: +212 52225-0736/37/51 • Fax: +212 52225-0730E-mail: [email protected] Website: www.amcham.ma

April 2015 • 23
AMERICAN CHAMBER OF COMMERCE IN PALESTINETel: +970 2297-4117 • Fax: +970 2297-4092E-mail: [email protected] Website: www.pal-am.com
AMERICAN CHAMBER OF COMMERCE IN TUNISIATel: +216 7188-3226 • Fax: +216 7188-9880E-mail: [email protected]: www.amchamtunisia.org.tn
*Council Chairmanship transition will take place in December 2015. AmChamBahrain will become Chair of the MENA Council and AmCham Morocco will becomethe Vice-Chair.

Produced by the Business Studies & Analysis Center (BSAC) Website: www.amcham.org.eg/bsac • E-mail: [email protected]
The American Chamber of Commerce in Egypt (Permanent Secretariat, AmCham MENA Council)
©2015 The American Chamber of Commerce in Egypt

![[PreMoney MENA 2015] ArabNet >> Omar Christidis, "THE GLOBAL VC: MENA"](https://static.fdocuments.us/doc/165x107/58d198b51a28ab6f6b8b4a09/premoney-mena-2015-arabnet-omar-christidis-the-global-vc-mena.jpg)