Socio-Economic Context and Impact of the 2011 Events in ... · PDF fileArab Spring has put the...
42
Socio-Economic Context and Impact of the 2011 Events in the Middle East and North Africa Region MENA-OECD Investment Programme December 2011
Transcript of Socio-Economic Context and Impact of the 2011 Events in ... · PDF fileArab Spring has put the...

Socio-Economic Context and Impact of the 2011 Events in the Middle East and North
Africa Region
MENA-OECD Investment Programme
December 2011

2
About this document
The demonstrations set-off in Tunisia in December 2010 after the self-immolation of a fruit vendor in
protest for police harassment, have triggered an unprecedented wave of changes in the Middle East and
North Africa region. Protests and uprisings in several MENA countries have led to the fall of three
longstanding regimes in Tunisia, Egypt and Libya; but they have also led to significant violence and
confrontations in other countries of the region.
Social and political instability are certainly having a negative impact in MENA countries. However,
they also represent a unique opportunity for political and economic change and progress. Importantly, the
Arab Spring has put the enduring weaknesses of MENA countries into the spotlight. Although high
unemployment rates, rampant corruption, lack of government transparency, lack of political representation
and cronyism have been long-lasting problems in the region, the call of citizens for greater political and
economic freedoms underscores the urgency of addressing those issues.
The MENA governments that have started processes of transition or reform are the main responsible
actors for steering change in the direction that their citizens demand. But the international community has
also an important role in supporting those governments and citizens through this process of change.
In this context, the Secretariat of the MENA-OECD Investment Programme, with the support of the
Swedish International Development Co-operation Agency (SIDA), conducted an assessment of the root
causes and economic impacts of the current events in the region. This document presents the main results
of the assessment.
The assessment leading to this report was undertaken by a team of the Secretariat of the OECD
Private Sector Development Division, which serves the MENA-OECD Investment Programme. The team
included Alexander Böhmer, Jorge Gálvez Méndez, Nathalie Sulmont and Moritz Schmöll. The study also
benefited from significant inputs from Margareta Davidson-Abdelli, Senior Advisor at SIDA, as well as
representatives of SIDA and the Swedish Ministry of Foreign Affairs.
Consultations with representatives from MENA and OECD countries participating in MENA-OECD
Investment Programme also constituted an important element of the assessment. Anthony O’Sullivan,
Nicola Elherman-Cache, Ania Thiemann, Korin Kane and Yvonne Giesing from the OECD Private Sector
Development Division provided important input for the study. The final findings of the assessment were
presented in June 2011 to Ms. Ewa Björling, Minister of Trade of Sweden and to officials from SIDA and
the Swedish Ministry of Foreign Affairs.
About the OECD and the MENA-OECD Investment Programme
The OECD is a unique forum where 34 member governments work together to address the economic,
social and environmental challenges of globalisation. The OECD is also at the forefront of efforts to
understand and help governments address emerging policy issues such as finding new sources of growth,
building skills, and restoring public trust in government and business. The OECD provides a setting where
governments can compare policy experiences, seek answers to common problems, identify good practice
and work to co-ordinate domestic and international policies. It increasingly engages with a number of non-
members who have become important actors in today’s global economy.
The MENA-OECD Investment Programme (www.oecd.org/mena) was established in 2005 at the
request of participating MENA governments to assist them in implementing business climate reform for

3
investment, growth and employment in the region. It is one of the two pillars of the MENA-OECD
Initiative on Governance and Investment for Development, which helps MENA governments design and
implement reforms to modernise public governance structure, strengthen the business climate and foster
transparency-issues which have taken on increasing importance in light of recent events in the region.
About the Swedish International Development Co-operation Agency
The Swedish International Development Co-operation Agency (SIDA) (http://www.sida.se/English/ )
the government agency of the Ministry of Foreign Affairs in charge of Sweden’s official development
assistance to developing countries. SIDA works according to directives of the Swedish Parliament and
Government to reduce poverty in the world. The overall goal of Swedish development cooperation is to
contribute to making it possible for poor people to improve their living conditions.
SIDA's head office is located in Stockholm but also has staff stationed in its partner countries. Its five
key areas for development are 1) democracy, human rights and gender equality; 2) economic opportunities;
3) knowledge, health and social development; 4) environmentally sustainable development; and 5) peace
and security.

4
In this report the MENA region refers to Algeria, Bahrain, Djibouti, Egypt, Iraq, Jordan, Kuwait,
Lebanon, Libya, Mauritania, Morocco, Oman, the Palestinian Territories, Qatar, Saudi Arabia, Syria,
Tunisia, the United Arab Emirates and Yemen. Indicators, data, averages and other information on the
MENA region refer to this group of countries. In a few cases, however, regional data has been directly
taken from other sources with different definitions of the MENA region. Regional indicators might also
exclude some countries for which data is not available for a given year or for a given indicator.
As used in this report, the term “country” is used mostly to designate a territorial entity for which
statistical data are maintained on an independent basis. The term does not necessarily refer in all cases to
a state as understood by international law and practice.

5
TABLE OF CONTENTS
EXECUTIVE SUMMARY ............................................................................................................................. 6
THE SOCIO-ECONOMIC CONTEXT OF THE ARAB SPRING ................................................................ 8
Country classification .................................................................................................................................. 9 Economic outlook of resource rich countries ............................................................................................ 10 Economic outlook of oil poor countries ..................................................................................................... 13 Competitiveness, business environments and entrepreneurship in the MENA region .............................. 29 Demographic, human development and gender outlook ........................................................................... 33
CONCLUSIONS ........................................................................................................................................... 42

6
EXECUTIVE SUMMARY
The Middle East and North Africa (MENA) region is witnessing a turning point. The social and
political protests and transformations set off in Tunisia in late 2010 and early 2011 spread to several
countries in what has been dubbed the Arab Spring. The demonstrations and demands for reforms have led
to varying degrees of political change in different countries and notably the toppling of two long ruling
presidents: Tunisia’s Zine El Abidine Ben Ali and Egypt’s Hosni Mubarak. But also in Libya, where the
repression of demonstrations led to increasing levels of violence and the eventual fall of the regime of
Muammar Gaddafi.
The start of the Arab Spring was certainly influenced by relatively temporary factors such as rising
prices and the contagion or inspirational effect of demonstrations occurring in other MENA countries,
prominently in Tunisia and Egypt. However, the main drivers of protests were of structural nature, notably
economic and socio-political factors that influence and strengthen each other and that explain why the
fairly positive macroeconomic performance of many countries in the region has not been translated into
better living standards and prospects for the majority of their populations.
One of those structural factors is the lack of economic opportunities, which are mainly expressed in
high levels of unemployment and underemployment that mostly affect young people, women and the
highly educated. This, in turn, has been importantly influenced by constrained private sectors which are
crowded out by the bloated role of the public sector in the economy; by low levels of entrepreneurship; by
inefficient competitive practices that favour privileged businesses; by low levels of competitiveness; and
by unfavourable business environments, among others.
Another main driving factor of the Arab Spring is the lack of political freedoms and representation
which is accompanied with pervasive corruption, lack of transparency and cronyism. This factor is
translated into strong and long-lasting regimes ruled by narrow elites which in many cases benefit
politically and economically a group of well-connected people or families at the expense of the majority.
Given the scope and objectives of this study, the socio-political factors are analysed only briefly and to the
extent of their effects in the economy, particularly regarding the development of the private sector.
Notwithstanding the negative consequences of the Arab Spring in the political, social and economic
stability of some MENA countries in the short term, the transition and reform processes unleashed offer an
extraordinary opportunity for meaningful change in the medium to longer terms. However, an anticipation
of the trends, reach, duration and results of the current transition and reforms is difficult given the great
differences between countries. Egypt and Tunisia are the “most advanced” in the transition process and
expect the drafting of new constitutions and the formation of new governments. The monarchies in Jordan
and Morocco are undertaking political reforms intended to strengthen the government’s powers. Libya is
emerging from a violent revolution and is planning to draft a new constitution and hold elections to
establish a new government. And in Yemen and Syria, important levels of confrontation and instability
make it very difficult to discern likely trends in the short to medium term.
As its title indicates, this report on the “Socio-Economic Context and Impact of the 2011 Events in the
Middle East and North Africa Region”, analyses the economic and social factors leading to the Arab

7
Spring, with a particular emphasis on issues directly affecting the development of the private sector. It also
analyses the immediate (reported or expected) economic impacts of the current events in the region and
provides an overview of the main facts and factors likely to influence the outcomes of the transition
processes at the regional level in the short and medium terms.
The main messages from the assessment are that:
The “Arab Spring” represents a powerful reminder of the structural regional challenges of
lack of political and economic freedom, accountability, governance reforms, job creation and
the need to enhance social and economic equality in the MENA region.
MENA countries, with the support of the international community, need to respond to those
challenges by improving transparency and governance, fighting corruption, promoting rule of
law and fostering the creation of jobs and economic opportunities through a dynamic private
sector. But there is also a need to be aware that tackling those challenges is a task that will
yield results in the medium to long-terms. Furthermore, those countries currently building
new governments will first face the challenges of managing their transitions.
Rising inflation, high youth unemployment and unrealistic expectations on the speed and
directions of the transition process could create tensions that could complicate the elaboration
and implementation of reforms. Increasing prices and lowered economic activity would have
a particularly acute effect on the poor.
Economic activity is faltering in several MENA countries because of decreases in tourism
and investment levels, political and economic uncertainty, increasing commodity prices and
more stringent conditions for access to finance, among others. Furthermore, the weaker-than-
expected economic activity in major OECD countries during the first half of 2011 and the
deterioration of consumer and investor confidence are expected to have negative effects in the
MENA region, particularly for those countries with important economic links to OECD
countries.
Domestic and foreign investment is declining because of uncertainty. Investment deals are
being cancelled, postponed or relocated to perceived safer destinations.
The financial sector is being disrupted given its high sensitivity to instability.
Fiscal deficits will widen given the increasing public spending, rising commodity prices and
reduced economic growth.
Countries currently in transition not only need to resume and step-up economic growth, but they also
need to establish the conditions for that growth to be translated into improved living standards. This
recommendation is rather broad and straightforward, but it is intended to underline the failure of past
records of economic growth and increasing levels of investment (especially FDI) to address the issue of
unemployment.
The report is divided in three sections. The first part is devoted to a general overview of the region,
mostly focused on economic, demographic and social elements. This section also includes a synopsis of the
expected or materialised economic impacts of the unfolding events in the short term and is based on a
number of sources such as official statements, news and intelligence reports, etc.

8
THE SOCIO-ECONOMIC CONTEXT OF THE ARAB SPRING
This section provides a detailed description of the most important economic, demographic and social
factors building up in many countries of the MENA region for several years. Those factors were major
drivers of the protests leading to the Arab Spring and the current transition and reform processes
experienced in Egypt, Tunisia, Morocco, Jordan and Libya. The section is based on an extensive analysis
of data and information obtained from several sources, including international organisations, news and
intelligence reports, official sources, etc. The analysis also draws on consultations undertaken with
representatives from MENA and OECD countries participating in the MENA-OECD Investment
Programme. The consultations took place throughout 2011 in the OECD headquarters in Paris and in
MENA countries.
The analysis in this section and in the overall report is essentially centred on issues affecting the
development and performance of the private sector. The main thesis sustained in this report is that the
private sector is the main driver of economic activity and employment, and that the mostly lacklustre
performance of private enterprise in the MENA region is one of the main reasons why the positive
economic performance over the past years was not translated into better living standards. The analysis also
considers other issues that impinged in social dissatisfaction and the eventual emergence of unrest such as
high demographic growth, lack of political freedom and representation, lack of transparency in government
decision making, etc. These issues, however, are beyond the scope and objectives of the report and
therefore are not treated in detail.
This section starts by underscoring the role that hydrocarbon wealth and population size and
composition have among MENA countries and describes the three main subgroups of countries in which
the analysis is mostly based. It provides a brief macroeconomic outlook of hydrocarbon rich and poor
countries and the role of oil wealth in economic performance, economic diversification, government
finance, external trade, etc. The analysis also describes the most important economic impacts that the
instability product of the Arab Spring is having and is expected to have in the short term. Those impacts
regard overall economic activity and growth and in particular investment and tourism, which are
characterised their high sensitivity to uncertainty.
The focus is also put on microeconomic elements directly related to the private sector such as the
quality of business environments, competitiveness and an entrepreneurship. Other factors such as labour
market rigidities, bloated public sectors, skills mismatches and gender inequality are described in the
demographic, human development and gender overview. Such an overview also underscores the role of
high demographic growth rates in the “youth bulge” (a term that has become popular in the context of the
Arab Spring). The section concludes by presenting a short political outlook that, although is not the object
of this report, is essential in covering the most important issues behind the current events.

9
Country classification
Countries1 in the MENA region share several cultural, historical and geographical traits but also many
marked differences, being two of the most notable the availability or lack of hydrocarbon resources in their
territories and the size of their native populations. Based on this, MENA economies can be classified in
three main groups2:
1. Resource rich, labour abundant countries are producers and exporters of oil and gas and have
large native populations which represent almost the totality of their residents. This group of
countries includes Algeria, Iraq, Syria3 and Yemen.
2. Resource rich, labour importing countries are producers and exporters of oil and gas and have
large shares of foreign or expatriate residents which represent a significant percentage of the total
population and even the majority in some cases. This group of countries includes the Gulf Co-
operation Council (GCC) members (Bahrain, Kuwait, Oman, Qatar, Saudi Arabia and the UAE)
and Libya.
3. Resource poor countries are small producers or importers of oil and gas. These countries
comprise Djibouti, Egypt, Jordan, Lebanon, Mauritania, Morocco, Tunisia and the Palestinian
Territories.
The availability of hydrocarbons and the size of the population have important implications for the
economic features and performance of MENA countries
The MENA region is home to nearly 60% of the 1.4 trillion barrels of proven crude oil reserves and
46% of the 192 trillion standard cubic metres of natural gas reserves (OPEC, 2010). However, the
distribution of hydrocarbon wealth is uneven across countries, with only six countries (including Iran)
accounting for 94% of proven oil reserves, and Saudi Arabia taking the lion’s regional share of 31%.
The resource rich countries members of the Gulf Co-operation Council (GCC) and Libya have vast oil
resources, are home to small populations (except Saudi Arabia) and are important magnets of foreign
workers, both skilled and unskilled. These resource rich, labour importing countries are home to only 15%
of the total population in the MENA region yet they account for nearly half of its total GDP and register
high levels of GDP per capita. Figure 1 shows that GDP per capita in this subgroup of countries is
significantly above the regional median of US$8,300, ranging from around US$15 000 in Libya to a very
high US$88 000 in Qatar.
The rest of the resource rich countries host comparatively larger populations (37% of the total in the
MENA region) and account for a lower share of regional GDP (less than 20%). These countries’ average
GDP per capita of US$4 600 is significantly lower, even compared to the resource poor countries, which
account for above 46% of total population and 32% of total GDP. Figure 1 shows that all resource rich,
1 As used in this report, the term “country” is used mostly to designate a territorial entity for which statistical data are
maintained on an independent basis. The term does not necessarily refer in all cases to a state as understood
by international law and practice.
2 Based on the World Bank’s denotations of resource-poor, labour-abundant countries; resource-rich, labour-abundant
countries; and resource-rich, labour-importing countries
3 Syria is classified by the World Bank as a resource rich, labour abundant country and by the IMF as an oil importing
country. This report follows the World Bank’s classification even though Syria’s oil production (at 250
thousand barrels per day) and proven oil reserves (2.5 billion barrels) are low compared to other resource
rich countries.

10
labour abundant countries and most of the resource poor countries are found below the median GDP per
capita, with the only exceptions of Tunisia and Lebanon. The most populous of these countries, however,
have large economies above the regional median, notably Egypt, with a population of well over 80 million
and a GDP of nearly US$500 billion.
Figure 1. Oil resources and total population are key distinguishing characteristics of MENA countries
GDP (2010) and total population (2009)
Resource poor
Resource rich, labour abundant
Resource rich, labour importing
Notes: The dimension of the bubble denotes the size of the population; gross domestic products are based on purchasing-power-parities (PPP) valuation of country GDP, current international dollar.
Sources: International Monetary Fund, World Economic Outlook Database, April 2011; and World Bank, World Development Indicators Database.
Economic outlook of resource rich countries
Hydrocarbons are an important source of government revenue, exports and economic activity; but oil
dependence has also been translated in low levels of economic diversification and high volatility in
resource rich countries
Oil related activities represent on average a third of total GDP in resource rich countries (both labour
importing and labour abundant), ranging from around 10% in Yemen to more than 60% in Iraq. In terms of
fiscal revenues the weight of oil is even greater, with over 50% of total revenue in all countries due to oil
production (figure 2). Furthermore, oil production directed to the domestic market is low and on average
oil producers export around three quarters of their total production (figure 3, panel A). The resource rich
countries’ export base is consequently very narrow, with oil exports taking on average 80% of total
exports, except in the UAE, where oil represents around a third of total exports (figure 3, panel B).

11
Figure 2. Resource rich countries are highly dependent on hydrocarbon resources
Fiscal and economic activity: Dependence on oil, 2010
Resource rich, labour abundant
Resource rich, labour importing
Source: International Monetary Fund (2011), Regional Economic Outlook, Middle East and Central Asia, April 2011
Figure 3. Oil exports take the lion’s share in total exports in resource rich countries
A. Oil production and exports, 2010 B. Oil exports as a share of total exports, 2009
Sources: International Monetary Fund (2011), Regional Economic Outlook, Middle East and Central Asia, April 2011; and OPEC (2010), Annual Statistical Bulletin, 2009.
High levels of dependence on hydrocarbon production and exports have been inevitably reflected in the
economic performance of resource rich countries
The overall economic growth rate of the MENA region has tended to follow oil patterns. This was
clearly evident during the price and oil export decreases registered during the 2008-2009 global crisis
(figure 4, panel A). The 35% fall in oil prices in 2009 (from US$95 to US$61 per barrel) was accompanied

12
by a lower average economic growth rate for the overall region of 2.4%, as compared to 6.4% in 2008.
Furthermore, when looking at subgroups of countries it becomes evident that the impact was higher in
resource rich, labour importing countries, whose GDP growth decreased from 7.0% in 2008 to just 0.4% in
2009; at the same time, in the resource-rich, labour abundant countries GDP growth registered a less
significant contraction from 4.6% to 3.3% during the same years.
The panel B in figure 4 offers a more detailed picture of selected economic indicators in oil exporting
countries. It reveals that GDP growth due to oil activities was actually negative in 2009. It also shows that
the current account balance surplus for this group of countries contracted more than proportionally, from
over 23% of GDP in 2008 to less than 5% in 2009. Furthermore, the effects were even more manifest in
total government balances, which went from a surplus of almost 20% of GDP in 2008 to a deficit of 2% in
2009. The negative effect on the government balances, however, was also due to the stimulus measures
undertook by governments to revitalise the non-oil economy in the context of the global economic and
financial crisis. Along these lines, it has been estimated that a US$10 per barrel swing in the average price
of oil over a year could affect oil exporters’ aggregate external current and fiscal accounts by US$88
billion and US$75 billion respectively (IMF, 2010).
In addition, as shown in figure 6 in the next section, during 2000-2010 the resource rich, labour
abundant economies have grown at similar average rates than those of resource poor countries; yet their
growth has tended to be more volatile (measured as the standard deviation of average GDP growth during
the same period) except for Bahrain, Saudi Arabia and Oman. What is more, average GDP growth in oil
rich, labour abundant countries has been even lower than in most oil poor countries.
Figure 4. GDP growth and other macroeconomic indicators have mirrored oil price and production levels in resource rich countries
A. GDP growth in resource rich and resource poor countries
B. Selected economic indicators in resource rich countries
Note: Weighted averages based on total GDP. Oil prices are OPEC basket price.
Source: OECD calculations with data from the International Monetary Fund (2011), Regional Economic Outlook, Middle East and Central Asia, April 2011 and OPEC (2010) Annual Statistical Bulletin 2009.

13
Economic outlook of oil poor countries
Resource poor countries have relatively more diversified and less volatile economies than resource rich
countries
Although the MENA region, taken as a whole, has lower levels of economic diversification than other
regions (figure 5, panel A), the resource poor countries have comparatively larger manufacturing industries
and services sectors than the resource rich ones4. Furthermore, in some cases the value added in the
manufacturing and services sectors in oil poor countries is at par with that of other regions (figure 5, panel
B). The manufacturing sector in Jordan accounts for 20% of total value added whereas those of Tunisia,
Egypt and Morocco account for 16%. This represents a higher share than the average manufacturing value
added in other regions except for the East Asia and the Pacific. Similarly, the value added in the services
sector in Lebanon, Jordan, Tunisia and Morocco is above or around the same share than the average in the
OECD, East Asia and Pacific and Latin America and Caribbean regions.
Figure 5. Oil poor countries tend to have more diversified economic structures than oil rich ones
A. Value added in selected regions 2009 or most recent year
B. Value added in the MENA region 2009 or most recent year
Note: (1) Excluding manufacturing. Industrial activities comprise Mining and quarrying (ISIC 10-14), which include oil and gas extraction; Manufacturing (ISIC 15-37), Electricity, gas and water supply (ISIC 40-41) and Construction (ISIC 45). In this case, “rest of industry” refers to industrial activities excluding manufacturing, which is shown separately; and oil. ISIC is the UN International Standard Industrial Classification of All Economic Activities.
Source: World Bank, World Development Indicators Database
These comparatively higher levels of economic diversification in resource poor countries have been
accompanied with relatively high and stable economic growth, although at lower levels than the average in
emerging markets. During 2000-2010, all countries in this subgroup, except the poorest (Djibouti and
Mauritania), grew at average yearly rates ranging from 4.5% to 6%, similar to those of resource rich,
labour importing countries and even above those of resource rich, labour abundant countries (figure 6).
These rates were also relatively less volatile than in the oil rich, labour importing countries (using the
standard deviation of economic growth as a proxy for volatility).
4 The reason for measuring economic diversification in terms of the size of the manufacturing and services activities
is their larger number of subsectors as compared to agriculture and the rest of industrial sectors.

14
However, as explained later in this report, greater levels of economic diversification and economic
growth during the last ten years have not lead to an improvement of the living standards of the population.
A bloated and inefficient public sector and a narrow and lacklustre private sector have not been able to
reduce the high levels of unemployment that have affected MENA countries for several years.
Figure 6. Average economic growth has been relatively higher and less volatile in oil poor countries than in oil rich ones
Average yearly GDP and volatility (standard deviation) in MENA countries, 2000-2010
Source: International Monetary Fund, World Economic Outlook database, April 2011
The lack of hydrocarbon resources has also been translated in fiscal balance and current account
deficits in many resource poor countries
Lacking the vast financial resources that hydrocarbon wealth brings, resource poor countries have
registered persistent deficits in their general government balances, which averaged 6% during 2006-2010
(figure 7, panel A). As it will be further explained in this report, those deficits have been importantly
driven by high current government expenditure and subsidies, which are being increased in the context of
the Arab Spring.
The lack of oil wealth, the low levels of export competitiveness and the dependency on imports,
importantly food and fuel, have also been translated into deficits in the current account balance (figure 7,
panel B). The current context of rising commodity prices, notably oil and food items, are expected to put
additional pressures on the external and fiscal balances of resource poor countries, which will need to
devote higher shares of their incomes to import and distribute those items or which will need to allow
prices to rise at the risk of higher inflation feeding further social discontent.
In contrast, the resource rich, labour importing countries have maintained surpluses in their fiscal and
current account balances. Those surpluses, which were declining given the impact and stimulus measures

15
taken in the context of the 2008-2009 crisis, 5 will widen as instability and uncertainty in the region keeps
oil prices high (figure 10).
Figure 7. Resource poor countries register persistent fiscal deficits
A. General government fiscal balance B. Fiscal and current account balances in selected countries, 2010
Note: Weighted averages based on GDP
Source: IMF (2011), Regional Economic Outlook, Middle East and Central Asia, April 2011.
The recent events in the MENA region have led to a downgrade of economic growth forecasts in most
resource poor countries
The widespread political and social instability in several MENA countries is having direct negative
economic effects in those countries most affected by turmoil, and positive effects in the more stable
resource rich, labour importing countries, notably Saudi Arabia and, to a lower extent, Kuwait. However,
the degree of economic loss for the most affected countries in the short and longer terms depends on the
levels of confrontations and the damage of the fundamentals of the economy.
In this view, Egypt and Tunisia are suffering economic losses during 2011 given the important levels
of political and social uncertainty, the cancelation or postponement of investment and consumption
decisions, and the temporary shutting down of banks, stock markets, factories, shops and ports, among
others. Against this background, the slowdown in economic activity could extend to 2012. The economic
fundamentals of these two countries, however, are not expected to be damaged and economic growth
should resume when the political panorama is clearer.
In the case of Libya, the significant levels of violence during the revolution have caused important
damage to its infrastructure, and the current context of high uncertainty regarding the future of the country
will certainly have negative effects in the economy in the short term. On the other hand, reconstruction
efforts are expected to partially compensate that damage and revitalise the economy.
5 To illustrate this, Saudi Arabia implemented the largest stimulus package among the G20 countries as a share of
GDP (US$ 400 billion).
16
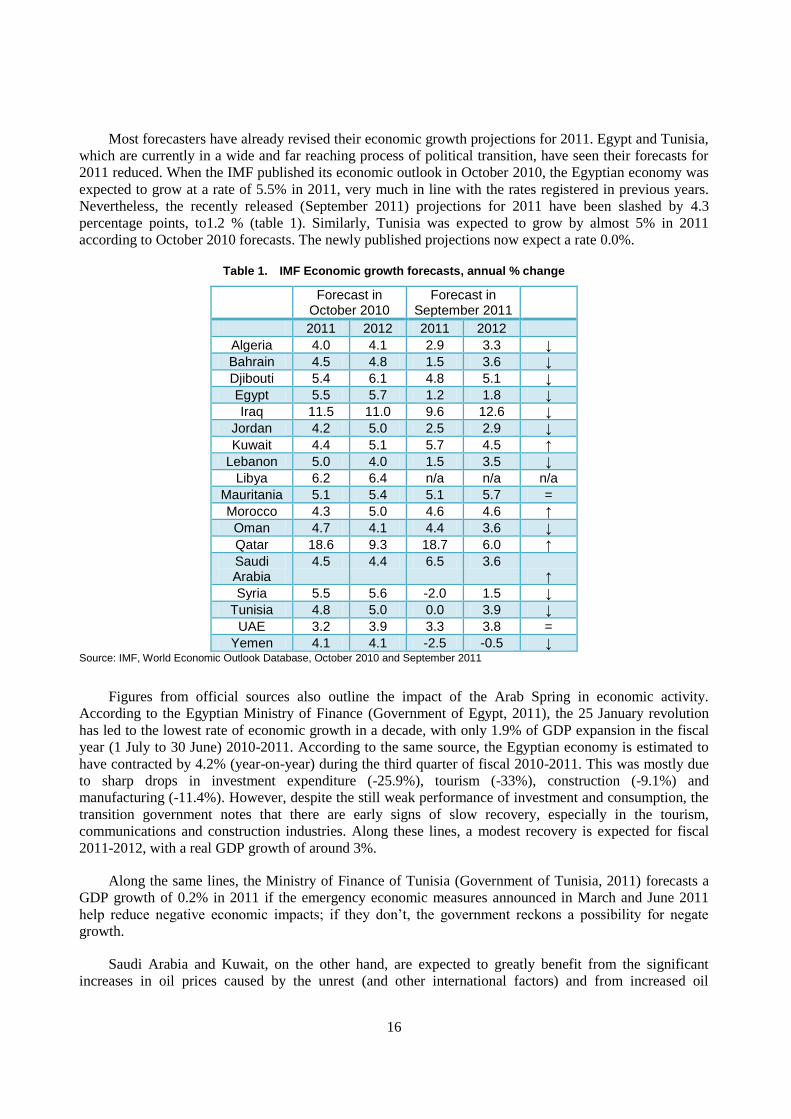
Most forecasters have already revised their economic growth projections for 2011. Egypt and Tunisia,
which are currently in a wide and far reaching process of political transition, have seen their forecasts for
2011 reduced. When the IMF published its economic outlook in October 2010, the Egyptian economy was
expected to grow at a rate of 5.5% in 2011, very much in line with the rates registered in previous years.
Nevertheless, the recently released (September 2011) projections for 2011 have been slashed by 4.3
percentage points, to1.2 % (table 1). Similarly, Tunisia was expected to grow by almost 5% in 2011
according to October 2010 forecasts. The newly published projections now expect a rate 0.0%.
Table 1. IMF Economic growth forecasts, annual % change
Forecast in October 2010
Forecast in September 2011
2011 2012 2011 2012
Algeria 4.0 4.1 2.9 3.3 ↓
Bahrain 4.5 4.8 1.5 3.6 ↓
Djibouti 5.4 6.1 4.8 5.1 ↓
Egypt 5.5 5.7 1.2 1.8 ↓
Iraq 11.5 11.0 9.6 12.6 ↓
Jordan 4.2 5.0 2.5 2.9 ↓
Kuwait 4.4 5.1 5.7 4.5 ↑
Lebanon 5.0 4.0 1.5 3.5 ↓
Libya 6.2 6.4 n/a n/a n/a
Mauritania 5.1 5.4 5.1 5.7 =
Morocco 4.3 5.0 4.6 4.6 ↑
Oman 4.7 4.1 4.4 3.6 ↓
Qatar 18.6 9.3 18.7 6.0 ↑
Saudi Arabia
4.5 4.4 6.5 3.6 ↑
Syria 5.5 5.6 -2.0 1.5 ↓
Tunisia 4.8 5.0 0.0 3.9 ↓
UAE 3.2 3.9 3.3 3.8 =
Yemen 4.1 4.1 -2.5 -0.5 ↓ Source: IMF, World Economic Outlook Database, October 2010 and September 2011
Figures from official sources also outline the impact of the Arab Spring in economic activity.
According to the Egyptian Ministry of Finance (Government of Egypt, 2011), the 25 January revolution
has led to the lowest rate of economic growth in a decade, with only 1.9% of GDP expansion in the fiscal
year (1 July to 30 June) 2010-2011. According to the same source, the Egyptian economy is estimated to
have contracted by 4.2% (year-on-year) during the third quarter of fiscal 2010-2011. This was mostly due
to sharp drops in investment expenditure (-25.9%), tourism (-33%), construction (-9.1%) and
manufacturing (-11.4%). However, despite the still weak performance of investment and consumption, the
transition government notes that there are early signs of slow recovery, especially in the tourism,
communications and construction industries. Along these lines, a modest recovery is expected for fiscal
2011-2012, with a real GDP growth of around 3%.
Along the same lines, the Ministry of Finance of Tunisia (Government of Tunisia, 2011) forecasts a
GDP growth of 0.2% in 2011 if the emergency economic measures announced in March and June 2011
help reduce negative economic impacts; if they don’t, the government reckons a possibility for negate
growth.
Saudi Arabia and Kuwait, on the other hand, are expected to greatly benefit from the significant
increases in oil prices caused by the unrest (and other international factors) and from increased oil

17
production to compensate for lost Libyan oil output (although there are reports that Saudi Arabia has
actually not increased its production). The IMF has consequently revised upwards its growth forecasts for
2011 for Saudi Arabia by 2 percentage points and for Kuwait by 1.3 percentage points.
Tourism, a key economic sector in some MENA economies has been hit hard by political and social
turmoil
Tourism is a key economic sector in several MENA countries, providing important sources of
employment and revenue (figure 8). But it is also a very sensitive sector to violence and instability be it
real or perceived as potential. The current events in the MENA region are having negative effects in the
tourism industry in affected countries, not only in terms of visitors but also in terms of investment. Some
initial evidence indicates that:
During 2011, receipts from tourism are expected to decline in Egypt and Tunisia by up to 1% of
GDP.
According to Egypt’s tourism minister, revenues from tourism last February were 80% below
2010 levels. In March this number fell to -60%, and in April to -35%. Tourism revenues are
expected to fall by 25% for the whole of 2011, although recent estimates by the Egyptian
government indicate a gradual recovery in this sector.
According to Tunisian officials, tourism receipts to end-April dropped by 48% in comparison to
2010. Recent estimates point to a fall of 51% in income from tourism and 39% in the number of
tourist in the first half of 2011.
The UN World Tourism Organisation estimates that during the first two months of 2011,
international tourist arrivals to Tunisia decreased by 44% and receipts by 43%.
In Bahrain, hotel occupancy rates plummeted to 5% to 10%. In addition, the Formula One Grand
Prix, which contributed US$600 million or 2.9% of GDP to Bahrain’s economy in 2008, was
cancelled in 2011.
Although estimations are not available for Syria, the tourism industry, which accounts for 12% of
employment and GDP, is being greatly damaged by the current instability.
Figure 8. Tourism is a key economic sector for several countries in the region
A. Employment and receipts in the tourism sector, 2010 B. International tourism receipts as percent of total exports
Source: IMF (2011), Regional Economic Outlook, Middle East and Central Asia, April 2011 and World Bank, World Development

18
Indicators Database
Inflation rates in resource poor countries have remained high since the wave of food and fuel price
increases of 2008 and the current events are expected to lead to even higher inflationary pressures
Consumer price inflation has remained high since the oil and fuel price spikes of 2007-2008. As
shown on table 2, most countries have registered higher inflation rates in the period 2006-2010 than in
1996-2005. This is particularly the case of Egypt, which registered an inflation rate of 5% during 1996-
2005 and a significantly higher rate of 11% during 2006-2010.
Furthermore, inflation rates have remained comparatively high in resource poor countries, which
import significant amounts of food and fuel and which do not have the large financial resources enjoyed by
resource rich countries to implement compensatory measures such as subsidies and lowered food import
tariffs without hurting their government finances (figure 9, panels A and B). This importantly affects low
and middle income sectors of the population, which devote high shares of their revenue to food and energy
items as compared to wealthier segments of society.
Table 2. Inflation, average consumer prices
Percentage change
Economy 1996–2005 2006–2010 Difference
Algeria 4.6 4.1 -0.5
Bahrain 0.7 2.7 2.0
Djibouti 2.0 5.2 3.2
Egypt 5.0 11.0 6.0
Iraq n/a 17.4 n/a
Jordan 2.6 5.8 3.2
Kuwait 1.8 5.4 3.7
Lebanon 2.5 5.2 2.7
Libya -0.6 4.7 5.3
Mauritania 6.1 5.9 -0.2
Morocco 1.6 2.2 0.6
Oman 0.1 5.7 5.6
Qatar 3.6 6.7 3.1
Saudi Arabia -0.1 5.3 5.5
Syria 2.3 7.5 5.2
Tunisia 2.9 4.1 1.2
UAE 3.1 7.0 3.9
Yemen 13.2 10.5 -2.7
MENA 3.0 6.5 3.4 Source: IMF, World Economic Outlook Database, September 2011

19
Figure 9. High dependence on food and fuel imports has been reflected in high inflation rates in resource poor countries
A. Consumer price inflation B. Food and fuel imports, 2009 or most recent year
Note: Weighted averages based on GDP
Source: OECD staff calculations based on IMF (2011), Regional Economic Outlook, Middle East and Central Asia, April 2011.
Oil prices are expected to remain high in the foreseeable future given the current events in the region
and other international trends
The economic recovery after the 2008-2009 financial and economic crisis was already pushing oil
prices up before the start of the Arab Spring (figure 10, panel A). But with the ignition of protests and,
initially, because of alleged concerns about the security of the Suez Canal, the price of oil has continued its
way up. This trend was further reinforced after the disruption of oil production in Libya and the consequent
loss in oil output (figure 10, panel B). Indeed, Libya had reportedly reduced oil production from 1.6
million barrels per day to less than 0.4 million barrels per day (which are mostly destined to internal
consumption). However, after the fall of the regime, output is expected to eventually increase.
What is more, increasing oil and food prices are pushing upwards the commodity price index and the
food and beverage price index (figure 11, panels A and B). This may complicate the stability of the region
in the coming months if rising food and fuel prices add to inflationary pressures. On the other hand, if
inflation is kept low through subsidies and price controls, the increasing fuel and food prices will be
translated into increased import bills and fiscal deficits. Table 3 contains IMF estimations on the impact of
higher fuel and food prices and indicates that there will be important increases in the fiscal deficits of
Egypt, Morocco and Tunisia as a result of this.

20
Figure 10. Events in the region have importantly driven oil prices up
A. Crude Oil (petroleum), Simple average of three spot prices (APSP); Dated Brent, West Texas Intermediate,
and the Dubai Fateh, dollars per barrel
B. Monthly price of crude oil (Brent, WTI, Dubai Fateh average), in US$ per barrel
Source: IMF, World Economic Outlook Database, September 2011 and OPEC.
Figure 11. Increasing oil and food prices add to inflationary pressures
A. Commodity Price Index includes both Fuel and Non-Fuel Price Indices, Index 2005=100
B. Commodity Food and Beverage Price Index includes Food and Beverage Price Indices, Index 2005=100
Source: IMF, World Economic Outlook Database, April 2011.

21
Table 3. Impact of higher fuel and food prices
Estimated implied increase in:
Import bill (% of GDP)
Consumer prices (%)
Fiscal deficit (% of GDP)
Egypt 1.6 2.2 2.8
Jordan 4.1 7 to 8 0.8 to 1.2
Lebanon 4.4 6 to 7 1.1 to 1.3
Mauritania 3.4 5.3 1.2
Morocco 2.3 0.7 2.3
Syria 1.9 1.5 to 2.5 1
Tunisia 1.6 2.6 1.6
Average 2.7 3.7 1.5 Note: Direct impact with policies as of end-2010 of price increases of 32% for fuel and 24%for food, as implied by current World Economic Outlook projections for 2011 compared to 2010.
Source: IMF (2011), Regional Economic Outlook, Middle East and Central Asia, April 2011.
Higher food and fuel prices and lowered economic activity will dent fiscal balances
Two main factors are at play in the expected increases in fiscal deficits of resource poor countries for
2011: the slow-down in economic activity caused by turmoil and which has resulted in the loss of
government revenue; and increased public sector spending, mostly through higher subsidies and public
sector salaries and employment.
As it can be noted from figure 12, panel A, all resource poor countries, except Djibouti, expect a
widening on their fiscal deficits in 2011 as compared to 2010. Furthermore, Tunisia, Lebanon and Egypt
expect the largest increases in their fiscal deficits for 2011 at an additional 3.1%, 3.3% and 1.6%,
respectively.
In Egypt, for instance, increased government expenditures due to “exceptional spending programmes”
and estimated at around 2.9% of GDP, are expected to lead to a fiscal deficit of 9.5% of GDP in the fiscal
year (July 1 to June 30) 2011, two percentage points higher than the target prior to the start of the Arab
Spring. The measures announced by the transition government include an increase of 15% in the base wage
of the nearly 5.8 million civil servants as well as “incentive schemes” for the lowest paid government
employees, which are around 1.9 million mostly working in municipalities. The Egyptian government has
also announced a total increase of 17% in social spending, with allocations to housing, healthcare and
education increasing by 39%, 17% and 9%, respectively (Government of Egypt, 2011).
Similarly, the Tunisian Ministry of Finance (Government of Tunisia, 2011) has estimated that the
fiscal deficit will be four times higher in 2011 than in 2010, given the loss of economic activity and the
significant increase (20%) of government expenditure due to rises in salaries and subsidies. The
government also announced an employment plan which includes the creation of 20 000 jobs in the public
sector.
Similar measures implemented or announced in several resource poor countries, together with slowed
down economic activity, are certainly adding pressures to their fiscal and external balances.

22
The effect of the windfalls caused by higher oil prices is steep for the resource rich countries: all
countries except Yemen and Iraq are expected to register surpluses in their fiscal balances. Furthermore, all
resource rich countries, bar Yemen and Qatar, expect a positive difference in their fiscal balances of 5% or
more in 2011 as compared to 2010. This already takes into account the large spending increases announced
by some countries and is influenced by the conservative initial estimates of average oil prices in national
budgets (on average US$ 55 per barrel).
Government debt levels remain relatively low but downgrades in credit ratings for some countries will
make debt more expensive
Government debt levels in the MENA region are low compared to OECD countries, except for
Lebanon, which registers gross debt of over 133% of GDP and net debt (gross debt minus all financial
assets of the general government) of 126% of GDP. Gross debt estimates for 2011 expect debt levels in
most resource poor countries to increase, partly as an effect of larger government expenditure driven by
current events. Those increases, however, will remain modest, with the largest debt growth to be registered
in Tunisia (up 2.4% of GDP) and Morocco (2.9%) and comparatively lower increases in Jordan and
Yemen (1.4%) and Egypt (1.1%) (figure 12, panel B).
Downgrades in sovereign credit ratings, however, will drive borrowing costs up. From rated countries,
Bahrain, Egypt, Jordan and Tunisia have been downgraded by one or more notches whereas ratings for
Libya have been suspended (table 4).
Figure 12. Government finance is expected to be under stress during 2011
A. General government fiscal balance, % of GDP B. General government gross debt, % of GDP
Source: IMF, World Economic Outlook Database, April 2011.

23
Table 4. Sovereign Credit Ratings
Long term
Economy Moody's S&P Fitch
Abu Dhabi Aa2 AA AA
Bahrain Baa1 BBB BBB
Egypt Ba3 BB BB
Jordan Ba2 BB n.a.
Kuwait Aa2 AA AA
Lebanon B1 B B
Libya n.a. BB (rating
suspended) B (rating suspended)
Morocco Ba1 BBB- BBB-
Oman A1 A n.a.
Qatar Aa2 AA n.a.
Saudi Arabia Aa3 AA- AA-
Tunisia Baa3 BBB- BBB- Note: Downgraded since January 2011 highlighted in blue.
Source: rating agencies
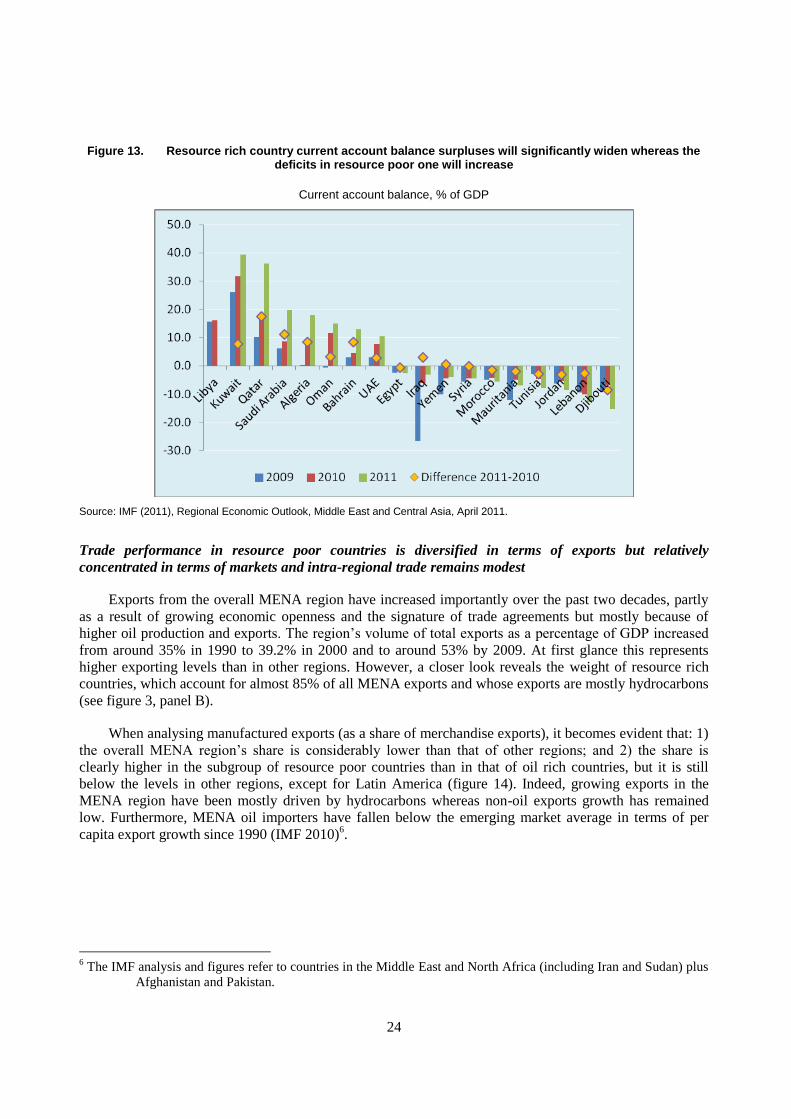
Current account balances in resource poor countries will deteriorate in 2011
Increasing commodity prices will certainly hurt the current account balances of resource poor
countries given the important amounts of fuel and food they import. As shown in figure 13, the surpluses
in the current account balances of resource rich countries will widen as a result of increasing oil prices and
production. In Saudi Arabia, for instance, the current account balance will rise by over 11 percentage
points of GDP, from 8.7% in 2010 to almost 20% in 2011. Kuwait, another country expected to benefit
from the current regional turmoil, will widen its current account balance from 32% to 39% of GDP. Iraq
and Yemen, which register current account deficits, will see those shrink by 3% and 0.5% of GDP
respectively.
Resource poor countries, on the other hand, will register widening current account deficits, though to
different degrees. Egypt’s current account deficit will increase by less than 1% of GDP, from -2% to -
2.7%. Tunisia, on the other hand, will register a wider gap of 3% of GDP, from -4.8% to -7.8%. Since the
expected widening of current account surpluses in resource rich countries is larger than the foreseen
increases in deficits in resource poor ones, then, overall it could be said that the oil price hikes are
benefiting the region in general, although, clearly, not evenly across countries.
24
Figure 13. Resource rich country current account balance surpluses will significantly widen whereas the
deficits in resource poor one will increase
Current account balance, % of GDP
Source: IMF (2011), Regional Economic Outlook, Middle East and Central Asia, April 2011.
Trade performance in resource poor countries is diversified in terms of exports but relatively
concentrated in terms of markets and intra-regional trade remains modest
Exports from the overall MENA region have increased importantly over the past two decades, partly
as a result of growing economic openness and the signature of trade agreements but mostly because of
higher oil production and exports. The region’s volume of total exports as a percentage of GDP increased
from around 35% in 1990 to 39.2% in 2000 and to around 53% by 2009. At first glance this represents
higher exporting levels than in other regions. However, a closer look reveals the weight of resource rich
countries, which account for almost 85% of all MENA exports and whose exports are mostly hydrocarbons
(see figure 3, panel B).
When analysing manufactured exports (as a share of merchandise exports), it becomes evident that: 1)
the overall MENA region’s share is considerably lower than that of other regions; and 2) the share is
clearly higher in the subgroup of resource poor countries than in that of oil rich countries, but it is still
below the levels in other regions, except for Latin America (figure 14). Indeed, growing exports in the
MENA region have been mostly driven by hydrocarbons whereas non-oil exports growth has remained
low. Furthermore, MENA oil importers have fallen below the emerging market average in terms of per
capita export growth since 1990 (IMF 2010)6.
6 The IMF analysis and figures refer to countries in the Middle East and North Africa (including Iran and Sudan) plus
Afghanistan and Pakistan.

25
Figure 14. Manufactured exports in resource poor countries are relatively low when compared to other regions
2009 or most recent year
Source: World Bank, World Development Indicators
In terms of trade diversification, resource poor countries’ exports are mostly concentrated in the
European Union market, although at decreasing levels. Intraregional trade, on the other hand, has been
increasing in importance since the 1990s, although it is still modest when compared to trade with other
countries, particularly the EU (figure 15, panel A). Furthermore, despite the increasing weight that the
BRIC countries (Brazil, Russia, India and China) have in global economic growth, they still account for a
small share of resource poor country exports.
Export market diversification, however, varies from country to country. The panel B in figure 15
shows that exports from Tunisia and Morocco are greatly concentrated in the EU market, whereas in
Mauritania most exports are destined to BRIC countries, mainly China, which is the destination of more
than 40% of the country’s exports (which mostly consist on iron ore). Lebanon and Djibouti’s exports, on
the other hand, are mostly targeted to other MENA markets. These variations are mainly due to the
different compositions of goods exports in resource poor countries and the characteristics of demand in the
importing markets (e.g. an important share of imports by China is due to raw materials whereas exports are
mostly manufactured products). Morocco and Tunisia, for instance, are mostly exporters of manufactured
products whereas Mauritania is a large producer of raw materials.
Tariffs remain amongst the highest in the world and many MENA countries are not members of
the World Trade Organisation
In line with international trends, tariffs have decreased during the last decade, although they remain
higher than in OECD countries and large emerging economies. As shown in figure 16, panel A, Egypt and
Morocco have made great progress cutting average tariffs from nearly 25% in 2002 to less than 10% in
2008. Those levels, however, remain higher than in other MENA countries. Furthermore, as shown in
figure 16 panel B, MENA average weighted tariffs in trade with other regions remain high. And despite the
fact that intra-regional tariffs are low, trade among MENA countries remains low.

26
It is also worth mentioning that only 10 of the 19 MENA countries are members of the World Trade
Organisation, namely Bahrain, Djibouti, Egypt, Jordan, Kuwait, Mauritania, Morocco, Oman, Saudi
Arabia and Tunisia.
Figure 15. Resource poor countries main export market is the EU, but to varying degrees
A. Goods exports destinations, resource poor countries B. Goods exports destinations in individual countries, 2009
Source: IMF, Direction of Trade Statistics
Figure 16. Tariffs in the MENA region have been decreasing during the last decade; however, they remain higher than in other countries
A. Average weighted tariffs (%) B. Average weighted tariffs by region (%) 2010 or most recent year
Source: OECD staff calculations with data from the World Integrated Trade Solution database

27
FDI to some resource poor countries has significantly increased and is above the developing economy
averages
Resource rich, labour importing countries take the lion’s share in the MENA region in terms of
foreign direct investment inflows. Of the US$ 64.5 billion of FDI that were invested in the region in 2010,
over two thirds went to those countries, with Saudi Arabia alone accounting for over 44% of the MENA
total (figure 17, panel A). The resource poor countries, on the other hand, received 22% or around US$ 17
billion of total FDI, with Egypt and Lebanon the main recipients. For reference, resource poor countries are
home to nearly 50% of MENA population whereas resource rich, labour importing ones account for less
than 15%.
Although in absolute terms FDI inflows to resource poor countries have remained below the levels of
inflows to resource rich, labour importing countries, in relative terms their performance appears to be
higher. FDI as a share of GDP has increased over the past two decades (although at significantly lower
levels than in other regions), which points to the increasing attractiveness of resource poor countries as
destinations for investments. As shown in figure 17, panel B, FDI inflows to resource poor countries, as a
share of GDP, soared from around 0.7% in 1990 to over 12% in the mid-2000s, well above the levels in
resource rich countries and developed and developing economies. These levels decreased again during the
2008-2009 global crisis, but they remained above the regional average.
The MENA region has higher levels of FDI per capita than most other countries. The regional average
of US$637 is well above the world’s (US$163), the G20’s (US$149) and even the developed countries’
(US$553). This average, however, is significantly pushed up by the large amounts of FDI going to the
resource rich, labour importing countries. Still, when analysing the resource poor countries as an individual
group it becomes clear that their levels of FDI per capita are higher than in the rest of the world, the G20
and the developing countries, but below the developed economies (table 5).
Figure 17. Oil rich countries are the main recipients of FDI in dollar terms; and oil poor countries are the main destinations in terms of FDI as a % of GDP
A. FDI inflows to the MENA region, 2010 B. FDI inflows as a share of GDP
Notes: The chart in panel B is based on simple averages.
Source: UNCTAD.Stat

28
Table 5. FDI per capita and total FDI
2009
Category FDI per capita (US$) FDI total (US$ billions)
Resource poor 239 17.0
Resource rich, labour abundant 47 5.5
Resource rich, labour importing 1 429 53.5
MENA 637 76.0
Developing economies 87 478.3
Developed economies 553 565.9
G20 149 625.7
World 163 1 114.2 Source: UNCTAD.Stat
But FDI to export oriented sectors has remained very limited, which points to the low attractiveness and
competitiveness of those sectors
In resource poor countries, most FDI outside the energy sector has been mostly directed to non-
tradable sectors (i.e. goods or services that cannot be sold in locations distant from their place of
production, for instance, real estate as opposed to manufactured goods). Figure 18 panel A shows that FDI
to MENA countries for which data is available has been mostly directed to non-tradable sectors such as
telecommunications and tourism and construction whereas the share of FDI being invested in
manufacturing sectors has been comparatively low and FDI in high tech services has been inexistent. This
implies that the export sectors in the MENA region have not been competitive and attractive for FDI and
that FDI is not driving MENA exports as it drives them in Eastern Europe and Asia. This is evident in the
specific cases of Egypt and Morocco, which register low levels of regulatory restrictiveness to FDI7 but
which have not been able to attract foreign investments in the manufacturing sector (figure 18 panel B).
Figure 18. Most FDI outside the energy sector is targeted to non-tradable sectors
A. Structure of FDI, cumulative 2000-07, % of GDP B. FDI Regulatory Restrictiveness, 2010 (1=closed, 0=open)
Source: World Bank (2009). From Privilege to Competition: Unlocking Private-led Growth in the Middle East and North Africa and
7 In terms of limits to foreign owned equity in firms, land ownership, international movement of people, etc.

29
OECD (2010) FDI Regulatory Restrictiveness Index
It is worth mentioning, however, that in countries with large populations such as Egypt, FDI is not
necessarily driven by export oriented sectors, given the large size of the domestic market. Furthermore, the
tourism sector is an important source of hard currencies and is highly exposed to international competition;
therefore, although a non-tradable sector, FDI to tourism could be paralleled to FDI in the manufacturing
exporting sector, even more because it is a labour intensive industry.
FDI is expected to decrease in countries suffering political instability
Although FDI forecasts are not available, some evidence points to the expected negative effects that
the current events are having in foreign investors’ sentiment, especially in the affected North African and
Levantine countries. According to Anima Investment Network, the number of FDI projects in the Southern
Mediterranean has decreased by 13%. In particular, both Egypt and Tunisia are expected to have registered
a decrease of 50% in FDI projects during the first quarter of 2011.
Along the same lines, the head of the Egyptian General Authority for Investment and Free Zones
(GAFI) has stated that a 40% decline in FDI for fiscal 2010-2011 is expected and that the original FDI
target, set at US$7 billion in inflows will be missed since the expected actual sum will be only US$4
billion. Similarly, the Tunisian Foreign Investment Promotion Agency (FIPA) has declared that FDI
inflows decreased by 28.8% in the first quarter of 2011. FDI inflows to Tunisia were US$249.5, compared
to US$350.5 in the first quarter of 2010.
Competitiveness, business environments and entrepreneurship in the MENA region
The performance of countries in the MENA region is also diverse in terms of competitiveness and
business environments. An analysis of two well-known rankings in these areas (i.e. the World Economic
Forum’s Global Competitiveness Index and the World Bank’s Doing Business rankings) shows that
performance differs among the three subgroups of countries, with resource rich, labour abundant countries
(except Libya) having the highest levels of competitiveness and the most conducive business environments
in the region. Results among individual countries and within different indicators greatly differ and
therefore the analysis by subgroups presented here should be taken with caution.
GCC countries perform well in terms of competitiveness
The World Economic Forum’s (WEF) ranks 139 economies in terms of competitiveness around 12
pillars in three main areas8. The 2010-2011 WEF Global Competitiveness Index (GCI) assessments reveal
that countries in the GCC are the top regional performers in overall competitiveness, ranking among the
highest 40 economies worldwide, with Qatar, Saudi Arabia and the UAE among the 25 most competitive
economies. The group of resource rich, labour importing countries appears especially strong in terms of
macro-economic environments9 and health and primary education, whereas they rank predictably low in
8 The main areas or sub indexes and their pillars are: basic requirements (institutions, infrastructure, macroeconomic
environment and health and primary education); efficiency enhancers (higher education and training, goods
market efficiency, labour market efficiency, financial market development, technological readiness and
market size); and innovation and sophistication factors (business sophistication and innovation). A detailed
explanation of the pillars, weighting criteria, etc. is available in the WEF Global Competitiveness Report
2010-2011 at www.wefourm.org
9 As explained before, macroeconomic performance among oil rich countries has been volatile given their dependence
on hydrocarbons. The WEF rankings dot not seem to reflect this since they are mostly based on weighting
government budget balances (an area where oil exporting countries are strong), national savings rates,
inflation and interest rates spreads.

30
terms of market size and also in innovation (the latter being an issue for the entire region, except in Qatar,
Saudi Arabia, the UAE and Tunisia, which are found in the upper quartile among all the 139 economies)
(figure 19, panel A).
Resource poor and resource rich, labour abundant countries’ performance is low, except in Tunisia
Tunisia is the only country among resource poor and resource rich, labour abundant countries10
, to be
ranked in the upper quartile of the overall ranking (i.e. 32). The rest of the countries in these two subgroups
are classified comparatively low, from 65th in the case of Jordan to 135
th for Mauritania. Health and
primary education appear to be the areas of strength for these countries, although their results differ at the
individual country level, with Egypt, Morocco and Mauritania below the 90th place (and also Oman and
Libya among resource rich, labour importing countries).
Furthermore, the recently released results of the GCI (World Economic Forum, 2011) indicate that
Tunisia and Egypt dropped considerably in the ranking (13 places in the case of Egypt and eight in
Tunisia). Acording to the WEF’s interpretation, “the drop reflects higher uncertainty in both countries
during the early transition process, as well as heighted public awareness of persiting structural weaknesses,
resulting mainly in poorer assessments of various aspects of public and private institutions and, to a lesser
degree, also of goods and labour markets efficiency”. The WEF notes similar effects in other countries
from North Africa and the Levant, particularly in Jordan, Lebanon and Algeria.
Innovation is the Achilles heel of resource poor and resource rich, labour abundant countries (figure
19, panel A). Tunisia is the only country ranking within the upper quartile (31st), followed by far by Jordan
(68th). The rest of the countries fall well behind.
Similarly, GCC countries11
fare better in the ease of doing business
A similar account is found in terms of the “Ease of Doing Business”, but with more marked nuances
among the three subgroups of countries. Indeed, GCC countries display a far better performance than the
whole region in terms of overall doing business rankings (figure 19, panel B); especially Saudi Arabia,
which ranks 11th in the world classification (of 183 economies). Furthermore, this subgroup fares
especially well in the specific (but perhaps not very elemental) indicator of paying taxes. Actually, all GCC
countries except Bahrain (which ranks 14th), are placed in the first ten spots worldwide. The (simple)
average for the other two MENA subgroups in this same indicator is far below, at 80th for the resource poor
countries and 120th for the resource rich, labour abundant ones.
But GCC countries (and the rest of the MENA region) rank low in other indicators important for
entrepreneurship
GCC countries rankings are less flattering in terms of enforcing contracts, starting a business and
getting credit, the three of them of high importance for entrepreneurship and investment promotion.
Furthermore, in terms of enforcing contracts, the GCC average classification is at a very low 117 (out of
183), with Qatar ranking the highest (95th). Resource poor countries have a better average of 114 in this
indicator (with Tunisia the best placed at 78th) and the oil rich, labour abundant countries averaging 120
(surprisingly, Yemen is the highest ranked in MENA at 34th).
10
The WEF rankings include only Algeria and Syria, therefore the assessment done in this section excludes Iraq and
Yemen.
11 The World Bank’s, Doing Business rankings do not include Libya, the only resource rich, labour importing country
outside the GCC.

31
One of the main issues in the region is access to finance
Access to finance is identified as one of the main issues for enterprises of all sizes and even more for
small firms and entrepreneurs. MENA rankings in the Doing Business’ getting credit indicator are low,
even more in the resource rich, labour abundant and in the resource poor countries (figure 19, panel B).
Along the same lines, the levels of domestic credit to the private sector (as a share of GDP) are also low in
the overall region when compared to the OECD and the East Asia Pacific region (figure 20, panel A).
What is more, the levels of credit have been contracting in recent years in some MENA countries, while at
the same time interest rate spreads (the difference between the deposit and lending interest rates) have
remained high (figure 20, panel B).
Figure 19. There is a need to improve the competitiveness and business environments
A. Competitiveness in the MENA region B. Doing Business in the MENA region
Notes: Panel A. Values of the Global Competitiveness Index (not the rankings). Best performers are closer to the periphery of the circumference. Simple averages. Data do not include the Palestinian Territories, Iraq and Yemen.
Panel B. Rankings. Best performers are closer to the centre of the circumference. The data does not include Libya.
Sources: OECD staff analysis based on World Economic Forum, Global Competitiveness Index, 2010-2011; and World Bank, Doing Business 2011.

32
Figure 20. Access to finance is one of the main issues in the region
A. Domestic credit to the private sector as a % of GDP, 2009 or latest available year
B. Lending-deposit interest rate spreads, 2009 or latest available year
Sources: World Bank, World Development Indicators and IMF, International Finance Statistics and Economist Intelligence Unit
Entrepreneurship performance is lagging in the MENA region
The World Bank Group Entrepreneurship Survey (WBGES) data shows that there is a wide variation
in firm entry density across regions and income groups. High income countries register on average 4 new
firms per 1 000 working age people (15-65 years) followed by Europe and Central Asia with 2.26 and
Latin America and the Caribbean with 1.31 (Klapper & Love, 2010). Certainly, the WGBES database has
the caveat of including only registered corporations (for comparability and feasibility reasons), hence
excluding informal firms, sole proprietorships and partnerships, which are the dominant forms of
entrepreneurship in developing and emerging economies. However, even when compared to other
emerging regions, MENA economies fall behind, with a rate of only 0.63 new entries per 1, 000 active
people, only higher than in Sub-Saharan Africa (figure 21, panel A). Also, although data varies importantly
from country to country and Tunisia and Oman register the highest entry rates in the MENA region with
over 1 entry per 1 000 working age people, the entrepreneurial performance of individual MENA
economies for which data is available seems lower than that of large developed and emerging economies
(figure 21, panel B).
Findings from the Global Entrepreneurship Monitor (GEM) MENA Regional Report 2009 point to the
same issue: " although pursuing entrepreneurial activity is a way of life for millions of citizens" in MENA
countries12
, "their rates of involvement, based on comparisons with other countries participating in the
GEM surveys, are generally lower than might be expected for countries at their level of development"
(GEM, 2010).
Along these lines, a recently launched Global Entrepreneurship and Development Index (Acs &
Autio, 2010), which ranks 71 countries in terms of their performance in the creation of high-growth
12
The MENA countries covered by the GEM’s regional report are Algeria, Jordan, Lebanon, Morocco, Palestine,
Syria and Yemen.

33
enterprises and high- impact entrepreneurship13
, revealed that MENA economies lag behind most
developed and emerging economies. Eight MENA economies were included in the ranking, with the UAE
being the best MENA performer (24th), followed by Saudi Arabia (30
th); Egypt (50
th); Jordan (51
st); Tunisia
(58th); Morocco (59
th); Algeria (61
st); and Syria (68
th).
This evidence suggests that MENA economies need to step up their efforts to provide a more enabling
business environment and promote entrepreneurship and SME development, especially if they are to tackle
the challenges and opportunities posed by growing populations; an expanding labour force; high
unemployment rates, especially among the youth; low female participation in the labour force; poverty and
income distribution; productivity growth; and economic diversification.
Figure 21. Entrepreneurship is lagging at the regional and at the individual country level
Firm entry density by region 2004-2009 averages
Firm entry density in selected economies 2004-2009 averages
Note: Entry density is calculated as the number of newly registered limited-liability firms in the corresponding year as a percentage of the country’s working age population.
Source: The World Bank Group Entrepreneurship Snapshots (November 2010), Finance and Private Sector Research; and Klapper & Love (2010) Entrepreneurship and the Financial Crisis: An overview of the 2010 Entrepreneurship Snapshots (WBGES).
Demographic, human development and gender outlook
Population growth rates in the MENA region, although decreasing, remain among the highest in the
world
In terms of population the MENA region is a varied set of small and medium sized countries and only
one large country (Egypt). The median population size in the region is lower than 6 million and 12 of the
19 MENA countries analysed in this report have populations below 10 million. Furthermore, the resource
rich, labour importing countries are mostly small (with the exception of Saudi Arabia, which has a
medium-sized population of 25 million), together with some oil poor countries (figure 22, panel A). At the
other end, the seven countries with populations of 20 million or more represent over 83% of the MENA
population, with Egypt alone accounting for almost 30%.
13
I.e. entrepreneurship that creates jobs, societal wealth, and improvements in standards of living (Acs & Autio,
2010)

34
But apart from their disparities in terms of population size, all MENA countries have registered high
population growth. Total population in the MENA region has significantly increased during the last
decades, growing from around 109 million (3% of the world total) in 1970 to nearly 200 million (3.75%) in
1990 and almost 300 million (4.4% of the world’s population) in 200914
. And although the pace of growth
has been decelerating from over 3% in 1970-1989 to 2.4% in the 1990s and to 2.1% during the last decade,
the population growth rate is still one of the highest in the world (figure 22, panel B).
Figure 22. Population growth skyrocketed during the last decades and although it has slowed down it continues to be higher than in other regions
A. Population distribution in the MENA region, 2009 B. Population growth by region (index, base 1970 = 0)
Resource poor Resource rich, labour abundant Resource rich, labour importing Source: World Bank, World Development Indicators
The drivers of growth have been high net migration rates in oil rich, labour importing countries and
high rates of natural increase in the overall MENA region
A breakdown of groups of countries reveals that population growth has been especially high among
resource rich, labour importing countries, which by 2009 had over 3.5 times their population in 1970,
compared to an also high 2 times for resource rich, labour abundant countries and 1.3 times for resource
poor countries (figure 23, panel A).
Furthermore, a closer look at the drivers of population growth shows the role played by immigration
in resource rich, labour importing countries and the rates of natural increase (births minus deaths) in all
countries. The panel B on figure 16 shows that net migration (i.e. the difference of immigrants arriving to a
country and emigrants departing per 1 000 population) in resource rich, labour importing countries has
been high, although decreasing and temporarily negative in 1990-199515
. On the other hand, oil poor and
14
When considering the World Bank’s definition of the MENA region (which includes Iran) the figure is nearly 377
million.
15 The migration rate in oil rich, labour importing countries was pushed down importantly by high emigration from
Kuwait in 1990-1995 (61.8 per 1 000 people). At the same time, the migration rate among resource rich,
labour abundant countries was pushed up by high immigration into Yemen over the same period (9.3 per 1
000 population).

35
oil rich, labour abundant countries have registered negative migration rates, except during 1990-1995 in
the case of resource rich, labour abundant countries.
In line with trends in other regions, MENA birth rates have been decreasing importantly during the
last decades. In 1970-1975 there were on average 43.7 births per 1 000 people; by 2005-2010 the average
dropped to 23.7. Death rates have also dropped, from 13.7 per 1 000 people in 1970-1975 to 5 by 2005-
2010. Overall, the rates of natural increase (births minus deaths) have been declining but remain high
among the three groups of countries (figure 23, panel B). Furthermore, the average natural increase rate in
the MENA region remains at around 20, compared to 4.4 in Eastern Asia, -1.6 in Europe and 9.7 in Latin
America. Only sub Sub-Saharan Africa had higher rates, at 21.8.
Figure 23. The drivers of population growth vary among groups of countries
A. By group of countries (index, base 1970 = 0) B. Net migration and natural increase rates
Resource poor Resource rich, labour abundant Resource rich, labour importing Note: Weighted averages (based on population) for net migration and natural increase rates.
Source: World Bank, World Development Indicators and UN, World Population Prospects, Population Database.
High population growth during the past decades has resulted in very young populations across the
region
The expansion of the population in the MENA region during the last decades is reflected in an
overwhelming majority of young people in all countries. The estimated regional median age is around 25
years, ranging from less than 20 years in Iraq, the Palestinian Territories and Yemen to just over 30 in the
GCC countries of Kuwait, Qatar and the UAE (table 6). This represents a younger median age than in other
emerging regions such as Asia (29 years) and Latin America and the Caribbean (27.7); and the developed
countries of Europe (40.2) and North America (36.9), though above that of Sub Saharan Africa (18.6).
Indeed, almost half of the total population in the MENA region is under 25 and the only countries where
the ratio is lower than 40% are the labour importing Gulf countries of Kuwait, Qatar and the UAE.
High population growth has also resulted in high dependency ratios, which average 54.1 in the overall
region. In other words, for each 100 people in working age (15-64 years), there are 48.7 children (0-14
years) and 5.5 elder people (5.5). Again, this is a higher ratio than those of Asia (49), Latin America (53),
Europe (46 –and an old dependency ratio of 24) and North America (49); but lower than the 83 in Sub-
Saharan Africa.

36
Table 6. Population indicators in the MENA region
2010
Country Population younger than 25
Median age Dependency ratio
Resource poor 52.5 23.8 60.4
Djibouti 57.2 21.5 64.0
Egypt 52.3 23.9 58.0
Jordan 54.3 22.8 60.0
Lebanon 42.7 29.2 47.0
Mauritania 59.3 20.1 72.0
Morocco 47.7 26.2 50.0
Palestinian territories 64.4 17.6 90.0
Tunisia 42.1 29.1 42.0
Resource rich, labour abundant
57.2 21.45 67.25
Algeria 47.5 26.2 46.0
Iraq 60.6 19.3 78.0
Syrian Arab Republic 55.3 22.5 61.0
Yemen 65.4 17.8 84.0
Resource rich, labour importing
43.2 27.6 41.3
Bahrain 43.9 28.1 39.0
Kuwait 37.7 30.6 34.0
Libyan Arab Jamahiriya 47.4 26.2 53.0
Oman 51.5 24.3 51.0
Qatar 33.8 30.1 20.0
Saudi Arabia 50.8 24.6 54.0
United Arab Emirates 31.0 31.7 25.0
MENA average 49.7 24.8 54.1
Source: UN World Population Prospects, Population Database
But population growth and the failure of economic growth to “trickle down” to all sectors of society has
led to high unemployment rates, especially among the youth
High unemployment is one of the greatest challenges for the MENA region and, together with the lack
of political and economic freedom has been one of the main drivers of the protests registered in 2011.
Although incomplete and out-dated in many cases, evidence indicates that several MENA countries,
resource rich and poor, suffer from structurally high unemployment, which ranges from 10-12% of the
labour force. And although countries are affected to different extents16
, the phenomenon is mostly
widespread. Figure 24, panel A shows that countries for which data are available have not achieved great
progress since the 1990s. Algeria, the only country which made significant strides in reducing the
unemployment rate, still registers the highest levels, at around 18%. Other countries have seen their
unemployment rates persist during the last two decades. What is more, unemployment among the youth
16
According to the ILO, total unemployment was 1.3% in Kuwait (2006), 0.3% in Qatar (2008) and 4% in the UAE
(2008). However, GCC countries register low native participation in the labour force (Shochat, 2008).

37
(15-24 years) is particularly high, at around 22% for the overall region and at 25% for Egypt and 30% for
Tunisia (figure 24, panel B).
Figure 24. The MENA region registers high unemployment levels, mostly among the youth
A. Average total unemployment rates (% of labour force) B. Youth and total unemployment (2008 or latest)
Source: ILO, LabourStat and IMF (2010), Regional Economic Outlook, Middle East and Central Asia, Oct. 2010.
Persistently high youth unemployment is the result of demographic, economic and structural factors
The very high levels of population growth during the last decades have been translated into a growing
labour force. Indeed, the large numbers of people born during the late 1980s and 1990s have been entering
the labour market during the last years. Overall, the MENA region added almost 15 million people to its
economically active population17
during the 1980s, 20 million during the 1990s and almost 25 million
during the last decade (of which Egypt alone accounted for almost 25%). Furthermore, even if population
growth is expected to continue to decrease, 22.7 million people will enter the economically active
population during this decade (figure 25, panel A).
This represents a daunting challenge for the region, where economic growth has not been enough to
respond to employment demand. The IMF (2010) has estimated that to absorb the currently unemployed
and new entrants into the labour market over the next decade, and assuming that the ratio of jobs created to
economic growth remains constant, annual growth would need to reach 6.5% (which represents a growth
rate 2% higher than the one registered during the last decade). What is more, the challenge is even greater
for resource poor countries, which will need to increase employment by an estimated 18.5 million full-time
positions over the next decade (under current trends only 11 million jobs could be created) (IMF, 2010).
Apart from the youth, educated population is importantly affected by unemployment, which
represents a distinctive phenomenon of the MENA region. Despite significant achievements such as
improving primary school enrolment and youth literacy rates, unemployment tends to increase with
schooling: 15% of those with tertiary education are unemployed in Egypt, Jordan and Tunisia.
17
Economically active population comprises all persons of either sex who furnish the supply of labour for the
production of economic goods and services as defined by the United Nations System of National Accounts
during a specified time-reference period.

38
An often cited factor for high unemployment rates among educated population is the “skills
mismatch”, in which an educational system does not supply the skills and knowledge required to work in
the private sector. This is evidenced by the fact that despite educational progresses, firms surveyed by the
World Bank often identify the lack of suitable skills as an important constraint to hiring.
Figure 25. High unemployment is the result of a number of demographic and economic factors
A. Change in Economic Active Population (millions) B. Share of informal employment in total non-agricultural employment, 2000-2007
Source: ILO, LabourStat and IMF (2010), Regional Economic Outlook, Middle East and Central Asia, Oct. 2010.
Labour market rigidities, which discourage firms from expanding employment even in expansionary
economic periods, also play a role in the high unemployment levels. According to the World Economic
Forum’s Global Competitiveness Report, hiring and firing regulations in resource poor countries are more
restrictive than the average in other emerging and developing countries. And evidence from the World
Bank Enterprise surveys indicates that, worldwide, the share of firms identifying labour regulation as a
major constraint to business is on average greater in resource poor countries (IMF, 2010).
Bloated public sectors, which employ between 25-30% of the labour force, also play a role in
unemployment by crowding out the private sector and by contributing to the skills mismatch. Indeed, the
relatively high salaries paid by the public sector, the perceived job status as compared to an embryonic
private sector, and the safer tenure of government jobs make job seekers to prefer work in the public
sector, hence crowding out the private sector.
Furthermore, research has revealed that labour markets in the agricultural and informal sector tend to
be flexible in terms of wages and job supply; however, those sectors, which represent an important share of
the economy in resource poor countries (figure 25, panel B), do not generally correspond to the aspirations
of highly educated individuals. And finally, the position of the public sector as first employment choice
may create incentives for individuals to search knowledge and skills in areas demanded by that sector,
hence contributing to the dearth of qualified employees demanded by the private sector.
Considerable public investments in women’s education have not translated into comparable
improvements in female labour market outcomes
According to the World Economic Forum’s Global Gender Gap Report (2010), significant progress
has been made in the region to increase women’s educational attainment rates, and over the past decade

39
almost all MENA countries have closed 90% or more of the gender gap in education. However, this has
not been matched with comparable increases in female labour force participation rates. This is widely
considered a missed opportunity for economic growth and development.
The MENA region has on average the lowest female labour force participation rates in the world.
Approximately 33% of working age women join the labour force18
, compared to 56% in low and middle
income countries and 61% in OECD member countries (figure 26, panel A). By way of comparison, 81%
of working age men join the labour force in MENA, which is on par with the OECD member country
average of 80% (figure 26, panel A). Female labour force participation rates vary significantly across the
region. The highest female labour force participation rates are found in Djibouti (64%), Mauritania (61%)
and Qatar (51%).The lowest rates are found in Iraq (15%), West Bank and Gaza (17%) and Yemen (21%)
(figure 26, panel B).
Unemployment is higher among the female population, with considerable variation across the
region
In all countries of the MENA region (with the exception of West Bank and Gaza), women who do
join the labour force have consistently higher unemployment rates than their male counterparts19
. The
gender gap in unemployment is the largest in United Arab Emirates, Saudi Arabia, Kuwait, Yemen and
Egypt, where the female unemployment rate is nearly four times the male unemployment rate (figure 27,
panel B). This indicates that women who seek employment have considerably greater difficulty than men
in becoming employed.
Figure 26. Women’s participation in the labour force remains limited
A. Labour force participation rate, female vs. male (% of total labour force), 2009
B. Labour force participation rate, female (% of female population ages 15-64), 2009
Source: World Bank (2011), GenderStats http://go.worldbank.org/YMPEGXASH0
18
Labour force participation rate refers to the proportion of the working age population (15-64) which is either
employed or seeking employment.
19 The unemployment rate is the proportion the labour force (15 years and older) that is unemployed.

40
Figure 27. The gender gap in unemployment persists
A. Unemployment rate, female vs. male (2008) B. Unemployment rate: ratio of female to male (2008)
Source: ILO (2010) LABORSTA. Based on 2008 data, with the exception of Djibouti (2002), Kuwait (2006), Lebanon (2007) and Tunisia (2005). Data not available for Bahrain, Jordan, Libya, Mauritania, Oman and
Qatarhttp://go.worldbank.org/YMPEGXASH0
Overall economic growth is not keeping up with population growth
Poverty and inequality are issues for resource poor countries and for some resource rich labour
abundant countries. Although data is irregular and in some cases out-dated, evidence suggests that poverty
rates (share of population under US$2 a day) vary greatly from country to country, with Yemen,
Mauritania and Djibouti registering levels of over 40%, which represent more than double the rates of
Egypt and significantly above the levels in Tunisia and Jordan (figure 28, panel A). What is more,
economic growth in the poorest MENA countries has been offset by population expansion, which has
caused GDP per capita growth to lag behind overall economic growth. As shown in figure 28, panel B, the
poorest MENA countries are also the ones with a wider gap in GDP growth and income per capita growth.
Geographical and social disparities in the distribution of wealth are also prevalent
Although lower than in other regions in the world, income inequality in the MENA region is high and
registers levels remarkably similar among resource poor countries. The panel A in figure 29 shows that in
countries for which data is available, the wealthiest 10% of households gets on average 30% of total
income, whereas the poorest 20% receives only 5-8%. But inequality seems more marked in terms of rural
and urban poverty. As shown in the panel B of figure 29, rural poverty rates are twice or more the urban
rates in all countries for which data is available except in Jordan.

41
Figure 28. Overall economic growth is not keeping up with income per capita growth in the poorest countries
A. Poverty headcount ratios (% of population, 2008 or latest)
B. GDP growth rates (2000-2009)
Source: World Bank, World Development Indicators
Figure 29. Poverty is acute in some countries
A. Poverty headcount ratios (% of population, 2008 or latest)
B. Inequality measures, 2007 or latest
Source: World Bank, World Development Indicators

42
CONCLUSIONS
Increased government spending acts as an escape valve for increased social pressures and discontent;
but resource poor countries have a very limited leeway to use it
Hydrocarbon resources and population are defining characteristics among MENA countries. On the
one hand, the resource rich, labour importing countries of the GCC and Libya have vast economic
resources and small populations (except Saudi Arabia, which has a medium-sized population). And despite
the fact that their economic performance follows the swings and turns of oil prices and production, they
enjoy high levels of income per capita (except Libya, which is a middle income country) and relative social
stability (with the notable exception of Libya and, partially, Bahrain). On the other hand, resource poor
countries are economically more diversified but their larger populations and smaller economies lead to
lower levels of income per capita. Somewhere in the middle, resource rich labour abundant countries are
highly dependent on oil, but register levels of income per capita similar to those of resource poor countries.
As a reaction to the current events, many governments in the region, oil rich and poor, have resorted
to relatively fast and uncomplicated counteracting measures such as increasing government expenditure
through expanded employment and pay and generalised subsidies. Although this may work well for
resource rich countries with significant wealth, the case of resource poor countries is different. Those
counteracting measures do not address the main issues affecting the development of a vibrant private
sector. On the contrary, they may even worsen them in the medium term by the means of increasing the
already bloated role of the public sector in the economy and by further deteriorating their already negative
fiscal balances. What is more, untargeted measures are an inefficient use of public resources by benefiting
the entire population without distinguishing needs. Witness the subsidies on petrol, which although benefit
poor and medium income people, also subsidise better off segments of the population possessing more than
a motor vehicle.
The current context of instability and uncertainty serves as a stark reminder of the need to implement
policies and measures for the development a private sector able to generate more and better jobs
All countries in the MENA region need to step-up economic and trade diversification and
competitiveness and promote the development of private enterprise. But the urgency is even greater for
resource poor countries. To achieve this, those countries need to enhance their attractiveness for
investment, including FDI. They also need to promote investment in tradable sectors in order to increase
higher value added exports and strengthen external balances. And addressing infrastructure deficiencies,
promoting the development of skills in line with private sector needs, fostering the development of the
financial sector to ease access to finance and increasing labour market efficiency will certainly be
instrumental in fostering a better environment for businesses.
Such broad measures should be accompanied by the promotion of entrepreneurship and the integration
of women and youth to the economy. This would also help to ease the pressure of expanding labour forces
that add to the already high levels of unemployment.