Megatrends – iShares Thematic ETFs
31
Megatrends – iShares Thematic ETFs Steven Lu, CFA, BlackRock iShares APAC Distribution April 2018 EII0418A-477607-1503167 FOR PROFESSIONAL AND INSTITUTIONAL INVESTORS USE ONLY NOT FOR PUBLIC DISTRIBUTION (PLEASE READ IMPORTANT DISCLOSURES)
Transcript of Megatrends – iShares Thematic ETFs
Megatrends – iShares Thematic ETFs
Steven Lu, CFA, BlackRock iShares APAC Distribution
April 2018
EII0418A-477607-1503167FOR PROFESSIONAL AND INSTITUTIONAL INVESTORS USE ONLY
NOT FOR PUBLIC DISTRIBUTION (PLEASE READ IMPORTANT DISCLOSURES)
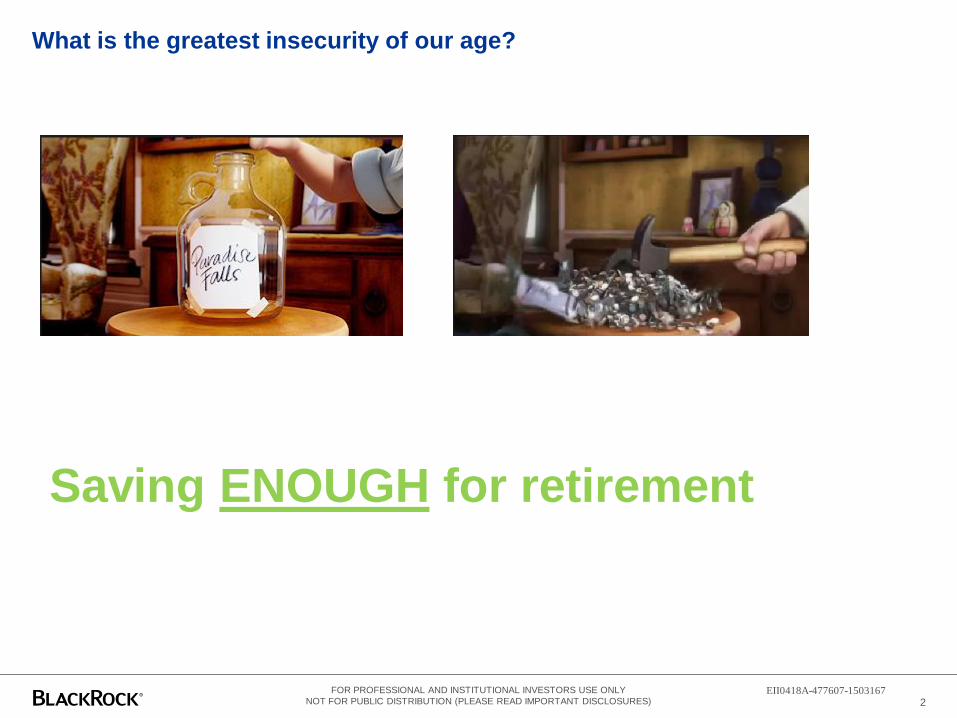
What is the greatest insecurity of our age?
2
Saving ENOUGH for retirement
EII0418A-477607-1503167FOR PROFESSIONAL AND INSTITUTIONAL INVESTORS USE ONLY
NOT FOR PUBLIC DISTRIBUTION (PLEASE READ IMPORTANT DISCLOSURES)
What are Thematic Investments?
EII0418A-477607-1503167

4
Five major megatrends shaping the globe
Shifting
economic
power
Climate change,
resource
scarcity
Rapid
urbanisation
The growing strength
of emerging
economies is
changing the balance
of the global economy.
An expanding global
population is
increasing the demand
for food and water and
putting pressure on
finite resources.
Increasing age and size
of the global population
is fundamentally
changing the needs of
its inhabitants.
A technological
revolution is having a
profound impact on
the global economy.
According to the UN,
by 2030 two thirds of
the world’s population
will reside in cities.*
Demographics
and social
change
Technological
breakthrough
FIVE MAJOR MEGATRENDS
*Source: BlackRock, United Nations World Population Prospects: The 2015 Revision; as of July 2015.
EII0418A-477607-1503167FOR PROFESSIONAL AND INSTITUTIONAL INVESTORS USE ONLY
NOT FOR PUBLIC DISTRIBUTION (PLEASE READ IMPORTANT DISCLOSURES)
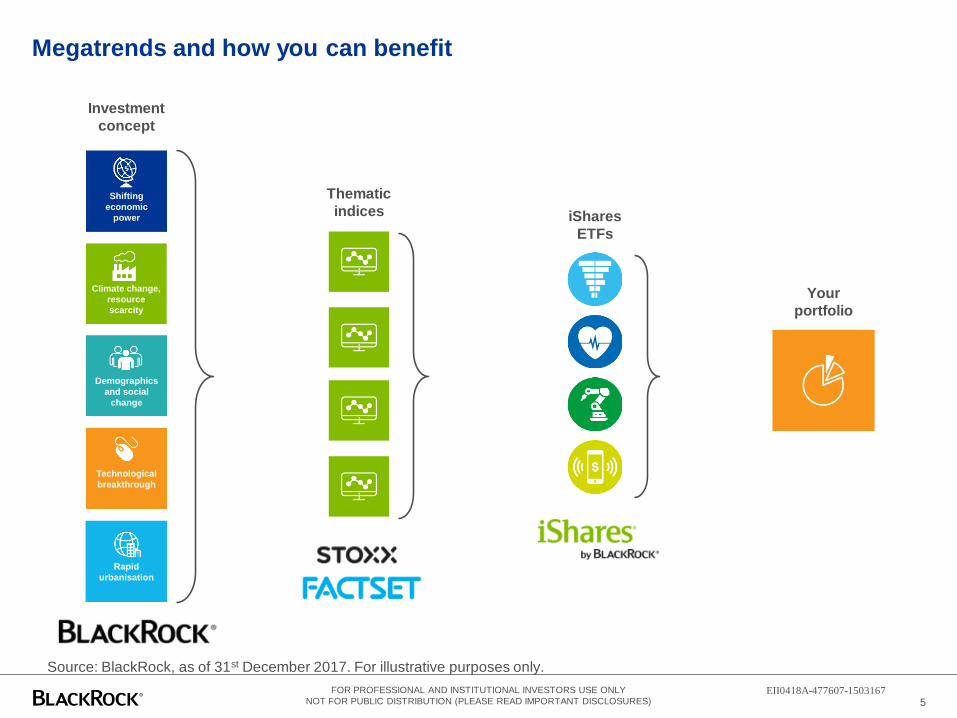
5
Megatrends and how you can benefit
Shifting
economic
power
Climate change,
resource
scarcity
Demographics
and social
change
Technological
breakthrough
Rapid
urbanisation
Investment
concept
Thematic
indices iShares
ETFs
Your
portfolio
Source: BlackRock, as of 31st December 2017. For illustrative purposes only.
EII0418A-477607-1503167FOR PROFESSIONAL AND INSTITUTIONAL INVESTORS USE ONLY
NOT FOR PUBLIC DISTRIBUTION (PLEASE READ IMPORTANT DISCLOSURES)

iShares Thematic ETFsOverview
6
Source: BlackRock, Bloomberg as of 31st March 2018.
ETF Ticker ISIN SEDOL TER AUM ($M) Inception Date
iShares Healthcare Innovation UCITS ETF HEAL IE00BYZK4776 BYZK477 0.40% 256.49 12/09/2016
iShares Ageing Population UCITS ETF AGED IE00BYZK4669 BYZK466 0.40% 210.01 12/09/2016
iShares Digitalisation UCITS ETF DGTL IE00BYZK4883 BYZK488 0.40% 400.47 12/09/2016
iShares Automation & Robotics UCITS ETF RBOT IE00BYZK4552 BYZK455 0.40% 2386.83 12/09/2016
Thematic ETF Information
Source: Bloomberg, BlackRock at 31-Mar-18
DGTL
TER: 0.40%RBOT
TER: 0.40%
-20.0%
-10.0%
0.0%
10.0%
20.0%
30.0%
40.0%
50.0%
2013 2014 2015 2016 2017
Calendar year Performance, 2013-2017
iSTOXX FactSet Breakthrough Healthcare USD Net ReturniSTOXX FactSet Ageing Population USD Net ReturniSTOXX FactSet Digitalisation USD Net ReturniSTOXX FactSet Automation & Robotics USD Net ReturnMSCI ACWI Net Total Return USD Index
The figures shown relate to past performance. Past performance is
not a reliable indicator of current or future results and should not
be the sole factor of consideration when selecting a product or
strategy.
Source: BlackRock, Bloomberg as of 31st December 2017.
AGED
TER: 0.40%HEAL
TER: 0.40%
EII0418A-477607-1503167FOR PROFESSIONAL AND INSTITUTIONAL INVESTORS USE ONLY
NOT FOR PUBLIC DISTRIBUTION (PLEASE READ IMPORTANT DISCLOSURES)

iStoxx Factset Thematic Indices
Methodology Overview and Key Features
EII0418A-477607-1503167

8
Index methodology explainedMove beyond traditional sector classifications
Cielo SA: stock in the iStoxx Factset Digitalisation index
Despite being in the Financials GICS sector, Cielo SA generates over 50% of its revenue
from Electronic Payment Processing putting it squarely in the Digitalisation theme.
• In order to be included in one of the key themes, a company
must generate at least 50% of its revenues from one or
multiple pre-defined sectors
• The index uses the Revere Business Industry Classification
System (RBICS) that classifies a company’s revenues across
six increasingly granular levels, known as ‘hierarchies’
• Each index only incorporates companies with sufficient
revenue levels at a hierarchical depth of 6 –the most granular
level –to ensure the purity of exposure to the digitalisation
sector
Understanding Cielo SA’s
true drivers of return
1. Finance
2. Specialty Finance and Services
3. Specialty Finance
4. Consumer Finance and Services
5. Electronic Transaction and Processing/Clearinghouses
6. Electronic Payment Processing
Source: Stoxx as of December 2017. For illustrative purposes only.
EII0418A-477607-1503167FOR PROFESSIONAL AND INSTITUTIONAL INVESTORS USE ONLY
NOT FOR PUBLIC DISTRIBUTION (PLEASE READ IMPORTANT DISCLOSURES)

9
iStoxx Factset Thematic Indices Construction
3
Screen based on revenues Companies must have at least 50% of their revenue generated from one or more a
pre-defined sector associated with that theme
These sectors use the STOXX Factset Revere Hierarchy methodology that seeks to
provide a more granular way of categorising companies by thematic sector
Stocks must have a minimum market cap of €200M and a minimum €1m 3 month average
daily traded volume
Minimum 80 stock portfolio
Equal-weight
Stocks are equally-weighted, this seeks to ensure a broad exposure to each theme is
provided and the basket is not highly concentrated in certain names
Start with a universe of 8,000 stocks
The Stoxx Global Total Market Index
Includes developed and emerging markets stocks
Includes large, mid and small cap stocks
1
2
Source: Stoxx as of December 2017.
EII0418A-477607-1503167FOR PROFESSIONAL AND INSTITUTIONAL INVESTORS USE ONLY
NOT FOR PUBLIC DISTRIBUTION (PLEASE READ IMPORTANT DISCLOSURES)
iShares Thematic ETFs
RBOT, DGTL, AGED, HEAL
EII0418A-477607-1503167

Meaning this is a truly global theme
0
100
200
300
400
500
600
Number of multipurpose industrial robots per 100,000 employees in the manufacturing industry (2015)
Robots are also infiltrating our everyday lives
0
5000
10000
15000
20000
25000
30000
35000
Household Robots Entertainment & Leisure Robots
Service robots for personalised/domestic use. Unit sales forecast 2016-2019, 2015 and 2016
2014 2015 2016-2019
17,96620,884
24,19226,599
30,700
36,66541,650
46,43151,369
55,32459,470
0
10,000
20,000
30,000
40,000
50,000
60,000
70,000
2006 2007 2008 2009 2010 2011 2012 2013 2014 2015 2016
CN
Y/Y
ear
China Average Yearly Wages In Manufacturing
11
Robots and A.I. have replaced many less-skilled jobs
Automation and RoboticsRise of the machines
Source: BofA Merrill Lynch Global Investment Strategy, IFR, Bloomberg; as of December
2016
But manufacturing wages in EM are increasing
Source: www.tradingeconomics.com, National Bureau of Statistics of China; as of December 2016
Source: International Federation of Robotics as of December 2015 Source: World Robotics 2016; as of December 2016
EII0418A-477607-1503167FOR PROFESSIONAL AND INSTITUTIONAL INVESTORS USE ONLY
NOT FOR PUBLIC DISTRIBUTION (PLEASE READ IMPORTANT DISCLOSURES)
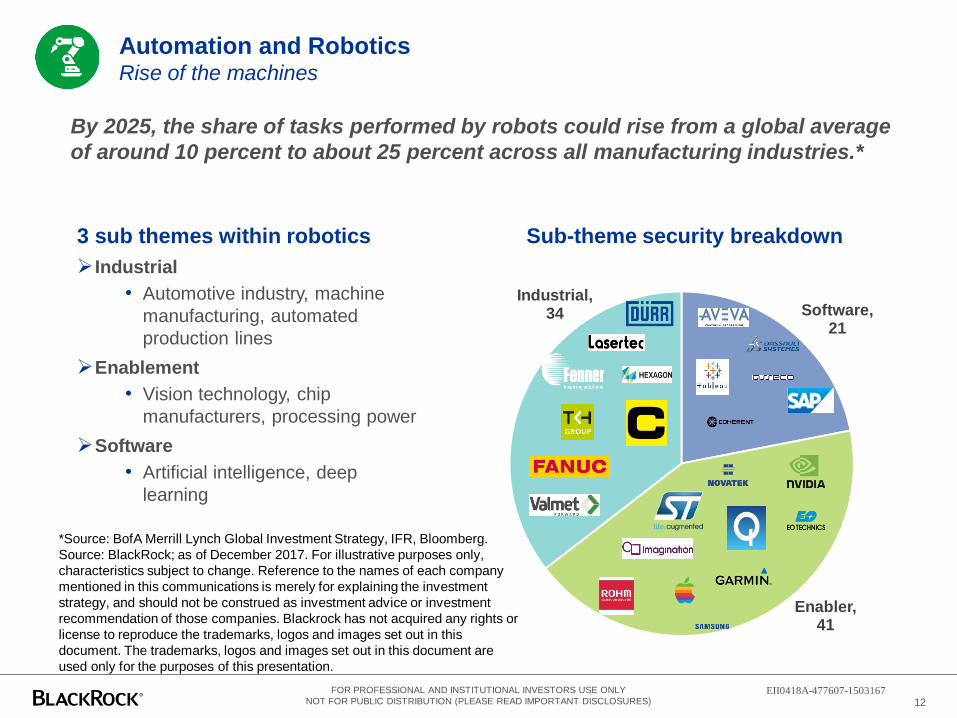
12
Sub-theme security breakdown3 sub themes within robotics
Industrial
• Automotive industry, machine
manufacturing, automated
production lines
Enablement
• Vision technology, chip
manufacturers, processing power
Software
• Artificial intelligence, deep
learning
Automation and RoboticsRise of the machines
By 2025, the share of tasks performed by robots could rise from a global average
of around 10 percent to about 25 percent across all manufacturing industries.*
Software, 21
Enabler, 41
Industrial,34
*Source: BofA Merrill Lynch Global Investment Strategy, IFR, Bloomberg.
Source: BlackRock; as of December 2017. For illustrative purposes only,
characteristics subject to change. Reference to the names of each company
mentioned in this communications is merely for explaining the investment
strategy, and should not be construed as investment advice or investment
recommendation of those companies. Blackrock has not acquired any rights or
license to reproduce the trademarks, logos and images set out in this
document. The trademarks, logos and images set out in this document are
used only for the purposes of this presentation.
EII0418A-477607-1503167FOR PROFESSIONAL AND INSTITUTIONAL INVESTORS USE ONLY
NOT FOR PUBLIC DISTRIBUTION (PLEASE READ IMPORTANT DISCLOSURES)
13
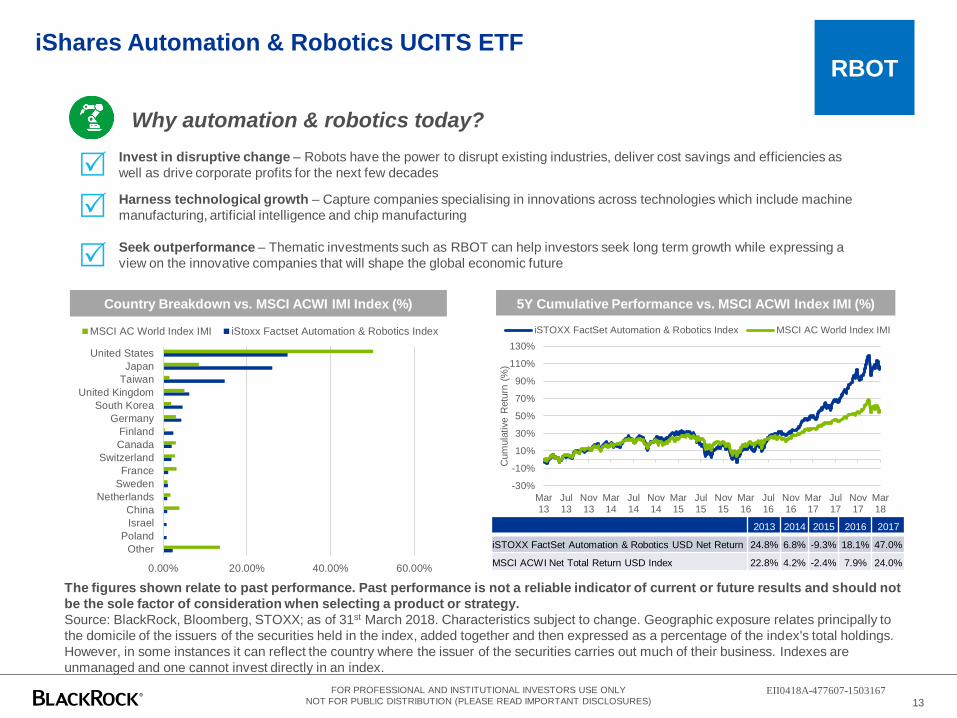
RBOTiShares Automation & Robotics UCITS ETF
Invest in disruptive change – Robots have the power to disrupt existing industries, deliver cost savings and efficiencies as
well as drive corporate profits for the next few decades
Harness technological growth – Capture companies specialising in innovations across technologies which include machine
manufacturing, artificial intelligence and chip manufacturing
Seek outperformance – Thematic investments such as RBOT can help investors seek long term growth while expressing a
view on the innovative companies that will shape the global economic future
R
R
R
Why automation & robotics today?
5Y Cumulative Performance vs. MSCI ACWI Index IMI (%)Country Breakdown vs. MSCI ACWI IMI Index (%)
The figures shown relate to past performance. Past performance is not a reliable indicator of current or future results and should not
be the sole factor of consideration when selecting a product or strategy.
Source: BlackRock, Bloomberg, STOXX; as of 31st March 2018. Characteristics subject to change. Geographic exposure relates principally to
the domicile of the issuers of the securities held in the index, added together and then expressed as a percentage of the index's total holdings.
However, in some instances it can reflect the country where the issuer of the securities carries out much of their business. Indexes are
unmanaged and one cannot invest directly in an index.
2013 2014 2015 2016 2017
iSTOXX FactSet Automation & Robotics USD Net Return 24.8% 6.8% -9.3% 18.1% 47.0%
MSCI ACWI Net Total Return USD Index 22.8% 4.2% -2.4% 7.9% 24.0%
-30%
-10%
10%
30%
50%
70%
90%
110%
130%
Mar13
Jul13
Nov13
Mar14
Jul14
Nov14
Mar15
Jul15
Nov15
Mar16
Jul16
Nov16
Mar17
Jul17
Nov17
Mar18
Cum
ula
tive R
etu
rn (
%)
iSTOXX FactSet Automation & Robotics Index MSCI AC World Index IMI
0.00% 20.00% 40.00% 60.00%
Other
Poland
Israel
China
Netherlands
Sweden
France
Switzerland
Canada
Finland
Germany
South Korea
United Kingdom
Taiwan
Japan
United States
MSCI AC World Index IMI iStoxx Factset Automation & Robotics Index
EII0418A-477607-1503167FOR PROFESSIONAL AND INSTITUTIONAL INVESTORS USE ONLY
NOT FOR PUBLIC DISTRIBUTION (PLEASE READ IMPORTANT DISCLOSURES)

Digitalisation
EII0418A-477607-1503167
15
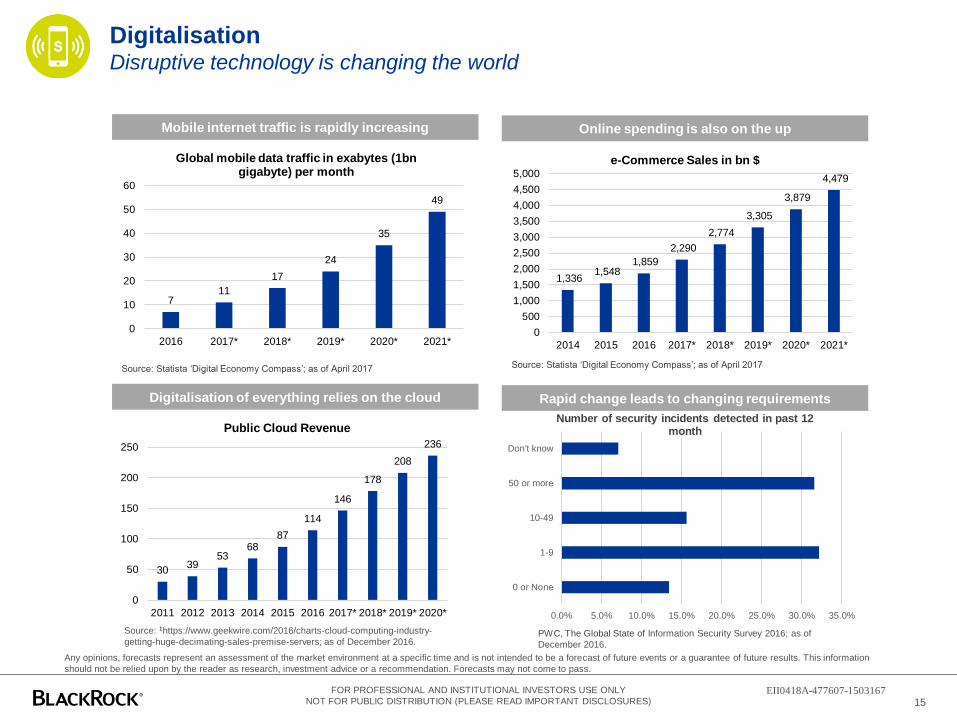
DigitalisationDisruptive technology is changing the world
Mobile internet traffic is rapidly increasing
711
17
24
35
49
0
10
20
30
40
50
60
2016 2017* 2018* 2019* 2020* 2021*
Global mobile data traffic in exabytes (1bn gigabyte) per month
Source: Statista ‘Digital Economy Compass’; as of April 2017
1,336 1,548
1,859
2,290
2,774
3,305
3,879
4,479
0
500
1,000
1,500
2,000
2,500
3,000
3,500
4,000
4,500
5,000
2014 2015 2016 2017* 2018* 2019* 2020* 2021*
e-Commerce Sales in bn $
Online spending is also on the up
0.0% 5.0% 10.0% 15.0% 20.0% 25.0% 30.0% 35.0%
0 or None
1-9
10-49
50 or more
Don't know
Number of security incidents detected in past 12 month
Source: Statista ‘Digital Economy Compass’; as of April 2017
PWC, The Global State of Information Security Survey 2016; as of
December 2016.
.
3039
5368
87
114
146
178
208
236
0
50
100
150
200
250
2011 2012 2013 2014 2015 2016 2017* 2018* 2019* 2020*
Public Cloud Revenue
Digitalisation of everything relies on the cloud Rapid change leads to changing requirements
Source: 1https://www.geekwire.com/2016/charts-cloud-computing-industry-
getting-huge-decimating-sales-premise-servers; as of December 2016.
Any opinions, forecasts represent an assessment of the market environment at a specific time and is not intended to be a forecast of future events or a guarantee of future results. This information
should not be relied upon by the reader as research, investment advice or a recommendation. Forecasts may not come to pass.
EII0418A-477607-1503167FOR PROFESSIONAL AND INSTITUTIONAL INVESTORS USE ONLY
NOT FOR PUBLIC DISTRIBUTION (PLEASE READ IMPORTANT DISCLOSURES)

Source: Factset, Stoxx, BlackRock; as of December 2017. For illustrative
purposes only, characteristics subject to change. Reference to the names of
each company mentioned in this communications is merely for explaining the
investment strategy, and should not be construed as investment advice or
investment recommendation of those companies. Blackrock has not acquired
any rights or license to reproduce the trademarks, logos and images set out in
this document. The trademarks, logos and images set out in this document are
used only for the purposes of this presentation.
16
Digitalisers,45
eCommerce, 36
Communication, 26
3 sub themes within digitalisation
Communication
• Social media, instant messaging,
cloud computing
Digitalisers
• Entertainment, industry disruption,
FinTech, cyber security
eCommerce
• Internet shopping, payment
processing, delivery
Sub-theme security breakdown
The digital economy is displacing established business models, shaking up
industries and creating entirely new industries.
iShares Digitalisation UCITS ETFDisruptive technology is changing the world
EII0418A-477607-1503167FOR PROFESSIONAL AND INSTITUTIONAL INVESTORS USE ONLY
NOT FOR PUBLIC DISTRIBUTION (PLEASE READ IMPORTANT DISCLOSURES)

17
DGTL
iShares Digitalisation UCITS ETFDisruptive technology is changing the world
Invest in the digital economy – Invest in sectors such as financial technology, cybersecurity, and cloud computing
that are transforming global markets today and have the potential to shape the world economy in the future.
Diversification – Gain diversified, global exposure to companies that offer digitally focused services and stand to
benefit from the growth of a digitally connected society.
Future growth potential – Given the global coverage and long-term nature of the trends underpinning DGTL,
investors may consider using it as a satellite component or strategic tilt within a global portfolio.
R
R
R
Why digitalisation today?
Country Breakdown vs. MSCI ACWI Index IMI (%) Cumulative Performance vs. MSCI ACWI Index IMI (%)
2013 2014 2015 2016 2017
iSTOXX FactSet Digitalisation USD Net Return 41.7% 0.1% 2.7% 3.8% 27.9%
MSCI ACWI Net Total Return USD Index 22.8% 4.2% -2.4% 7.9% 24.0%
The figures shown relate to past performance. Past performance is not a reliable indicator of current or future results and should not
be the sole factor of consideration when selecting a product or strategy.
Source: BlackRock, Bloomberg, STOXX; as of 31st March 2018. Characteristics subject to change. Geographic exposure relates principally to
the domicile of the issuers of the securities held in the index, added together and then expressed as a percentage of the index's total holdings.
However, in some instances it can reflect the country where the issuer of the securities carries out much of their business. Indexes are
unmanaged and one cannot invest directly in an index.
-30%
-10%
10%
30%
50%
70%
90%
110%
Mar13
Jul13
Nov13
Mar14
Jul14
Nov14
Mar15
Jul15
Nov15
Mar16
Jul16
Nov16
Mar17
Jul17
Nov17
Mar18
Cum
ula
tive R
etu
rn (
%)
iSTOXX FactSet Digitalisation Index MSCI AC World Index IMI
0.00% 10.00% 20.00% 30.00% 40.00% 50.00% 60.00%
Other
Singapore
Switzerland
Canada
Italy
Taiwan
India
France
China
Brazil
Australia
South Korea
Germany
United Kingdom
Japan
United States
MSCI AC World Index IMI iStoxx Factset Digitalisation Index
EII0418A-477607-1503167FOR PROFESSIONAL AND INSTITUTIONAL INVESTORS USE ONLY
NOT FOR PUBLIC DISTRIBUTION (PLEASE READ IMPORTANT DISCLOSURES)
Healthcare innovation
EII0418A-477607-1503167

19
Breakthrough healthcareHEAL the world
Spending on healthcare is set to balloon
Source: World Population Prospects: The 2015 revisions; as of July 2015.
*Estimated figure.
3.0%
8.0%
10.5%
20.0%
0.0%
5.0%
10.0%
15.0%
20.0%
25.0%
1950 2000 2013 2040*
Forecast share of global GDP spent on healthcare
Medical devices market is set to expand rapidly
339.5360.8
386.1412.8
435.8
0
50
100
150
200
250
300
350
400
450
500
2016 2017e 2018e 2019e 2020e
US
D B
n
Medical Devices Market: Forecast for growth
Source: http://trade.gov/topmarkets/pdf/Medical_Devices_Executive_Summary.pdf;
as of September 2016.
Opportunities broadening for patients in the US Digital advancement transforming Chinese healthcare
3
110
$0B
$20B
$40B
$60B
$80B
$100B
$120B
2014 2020
The size of China's digital healthcare market ($bn)
Source: BCG Perspectives: China’s Digital Health-Care Revolution; as of September 2015.Source: Bain, Front of Line Healthcare Report 2015; as of 2015.
52
59
63
62
68
75
81
81
86
93
95
97
Telemedicine
Remote patient monitoring
Patients adherence initiatives
Transparency initatives
Compative effectiveness data
Predictive analytics
Wellness programs
Care coordinators
Phyisican extenders
Electonic medical records
Standard treatment protocols
Electronic access to treatment protocols
New clinical tools & practices adopted and forecast in the US healthcare industry2
Use now Expected use in 2 years
Any opinions, forecasts represent an assessment of the market environment at a specific time and is not intended to be a forecast of future events or a guarantee of future results. This information
should not be relied upon by the reader as research, investment advice or a recommendation. Forecasts may not come to pass.
Mark
et
siz
e
EII0418A-477607-1503167FOR PROFESSIONAL AND INSTITUTIONAL INVESTORS USE ONLY
NOT FOR PUBLIC DISTRIBUTION (PLEASE READ IMPORTANT DISCLOSURES)

Source: McKinsey Quarterly Review, health care costs: a market-based view
Source: Factset, Stoxx, BlackRock as of December 2017. For illustrative
purposes only, characteristics subject to change. Reference to the names of
each company mentioned in this communications is merely for explaining the
investment strategy, and should not be construed as investment advice or
investment recommendation of those companies.
20
Biotech, 40
Devices,24
Services,21
3 sub themes within healthcare innovation:
Biotech
• Chronic diseases, genetic sequencing,
antibody innovation
Devices
• Medical robotics, cardiology, oncology,
Services
• Software, outsourcing, interface
Healthcare InnovationHEAL the world
Sub-theme security breakdown:
If current trends persist to 2050, most developed countries will spend more
than a fifth of GDP on health care. The U.S. and Switzerland are projected to
spend half of their GDP on healthcare within the next 50 years
EII0418A-477607-1503167FOR PROFESSIONAL AND INSTITUTIONAL INVESTORS USE ONLY
NOT FOR PUBLIC DISTRIBUTION (PLEASE READ IMPORTANT DISCLOSURES)

21
HEAL
iShares Healthcare Innovation UCITS ETFHEAL the world
Country Breakdown vs. MSCI ACWI IMI Index (%)
Shifting demographics – As health services around the world face rising demand from an ageing population, more
efficient and effective ways of delivering treatment and care are likely to be needed
Diversification – HEAL provides access to the healthcare innovation theme on a global basis and can complement a
traditional equity exposure by diversifying a portfolio’s drivers of return
Performance – Thematic investments are designed to provide exposure to long-term growth and HEAL’s benchmark
has outperformed the broader MSCI ACI IMI Index over the past five years.
R
R
R
Why healthcare innovation today?
Cumulative Performance vs. MSCI ACWI IMI Index (%)
2013 2014 2015 2016 2017
iSTOXX FactSet Breakthrough Healthcare USD Net Return 28.7% 12.6% 27.6% -6.7% 35.4%
MSCI ACWI Net Total Return USD Index 22.8% 4.2% -2.4% 7.9% 24.0%
The figures shown relate to past performance. Past performance is not a reliable indicator of current or future results and should not
be the sole factor of consideration when selecting a product or strategy.
Source: BlackRock, Bloomberg, STOXX; as of 31st March 2018. Characteristics subject to change. Geographic exposure relates principally to
the domicile of the issuers of the securities held in the index, added together and then expressed as a percentage of the index's total holdings.
However, in some instances it can reflect the country where the issuer of the securities carries out much of their business. Indexes are
unmanaged and one cannot invest directly in an index.
-30%
20%
70%
120%
170%
Mar13
Jul13
Nov13
Mar14
Jul14
Nov14
Mar15
Jul15
Nov15
Mar16
Jul16
Nov16
Mar17
Jul17
Nov17
Mar18
Cum
ula
tive R
etu
rn (
%)
iSTOXX FactSet Breakthrough Healthcare Index MSCI AC World Index IMI
0.00% 20.00% 40.00% 60.00%
Other
Sweden
France
United Kingdom
Hong Kong
China
Taiwan
Switzerland
Denmark
Ireland
Australia
India
Belgium
Japan
South Korea
United States
MSCI AC World Index IMI iStoxx Factset Healthcare Innovation Index
EII0418A-477607-1503167FOR PROFESSIONAL AND INSTITUTIONAL INVESTORS USE ONLY
NOT FOR PUBLIC DISTRIBUTION (PLEASE READ IMPORTANT DISCLOSURES)

Ageing Population
EII0418A-477607-1503167

23
Ageing is not just a first world problemThe proportion of elderly people is rapidly increasing
Ageing populationThe longevity revolution
The elderly will dominate global consumption growth
-
20,000
40,000
60,000
80,000
100,000
120,000
140,000
Popula
tio
n('00
0)s
Top ten countries with population over 80 in 2015 vs. 2050
2015 2050
14
10
23
35
41
47
55
0
10
20
30
40
50
60
2015 2020 2025 2030 2035 2040 2045 2050
# C
ountr
ies
Number of countries with >30% population aged over 60,
2015-2050
Source: United Nations World Population Prospects: The 2015 Revision; as of July 2015.
Retiring and elderly (DM only)
China (15-59 yrs)
North America (15-59 yrs)
China (15-59 yrs)
Latin America (15-59 yrs)
South Asia (15-59 yrs)
Southeast Asia (15-59 yrs)
Western Europe (15-59 yrs)
Northeast Asia (15-59 yrs)
Other groups 19%
18%
10%10%
10%
5%
5%
3%
3%
2%
25%
Share of global
urban
consumption
growth 2015-2030
Healthcare costs accelerate with age
Source:
Source: McKinsey Global Institute Cityscope; National Transfer Accounts Project;
McKinsey Global Institute analysis; as of April 2016.Source: McKinsey Global Institute Cityscope; as of April 2016. Numbers may not add up
to 100% due to rounding.
EII0418A-477607-1503167FOR PROFESSIONAL AND INSTITUTIONAL INVESTORS USE ONLY
NOT FOR PUBLIC DISTRIBUTION (PLEASE READ IMPORTANT DISCLOSURES)

*Source: Oxford Economics; as of September 2016. Source: Factset, Stoxx,
BlackRock; as of December 2017. For illustrative purposes only,
characteristics subject to change. Reference to the names of each company
mentioned in this communications is merely for explaining the investment
strategy, and should not be construed as investment advice or investment
recommendation of those companies. Blackrock has not acquired any rights
or license to reproduce the trademarks, logos and images set out in this
document. The trademarks, logos and images set out in this document are
used only for the purposes of this presentation.
24
Ageing population
The longevity revolution
4 sub themes within an ageing population:
Healthcare
• Chronic diseases, biotech, geriatric devices
Ageing care
• Retirement villages, specialist care facilities
Consumer
• Travel, leisure
Financials
• Pensions, asset managers, life insurance
Ageing Care, 58
Consumer, 28
Financials, 103
Healthcare,56
Sub-theme security breakdown
The global population is undergoing a paradigm shift as people are living longer
and reproducing less. The current skew towards the young will be largely eroded
over the next 30 years.*
EII0418A-477607-1503167FOR PROFESSIONAL AND INSTITUTIONAL INVESTORS USE ONLY
NOT FOR PUBLIC DISTRIBUTION (PLEASE READ IMPORTANT DISCLOSURES)

25
AGEDiShares Ageing Population UCITS ETF
Shifting demographics – As people are living longer, society will be forced to make rapid investments into medical
devices and technology to account for a significantly older population.
Diversification – Directly investing in companies that will benefit from an ageing population can complement an existing
equity strategy and diversify a global portfolio.
Long-term performance – Unprecedented increases in human longevity are also creating stores of investment
opportunity. AGED provides a tool to invest in this trend and seek long-term growth while providing portfolio
diversification.
R
R
R
Why ageing population today?
Cumulative Performance vs. MSCI ACWI IMI Index (%)Country Breakdown vs. MSCI ACWI IMI Index (%)
The figures shown relate to past performance. Past performance is not a reliable indicator of current or future results and should not
be the sole factor of consideration when selecting a product or strategy.
Source: BlackRock, Bloomberg, STOXX; as of 31st March 2018. Characteristics subject to change. Geographic exposure relates principally to
the domicile of the issuers of the securities held in the index, added together and then expressed as a percentage of the index's total holdings.
However, in some instances it can reflect the country where the issuer of the securities carries out much of their business. Indexes are
unmanaged and one cannot invest directly in an index.
2013 2014 2015 2016 2017
iSTOXX FactSet Ageing Population USD Net Return 32.7% 9.0% 5.3% 2.6% 21.7%
MSCI ACWI Net Total Return USD Index 22.8% 4.2% -2.4% 7.9% 24.0%
-30%
-10%
10%
30%
50%
70%
90%
110%
130%
Mar13
Jul13
Nov13
Mar14
Jul14
Nov14
Mar15
Jul15
Nov15
Mar16
Jul16
Nov16
Mar17
Jul17
Nov17
Mar18
iSTOXX FactSet Ageing Population Index MSCI ACWI Index IMI
0.0% 10.0% 20.0% 30.0% 40.0% 50.0% 60.0%
Other
Israel
Brazil
Germany
Switzerland
Thailand
Taiwan
France
South Africa
China
Canada
South Korea
United Kingdom
Australia
Japan
United States
MSCI ACWI Index IMI iStoxx Factset Ageing Population Index
EII0418A-477607-1503167FOR PROFESSIONAL AND INSTITUTIONAL INVESTORS USE ONLY
NOT FOR PUBLIC DISTRIBUTION (PLEASE READ IMPORTANT DISCLOSURES)

How to Implement in client portfolios
EII0418A-477607-1503167
Robotics and
Automation
(103 stocks)
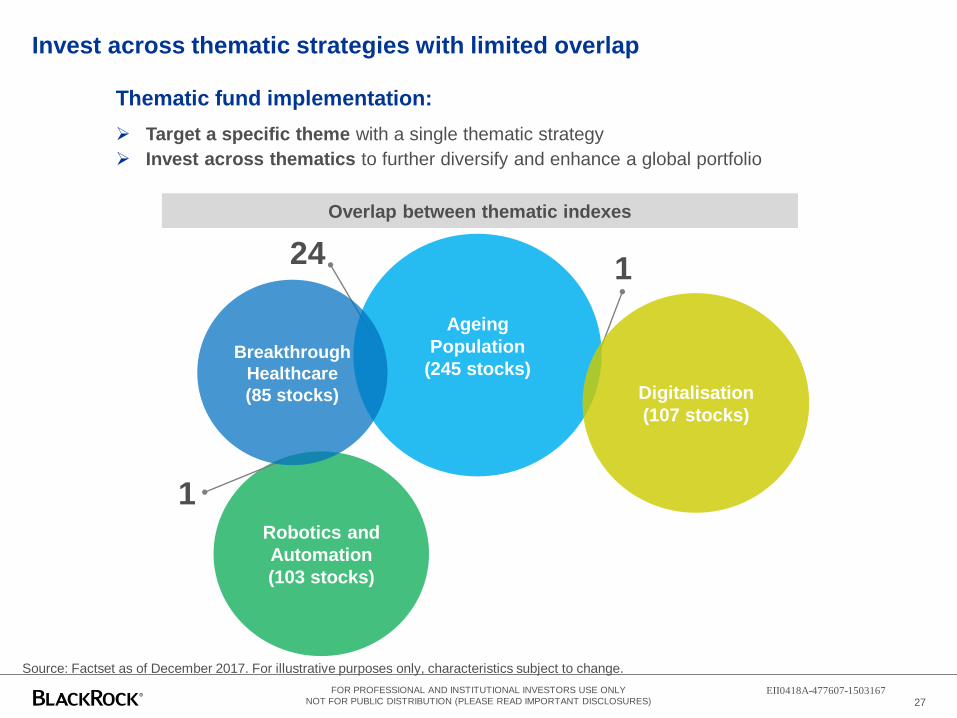
Invest across thematic strategies with limited overlap
Source: Factset as of December 2017. For illustrative purposes only, characteristics subject to change.
27
Overlap between thematic indexes
Thematic fund implementation:
Target a specific theme with a single thematic strategy
Invest across thematics to further diversify and enhance a global portfolio
Ageing
Population
(245 stocks)
Digitalisation
(107 stocks)
24
Breakthrough
Healthcare
(85 stocks)
1
1
EII0418A-477607-1503167FOR PROFESSIONAL AND INSTITUTIONAL INVESTORS USE ONLY
NOT FOR PUBLIC DISTRIBUTION (PLEASE READ IMPORTANT DISCLOSURES)

Thematic correlations to broad equities
28
Correlations to Broad Equities
Source: BlackRock. Periods used: 03/11/2014 – 31/12/2017 Currency: GBP. Frequency: Monthly. The figures shown relate to past
performance. Past performance is not a reliable indicator of current or future results and should not be the sole factor of
consideration when selecting a product or strategy. BlackRock makes no representations or warranties as to the accuracy or
completeness of any past, estimated or simulated performance results contained herein, and further nothing contained herein shall
be relied upon as a promise by, or representation by BlackRock whether as to past or future performance results. Analysis has been
run on index level. It is not possible to invest directly in an index. The return of your investment may increase or decrease as a result
of currency fluctuations.
Diversification benefits within an equity portfolio
The funds can be utilized within the Equities allocation of a portfolio when seeking diversification benefits, with correlations
against most major Equity indices under 90%.
Historically, HEAL has exhibited the lowest long term correlation to broad equity markets
RBOT HEAL DGTL AGED
RBOT 1 0.69 0.88 0.81
HEAL 0.69 1 0.77 0.83
DGTL 0.88 0.77 1 0.91
AGED 0.81 0.83 0.91 1
MSCI World 0.86 0.75 0.92 0.94
FTSE All Share Index 0.70 0.58 0.74 0.73
MSCI Europe ex UK Index 0.71 0.65 0.72 0.75
MSCI Pacific ex Japan Index 0.72 0.61 0.77 0.84
MSCI EM Index 0.80 0.55 0.78 0.79
EII0418A-477607-1503167FOR PROFESSIONAL AND INSTITUTIONAL INVESTORS USE ONLY
NOT FOR PUBLIC DISTRIBUTION (PLEASE READ IMPORTANT DISCLOSURES)

Case study 1: adding thematic ETFs to a simulated portfolioFitting each of the 4 ETFs individually into the Equity allocation of the Starting Portfolio
29
*Starting Portfolio contains hypothetical portfolio holdings for a GBP investor and may not be representative of the client’s
investment, thus, the results of the analysis presented may vary. If you would like to explore solutions with your specific portfolio
and in your base currency, please contact your BlackRock Sales representative and ask for a BPAS consultation. The
information contained in this communication is derived from proprietary and non-proprietary sources considered by BlackRock
to be reliable, but is not necessarily all inclusive, is not guaranteed as to accuracy and may be subject to change. Reliance upon
information in this communication is at the sole discretion of the recipient. You should seek independent investment, legal and
tax advice prior to taking any investment decision.
Starting
Portfolio
Solution with
HEAL
Solution with
RBOT
Solution with
DGTL
Solution with
AGED
Solution with
All
Total Equity 45% 45% 45% 45% 45% 45%
Broad Equities 45% 35% 35% 35% 35% 35%
HEAL - 10% - - - 2.5%
RBOT - - 10% - - 2.5%
DGTL - - - 10% - 2.5%
AGED - - - 10% 2.5%
45%
35%
10%
10%
Equity Fixed Income Alternatives Cash
Starting Portfolio*
Consider allocating
Thematic ETFs within
the Equity allocation
Equity: FTSE All Share Index (13%), MSCI Europe ex UK Index
(13%), MSCI World Index (16%), MSCI Pacific Index (1%), MSCI
EM Index (2%). Fixed Income: Bloomberg Barclays Euro Agg
Index (20%), Bloomberg Barclays Global Agg Index (10%), JP
Morgan EMBI Global Core Index (5%). Alternatives: FTSE
EPRA/NAREIT Developed Dividend+ Index (5%), HFRX Global
Hedge Fund Index (5%).
EII0418A-477607-1503167FOR PROFESSIONAL AND INSTITUTIONAL INVESTORS USE ONLY
NOT FOR PUBLIC DISTRIBUTION (PLEASE READ IMPORTANT DISCLOSURES)

Case study 1: adding thematic ETFs to a simulated portfolioEnhancement of the portfolio’s risk-return characteristics
30
Risk-Return Spectrum Sharpe Ratio
The figures shown relate to simulated past performance. Past performance is not a reliable indicator of current or future results
and should not be the sole factor of consideration when selecting a product or strategy.
Source: BlackRock. Periods used: 03/11/2014 – 31/12/2017 Currency: GBP. Frequency: Monthly.
BlackRock makes no representations or warranties as to the accuracy or completeness of any past, estimated or simulated performance
results contained herein, and further nothing contained herein shall be relied upon as a promise by, or representation by BlackRock
whether as to past or future performance results.
The return of your investment may increase or decrease as a result of currency fluctuations.
Enhanced risk-return characteristics:
All portfolio solutions demonstrate an improvement in risk-return characteristics compared to the Starting Portfolio.
Whilst all portfolio solutions show improved Sharpe ratio compared to the Starting Portfolio, Solution with HEAL shows highest
improvement in Sharpe ratio.
Varying factor exposures can be seen in factors such as Momentum, Value and Growth, whilst all solutions show reduction in Volatility
and Leverage compared to the Starting Portfolio.
Equity Style Factor Exposures
FOR PROFESSIONAL AND INSTITUTIONAL INVESTORS USE ONLY
NOT FOR PUBLIC DISTRIBUTION (PLEASE READ IMPORTANT DISCLOSURES)
-1 -0.5 0 0.5 1
Size
Volatility
Momentum
Value
Profitability
Dividend Yield
Growth
Leverage
Starting Portfolio Solution with HEALSolution with RBOT Solution with DGTLSolution with AGED
1.05 1.1 1.15 1.2 1.25 1.3 1.35
Solution with AGED
Solution with DGTL
Solution with RBOT
Solution with HEAL
Starting Portfolio
9.00
9.25
9.50
9.75
10.00
10.25
10.50
10.75
11.00
7 7.2 7.4 7.6 7.8 8
Annualis
d R
etu
rns (
%)
Annualised Risk (%)
Solution with AGED Solution with DGTL Solution with RBOT
Solution with HEAL Starting Portfolio
EII0418A-477607-1503167

FOR PROFESSIONAL AND INSTITUTIONAL INVESTORS USE ONLY
NOT FOR PUBLIC DISTRIBUTION (PLEASE READ IMPORTANT DISCLOSURES)
Disclaimer
31
This material is prepared by BlackRock for informational or educational purposes only. This is prepared
for professional and institutional investors only and does not constitute an offer or solicitation to
purchase or sell in any securities or iShares Funds, nor shall any securities or units be offered or sold to
any person in any jurisdiction in which an offer, solicitation, purchase or sale would be unlawful under
the securities laws of such jurisdiction.
There are risks associated with investing, including loss of principal. The value of investments involving
exposure to foreign currencies can be affected by exchange rate movements. Investment in emerging
market countries may involve heightened risks such as increased volatility and lower trading volume,
and may be subject to a greater risk of loss than investments in a developed country. The use of
synthetic instruments such as derivatives may create exposure to market counterparty risk. The listing of
units of the fund on a stock exchange does not guarantee a liquid market for the units. Transactions in
units of the fund will result in brokerage commissions. You are reminded to refer to the relevant
prospectus for specific risk considerations which are available from BlackRock or the iShares websites.
Past performance is not indicative of future performance and is no guide to future returns. BlackRock
does not guarantee the performance of the shares or units of the iShares Funds. Before deciding to
invest, investors should read the prospectus carefully including the investment objective and risk factors
relating to the fund, including the arrangement in the event the fund is delisted. Index returns are for
illustrative purposes only and do not represent actual iShares Fund performance. Index performance
returns do not reflect any management fees, transaction costs or expenses. Investors should note that
the fund differs from a typical unit trust as units or shares of the Funds are bought and sold at market
price (not NAV) and units may only be redeemed by a participating dealer in large creation/ redemption
unit sizes. The listing of units of the fund on a stock exchange does not guarantee a liquid market for the
units. Indexes are unmanaged and one cannot invest directly in an index. This material contains general
information only and is not intended to represent general or specific investment advice.
This material may contain “forward-looking” information that is not purely historical in nature. Such
information may include, among other things, projections, forecasts, estimates of yields or returns. This
material is not intended to be relied upon as a forecast, research or investment advice, and is not a
recommendation, offer or solicitation to buy or sell any securities or to adopt any investment strategy.
The opinions expressed are as of the day of distribution and may change as subsequent conditions vary.
The information and opinions contained in this material are derived from proprietary and nonproprietary
sources deemed by BlackRock to be reliable, are not necessarily all-inclusive and are not guaranteed as
to accuracy. There is no guarantee that any forecasts made will come to pass. Reliance upon
information in this material is at the sole discretion of the reader. They do not necessarily reflect the
views of any company in the BlackRock Group or any part thereof and no assurances are made as to
their accuracy. No part of this material may be reproduced, stored in retrieval system or transmitted in
any form or by any means, electronic, mechanical, recording or distributed without the prior written
consent of BlackRock.
BlackRock Fund Advisors (BRFA) serves as the investment adviser to the iShares Funds that are
registered with the United States Securities and Exchange Commission under the Investment Company
Act of 1940. BRFA is a subsidiary of BlackRock Institutional Trust Company, N.A., a subsidiary of
BlackRock Inc. This material does not constitute an offer or solicitation to sell or a solicitation of an offer
to buy any shares of any Funds (nor shall any such shares be offered or sold to any person) in any
jurisdiction in which an offer, solicitation, purchase or sale would be unlawful under the securities law of
that jurisdiction.
iShares Funds are not sponsored, endorsed, issued, sold or promoted by their index providers. For
details of the index provider including any disclaimer, please refer to the relevant iShares Fund offer
document.
For investors in Hong Kong: Issued by BlackRock Asset Management North Asia Limited. This material
is for distribution to “Professional Investors” (as defined in the Securities and Futures Ordinance
(Cap.571 of the laws of Hong Kong) and any rules made under that ordinance.) and should not be relied
upon by any other persons or redistributed to retail clients in Hong Kong. Some of the Funds mentioned
herein have not been registered with the Securities and Futures Commission for offering or distribution
in Hong Kong and may not be offered or sold whether directly or indirectly, to any person in Hong Kong
other than to a Professional Investor (as defined in the Securities and Futures Ordinance (Cap.571 of
the laws of Hong Kong) and any rules made under that ordinance).
For investors in Singapore: Issued by BlackRock (Singapore) Limited (Co. registration no.200010143N)
for institutional investors only as defined in Section 4A of the Securities and Futures Act, Chapter 289 of
Singapore. Some of the funds mentioned herein have not been registered with the Monetary Authority of
Singapore for offering or distribution in Singapore. Accordingly, this information may not be circulated or
distributed, nor may the funds be offered or sold whether directly or indirectly, to any person in
Singapore other than (i) to an institutional investor pursuant to Section 304 of the Securities and Futures
Act (“SFA”) or (ii) otherwise pursuant to and in accordance with the conditions of any other applicable
provision of the SFA. The Fund may use or invest in financial derivatives.
For Investors in Brunei: BlackRock does not hold a Capital Markets Services License and is therefore
not licensed for conducting business in any regulated activity under the Securities Market Order, 2013
(‘Order’). This material has been issued by BlackRock and is intended for the exclusive use of the
recipient. This material and the information herein does not constitute investment, legal, tax or other
advice or any recommendation to buy, or sell or otherwise transact, any of the funds or stocks
mentioned.
The information contained herein may be restricted by law and persons who access it are required to
comply with any such restrictions. The information does not, and is not intended to constitute an
invitation, offer, sale or delivery of shares or other securities or interests in funds. It is for information
purposes only. By reading this you confirm that you are aware of the laws in your own jurisdiction
relating to the provision and sale of funds and related financial services products and you warrant and
represent that you will not pass on or utilise the information contained herein in a manner that could
constitute a breach of such laws by BlackRock, its affiliates or any other person. This material is
intended solely for “Accredited Investors”, “Expert Investors” or “Institutional Investors” as defined under
Securities Market Order 2013. Prospective investors should take appropriate professional advice before
making any investment decision. Investments in the funds must be made solely on the terms of the
relevant prospectus and no reliance should be placed on any other information contained on the material
/website.
For Investors in Indonesia: BlackRock products are not registered under the Indonesian Capital Markets
Law and its implementing regulations, and therefore BlackRock funds will not be offered in any manner
that constitutes or is likely to constitute a public offering of securities under the Indonesian Capital
Markets Law and its implementing regulations.
THIS MATERIAL IS HIGHLY CONFIDENTIAL AND IS NOT TO BE REPRODUCED OR DISTRIBUTED
TO PERSONS OTHER THAN THE RECIPIENT.
iShares® and BlackRock® are registered trademarks of BlackRock, Inc., or its subsidiaries in the United
States and elsewhere. All other trademarks, servicemarks or registered trademarks are the property of
their respective owners.
© 2018 BlackRock Inc. All rights reserved.