Megatrends – iShares Thematic ETFs · • The index uses the Revere Business Industry...
37
Megatrends – iShares Thematic ETFs Rob Powell, CFA FOR PROFESSIONAL CLIENTS/QUALIFIED INVESTORS ONLY April 2018 EII0318E-442750-1399832
-
Upload
trinhxuyen -
Category
Documents
-
view
223 -
download
0
Transcript of Megatrends – iShares Thematic ETFs · • The index uses the Revere Business Industry...
Megatrends – iShares Thematic ETFsRob Powell, CFA
FOR PROFESSIONAL CLIENTS/QUALIFIED INVESTORS ONLY
April 2018
EII0318E-442750-1399832

2
Five major megatrends shaping the globe
Shifting economic
power
Climate change, resource scarcity
Rapid urbanisation
The growing strength of emerging
economies is changing the balance of the global economy.
An expanding global population is
increasing the demand for food and water and
putting pressure on finite resources.
Increasing age and size of the global population
is fundamentally changing the needs of
its inhabitants.
A technological revolution is having a profound impact on the global economy.
According to the UN, by 2030 two thirds of the world’s population will reside in cities.*
Demographics and social
change
Technological breakthrough
FIVE MAJOR MEGATRENDS
FOR PROFESSIONAL CLIENTS/QUALIFIED INVESTORS INVESTORS ONLY
*Source: BlackRock, PWC, United Nations World Population Prospects: The 2015 Revision; as of July 2015.
EII0318E-442750-1399832

3
Megatrends and how you can benefit
FOR PROFESSIONAL CLIENTS/QUALIFIED INVESTORS INVESTORS ONLY
Investment concept
Thematic indices iShares
ETFs
Your portfolio
Source: BlackRock, as of 31st December 2017. For illustrative purposes only.EII0318E-442750-1399832

iShares Thematic ETFsOverview
7
Source: BlackRock, Bloomberg as of 28th February 2018.
FOR PROFESSIONAL CLIENTS/QUALIFIED INVESTORS INVESTORS ONLYEII0318E-442750-1399832

iStoxx Factset Thematic IndicesMethodology Overview and Key Features
EII0318E-442750-1399832

6
Index methodology explainedMove beyond traditional sector classifications
Cielo SA: stock in the iStoxx Factset Digitalisation index Despite being in the Financials GICS sector, Cielo SA generates over 50% of its revenue
from Electronic Payment Processing putting it squarely in the Digitalisation theme.
FOR PROFESSIONAL CLIENTS/QUALIFIED INVESTORS INVESTORS ONLY
• In order to be included in one of the key themes, a company must generate at least 50% of its revenues from one or multiple pre-defined sectors
• The index uses the Revere Business Industry Classification System (RBICS) that classifies a company’s revenues across six increasingly granular levels, known as ‘hierarchies’
• Each index only incorporates companies with sufficient revenue levels at a hierarchical depth of 6 –the most granular level –to ensure the purity of exposure to the digitalisation sector
Understanding Cielo SA’s true drivers of return
1. Finance
2. Specialty Finance and Services
3. Specialty Finance
4. Consumer Finance and Services
5. Electronic Transaction and Processing/Clearinghouses
6. Electronic Payment Processing
Source: Stoxx as of December 2017. For illustrative purposes only.
EII0318E-442750-1399832

7
iStoxx Factset Thematic Indices Construction
3
Screen based on revenues Companies must have at least 50% of their revenue generated from one or more a
pre-defined sector associated with that theme These sectors use the STOXX Factset Revere Hierarchy methodology that seeks to
provide a more granular way of categorising companies by thematic sector Stocks must have a minimum market cap of €200M and a minimum €1m 3 month average
daily traded volume Minimum 80 stock portfolio
Equal-weight
Stocks are equally-weighted, this seeks to ensure a broad exposure to each theme is provided and the basket is not highly concentrated in certain names
Start with a universe of 8,000 stocks
The Stoxx Global Total Market Index Includes developed and emerging markets stocks Includes large, mid and small cap stocks
1
2
Source: Stoxx as of December 2017.
FOR PROFESSIONAL CLIENTS/QUALIFIED INVESTORS INVESTORS ONLYEII0318E-442750-1399832

iShares Thematic ETFsRBOT, DGTL, AGED, HEAL
EII0318E-442750-1399832

Meaning this is a truly global theme
0100200300400500600
Number of multipurpose industrial robots per 100,000 employees in the manufacturing industry (2015)
Robots are also infiltrating our everyday lives
0
5000
10000
15000
20000
25000
30000
35000
Household Robots Entertainment & Leisure Robots
Service robots for personalised/domestic use. Unit sales forecast 2016-2019, 2015 and 2016
2014 2015 2016-2019
17,966 20,88424,192 26,599
30,70036,665
41,65046,431
51,36955,324
59,470
0
10,000
20,000
30,000
40,000
50,000
60,000
70,000
2006 2007 2008 2009 2010 2011 2012 2013 2014 2015 2016
CN
Y/Ye
ar
China Average Yearly Wages In Manufacturing
9FOR PROFESSIONAL CLIENTS/QUALIFIED INVESTORS INVESTORS ONLY
Robots and A.I. have replaced many less-skilled jobs
Automation and RoboticsRise of the machines
Source: BofA Merrill Lynch Global Investment Strategy, IFR, Bloomberg; as of December 2016
But manufacturing wages in EM are increasing
Source: www.tradingeconomics.com, National Bureau of Statistics of China; as of December 2016
Source: International Federation of Robotics as of December 2015 Source: World Robotics 2016; as of December 2016
EII0318E-442750-1399832

10
3 sub themes within robotics Industrial
• Automotive industry, machine manufacturing, automated production lines
Enablement• Vision technology, chip
manufacturers, processing powerSoftware
• Artificial intelligence, deep learning
Automation and RoboticsRise of the machines
By 2025, the share of tasks performed by robots could rise from a global average of around 10 percent to about 25 percent across all manufacturing industries.*
FOR PROFESSIONAL CLIENTS/QUALIFIED INVESTORS INVESTORS ONLY
*Source: BofA Merrill Lynch Global Investment Strategy, IFR, Bloomberg. Source: BlackRock; as of December 2017. For illustrative purposes only, characteristics subject to change. Reference to the names of each company mentioned in this communications is merely for explaining the investment strategy, and should not be construed as investment advice or investment recommendation of those companies. Blackrock has not acquired any rights or license to reproduce the trademarks, logos and images set out in this document. The trademarks, logos and images set out in this document are used only for the purposes of this presentation.
EII0318E-442750-1399832

13
RBOTiShares Automation & Robotics UCITS ETF
Invest in disruptive change – Robots have the power to disrupt existing industries, deliver cost savings and efficiencies as well as drive corporate profits for the next few decades
Harness technological growth – Capture companies specialising in innovations across technologies which include machine manufacturing, artificial intelligence and chip manufacturing
Seek outperformance – Thematic investments such as RBOT can help investors seek long term growth while expressing a view on the innovative companies that will shape the global economic future
Why automation & robotics today?
5Y Cumulative Performance vs. MSCI ACWI Index IMI (%)Country Breakdown vs. MSCI ACWI IMI Index (%)
The figures shown relate to past performance. Past performance is not a reliable indicator of current or future results and should not be the sole factor of consideration when selecting a product or strategy. Source: BlackRock, Bloomberg, STOXX; as of 28th February 2018. Characteristics subject to change. Geographic exposure relates principally to the domicile of the issuers of the securities held in the index, added together and then expressed as a percentage of the index's total holdings. However, in some instances it can reflect the country where the issuer of the securities carries out much of their business. Indexes are unmanaged and one cannot invest directly in an index.
FOR PROFESSIONAL CLIENTS/QUALIFIED INVESTORS INVESTORS ONLY
2013 2014 2015 2016 2017
iSTOXX FactSet Automation & Robotics USD Net Return 24.8% 6.8% -9.3% 18.1% 47.0%
MSCI ACWI Net Total Return USD Index 22.8% 4.2% -2.4% 7.9% 24.0%
-30%
20%
70%
120%
170%
Feb13
Jun13
Oct13
Feb14
Jun14
Oct14
Feb15
Jun15
Oct15
Feb16
Jun16
Oct16
Feb17
Jun17
Oct17
Feb18
Cum
ulat
ive
Ret
urn
(%)
iSTOXX FactSet Automation & Robotics Index MSCI AC World Index IMI
0.0% 10.0% 20.0% 30.0% 40.0% 50.0% 60.0%
OtherChina
NetherlandsSwedenFrance
SwitzerlandCanadaFinland
GermanySouth Korea
United KingdomTaiwan
JapanUnited States
MSCI AC World Index IMI iStoxx Factset Automation & Robotics Index
EII0318E-442750-1399832

iShares Thematic ETFsAccessing tomorrow’s growth drivers today
12
Why iShares Thematic ETFs?Access change – Invest in the trends that are shapingthe global economy today and influencing investmentoutcomes tomorrow.
Performance – Thematic investments can helpinvestors pursue long term growth.
Implementation – iShares ETFs provide a simple, lowcost, rules-based tool to access long term themes.
RBOTTER: 0.40%
HEALTER: 0.40%
AGEDTER: 0.40%
DGTLTER: 0.40%
FOR PROFESSIONAL CLIENTS/QUALIFIED INVESTORS INVESTORS ONLY
-20.0%
-10.0%
0.0%
10.0%
20.0%
30.0%
40.0%
50.0%
2013 2014 2015 2016 2017
Calendar year Performance, 2013-2017
iSTOXX FactSet Breakthrough Healthcare USD Net ReturniSTOXX FactSet Ageing Population USD Net ReturniSTOXX FactSet Digitalisation USD Net ReturniSTOXX FactSet Automation & Robotics USD Net ReturnMSCI ACWI Net Total Return USD Index
The figures shown relate to past performance. Past performance is not a reliable indicator of current or future results and should not be the sole factor of consideration when selecting a product or strategy. Source: BlackRock, Bloomberg as of 31st December 2017.
EII0318E-442750-1399832

Appendix
EII0318E-442750-1399832

Digitalisation
EII0318E-442750-1399832

15
DigitalisationDisruptive technology is changing the world
Mobile internet traffic is rapidly increasing
711
1724
35
49
0
10
20
30
40
50
60
2016 2017* 2018* 2019* 2020* 2021*
Global mobile data traffic in exabytes (1bn gigabyte) per month
Source: Statista ‘Digital Economy Compass’; as of April 2017
1,336 1,548 1,859
2,290 2,774
3,305
3,879
4,479
0500
1,0001,5002,0002,5003,0003,5004,0004,5005,000
2014 2015 2016 2017* 2018* 2019* 2020* 2021*
e-Commerce Sales in bn $
Online spending is also on the up
0.0% 5.0% 10.0% 15.0% 20.0% 25.0% 30.0% 35.0%
0 or None
1-9
10-49
50 or more
Don't know
Number of security incidents detected in past 12 month
Source: Statista ‘Digital Economy Compass’; as of April 2017
PWC, The Global State of Information Security Survey 2016; as of December 2016..
30 3953
6887
114
146
178
208236
0
50
100
150
200
250
2011 2012 2013 2014 2015 2016 2017* 2018* 2019* 2020*
Public Cloud Revenue
Digitalisation of everything relies on the cloud Rapid change leads to changing requirements
Source: 1https://www.geekwire.com/2016/charts-cloud-computing-industry-getting-huge-decimating-sales-premise-servers; as of December 2016.
Any opinions, forecasts represent an assessment of the market environment at a specific time and is not intended to be a forecast of future events or a guarantee of future results. This information should not be relied upon by the reader as research, investment advice or a recommendation. Forecasts may not come to pass.
FOR PROFESSIONAL CLIENTS/QUALIFIED INVESTORS INVESTORS ONLYEII0318E-442750-1399832

Source: Factset, Stoxx, BlackRock; as of December 2017. For illustrative purposes only, characteristics subject to change. Reference to the names of each company mentioned in this communications is merely for explaining the investment strategy, and should not be construed as investment advice or investment recommendation of those companies. Blackrock has not acquired any rights or license to reproduce the trademarks, logos and images set out in this document. The trademarks, logos and images set out in this document are used only for the purposes of this presentation.
16
Digitalisers,45
eCommerce, 36
Communication, 26
3 sub themes within digitalisationCommunication
• Social media, instant messaging, cloud computing
Digitalisers• Entertainment, industry disruption,
FinTech, cyber securityeCommerce
• Internet shopping, payment processing, delivery
Sub-theme security breakdown
The digital economy is displacing established business models, shaking up industries and creating entirely new industries.
iShares Digitalisation UCITS ETFDisruptive technology is changing the world
FOR PROFESSIONAL CLIENTS/QUALIFIED INVESTORS INVESTORS ONLYEII0318E-442750-1399832

17
DGTLiShares Digitalisation UCITS ETFDisruptive technology is changing the world
Invest in the digital economy – Invest in sectors such as financial technology, cybersecurity, and cloud computing that are transforming global markets today and have the potential to shape the world economy in the future.
Diversification – Gain diversified, global exposure to companies that offer digitally focused services and stand tobenefit from the growth of a digitally connected society.
Future growth potential – Given the global coverage and long-term nature of the trends underpinning DGTL, investors may consider using it as a satellite component or strategic tilt within a global portfolio.
Why digitalisation today?
Country Breakdown vs. MSCI ACWI Index IMI (%) Cumulative Performance vs. MSCI ACWI Index IMI (%)
FOR PROFESSIONAL CLIENTS/QUALIFIED INVESTORS INVESTORS ONLY
2013 2014 2015 2016 2017
iSTOXX FactSet Digitalisation USD Net Return 41.7% 0.1% 2.7% 3.8% 27.9%
MSCI ACWI Net Total Return USD Index 22.8% 4.2% -2.4% 7.9% 24.0%
The figures shown relate to past performance. Past performance is not a reliable indicator of current or future results and should not be the sole factor of consideration when selecting a product or strategy. Source: BlackRock, Bloomberg, STOXX; as of 28th February 2018. Characteristics subject to change. Geographic exposure relates principally to the domicile of the issuers of the securities held in the index, added together and then expressed as a percentage of the index's total holdings. However, in some instances it can reflect the country where the issuer of the securities carries out much of their business. Indexes are unmanaged and one cannot invest directly in an index.
-30%
-10%
10%
30%
50%
70%
90%
110%
Feb13
Jun13
Oct13
Feb14
Jun14
Oct14
Feb15
Jun15
Oct15
Feb16
Jun16
Oct16
Feb17
Jun17
Oct17
Feb18
Cum
ulat
ive
Ret
urn
(%)
iSTOXX FactSet Digitalisation Index MSCI AC World Index IMI
0.0% 10.0% 20.0% 30.0% 40.0% 50.0% 60.0%
OtherCanada
SwitzerlandItaly
TaiwanIndia
FranceChinaBrazil
AustraliaSouth Korea
GermanyUnited Kingdom
JapanUnited States
MSCI AC World Index IMI iStoxx Factset Digitalisation Index
EII0318E-442750-1399832

Healthcare innovation
EII0318E-442750-1399832

19
Breakthrough healthcareHEAL the world
Spending on healthcare is set to balloon
Source: World Population Prospects: The 2015 revisions; as of July 2015. *Estimated figure.
3.0%
8.0%10.5%
20.0%
0.0%
5.0%
10.0%
15.0%
20.0%
25.0%
1950 2000 2013 2040*
Forecast share of global GDP spent on healthcare
Medical devices market is set to expand rapidly
339.5 360.8386.1
412.8 435.8
050
100150200250300350400450500
2016 2017e 2018e 2019e 2020e
USD
Bn
Medical Devices Market: Forecast for growth
Source: http://trade.gov/topmarkets/pdf/Medical_Devices_Executive_Summary.pdf; as of September 2016.
Opportunities broadening for patients in the US Digital advancement transforming Chinese healthcare
3
110
$0B
$20B
$40B
$60B
$80B
$100B
$120B
2014 2020
The size of China's digital healthcare market ($bn)
Source: BCG Perspectives: China’s Digital Health-Care Revolution; as of September 2015.Source: Bain, Front of Line Healthcare Report 2015; as of 2015.
5259
6362
6875
8181
8693
9597
TelemedicineRemote patient monitoring
Patients adherence initiativesTransparency initatives
Compative effectiveness dataPredictive analyticsWellness programs
Care coordinatorsPhyisican extenders
Electonic medical recordsStandard treatment protocols
Electronic access to treatment protocols
New clinical tools & practices adopted and forecast in the US healthcare industry2
Use now Expected use in 2 years
Any opinions, forecasts represent an assessment of the market environment at a specific time and is not intended to be a forecast of future events or a guarantee of future results. This information should not be relied upon by the reader as research, investment advice or a recommendation. Forecasts may not come to pass.
Mar
ket s
ize
FOR PROFESSIONAL CLIENTS/QUALIFIED INVESTORS INVESTORS ONLYEII0318E-442750-1399832
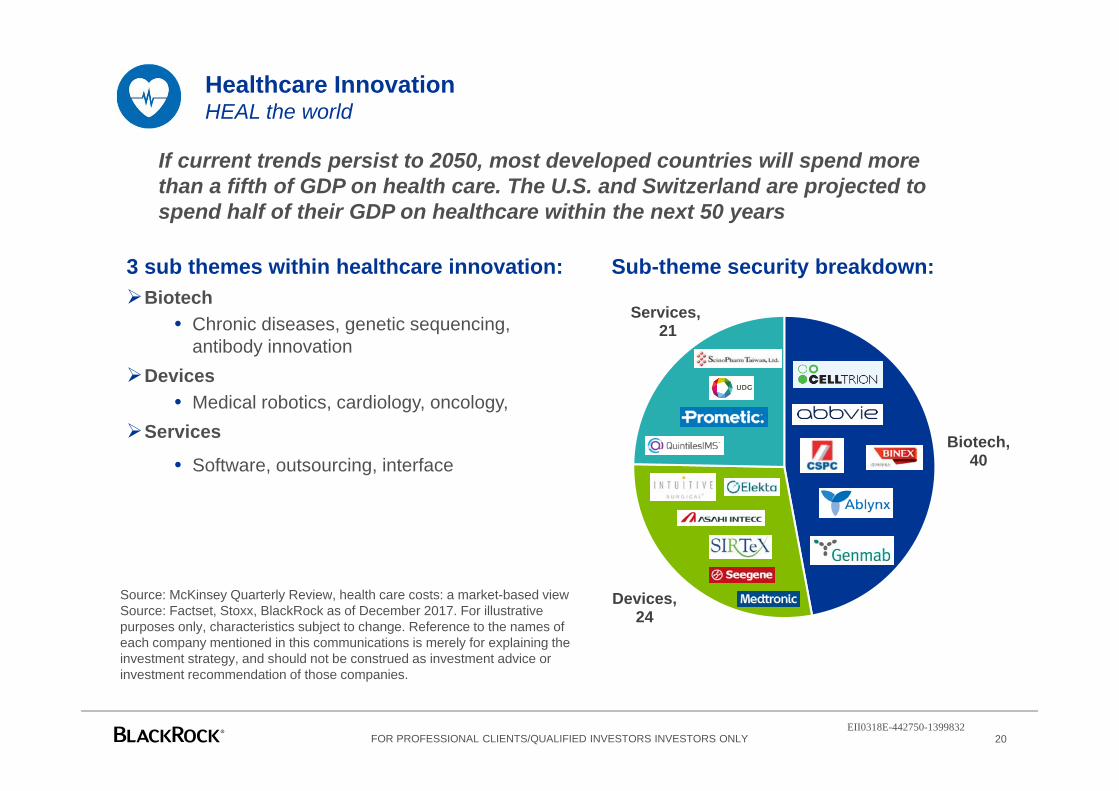
Source: McKinsey Quarterly Review, health care costs: a market-based viewSource: Factset, Stoxx, BlackRock as of December 2017. For illustrative purposes only, characteristics subject to change. Reference to the names of each company mentioned in this communications is merely for explaining the investment strategy, and should not be construed as investment advice or investment recommendation of those companies.
20
Biotech, 40
Devices,24
Services,21
3 sub themes within healthcare innovation:Biotech
• Chronic diseases, genetic sequencing, antibody innovation
Devices• Medical robotics, cardiology, oncology,
Services
• Software, outsourcing, interface
Healthcare InnovationHEAL the world
Sub-theme security breakdown:
If current trends persist to 2050, most developed countries will spend more than a fifth of GDP on health care. The U.S. and Switzerland are projected to spend half of their GDP on healthcare within the next 50 years
FOR PROFESSIONAL CLIENTS/QUALIFIED INVESTORS INVESTORS ONLYEII0318E-442750-1399832

21
HEALiShares Healthcare Innovation UCITS ETFHEAL the world
Country Breakdown vs. MSCI ACWI IMI Index (%)
Shifting demographics – As health services around the world face rising demand from an ageing population, more efficient and effective ways of delivering treatment and care are likely to be needed
Diversification – HEAL provides access to the healthcare innovation theme on a global basis and can complement atraditional equity exposure by diversifying a portfolio’s drivers of return
Performance – Thematic investments are designed to provide exposure to long-term growth and HEAL’s benchmarkhas outperformed the broader MSCI ACI IMI Index over the past five years.
Why healthcare innovation today?
Cumulative Performance vs. MSCI ACWI IMI Index (%)
FOR PROFESSIONAL CLIENTS/QUALIFIED INVESTORS INVESTORS ONLY
2013 2014 2015 2016 2017
iSTOXX FactSet Breakthrough Healthcare USD Net Return 28.7% 12.6% 27.6% -6.7% 35.4%MSCI ACWI Net Total Return USD Index 22.8% 4.2% -2.4% 7.9% 24.0%
The figures shown relate to past performance. Past performance is not a reliable indicator of current or future results and should not be the sole factor of consideration when selecting a product or strategy. Source: BlackRock, Bloomberg, STOXX; as of 28th February 2018. Characteristics subject to change. Geographic exposure relates principally to the domicile of the issuers of the securities held in the index, added together and then expressed as a percentage of the index's total holdings. However, in some instances it can reflect the country where the issuer of the securities carries out much of their business. Indexes are unmanaged and one cannot invest directly in an index.
-30%
20%
70%
120%
170%
Feb13
Jun13
Oct13
Feb14
Jun14
Oct14
Feb15
Jun15
Oct15
Feb16
Jun16
Oct16
Feb17
Jun17
Oct17
Feb18
Cum
ulat
ive
Ret
urn
(%)
iSTOXX FactSet Breakthrough Healthcare Index MSCI AC World Index IMI
0.0% 10.0% 20.0% 30.0% 40.0% 50.0% 60.0%
OtherFrance
United KingdomChina
Hong KongTaiwan
DenmarkIreland
SwitzerlandAustralia
IndiaBelgium
JapanSouth Korea
United States
MSCI AC World Index IMI iStoxx Factset Healthcare Innovation Index
EII0318E-442750-1399832

Ageing Population
EII0318E-442750-1399832

23
Ageing is not just a first world problemThe proportion of elderly people is rapidly increasing
Ageing populationThe longevity revolution
The elderly will dominate global consumption growth
-
20,000
40,000
60,000
80,000
100,000
120,000
140,000
Pop
ulat
ion(
'000
)s
Top ten countries with population over 80 in 2015 vs. 2050
2015 2050
14
10
23
3541
47
55
0
10
20
30
40
50
60
2015 2020 2025 2030 2035 2040 2045 2050
# C
ount
ries
Number of countries with >30% population aged over 60, 2015-2050
Source: United Nations World Population Prospects: The 2015 Revision; as of July 2015.
Retiring and elderly (DM only)
China (15-59 yrs)
North America (15-59 yrs)China (15-59 yrs)
Latin America (15-59 yrs)
South Asia (15-59 yrs)
Southeast Asia (15-59 yrs)
Western Europe (15-59 yrs)
Northeast Asia (15-59 yrs)
Other groups 19%
18%
10%10%
10%
5%5%
3%3%
2%
25%
Share of global urban
consumption growth 2015-2030
Healthcare costs accelerate with age
Source:
Source: McKinsey Global Institute Cityscope; National Transfer Accounts Project; McKinsey Global Institute analysis; as of April 2016.
Source: McKinsey Global Institute Cityscope; as of April 2016. Numbers may not add up to 100% due to rounding.
FOR PROFESSIONAL CLIENTS/QUALIFIED INVESTORS INVESTORS ONLYEII0318E-442750-1399832
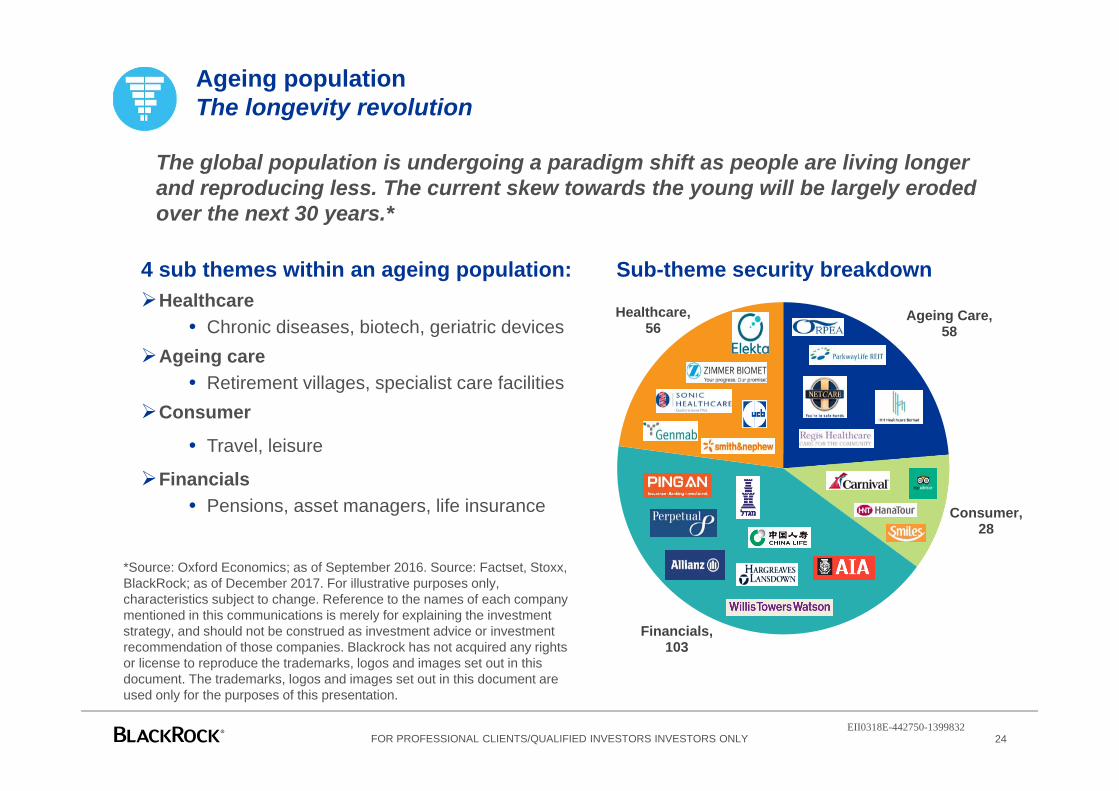
*Source: Oxford Economics; as of September 2016. Source: Factset, Stoxx, BlackRock; as of December 2017. For illustrative purposes only, characteristics subject to change. Reference to the names of each company mentioned in this communications is merely for explaining the investment strategy, and should not be construed as investment advice or investment recommendation of those companies. Blackrock has not acquired any rights or license to reproduce the trademarks, logos and images set out in this document. The trademarks, logos and images set out in this document are used only for the purposes of this presentation.
24
Ageing populationThe longevity revolution
4 sub themes within an ageing population:Healthcare
• Chronic diseases, biotech, geriatric devices Ageing care
• Retirement villages, specialist care facilitiesConsumer
• Travel, leisure
Financials• Pensions, asset managers, life insurance
Ageing Care, 58
Consumer, 28
Financials, 103
Healthcare,56
Sub-theme security breakdown
The global population is undergoing a paradigm shift as people are living longer and reproducing less. The current skew towards the young will be largely eroded over the next 30 years.*
FOR PROFESSIONAL CLIENTS/QUALIFIED INVESTORS INVESTORS ONLYEII0318E-442750-1399832

23
AGEDiShares Ageing Population UCITS ETF
Shifting demographics – As people are living longer, society will be forced to make rapid investments into medical devices and technology to account for a significantly older population.
Diversification – Directly investing in companies that will benefit from an ageing population can complement an existingequity strategy and diversify a global portfolio.
Long-term performance – Unprecedented increases in human longevity are also creating stores of investmentopportunity. AGED provides a tool to invest in this trend and seek long-term growth while providing portfoliodiversification.
Why ageing population today?
Cumulative Performance vs. MSCI ACWI IMI Index (%)Country Breakdown vs. MSCI ACWI IMI Index (%)
FOR PROFESSIONAL CLIENTS/QUALIFIED INVESTORS INVESTORS ONLY
The figures shown relate to past performance. Past performance is not a reliable indicator of current or future results and should not be the sole factor of consideration when selecting a product or strategy. Source: BlackRock, Bloomberg, STOXX; as of 28th February 2018. Characteristics subject to change. Geographic exposure relates principally to the domicile of the issuers of the securities held in the index, added together and then expressed as a percentage of the index's total holdings. However, in some instances it can reflect the country where the issuer of the securities carries out much of their business. Indexes are unmanaged and one cannot invest directly in an index.
2013 2014 2015 2016 2017
iSTOXX FactSet Ageing Population USD Net Return 32.7% 9.0% 5.3% 2.6% 21.7%
MSCI ACWI Net Total Return USD Index 22.8% 4.2% -2.4% 7.9% 24.0%
-30%
-10%
10%
30%
50%
70%
90%
110%
130%
Feb13
Jun13
Oct13
Feb14
Jun14
Oct14
Feb15
Jun15
Oct15
Feb16
Jun16
Oct16
Feb17
Jun17
Oct17
Feb18
iSTOXX FactSet Ageing Population Index MSCI ACWI Index IMI
0.0% 10.0% 20.0% 30.0% 40.0% 50.0% 60.0%
OtherIsrael
GermanyBrazil
ThailandSwitzerland
TaiwanFrance
South AfricaChina
CanadaSouth Korea
United KingdomAustralia
JapanUnited States
MSCI ACWI Index IMI iStoxx Factset Ageing Population Index
EII0318E-442750-1399832

How to Implement in client portfolios
EII0318E-442750-1399832

Robotics and Automation(103 stocks)
Invest across thematic strategies with limited overlap
Source: Factset as of December 2017. For illustrative purposes only, characteristics subject to change.
27
Overlap between thematic indexes
Thematic fund implementation: Target a specific theme with a single thematic strategy Invest across thematics to further diversify and enhance a global portfolio
Ageing Population
(245 stocks)Digitalisation(107 stocks)
24
Breakthrough Healthcare(85 stocks)
1
1
FOR PROFESSIONAL CLIENTS/QUALIFIED INVESTORS INVESTORS ONLYEII0318E-442750-1399832

Thematic correlations to broad equities
28
Correlations to Broad Equities
Source: BlackRock. Periods used: 03/11/2014 – 31/12/2017 Currency: GBP. Frequency: Monthly. The figures shown relate to past performance. Past performance is not a reliable indicator of current or future results and should not be the sole factor of consideration when selecting a product or strategy. BlackRock makes no representations or warranties as to the accuracy or completeness of any past, estimated or simulated performance results contained herein, and further nothing contained herein shall be relied upon as a promise by, or representation by BlackRock whether as to past or future performance results. Analysis has been run on index level. It is not possible to invest directly in an index. The return of your investment may increase or decrease as a result of currency fluctuations.
Diversification benefits within an equity portfolio The funds can be utilized within the Equities allocation of a portfolio when seeking diversification benefits, with correlations
against most major Equity indices under 90%.
Historically, HEAL has exhibited the lowest long term correlation to broad equity markets
FOR PROFESSIONAL CLIENTS/QUALIFIED INVESTORS INVESTORS ONLY
RBOT HEAL DGTL AGEDRBOT 1 0.69 0.88 0.81
HEAL 0.69 1 0.77 0.83
DGTL 0.88 0.77 1 0.91
AGED 0.81 0.83 0.91 1
MSCI World 0.86 0.75 0.92 0.94
FTSE All Share Index 0.70 0.58 0.74 0.73
MSCI Europe ex UK Index 0.71 0.65 0.72 0.75
MSCI Pacific ex Japan Index 0.72 0.61 0.77 0.84
MSCI EM Index 0.80 0.55 0.78 0.79
EII0318E-442750-1399832

Case study 1: adding thematic ETFs to a simulated portfolioFitting each of the 4 ETFs individually into the Equity allocation of the Starting Portfolio
29
*Starting Portfolio contains hypothetical portfolio holdings for a GBP investor and may not be representative of the client’s investment, thus, the results of the analysis presented may vary. If you would like to explore solutions with your specific portfolio and in your base currency, please contact your BlackRock Sales representative and ask for a BPAS consultation. The information contained in this communication is derived from proprietary and non-proprietary sources considered by BlackRock to be reliable, but is not necessarily all inclusive, is not guaranteed as to accuracy and may be subject to change. Reliance upon information in this communication is at the sole discretion of the recipient. You should seek independent investment, legal and tax advice prior to taking any investment decision.
Starting Portfolio
Solution with HEAL
Solution with RBOT
Solution with DGTL
Solution with AGED
Solution with All
Total Equity 45% 45% 45% 45% 45% 45%Broad Equities 45% 35% 35% 35% 35% 35%
HEAL - 10% - - - 2.5%RBOT - - 10% - - 2.5%DGTL - - - 10% - 2.5%AGED - - - 10% 2.5%
45%
35%
10%
10%
Equity Fixed Income Alternatives Cash
Starting Portfolio*
Consider allocating Thematic ETFs within the Equity allocation
Equity: FTSE All Share Index (13%), MSCI Europe ex UK Index (13%), MSCI World Index (16%), MSCI Pacific Index (1%), MSCI EM Index (2%). Fixed Income: Bloomberg Barclays Euro AggIndex (20%), Bloomberg Barclays Global Agg Index (10%), JP Morgan EMBI Global Core Index (5%). Alternatives: FTSE EPRA/NAREIT Developed Dividend+ Index (5%), HFRX Global Hedge Fund Index (5%).
FOR PROFESSIONAL CLIENTS/QUALIFIED INVESTORS INVESTORS ONLYEII0318E-442750-1399832

Case study 1: adding thematic ETFs to a simulated portfolioEnhancement of the portfolio’s risk-return characteristics
30
Risk-Return Spectrum Sharpe Ratio
The figures shown relate to simulated past performance. Past performance is not a reliable indicator of current or future results and should not be the sole factor of consideration when selecting a product or strategy.Source: BlackRock. Periods used: 03/11/2014 – 31/12/2017 Currency: GBP. Frequency: Monthly. BlackRock makes no representations or warranties as to the accuracy or completeness of any past, estimated or simulated performance results contained herein, and further nothing contained herein shall be relied upon as a promise by, or representation by BlackRock whether as to past or future performance results. The return of your investment may increase or decrease as a result of currency fluctuations.
Enhanced risk-return characteristics: All portfolio solutions demonstrate an improvement in risk-return characteristics compared to the Starting Portfolio.
Whilst all portfolio solutions show improved Sharpe ratio compared to the Starting Portfolio, Solution with HEAL shows highest improvement in Sharpe ratio.
Varying factor exposures can be seen in factors such as Momentum, Value and Growth, whilst all solutions show reduction in Volatility and Leverage compared to the Starting Portfolio.
Equity Style Factor Exposures
FOR PROFESSIONAL CLIENTS/QUALIFIED INVESTORS INVESTORS ONLY
-1 -0.5 0 0.5 1
Size
Volatility
Momentum
Value
Profitability
Dividend Yield
Growth
Leverage
Starting Portfolio Solution with HEALSolution with RBOT Solution with DGTLSolution with AGED
1.05 1.1 1.15 1.2 1.25 1.3 1.35
Solution with AGED
Solution with DGTL
Solution with RBOT
Solution with HEAL
Starting Portfolio
9.00
9.25
9.50
9.75
10.00
10.25
10.50
10.75
11.00
7 7.2 7.4 7.6 7.8 8
Annu
alis
d R
etur
ns (%
)
Annualised Risk (%)
Solution with AGED Solution with DGTL Solution with RBOT
Solution with HEAL Starting Portfolio
EII0318E-442750-1399832

31
Risk Warnings
Investment in the products mentioned in this document may not be suitable for all investors. Past performance is not a reliable indicator of current or future results and should not be the sole factor of consideration when selecting a product or strategy. The price of the investments may go up or down and the investor may not get back the amount invested. Your income is not fixed and may fluctuate. The value of investments involving exposure to foreign currencies can be affected by exchange rate movements. We remind you that the levels and bases of, and reliefs from, taxation can change.
BlackRock has not considered the suitability of this investment against your individual needs and risk tolerance. The data displayed provides summary information. Investment should be made on the basis of the relevant Prospectus which is available from the manager.
In respect of the products mentioned this document is intended for information purposes only and does not constitute investment advice or an offer to sell or a solicitation of an offer to buy the securities described within. This document may not be distributed without authorisation from BlackRock Advisors (UK) Limited.
FOR PROFESSIONAL CLIENTS/QUALIFIED INVESTORS INVESTORS ONLYEII0318E-442750-1399832

32
Fund RisksiShares Ageing Population UCITS ETF, iShares Automation & Robotics UCITS ETF, iShares Digitalisation UCITS ETF, iShares Healthcare Innovation UCITS ETF RisksInvestment risk is concentrated in specific sectors, countries, currencies or companies. This means the Fund is more sensitive to any localised economic, market, political or regulatory events. Tax treatment depends on the individual circumstances of each client and may be subject to change in the future.
Counterparty Risk: The insolvency of any institutions providing services such as safekeeping of assets or acting as counterparty to derivatives or other instruments, may expose the Share Class to financial loss.
Derivatives are highly sensitive to changes in the value of the asset on which they are based and can increase the size of losses and gains, resulting in greater fluctuations in the value of the Fund. The impact to the Fund can be greater where derivatives are used in an extensive or complex way.
Emerging markets are generally more sensitive to economic and political conditions than developed markets. Other factors includegreater 'Liquidity Risk', restrictions on investment or transfer of assets and failed/delayed delivery of securities or payments to the Fund.
The value of equities and equity-related securities can be affected by daily stock market movements. Other influential factors include political, economic news, company earnings and significant corporate events.
Index Methodology Risk: Although the Benchmark Index aims to seek exposure to securities with low volatility characteristics from within the Parent Index, there is no guarantee that this objective will be achieved.
Investments in the technology securities are subject to absence or loss of intellectual property protections, rapid changes in technology, government regulation and competition.
Liquidity Risk: Lower liquidity means there are insufficient buyers or sellers to allow the Fund to sell or buy investments readily.Non-investment grade fixed income securities are more sensitive to changes in interest rates and present greater ‘Credit Risk’ than higher rated fixed income securities.
Shares in smaller companies typically trade in less volume and experience greater price variations than larger companies.
FOR PROFESSIONAL CLIENTS/QUALIFIED INVESTORS INVESTORS ONLYEII0318E-442750-1399832

Regulatory Information
BlackRock Advisors (UK) Limited, which is authorised and regulated by the Financial Conduct Authority ('FCA'), having its registered office at 12 Throgmorton Avenue, London, EC2N 2DL, England, Tel +44 (0)20 7743 3000, has issued this document for access by Professional Clients only and no other person should rely upon the information contained within it. For your protection, calls are usually recorded. iShares plc, iShares II plc, iShares III plc, iShares IV plc, iShares V plc, iShares VI plc and iShares VII plc (together 'the Companies') are open-ended investment companies with variable capital having segregated liability between their funds organised under the laws of Ireland and authorised by the Central Bank of Ireland.
For investors in Austria
The funds mentioned in this document are registered for public offer in Austria. The Sales Prospectuses for the Companies, Key Investor Information Document and other documents as well as the annual and semi-annual reports have been published in Austria and are available free of charge from UniCredit Bank AG Vienna Branch, Julius Tandler Platz 3, 1090 Vienna, Austria, the Austrian paying and information agent and are also available on the website www.ishares.at. Any decision to invest must be based solely on the information contained in the Company’s Prospectus, Key Investor Information Document and the latest half-yearly report and unaudited accounts and/or annual report and audited accounts. Investors should read the fund specific risks in the Key Investor Information Document and the Company’s Prospectus. The Companies intend to fulfil the requirements for treatment of all of their sub-funds as reporting funds. Therefore the Companies have an Austrian tax representative who calculates the Austrian Deemed Distributed Income figures once a year and files an electronic tax return with the Austrian Control Bank. However, it cannot be guaranteed that the requirements will be met in the future. The Companies reserve the right to give up the reporting fund status and to not undertake such tax filings.
For investors in Denmark
This document is directed at Professional Investors in Denmark only and the Funds are authorised by Finanstilsynet, the Danish Financial Supervisory Authority. Any decision to invest must be based solely on the information contained in the Company’s Prospectus, Key Investor Information Document and the latest half-yearly report and unaudited accounts and/or annual report and audited accounts and the Danish country supplements. Investors should read the fund specific risks in the Key Investor Information Document and the Company’s Prospectus. Copies of all documentation can be obtained free of charge from offices of the paying agent in Denmark BlackRock Copenhagen Branch, filial af BlackRock Investment Management (UK) Limited Harbour House, Sundkrogsgade 21, 2100 København Ø, Denmark. This document is strictly confidential and may not be distributed without authorisation from BlackRock Advisors (UK) Limited.
For investors in Finland
The funds mentioned are registered for public distribution in Finland and are authorised by the Finanssivalvonta (Fiva), the Financial Supervisory Authority (FIN-FSA), in Finland. Any decision to invest must be based solely on the information contained in the Company’s Prospectus, Key Investor Information Document and the latest half-yearly report and unaudited accounts and/or annual report and audited accounts. Investors should read the fund specific risks in the Key Investor Information Document and the Company’s Prospectus. This document is strictly confidential and may not be distributed without authorisation from BlackRock Advisors (UK) Limited.
Important Information
33FOR PROFESSIONAL CLIENTS/QUALIFIED INVESTORS INVESTORS ONLYEII0318E-442750-1399832

For investors in Germany
The Sales Prospectus and Key Investor Information Document, as well as the annual and semi-annual reports are available free of charge from Commerzbank Kaiserplatz, 60311 Frankfurt am Main, Germany. The Companies intend to fulfil the prerequisites for treatment of their sub-funds as so-called "transparent funds" pursuant to §§ 2 and 4 of the German Investment Tax Act (Investmentsteuergesetz – InvStG). However, it cannot be guaranteed that the requirements will be met. The Companies reserve the right to give up the "transparent status" and to not undertake the necessary publications. Any decision to invest must be based solely on the information contained in the Company’s Prospectus, Key Investor Information Document and the latest half-yearly report and unaudited accounts and/or annual report and audited accounts. Investors should read the fund specific risks in the Key Investor Information Document and the Company’s Prospectus. Please note that important information about iShares VII funds is available in the current prospectus and other documents that can be obtained free of charge from the paying agent, Deutsche Bank AG Taunusanlage 12, 60325 Frankfurt am Main, Federal Republic of Germany.
For investors in Iceland
The funds mentioned in this document are not registered for public distribution in Iceland. The investment described in this memorandum is not a public offering of securities. It is not registered for public distribution in Iceland with the Financial Supervisory Authority pursuant to the Icelandic Act on Undertakings for Collective Investment in Transferable Securities (UCITS) and investment Funds No. 30/2003 and supplementary regulations. The investment may not be offered or sold by means of this memorandum or anyway later resold otherwise than in accordance with Article 13 of the Regulation on UCITS and Investment Funds No. 792/2003. This document is intended for information purposes only and does not constitute investment advice or an offer to sell or a solicitation of an offer to buy the funds described within and no steps may be taken which would constitute or result in a public offering of the funds in Iceland. This document is strictly confidential and may not be distributed without authorisation from BlackRock Advisors (UK) Limited.
Please read the prospectus and ensure that you are eligible to invest under the local regulatory and financial rules, and comply with restrictions on foreign currency investments, that exist for Icelandic investors. We recommend that you seek independent financial advice before making any investment decision. This document is for your information only. Accordingly, this document and relevant information may not be used for any other purpose or passed on to any other person in Iceland. The funds described in this document are not registered for public distribution in Iceland and may not be offered, sold or resold to the public in Iceland. Any decision to invest must be based solely on the information contained in the Company’s Prospectus, Key Investor Information Document and the latest half-yearly report and unaudited accounts and/or annual report and audited accounts. Investors should read the fund specific risks in the Key Investor Information Document and the Company’s Prospectus.
Disclaimers
34FOR PROFESSIONAL CLIENTS/QUALIFIED INVESTORS INVESTORS ONLYEII0318E-442750-1399832

For investors in Israel
BlackRock Investment Management (UK) Limited is not licensed under Israel's Regulation of Investment Advice, Investment Marketing and Portfolio Management Law, 5755-1995 (the “Advice Law”). No action has been taken or will be taken in Israel that would permit a public offering or distribution of the products mentioned in this document to the public in Israel. The products mentioned in this document have not been approved by the Israel Securities Authority. In addition, the products mentioned in this document are not regulated under the provisions of Israel’s Joint Investment Trusts Law, 5754-1994 (the “Joint Investment Trusts Law”). This document has not been approved by the Israel Securities Authority and will only be distributed to Israeli residents in a manner that will not constitute "an offer to the public" under sections 15 and 15a of the Israel Securities Law, 5728-1968 (the "Securities Law") or section 25 of the Joint Investment Trusts Law, as applicable.
This document and the products mentioned herein are being offered to those categories of investors listed in the First Addendum (the “Addendum") to the Securities Law, ("Institutional Investors"); in all cases under circumstances that will fall within the private placement or other exemptions of the Joint Investment Trusts Law, the Securities Law and any applicable guidelines, pronouncements or rulings issued from time to time by the Israel Securities Authority. This document may not be reproduced or used for any other purpose, nor be furnished to any other person other than those to whom copies have been sent. Nothing in this document should be considered investment advice or investment marketing as defined in the Regulation of Investment Advice, Investment Marketing and Portfolio Management Law, 5755-1995. This document does not constitute an offer to sell or solicitation of an offer to buy any securities, nor does it constitute an offer to sell to or solicitation of an offer to buy from any person or persons in any state or other jurisdiction in which such offer or solicitation would be unlawful, or in which the person making such offer or solicitation is not qualified to do so, or to a person or persons to whom it is unlawful to make such offer or solicitation.
For investors in Luxembourg
The Companies have been notified to the Commission de Surveillance du Secteur Financier in Luxembourg in order to market their shares for sale to the public in Luxembourg and the Companies are notified Undertaking in Collective Investment for Transferable Securities (UCITS). The Companies have not been listed on the Luxembourg Stock Exchange, investors should contact their broker for further information. Investment is subject to the Prospectus, Key Investor Information Document and all documents (the main/umbrella Prospectus, the Supplement[s], the latest and any previous annual and semi-annual reports of the Companies and the Memorandum and Articles of Association of the Companies) will be available in the Luxembourg, free of charge, from the offices of the Local Agent, BNP Paribas Securities Services, Luxembourg Branch 33, rue de Gasperich Howald – Hesperange L-2085 Luxembourg or by visiting the website on www.iShares.com. Investors should read the fund specific risks in the Key Investor Information Document and the Company’s Prospectus.
Disclaimers
35FOR PROFESSIONAL CLIENTS/QUALIFIED INVESTORS INVESTORS ONLYEII0318E-442750-1399832

For investors in Norway
The funds mentioned are registered for public distribution in Norway and are authorised by Kredittilsynet, the Financial Supervisory Authority of Norway. Any application for shares in the funds is on the terms of the Prospectus, Key Investor Information Document for the Companies. Any decision to invest must be based solely on the information contained in the Company’s Prospectus, Key Investor Information Document and the latest half-yearly report and unaudited accounts and/or annual report and audited accounts. Investors should read the fund specific risks in the Key Investor Information Document and the Company’s Prospectus. This document is strictly confidential and may not be distributed without authorisation from BlackRock Advisors (UK) Limited.
For investors in Spain
The funds mentioned are registered for public distribution in Spain.The sales Prospectus has been registered with the Spanish Securities Market Commission (Comisión Nacional del Mercado de Valores ('CNMV')). The funds which are registered in the official registry of the Spanish Securities and Exchange Commission (CNMV) are iShares plc (registration number 801), iShares II plc (registration number 802) and iShares III plc (registration number 806), iShares IV plc (registration number 1402), iShares V plc (registration number 977), iShares VI plc (registration number 1091), iShares VII plc (registration number 886) and iShares (Lux) (registration number 905). The official registry, CNMV, must always be checked to see which sub funds of the funds mentioned are registered for public distribution in Spain. Any decision to invest must be based solely on the information contained in the Company’s Prospectus, Key Investor Information Document and the latest half-yearly report and unaudited accounts and/or annual report and audited accounts, copies of which can be obtained free of charge at www.iShares.es. Investors should read the fund specific risks in the Key Investor Information Document and the Company’s Prospectus. This document contains products or services of BlackRock, Inc. (or affiliates thereof) that might be offered directly or indirectly within the Andorran jurisdiction, and it should not be regarded as solicitation of business in any jurisdiction including the Principality of Andorra.
For investors in Sweden
The Funds mentioned herein are registered for public distribution in Sweden and are authorised by Finansinspektionen, the Swedish Financial Supervisory Authority. Any application for shares in the funds is on the terms of the Prospectus, Key Investor Information Document, for the Companies. Important information relating to the Companies is contained in the relevant Prospectus, Key Investor Information Document and other documents, copies of which can be obtained free of charge from offices of the paying agent BlackRock Investment Management (UK) Limited, Stockholm Filial Norrlandsgatan 16, 1 floor, S-111 43 Stockholm, Sweden. Any decision to invest must be based solely on the information contained in the Company’s Prospectus, Key Investor Information Document and the latest half-yearly report and unaudited accounts and/or annual report and audited accounts. Investors should read the fund specific risks in the Key Investor Information Document and the Company’s Prospectus. Please note that important information about iShares V funds is available in the current prospectus and other documents that can be obtained free of charge from the paying agent BlackRock Investment Management (UK) Limited, Stockholm Filial Norrlandsgatan 16, 1 floor, S-111 43 Stockholm, Sweden.
Disclaimers
36FOR PROFESSIONAL CLIENTS/QUALIFIED INVESTORS INVESTORS ONLYEII0318E-442750-1399832

For investors in Switzerland
The iShares ETFs are domiciled in Ireland, Switzerland and Germany. BlackRock Asset Management Schweiz AG, Bahnhofstrasse 39, CH-8001 Zurich, is the Swiss Representative and State Street International GmbH, Munich, Zurich Branch, Beethovenstrasse 19, CH-8002 Zürich the Swiss Paying Agent for the foreign iShares ETFs registered in Switzerland. The Prospectus, the Prospectus with integrated fund contract, the Key Investor Information Document, the general and particular conditions, the Articles of Incorporation, the latest and any previous annual and semi-annual reports of the iShares ETFs domiciled or registered in Switzerland are available free of charge from BlackRock Asset Management Schweiz AG. Investors should read the fund specific risks in the Key Investor Information Document and the Prospectus.
For investors in the UK
Most of the protections provided by the UK regulatory system do not apply to the operation of the Companies, and compensation will not be available under the UK Financial Services Compensation Scheme on its default. The Companies are recognised schemes for the purposes of the Financial Services and Markets Act 2000. Any decision to invest must be based solely on the information contained in the Company’s Prospectus, Key Investor Information Document and the latest half-yearly report and unaudited accounts and/or annual report and audited accounts. Investors should read the fund specific risks in the Key Investor Information Document and the Company’s Prospectus.
Restricted Investors
This document is not, and under no circumstances is to be construed as an advertisement or any other step in furtherance of a public offering of shares in the United States or Canada. This document is not aimed at persons who are resident in the United States, Canada or any province or territory thereof, where the companies/securities are not authorised or registered for distribution and where no prospectus has been filed with any securities commission or regulatory authority. The companies/securities may not be acquired or owned by, or acquired with the assets of, an ERISA Plan.
Index Disclaimers
iSTOXX® FactSet Ageing Population Index , iSTOXX® FactSet Automation & Robotics Index , iSTOXX® FactSet Digitalisation Index and iSTOXX® FactSet Breakthrough Healthcare Index are the intellectual property (including registered trademarks) of STOXX Limited and/or of its licensors (“licensors”), and are used under a licence. The iShares ETFs are not sponsored, subscribed, sold or promoted by STOXX and its licensors and none of them bear any liability in this respect.
© 2018 BlackRock, Inc. All Rights reserved. BLACKROCK, BLACKROCK SOLUTIONS, iSHARES, BUILD ON BLACKROCK, SO WHAT DO I DO WITH MY MONEY and the stylized i logo are registered and unregistered trademarks of BlackRock, Inc. or its subsidiaries in the United States and elsewhere. All other trademarks are those of their respective owners.
Disclaimers
37FOR PROFESSIONAL CLIENTS/QUALIFIED INVESTORS INVESTORS ONLYEII0318E-442750-1399832