MEDACC Demonstration and validation of innovative...
29
www.medacc-life.eu MEDACC Demonstration and validation of innovative methodology for regional climate change adaptation in the Mediterranean area LIFE12 ENV/ES/000536 Start date of project: 1 July 2013 Duration of project: 5 years Description of the demonstrative adaptation measures implemented in the project Due date of deliverable: 31/12/2015 Actual submission date: 31/12/2015 Organization name of lead contractor for this deliverable: IRTA Dissemination level: Public
Transcript of MEDACC Demonstration and validation of innovative...
www.medacc-life.eu
MEDACC
Demonstration and validation of innovative methodology for regional climate change adaptation in
the Mediterranean area
LIFE12 ENV/ES/000536
Start date of project: 1 July 2013
Duration of project: 5 years
Description of the demonstrative adaptation measures implemented in the project
Due date of deliverable: 31/12/2015
Actual submission date: 31/12/2015
Organization name of lead contractor for this deliverable: IRTA
Dissemination level: Public

LIFE12 ENV/ES/000536
2
Authors
Robert Savé, Carme Biel, Inma Funes, Eduard Pla, Diana Pascual
Reference
Robert Savé, Carme Biel, Inma Funes, Eduard Pla, Diana Pascual. Description of the demonstrative adaptation measures implemented in the project. Deliverable 6 linked to the action B2. MEDACC.
Executive summary
This report gives an in deep description of the demonstrative activities developed by the project in the agriculture and forestry sectors. These measures, designed and deployed together with local stakeholders, were implemented by the end of 2014 and beginning 2015. Previous deliverables showed the location of the plots and planned monitoring This deliverable widen the previous information with a detailed description of each pilot experience, including images with the initial and post-treatment situation.

LIFE12 ENV/ES/000536
3
Contents
1. Introduction .................................................................................................................................. 4
2. Agriculture .................................................................................................................................... 4
2.1 Muga Watershed ................................................................................................................... 4
2.2 Ter Watershed ....................................................................................................................... 5
2.3 Segre Watershed .................................................................................................................... 8
3. Forest .......................................................................................................................................... 13
3.1 Muga Watershed ................................................................................................................. 13
3.2 Ter Watershed ..................................................................................................................... 18
3.3 Segre Watershed .................................................................................................................. 24
LIFE12 ENV/ES/000536
4
1. Introduction
One of the main objectives of the Life MEDACC project is to test adaptation measures in water use, agriculture and forest management through demonstrative activities performed in the three watersheds. As a result, the project will innovatively contribute to validate for first time how acting and investing at the present can help the territory to resist impacts of climate change in the future. The demonstrative activities will be performed in different pilot sites representative of the watersheds in terms of major forest and agricultural species and their derived ecological, social and economical value. The objective of these activities is to quantify and demonstrate management strategies making forest and agricultural systems more resilient to climate change. By establishing managed and control test plots, we test different management practices and we compare the development of the vegetation.
The involvement of local stakeholders in the design, performance and monitoring of the demonstrative activities provides relevance and ensures future replicability of the measures, methods and policies in other areas of the watersheds.
2. Agriculture
2.1 Muga Watershed
Daily corn crop potential evapotranspiration (ETc) was calculated in the Muga watershed according to FAO procedure: first, daily potential evapotranspiration (ET0) was calculated using the FAO Penman-Monteith equation using data from weather stations in this area; second, ETc was calculated for the land surface occupied by corn crops in different areas, and a crop coefficient (Kc) modified by crop phenological stage was also calculated. Then, for the land surface occupied by crop, weekly soil water content for two types of soil (with RFU= available soil water mean and high) and real evapotranspiration (Eta, which considers the limitation to ET imposed by actual soil water content) were calculated, recurrently from previous week's soil water content, precipitation and Eta. Then, if ETc was higher than the sum of rainfall and soil water content, then this sum was taken as ETa. Finally, the weekly irrigation needs of the crop was calculated as the difference between ETc and ETa.
Results were sent weekly to the different stakeholders in order to reduce water consumption for each irrigated area (figure 1). Due to this strategy and also due to weather conditions, water requirements for irrigation were reduced 38% in 2014.

LIFE12 ENV/ES/000536
5
Figure 1. Example of recommendation brochure about water needs based onETc FAO calculation for corn crop delivered to farmers within irrigation communities of the Muga watershed alluvial plain.
2.2 Ter Watershed
El Ter watershed has an area of 2,995 km2, with 19% occupied by agriculture. The irrigated surface is 32 390 ha.
Experimental corn plots are located in Pla de Torroella (Girona), lower course Ter watershed, and occupy15,322 m2. Figure 2 shows detailed plots.

LIFE12 ENV/ES/000536
6
Figure 2. Detailed map of experimental plots. Drip (blue polygon) and gravity (green polygon) irrigation systems.
The surfaces used in the assay were 8,510 and 6,812 m2 for the gravity and drip (FLATNET and MINITODY of REGABER) irrigated systems, respectively.
Figure 3. Corn experimental plot.
In both plots of corn established in the Ter watershed (traditional gravity irrigation system and located drip irrigation system) soil water content was measured every four hours at depths of 15, 30 and 45 cm by means of capacitive water sensors. Soil water content was maintained between 0.300 and 0.190 m3/m3.

LIFE12 ENV/ES/000536
7
Figure 4. Time evolution of soil water content (SWC, m3/m3) in drip (left) and gravity (right) irrigated plots
Results showed that located irrigation system reduced the amount of water used in irrigation and increased water use efficiency of corn crop (Table 1).
Table 1. Average values of water supplied and water use efficiency (WUE) of corn crop in both irrigation systems.
Water used (m3/Ha)
WUE (Kg grain/m3)
Drip Gravity Drip Gravity
1.850 3.090 7.470 4.880
Also, both irrigation systems resulted in the same level of nitrates in the soil. Nitrates are a very important pollutant in Catalonia, associated with serious negative effects on groundwater quality.
Figure 5. Average values of nitrate content (%) at different soil depths in drip (red) and gravity (blue) irrigation systems in mid-August 2014.
Daily corn crop potential evapotranspiration (ETc) was calculated, as in Ter watershed, according to FAO procedure: first, daily potential evapotranspiration (ET0) was calculated as usual using the FAO Penman-Monteith equation from the weather stations of this area; second, ETc was calculated for the land surface occupied by the corn crop in different areas and a crop coefficient (Kc) modified by crop phenological stage. Then, for the land surface occupied by crop, weekly soil water content and real evapotranspiration (Eta, which considers the limitation to ET imposed by actual soil water content) were calculated, recurrently from the previous week's soil water content, precipitation and Eta. Then, if ETc was higher than the sum of rainfall and soil water content, then this sum was taken
LIFE12 ENV/ES/000536
8
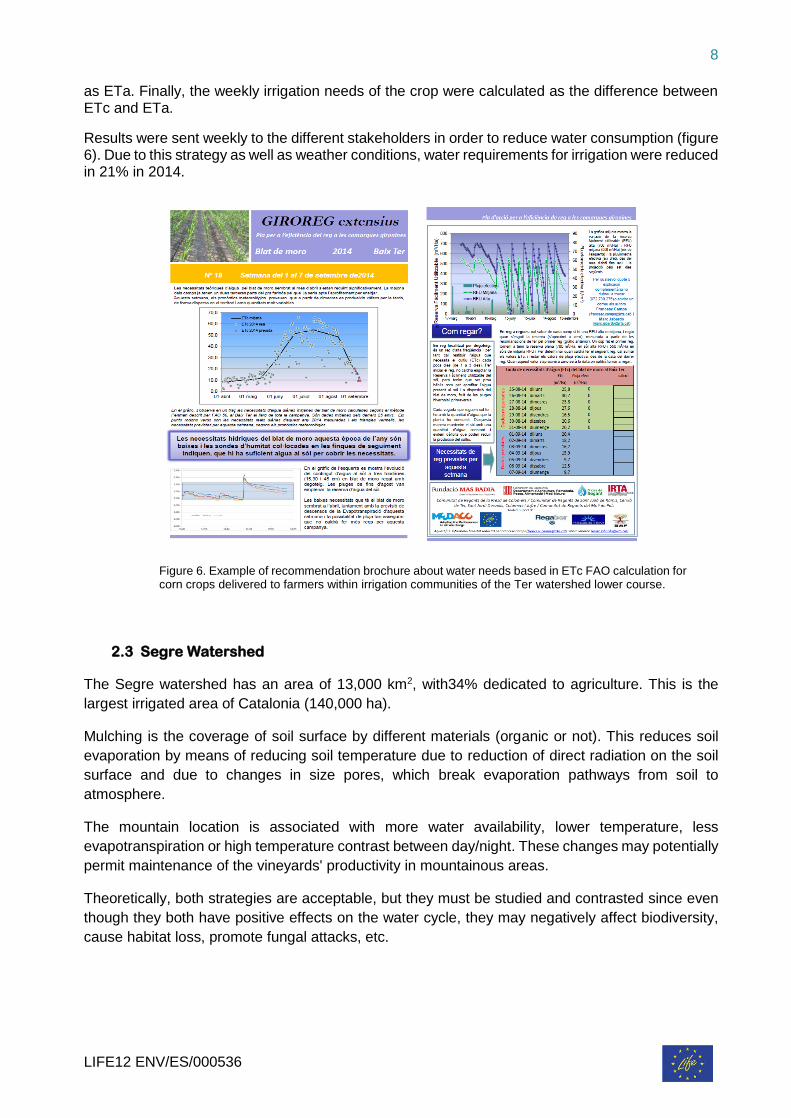
as ETa. Finally, the weekly irrigation needs of the crop were calculated as the difference between ETc and ETa.
Results were sent weekly to the different stakeholders in order to reduce water consumption (figure 6). Due to this strategy as well as weather conditions, water requirements for irrigation were reduced in 21% in 2014.
Figure 6. Example of recommendation brochure about water needs based in ETc FAO calculation for corn crops delivered to farmers within irrigation communities of the Ter watershed lower course.
2.3 Segre Watershed
The Segre watershed has an area of 13,000 km2, with34% dedicated to agriculture. This is the
largest irrigated area of Catalonia (140,000 ha).
Mulching is the coverage of soil surface by different materials (organic or not). This reduces soil
evaporation by means of reducing soil temperature due to reduction of direct radiation on the soil
surface and due to changes in size pores, which break evaporation pathways from soil to
atmosphere.
The mountain location is associated with more water availability, lower temperature, less
evapotranspiration or high temperature contrast between day/night. These changes may potentially
permit maintenance of the vineyards' productivity in mountainous areas.
Theoretically, both strategies are acceptable, but they must be studied and contrasted since even
though they both have positive effects on the water cycle, they may negatively affect biodiversity,
cause habitat loss, promote fungal attacks, etc.

LIFE12 ENV/ES/000536
9
a. Muching assay
The objective of this demonstrative assay is to evaluate the effects of mulching on crop water availability and the effect on productivity.
The assay was established on a 3-year-old vineyard of Cabernet Sauvignon withR110 rootstock, irrigated at a rate of235 mm/year. The crop received a fertilization input of NKP complex.
Experimental plots were located at Raimat (Lleida) and have an area of 3,200 ha. Figure 7 shows detailed plots.
Figure 7. Detailed map of mulching assay plot location.
Figure 8. General views of the mulching assay vineyard plot

LIFE12 ENV/ES/000536
10
Results showed that plants in the mulch treatment have morphological and physiological (cuticular transpiration, relative water content at turgor lost point…) characteristics associated with increased water availability as compared with control plants (Fig. 9 and 10).
Figure 9. Cuticular transpiration (TRc) related to relative water content (RWC) in control (black color) and mulch (green color) treatment.
Figure 10. Relative water content control at turgor lost point (RWCtlp) in control and mulching treatment.
These ecophysiological traits promote beneficial changes in grain, grape, wine properties (berry quality). Some berry quality parameters for both control and mulching treatments are represented in figure 11.
Figure 11. Berry quality parameters: sugar content at 20º BRIX (left), pH (middle) and total tartaric acidity (TTA, g/l) (right). Black color represents average values of control treatment (C) and green color average values of mulching treatment (M).
y = 0.044x2 - 0.053x + 0.018R² = 0.881
y = 0.034x2 - 0.033x + 0.010R² = 0.957
0.000
0.002
0.004
0.006
0.008
0.010
0.012
00.20.40.60.81
TRc
(g·g
-1P
S·m
in-1
)
RWC
a
b
0.70
0.72
0.74
0.76
0.78
0.80
0.82
0.84
0.86
0.88
0.90
Control Mulch
RW
C t
lp (
%)
a
a
21.0
21.1
21.2
21.3
21.4
21.5
21.6
21.7
21.8
21.9
C M
Sugar content
b
a
2.45
2.50
2.55
2.60
C M
pH
b
a
6.6
6.7
6.8
6.9
7
7.1
7.2
7.3
7.4
7.5
C M
TTA
LIFE12 ENV/ES/000536
11
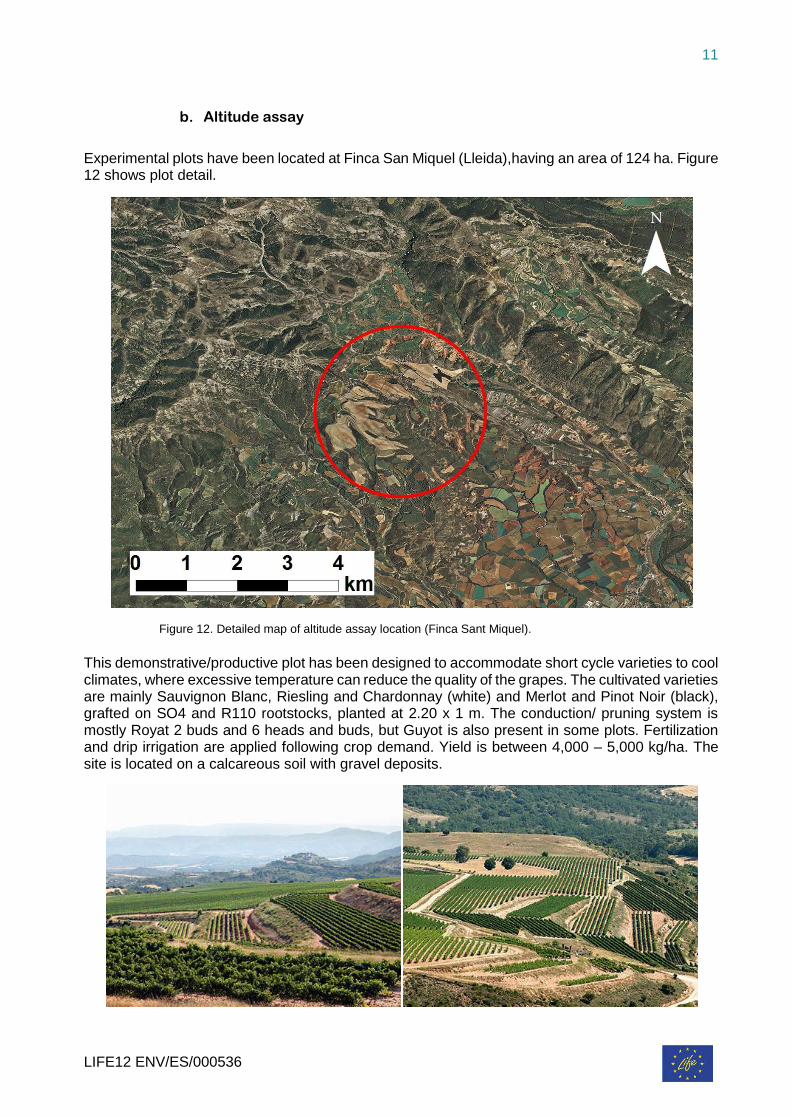
b. Altitude assay
Experimental plots have been located at Finca San Miquel (Lleida),having an area of 124 ha. Figure 12 shows plot detail.
Figure 12. Detailed map of altitude assay location (Finca Sant Miquel).
This demonstrative/productive plot has been designed to accommodate short cycle varieties to cool climates, where excessive temperature can reduce the quality of the grapes. The cultivated varieties are mainly Sauvignon Blanc, Riesling and Chardonnay (white) and Merlot and Pinot Noir (black), grafted on SO4 and R110 rootstocks, planted at 2.20 x 1 m. The conduction/ pruning system is mostly Royat 2 buds and 6 heads and buds, but Guyot is also present in some plots. Fertilization and drip irrigation are applied following crop demand. Yield is between 4,000 – 5,000 kg/ha. The site is located on a calcareous soil with gravel deposits.

LIFE12 ENV/ES/000536
12
Figure 13. Some general views of the altitude assay at San Miquel.
Results show important productive differences between Merlot plots in el Penedes and Tremp, so altitude productivity is 46% lower than in Penedes, also the variability of yield is 29 and 48% in Penedes and Tremp respectively (figure 14). On the other hand low night temperatures are reducing respiration rates and consequently are increasing the total net assimilation rate of vines. Similarly, high day /night temperatures contrast increased anthocyanins concentrations and flavors, which are fresh. Acidity is maintained.
Figure 14. Productivity differences (in kg/ha) from altitude assay

LIFE12 ENV/ES/000536
13
3. Forest
3.1 Muga Watershed
The demonstrative activities in the Muga watershed were implemented in an Holm oak (Quercus ilex) forest in the lower part of the Eastern Pyrenees (Protected Natural Area of l’Albera, Girona province).
Holm oak (Quercus ilex) is the dominant species in the area (80-90% of basal area), with some escort species: cork oak (Quercus suber), oak (Quercus pubescens), Phillyrea angustifolia, Erica arborea, among them. An initial inventory determined that this forest is highly dense (over 2,000 trees/ha) with a basal area of 30 m2/ha and an irregular coppice forest structure.
According to estate owners, the forest has not been managed for the last 80 years (approximate).
The objective of the pilot experiment is to demonstrate and quantify the impacts of management which makes forests less vulnerable to climate change. In the case of the Muga watershed, management practices pursue to reduce the fire risk through the reduction of tree density and the promotion of mature structures with bigger trees and fuel discontinuity. The practices were designed together with local stakeholders, particularly with the public body in charge of forest management (CPF), and with the Centre Tecnològic Forestal de Catalunya (CTFC) according to the adaptive management guidelines compiled in ORGEST (CPF, 2009).
In the selected area, three pilot plots of approximately 1 hectare were implemented (figure 151):
Control plot, with no intervention.
Treatment 1 plot: Application of a selection treatment2 in order to adapt forest to an irregular structure3 and to stimulate forest regeneration. Irregular forests are supposed to preserve better the sol, its quality and nutrients.
Treatment 2 plot: Application of low thinning4 with the objective to adapt the forest to a regular structure5.Regular forests are, in general, more efficient in the water use and in fire prevention.
Figure 16 shows an explanatory diagram of the treatments applied. In the upper diagram, a selective treatment is applied, allowing a higher radiation arrival to the soil. In the lower diagram, a low thinning is applied in order to obtain a regular forest. This treatment implies not only to cut the lower crown trees or poorly formed, but also the understory. Through monitoring, our objective is to see how are the differences in the water content of the soil (HS), the air humidity (HR) and the fire risk.
1 In previous deliverables (Deliverable 5: Describing the location and access to demonstrative activities and Implementation of on-site demonstrative activities and Deliverable 6: Fields protocols) there has been a mistake in the numeration of Muga's demonstrative activities plots. Previously, the named treatment 1 plot of this deliverable has been named as treatment 2 plot, and the opposite with the present treatment 2 plot. The correct numeration of the plots is as explained in the present deliverable.
2Selection treatment: Removal of individual trees of all size classes more or less uniformly throughout the stand, to promote growth of remaining trees and to provide space for regeneration 3 Irregular structure: Forest where trees have different diameters and ages. 4Low thinning: Removal of trees from the lower crown classes, poorly formed or undesirable codominants, to favor those in the upper crown classes. 5 Regular structure: Forest where almost all trees have the same age and diameter.

LIFE12 ENV/ES/000536
14
Figure 15. Plot design in pilot experiment area.
Figure 16. Diagram with a graphical explanation of the treatments applied. In the upper part, the selection treatment (or treatment 1) and in the lower part, the low thinning treatment (treatment 2).

LIFE12 ENV/ES/000536
15
Figure 17 shows the average diametric class distribution for the forest previous to the treatments. The basal area before the treatments was 31 m2/ha for the Holm oak (Quercus ilex) and 5 m2/ha for the escort species. The average forest canopy cover was 80%.
Figure 17. Diametric class distribution of the Holm oak forest and escort species in Requesens (Muga watershed)
Figure 18 shows the main changes in forest structure after the treatments, through changes in stem density and basal area:
Treatment 1: The selection treatment implied a 40-50%-reduction of basal area, causing a higher opening of the forest canopy (leaving a final 60% cover) in order to stimulate resprouting.
Treatment 2: The low thinning has affected primarily the diametric classes 5 and 10, with a thinning intensity of the 15-25% of the basal area. The canopy cover has not been reduced in this treatment in order to prevent resprouting. The thinning has selected 2 or 3 stems per stump.
0
400
800
1200
1600
5 10 15 20 25 30
De
ns
ity (
ste
ms
/ha)
Diametric classes
Quercus ilex
Other species

LIFE12 ENV/ES/000536
16
Figure 18. Average changes in stem density (above) and basal area (below) before and after the treatments T1 and T2 in the Holm oak forest in Requesens (Muga watershed).
Figure 19 includes some pictures of the control plot and each treatment plot.
Control Plot
0
1000
2000
3000
4000
Before treament T1 T2
De
ns
ity (
ste
ms
/ha)
0
10
20
30
40
Before treament T1 T2
Basal are
a (
m2/h
a)

LIFE12 ENV/ES/000536
17
Treatment 1 plot– Selection treatment

LIFE12 ENV/ES/000536
18
Treatment 2 plot– Low thinning
3.2 Ter Watershed
The demonstrative activities in the Ter watershed were implemented in a Scots pine (Pinus sylvestris) forest in the Pyrenean foothills region, specifically, in Montesquiu Castle Park (Protected Natural area).
Scots pine (Pinus sylvestris) is the dominant species in the area. There is also a significant presence of oak (Quercus pubescens) in the understorey. Some escort species: maple (Acer monspessulanum), Crataegus monogyna and Buxus sempervirens, among others. An initial inventory showed a medium-dense forest (over 1000 trees/ha) and a basal area of 20 m2/ha, with a regular structure.
According to park managers, the forest has not managed in the last 30 years (approximate)
The objective of the pilot experiment is to demonstrate and quantify the impacts of management which makes forests less vulnerable to climate change. In the case of the Ter watershed, management practices pursue to improve the tree health containing tree mortality and to evaluate the potential of oak replacement of Scots pine under conditions of climate change. The practices were designed together with local stakeholders, particularly with Park managers (Diputació de Barcelona) under the framework of a CREAF - Diputació de Barcelona Agreement.
In the selected area, four pilot plots of approximately 1 hectare were implemented (figure 20):
Control plot, with no intervention.

LIFE12 ENV/ES/000536
19
Treatment 1plot: Application of understory clearing with the objective to reduce resources competition.
Treatment 2 plot: Application of low thinning and understory clearing with the objective to reduce tree competition. Elimination of escort species and dominant Scots pines.
Treatment 3 plot: Elimination of Scots pine with the objective to accelerate the replacement by oak and evaluate oak's future development.
Figure 20. Plot design in pilot experiment area.
Figure 21 shows the average diametric class distribution for the forest previous to the treatment. Besides, the basal area before the treatments was 21 m2/ha for the Scots pine (Pinus sylvestris), 7 m2/ha for oak (Quercus pubescens) and 3 m2/ha for other escort species. The average forest canopy cover was 65%.

LIFE12 ENV/ES/000536
20
Figure 21. Diametric class distribution of the Scots pine forest and escort species in Montesquiu (Ter watershed)
Figure 22 shows the main changes in forest structure after the treatments, through changes in tree density of the main species and basal area:
Treatment 1: The understory clearing implied a 50%-reduction of basal area of oak and other escort species. Pine trees were not removed.
Treatment 2: The low thinning and understory clearing has represented the total elimination of oak and other escort species. In addition, Scots pine basal area was reduced a 30%.
Treatment 3: This treatment has represented the total elimination of Scots pine and has promoted the escort species maintenance.
0
200
400
600
5 10 15 20 25 30 35 40
Den
sit
y (
tre
es
/ha
)
Diametric classes (cm)
Pinus sylvestris Quercus pubescens
Other species

LIFE12 ENV/ES/000536
21
Figure 22. Average changes in tree density of the main species (above) and basal area (below) after the treatments T1, T2 and T3 in theScots pine forest in Montesquiu (Ter watershed)
Figure 23 includes some pictures of the control plot and each treatment plot.
Control Plot
0
200
400
600
800
Before treatment T1 T2 T3
De
ns
ity (
tre
es
/ha
)
Pinus sylvestris Quercus pubescens
Other species
0
10
20
30
Before treatment T1 T2 T3
Ba
sa
l a
rea
(m
2/h
a)
Pinus sylvestris
Quercus pubescens
Other species

LIFE12 ENV/ES/000536
22
Treatment 1 plot –Understory clearing

LIFE12 ENV/ES/000536
23
Treatment 2 plot - Low thinning and understory clearing
Treatment 3 plot - Elimination of Scots pine

LIFE12 ENV/ES/000536
24
3.3 Segre Watershed
The demonstrative activities in the Segre watershed were implemented in two different European black pine (Pinus nigra) forests in the Pyrenean foothills region, specifically, in the Solsonès region. The forests are called Llobera and Madrona.
European black pine (Pinus nigra) is the dominant species in the area, with a significant presence of oak (Quercus pubescens) in the understorey. Through an initial inventory, it was determined that this is a dense forest (over 2000 trees/ha).
The objective of the pilot experiment is to demonstrate and quantify the impacts of management which makes forests less vulnerable to climate change. In the case of the Segre watershed, management practices pursue to reduce the fire risk and to potentiate trees growth through the reduction of tree competitiveness. The practices were designed together with local stakeholders, particularly with the public body in charge of forest management (CPF), and with the Centre Tecnològic Forestal de Catalunya (CTFC) according to the adaptive management guidelines compiled in ORGEST (CPF, 2009).
These pilot areas are shared between Life+ MEDACC and Life+ Demorgest (leaded by CPF) in order to complement different project approaches in the same pilot areas. This is a valuable fruit of project networking between these two Life+ projects.
In the selected area, six pilot plots (corresponding to different stands) of approximately 1 hectare were implemented (figure 24):
Llobera site:
o Control plot, with no intervention.
o Treatment 1 plot: Application of a selective understory clearing and low thinning.
o Treatment 2 plot: Application of a selective understory clearing and intensive low thinning.
Madrona site
o Control plot, with no intervention.
o Treatment 1 plot: Application of a selective understory clearing
o Treatment 2 plot: Application of a selective understory clearing and intensive low thinning.

LIFE12 ENV/ES/000536
25
Figure 24. Plot design in pilot experiment area.
Table 2 shows some average forest structural variables previous to the treatments in Solsonès region (Segre watershed).
Initial stand
Location Age (yrs)
Density (tree/ha)
Height (m)
Diameter (cm)
Canopy cover (%)
L Llobera 60-80 1700 14 20 >75
S Madrona 80-100 1100 16 25 75
Figure 25 shows the main changes in forest structure in Llobera forest after the treatments, through changes in tree density of the main species and basal area:
Treatment 1: The selective understory clearing and low thinning implied a 10%-reduction of basal area of European black pine
Treatment 2: The selective understory clearing and intensive low thinning implied a 40%-reduction of basal area of European black pine.
The inventory post-treatment has not been performed in the Madrona plots; for this reason, the quantification of the treatments is not given in this report.

LIFE12 ENV/ES/000536
26
Figure 25. Average changes in tree density (above) and basal area (below) after the treatments T1 and T2 in the European black pine forest in Llobera (Segre watershed)
Figure 26 includes some pictures of the control plot and each treatment plot per Llobera forest.
Control Plot
0
600
1200
1800
Before treament T1 T2
De
ns
ity (
tre
es
/ha
)
0
10
20
30
40
Before treament T1 T2
Ba
sa
l A
rea
(m
2/h
a)

LIFE12 ENV/ES/000536
27
Treatment 1 plot - Selective understory clearing and low thinning

LIFE12 ENV/ES/000536
28
Treatment 2 plot - Selective understory clearing and intensive low thinning
Figure 27 includes some pictures of the control plot and each treatment plot per Madrona forest.
Control Plot

LIFE12 ENV/ES/000536
29
Treatment 1 plot - Selective understory clearing and low thinning
Treatment 2 plot - Selective understory clearing and intensive low thinning