Measuring the Extent and Implications of the Director ... · Measuring the Extent and Implications...
35
Measuring the Extent and Implications of Director Interlocking in the Pre-war Japanese Banking Industry * Tetsuji Okazaki ** , Michiru Sawada *** and Kazuki Yokoyama **** Abstract In prewar Japan, many banks were controlled by industrial companies through capital and personal relationships. Those banks are called “organ banks” (kikan ginko). Organ banks engaged in unsound lending to their related companies, which gave damage to the banks’ financial conditions, and consequently made the financial system unstable. This is an accepted view on the financial history in prewar Japan (organ bank hypothesis). However, this view has been based on case studies and casual observations. In this paper we examine the organ bank hypothesis using quantitative data and econometric methodology. To measure the extent of connections between banks and non-banking companies, we compile a comprehensive database of directors and auditors of banks and non- banking companies in 1926. It is found that interlocking of directors and auditors between banks and non-banking companies were very pervasive. More than 80% of ordinary banks had at least one director or auditor who was at the same time a director or auditor of at least one non-banking company. Also, regression analyses confirm that director interlocking had a negative effect on bank performance, especially for small-sized banks. JEL Classification Numbers; G32 ,N25 Key words; Organ bank, Corporate governance, Director interlocking, Related lending 1. Introduction It is well known that the financial system in postwar Japan has been bank-based, and that it has been characterized by the main bank system (Aoki et al [1994]; Hoshi and This paper is a revised version of Okazaki and Yokoyama [2002]. Research supports by the Asian Development Bank Institute (ADBI) and Research Institute of Economy Industry and Trade (RIETI) are gratefully acknowledged. Professor Teranishi and Professor Korenaga kindly provided us with the data set they constructed from Ministry of Finance[1928]. We would like to thank Dr. Chikara, Dr. Chua, Dr. Fujiki, Professor Fujiwara, Professor Fukagawa, Professor Ikeo, Professor Kano, Professor Kasuya, Professor Kitamura, Professor Miyamoto, Professor Montgomery, Professor Nam, Dr. Okina, Professor Saito, Professor M. Sato, Professor Y. Sato, Mr. Shizume, Professor Suehiro, Professor Tanimoto, Professor Woo-Cumings, Professor Watanabe, Dr. Yoshitomi and other participants at the seminars at ADBI, the University of Tokyo, the Bank of Japan and the Financial Services Agency, the Meeting of the Socio-Economic History Society, and the Meeting of the Japan Society of Monetary Economics, for their helpful comments and suggestions. ** The University of Tokyo and RIETI ([email protected].) *** Hitotsubashi University ([email protected] ) 1
-
Upload
truongtuyen -
Category
Documents
-
view
215 -
download
0
Transcript of Measuring the Extent and Implications of the Director ... · Measuring the Extent and Implications...
Measuring the Extent and Implications of Director Interlocking
in the Pre-war Japanese Banking Industry*
Tetsuji Okazaki**, Michiru Sawada*** and Kazuki Yokoyama****
Abstract In prewar Japan, many banks were controlled by industrial companies through capital and personal relationships. Those banks are called “organ banks” (kikan ginko). Organ banks engaged in unsound lending to their related companies, which gave damage to the banks’ financial conditions, and consequently made the financial system unstable. This is an accepted view on the financial history in prewar Japan (organ bank hypothesis). However, this view has been based on case studies and casual observations. In this paper we examine the organ bank hypothesis using quantitative data and econometric methodology. To measure the extent of connections between banks and non-banking companies, we compile a comprehensive database of directors and auditors of banks and non-banking companies in 1926. It is found that interlocking of directors and auditors between banks and non-banking companies were very pervasive. More than 80% of ordinary banks had at least one director or auditor who was at the same time a director or auditor of at least one non-banking company. Also, regression analyses confirm that director interlocking had a negative effect on bank performance, especially for small-sized banks. JEL Classification Numbers; G32 ,N25 Key words; Organ bank, Corporate governance, Director interlocking, Related lending
1. Introduction
It is well known that the financial system in postwar Japan has been bank-based, and that
it has been characterized by the main bank system (Aoki et al [1994]; Hoshi and
This paper is a revised version of Okazaki and Yokoyama [2002]. Research supports by the Asian Development Bank Institute (ADBI) and Research Institute of Economy Industry and Trade (RIETI) are gratefully acknowledged. Professor Teranishi and Professor Korenaga kindly provided us with the data set they constructed from Ministry of Finance[1928]. We would like to thank Dr. Chikara, Dr. Chua, Dr. Fujiki, Professor Fujiwara, Professor Fukagawa, Professor Ikeo, Professor Kano, Professor Kasuya, Professor Kitamura, Professor Miyamoto, Professor Montgomery, Professor Nam, Dr. Okina, Professor Saito, Professor M. Sato, Professor Y. Sato, Mr. Shizume, Professor Suehiro, Professor Tanimoto, Professor Woo-Cumings, Professor Watanabe, Dr. Yoshitomi and other participants at the seminars at ADBI, the University of Tokyo, the Bank of Japan and the Financial Services Agency, the Meeting of the Socio-Economic History Society, and the Meeting of the Japan Society of Monetary Economics, for their helpful comments and suggestions. ** The University of Tokyo and RIETI ([email protected].) *** Hitotsubashi University ([email protected] )
1

Kashyap[2001]). On the other hand, in prewar Japan, most of the industrial investment was
financed by equity, and correspondingly large shareholders played a major role in the corporate
governance (Hoshi and Kashyap[2001]; Okazaki[1999, 2001]). In this sense, basically banks
did not play the role of monitoring industrial companies in prewar Japan. On the contrary,
many banks were controlled by the owners of industrial companies.
Those banks controlled by industrial companies are called “organ banks” (kikan ginko),
and have been regarded as characterizing the prewar Japanese financial system, in the literature
on the Japanese financial history. According to the literature, an organ bank was established to
raise fund for the industrial businesses of the bank founder. Therefore, an organ bank was not
managed for the profit of itself, but rather for the corporate group to which it was affiliated.
Consequently, an organ bank tended to give large amount of loans to small number of industrial
companies connected with the bank founder (Kato[1957]; Murakami [1983]). Also, the organ
bank relationship has been regarded as a basic cause of the Showa Financial Crisis in 1927
(Teranishi[2000]; Takahashi and Morigaki [1968]; Yamazaki[2000]).
On the other hand, recent researches have made clear that this kind of bank-firm
relationship (“related lending”) are widely observed in present developing countries (LaPorta et
al[2003]; Beim and Calomiris[2001]). Furthermore, “insider lending” was prevalent also in US
in the nineteenth century (Lamoreaux[1994]). These facts suggest that the organ bank
relationship in prewar Japan is a part of the universal pattern of financial relationship in less
developed financial market. In this sense, investigating the organ bank relationship can
contribute not only to understanding the Japanese financial history, but also to more general
**** Nagoya City University([email protected])
2
research of the comparative financial systems and the comparative financial history (Allen and
Gale[2000]; Calomiris[2000]; LaPorta et al.[1997]).
As organ bank relationship has been one of the focuses of the researches on the Japanese
financial history, an extensive literature has been published since Kato’s seminal work
(Kato[1957]; Imuta[1966]; Sugiyama[1976]; Ishii[1999]). However, these researches are based
on case studies on small number of banks, and there has been no literature which analyses the
organ bank relationship quantitatively. In fact, we do not have such a basic data as how
pervasive the close bank-firm relationship was in prewar Japan. There is a good reason,
because it is difficult to have data indicating bank-firm relationship in prewar Japan. In this
paper, we identify bank-firm relationship focusing on interlocking of directors and auditors,
based on newly compiled database of directors and auditors of banks and non-banking
companies in 1926. Then, using the interlocking variable, we examine the effect of director
interlocking on bank performance.
The paper is organized as follows. In section 2, the historical background is
summarized. In section 3, we describe the database of directors and auditors, and present basic
findings derived from it. Section 4 presents econometric analyses of the influence of the
interlocking of directors and auditors on bank performance. Section 5 concludes the paper.
2. A Brief Historical Background
The modern history of the banking industry in Japan started in 1872 with the National
Bank Act. The national banks were private banks that were granted the privilege to issue bank
notes. After the revision of the Act in 1876, suspending the convertibility of national bank
3

notes, the number of national banks rapidly increased to be 153, the upper limit prescribed by
the National Bank Act in 1879 (Figure 1). In 1882 the Bank of Japan (BOJ) was established as
the central bank, resulting in a further revision of the National Bank Act that obliged national
banks to convert into ordinary banks within twenty years from their establishment (Asakura
(1988) pp.36-37; Teranishi (1982) pp.35-37).
In 1893, the Bank Act was legislated as a legal framework for ordinary banks, which
brought about a rapid increase of them (Figure 1). In 1901 the number of ordinary banks
approached the peak. While deposits of ordinary banks grew rapidly, the ratio of deposits to
banks’ equity remained low until the early twentieth century (Figure 2). In 1901 equity
accounted for 36% of the total liabilities of ordinary banks. Also, at the beginning of the
twentieth century, ordinary banks heavily depended upon borrowings from the BOJ
(Ishii[1999]). In this sense, the nature of ordinary banks was different from that of the typical
modern bank based on deposits.
The ratio of deposits to the total bank liabilities increased in the 1900s. It was basically
due to a change in the BOJ’s policy. Until 1897, the BOJ generously gave loans to private
banks, and they earned substantial profits from the interest rate spread between borrowings from
the BOJ and loans to non-banking companies. In 1897 the BOJ began direct lending to non-
banking companies, in order to prevent banks from earning profits from the interest rate spread
(Bank of Japan [1983a], p.16). This policy change urged banks to decrease their borrowings
from the BOJ and to collect deposits seriously. At the same time, the number of ordinary banks
began to decrease due to failures and mergers.
4

In the 1910s, the First World War gave a substantial impact on the banking sector, as
well as on the Japanese economy as a whole. In this period, deposits increased rapidly due to
economic growth and an expansionary monetary policy. Consequently, the equity-liabilities
ratios of ordinary banks fell to be less than 20% (Figure 2). In other words, the ordinary banks
in Japan approached to the typical modern banks, at least in terms of the composition of
liabilities .
Meanwhile, during the War boom, many ordinary banks loaned large amounts of fund to
the companies expanding rapidly, especially those in the heavy and the chemical industries. In
many cases, these companies were faced with difficulties when the War ended and international
competition revived, which in turn, made large amount of bank loans non-performing. Because
the equity-liabilities ratio of banks had substantially declined in the 1910s as mentioned above,
the deterioration of the bank assets seriously damaged their financial conditions, which was the
fundamental cause of the instability of the financial system in the 1920s.
Under the bank panic in 1920, many banks, especially small-sized ones, were closed
down. In order to secure the stability of the financial market, the government initiated a reform
of the industrial organization of the banking sector since the early 1920s, imposing regulations
upon entry and promoting mergers (Goto (1991) p.19; Okazaki (2001)). However, the great
earthquake in Tokyo in 1923 further destabilized the financial market. Due to the earthquake,
large amount of the assets that had been collaterals for bank loans, or were expected to generate
cash flows to repay the loans, were destroyed and burnt down.
In 1926, the government decided to take fundamental measures to restructure the
financial system, proposing two draft laws to dispose of the bad loans. However, the Diet
5

opposed these drafts on the ground that they favoured capitalists connected to the government.
In the Diet deliberations, the Minister of Finance made a notorious slip of the tongue concerning
the closure of certain banks, which triggered the Showa Financial Crisis of 1927.
The Showa Financial Crisis was the largest crisis in the financial history of Japan. Forty
five banks were closed due to bank runs. Their share in the total ordinary and savings bank was
2.91% in terms of number, and 9.02% of in terms of deposits. Among them were Jugo Bank and
Taiwan Bank. Jugo Bank was one of the top ten largest banks, and Taiwan Bank was the
central bank of Taiwan. The magnitude of the financial crisis can be measured by the shift of
deposits from banks to the postal bureau. In 1927, while the total outstanding deposits of all
banks decreased, postal deposits increased by 30.1% (Toyo Keizai Shinposha (1991) p.365,
p.401).
One of the basic causes of the crisis has been said to be the organ bank relationship
(Kato[1957]; Takahashi and Morigaki[1968]). There had been no effective regulation on
director interlocking or the maximum loan exposure to a single customer until the Bank Law
enacted in 1928. Hence, non-banking companies could control certain banks to raise fund.1
Comprehensive data on the loans by bank and by borrower are not available, but with respect to
the banks closed in the Showa Financial Crisis, the BOJ recorded the data.
Table1 reports the data of the loans which the closed banks supplied to their related
groups. Panel A, reproducing the calculation of Teranishi [1982], shows that most of the closed
banks engaged in the loans to the related groups connected thorough shareholding and/or
director interlocking. Panel B and C compare the terms and ex post performances between the
1 The Bank Act enacted in 1893, imposed a regulation that loans and discounts of a bank to a single customer should not be more than 10 % of the bank’s capital. However, due to the objections of
6
related loans and the total loans.2 As shown in column 5 and 6 of Panel B, the percentage of
unsecured loans was larger in the related loans than in the total loans. Column 5 and 6 of Panel
C show that the percentage of unrecovered loans was higher in the related loans than in the total
loans. Thus, at least with respect to the banks closed under the Showa Financial Crisis, lending
to related group was likely to be based on some corrupt relationship rather than on the
appropriate financial judgement.3
The Bank Law of 1928 compelled ordinary banks to be joint-stock companies and have
capital not smaller than one million yen.4 Existing banks whose capital was smaller than the
minimum limit, “unqualified banks”, were obliged to clear the criterion within seven years. At
the same time, ordinary banks were prohibited from business other than banking and incidental
businesses. In addition, executive directors and managers of ordinary banks were prohibited
from engaging in other businesses without the approval of the Minister of Finance. These
regulations reflected the perception of the government that the organ bank relationship was a
basic cause of instability of the financial system (Bank of Japan[1983b] pp.273-274).
3. Interlocking between Banks and Non-banking Companies
According to the Ministry of Finance [1928] (Ginkokyoku Nenpo, 1926 issue), the total
population of ordinary banks at the end of 1926 was 1420. With respect to 1402 banks out of
bankers and industrialists, this regulation was removed in 1895 (Patrick[1967]). 2 The total loans subtracted by related loans might not be equal to actual unrelated loan, since we cannot always get the data of loans to all the related groups (shareholders, bank directors, related companies). For example, the data of unsecured related loans of Imabari Shogyo Bank are available only with respect to the groups related to the bank directors. 3 Moreover, we can confirm 13 banks out of 15 banks in Table 1 had director interlocking with non-banking companies from the data of Ginko Kaisha Yoroku. 4 Bank capital was required to be not smaller than two million yen in Tokyo and Osaka, and not smaller than 500,000 yen in towns and villages with a population smaller than ten thousand.
7

the population, complete financial data are available in the Ministry of Finance [1928]. Figure 3
indicates the scale distribution of these banks in terms of [deposit + equity]. The vertical axis
and the horizontal axis denote the logarithm of [deposit + equity] and the rank of banks in terms
of [deposit + equity], respectively. The Herfindahl index of deposit was 0.019, which means
that the market structure of the banking industry was highly competitive in prewar Japan.5
In this section, we will measure the extent of bank-firm connection with respect to
ordinary banks. We approach this task by compiling a comprehensive database of the directors
and auditors of banks and non-banking companies. The data source is Tokyo Koshinjo [1926]
(Ginko Kaisha Youroku, 1926 issue). Tokyo Koshinjo, one of the largest private credit bureaus
in Japan in prewar period, published Ginko Kaisha Youroku, every year from 1897 to 1942. We
use the 1926 issue to see the bank-firm connection just before the Showa Financial Crisis in
1927. The data of 1079 banks are available in this source, 1,007 of which are common to the
above 1402 banks in the Ministry of Finance [1928]. Hereafter, we use these 1007 banks as the
basic samples.
From Tokyo Koshinjo[1926], we can have the names of the directors and auditors of
each bank and non-banking firm whose paid-in capital was larger than twenty thousand yen.
Conveniently, Tokyo Koshinjo[1926] includes the index by person. We identify interlocking
between banks and non-banking companies by the following method. For example, if a person
who was a director of a certain bank was at the same time a director of a certain non-banking
company, we identify that there was one interlock. On the other hand, if a person who was a
5 Okazaki [2002] confirms the competitive market structure of the banking industry, using data of entry and exit.
8
director of a certain bank was at the same time directors of two non-banking companies, we
identify that there were two interlocks.
Panel A of Table 2 summarizes the basic findings. As many as 836 banks, 83.0% of the
total observations, had at least one director or auditor who held at least one position of director
or auditor in a non-banking company. The average number of interlocking positions per bank
was as large as 7.28. Panel A of Table 2 shows the data broken down by position in the non-
banking companies. We classified the positions of directors and auditors into four categories,
namely 1) top executives (president, chairman, etc), 2) executive directors, 3) ordinary directors,
and 4) auditors.6 For example, those banks in which at least one director or auditor had the
position of top executive of a non-banking company, numbered 407, or 40.42 % of the total
observations.
Panel B through E of Table 2 show the data broken down by the position in the bank. In
48.1% of the total observations, the top executives of the banks held at least one position of
director or auditor of non-banking companies, and the average number of interlocks of the
banks’ top executives was 1.48. Meanwhile, the percentage of banks in which at least one
ordinary director had a position of director or auditor of a non-banking company was 68.6 %,
and the average number of interlocks of the banks’ ordinary directors was 3.49. From these
results, we can safely say that most of the ordinary banks were connected with non-banking
companies through the interlocking of directors and auditors.
Table 3 is a breakdown of Panel A of Table 2 by the scale of banks. We split the 1007
observations into three groups in terms of paid in capital following Teranishi (1982). The first
6 Some companies did not have a president or a chairman. In this case, we identified the executive director as the top executive.
9

point to be stressed is that the interlocking of directors and auditors with non-banking
companies was pervasive across the three groups. At the same time, in relative sense,
interlocking with non-banking companies was more pervasive among the large-sized banks.
The percentage of banks with interlocking positions, as well as the average number of
interlocks, was largest in the large-sized group. The situation is the same when we break down
the data by the position in the non-banking companies. In any sub-categories of the data, both
the percentage of banks with interlocking positions and the average number of interlocks were
largest in the large-sized group7. The results derived from our database are striking. More than
80% of the ordinary banks were connected to non-banking companies through the interlocking
of directors and auditors. Moreover, the interlocking was more pervasive in the large-sized
banks. These facts support the conjecture of Kato [1957] concerning the pervasiveness of the
organ bank relationship. However, the interlocking itself does not mean that there was an organ
bank relationship in the sense discussed in section 1. It is necessary to examine in more detail
the nature and influence of the interlocking shown in Tables 2 and 3.
For this purpose, we first look at the cases of the ten banks with the largest numbers of
interlocks, namely Yokohama Koshin Bank (88), Bushu Bank (74), Meiji Bank (67), Yokkaichi
Bank (67), Mitsui Bank (66), Mitsubishi Bank (63), Shimotsuke Chuo Bank (53), Jugo
(51) ,Yasuda Bank (47) and Joshu Bank (43).8 Since it is difficult to check all the individual
cases of interlocking positions, we focus on the interlocking of these banks’ top executives.
7 When we break down the data by position in the bank, the situation is almost the same, while it is not reported. 8 The numbers in parentheses denote the number of interlocks.
10

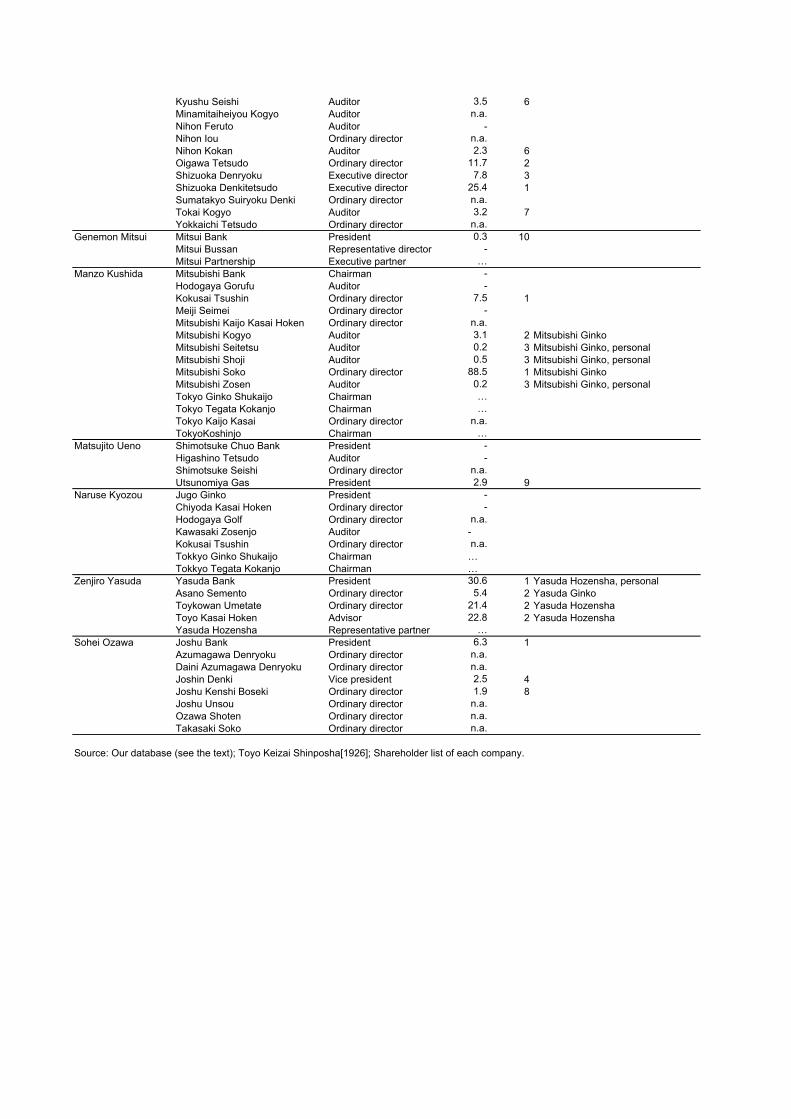
The interlocking positions of these ten banks’ top executives are listed in Table 4. As
the fourth and fifth columns indicate, it is remarkable that seven of the ten banks’ presidents
were large shareholders of these banks. In this sense, the management of those banks was not
separated from ownership. In addition, in many of the cases in which the bank presidents
directed or audited non-banking companies, they were large shareholders of those companies.
As in the banking industry, the management of those non-banking companies was not separated
from ownership. In other words, in many cases the interlocking of directors and auditors was
based on the fact that the banks and non-banking companies shared common large shareholders.
This is consistent with the organ bank hypothesis.
At the same time, this implies that the nature of director interlocking between banks and
non-banking companies in prewar Japan was essentially different from that in the main bank
relationship in postwar Japan.9 In postwar Japan, the main bank, not its shareholders, dispatches
its employees as directors to the borrowing companies to monitor them. In addition,
“contingent governance” is a characteristic of the corporate governance with the main bank
relationship. Contingent governance means that the governance of a company is contingent on
its financial condition. When a company falls into a financial distress, the main bank intervenes
with its management to restructure it, dispatching directors (Aoki, Sheard and Patrick (1994);
Aoki (2001)). In this sense, under the postwar main bank system, the poor financial condition
of a company causes the personal connection with its main bank. On the other hand, Table 4
suggests that this causality was not usual in prewar Japan, because the director interlocking
9 Since dispatched directors usually resign from the bank, the director interlocking we focus on in this paper is not observed in the postwar main bank system.
11
basically reflected the common ownership structure between the banks and non-banking
companies.
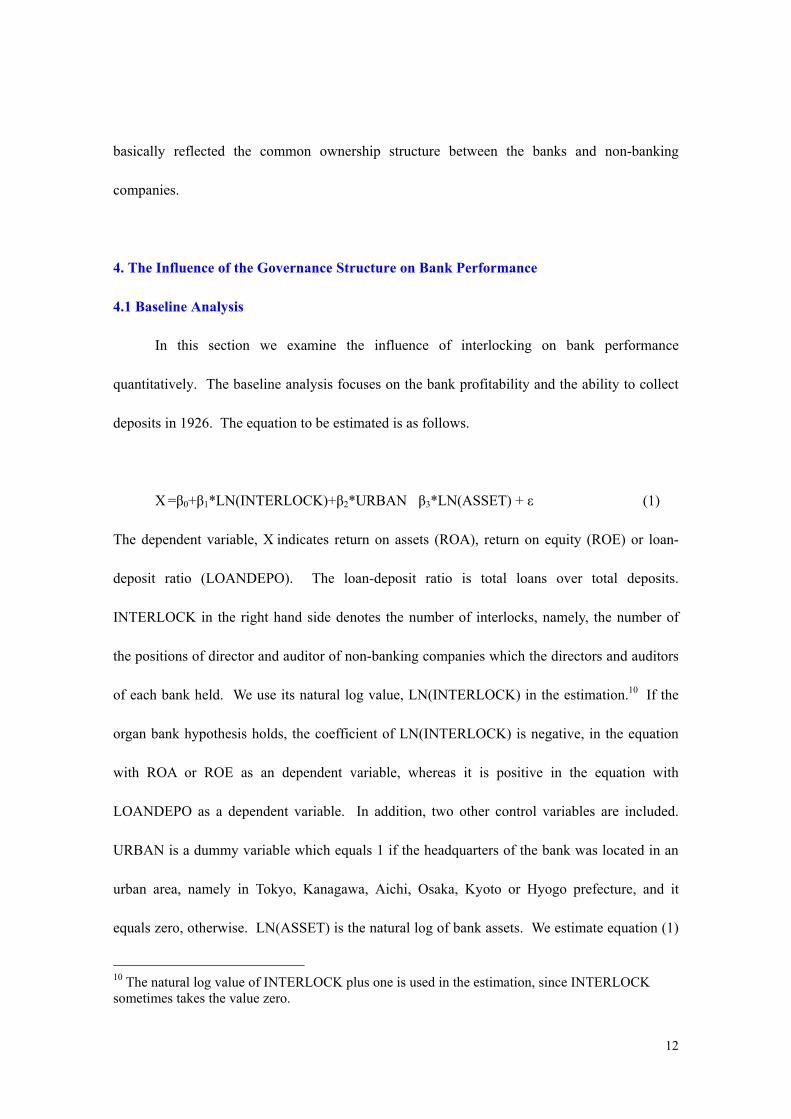
4. The Influence of the Governance Structure on Bank Performance
4.1 Baseline Analysis
In this section we examine the influence of interlocking on bank performance
quantitatively. The baseline analysis focuses on the bank profitability and the ability to collect
deposits in 1926. The equation to be estimated is as follows.
X =β0+β1*LN(INTERLOCK)+β2*URBAN�β3*LN(ASSET) + ε (1)
The dependent variable, X indicates return on assets (ROA), return on equity (ROE) or loan-
deposit ratio (LOANDEPO). The loan-deposit ratio is total loans over total deposits.
INTERLOCK in the right hand side denotes the number of interlocks, namely, the number of
the positions of director and auditor of non-banking companies which the directors and auditors
of each bank held. We use its natural log value, LN(INTERLOCK) in the estimation.10 If the
organ bank hypothesis holds, the coefficient of LN(INTERLOCK) is negative, in the equation
with ROA or ROE as an dependent variable, whereas it is positive in the equation with
LOANDEPO as a dependent variable. In addition, two other control variables are included.
URBAN is a dummy variable which equals 1 if the headquarters of the bank was located in an
urban area, namely in Tokyo, Kanagawa, Aichi, Osaka, Kyoto or Hyogo prefecture, and it
equals zero, otherwise. LN(ASSET) is the natural log of bank assets. We estimate equation (1)
10 The natural log value of INTERLOCK plus one is used in the estimation, since INTERLOCK sometimes takes the value zero.
12

by OLS, in case the dependent variable is LOANDEPO, and estimate it by Tobit, in case the
dependent variable is ROA or ROE, since the profit data available from the Ministry of Finance
(1928) are censored at zero.
On the other hand, it is known that largest banks such as Mitsui, Mitsubishi, Sumitomo,
Yasuda and Daiichi were managed prudently (Kato[1957]). In addition, Shiratori [2002]
pointed out that the connections between banks and non-banking companies through director
interlocking were corrupt particularly in small local banks. Taking these points in account, we
estimate the equations, separating the large and medium-sized banks from small-sized ones. We
expect the negative effect of director interlocking was larger in small-sized banks than in large
and medium-sized banks. In the following analysis, we define small-size banks as ones with
assets of smaller than ten million yen.
Panel A of Table5 presents the estimation results of equation (1). Column 1 through 3
report the results of Tobit estimation with ROA as a dependent variable. Column 1 shows the
result for the all banks. The coefficient of LN(INTERLOCK) is negative and statistically
significant at 5% level, which implies that the banks with interlocking were less profitable.
Column 2 reports the result for large and medium-sized banks. The coefficient of
LN(INTERLOCK) is positive but statistically insignificant, which implies that director
interlocking did not have a negative effect on profitability for large and medium-sized banks.
Column 3 is the result for small-sized banks. The coefficient of LN(INTERLOCK) is negative
and statistically significant at 5% level. Also, the magnitude of the coefficient is larger than that
for all banks. These results indicate that the director interlocking had a negative effect on
profitability especially for small-sized banks. Column 4 through 6 present the Tobit estimates
13

of equation(1) with ROE as a dependent variable. These results are qualitatively similar with
those in case we use ROA as a dependent variable.11
Column 7 to 9 show the OLS estimates of equation (1) with LOANDEPO as a dependent
variable. Column 7 reports the result for all banks. The coefficient of LN(INTERLOCK) is
positive, but it is not statistically significant. Also, if we split the samples into large and
medium-sized banks and small-sized banks, the results are similar (column 8 and 9). The lack
of statistical significance might be due to outliers, because, as shown in Appendix Table1,
LOANDEPO has an extremely high kurtosis(605.9). Hence, we ran additional regressions
eliminating 5 observations which value of loan-deposits ratio is more than 35.5(the mean plus
3*S.D.). The results are shown in Panel B of Table5. As column7 through 9 show, the
coefficient of LN(INTERLOCK) is positive and statistically significant at 1% level.
Furthermore, the effect of the director interlocking was large especially for the small-sized
banks. Meanwhile, the results of ROA and ROE (column1-6) hardly changed from those of
Panel A. Overall, the regression results support the hypothesis that director interlocking has
negative effect on bank performance and it was larger for small-sized banks.
4.2 Robustness Check
There are some potential problems in the baseline analysis. In the following analyses, we
address three potential problems in the baseline analysis and check the robustness of the results.
11 The sign of the coefficient of the asset size is different. One possible interpretation of the difference is the shortage of profitable loan opportunities for large-sized banks, which had larger ability to collected deposits (column 7-9). Takahashi and Morigaki [1968] pointed out that many banks worried about the lack of profitable loan opportunities after the First World War.
14

A. Endogeneity of directors interlocking
First, it is possible that there was the inverse causality. In other words, non-banking
companies might dispatch directors and auditors to the banks with poor performance to rescue
and restructure them. However, there are evidences rejecting the possibility of this inverse
causality. As stated in section 1, many case studies have been done on organ banks. But none
of them report that non-banking companies dispatched directors and auditors to banks in order
to rescue and restructure them.12 Bank of Japan [1928] reports the histories of 20 banks closed
under the Showa Financial Crisis, from establishment to bankruptcy. We can confirm that
twelve banks out of the twenty failed due to more or less unsound lending related with their
directors, and that there was no evidence that the non-banking companies despatched directors
to those banks when performance of them became bad.
These evidences indicate that the inverse causality was not the case, but it might be
useful to deal with the endogeneity problem econometrically. For this purpose, we estimate the
equation (1) by IV, using the age of each bank and prefecture dummies as instrumental
variables.13 Table 6 reports the result of IV estimation. The coefficients of LN(INTERLOCK)
are basically similar to those of the baseline regressions (Table5, Panel A). It is notable that as
shown in column 7 and 9, in the equations with LOANDEPO as a dependent variable, the
coefficients of LN(INTERLOCK) become statistically significant when we use all banks and
12 Shibuya[1975] investigated the causes of 213 bank failures in 1910-1915 using Ginko Jiko Shirabe (Investigation into Bank Accident) by the Ministry of Finance. According to Shibuya[1975], one fourth of the bank failures were related with unsound activities of bank directors. 13 In estimation, we ran two-stage regressions. In the first stage, INTERLOCK was regressed on bank age and prefecture dummies by OLS. In the second stage, we estimate equation (1), replacing INTERLOCK with its predicted value from the first stage. In addition, we also ran the first stage regression by Tobit and negative binominal estimation, instead of OLS, and confirmed that the results for second stage were qualitatively the same as the case we use OLS in the first stage.
15

small-sized banks as samples, and their magnitudes are larger than those in the baseline
regressions.
B. Proxies of the strength of connection between banks and non-banking companies
In the previous analyses, we use the number of director interlocks (INTERLOCK) namely,
the total number of positions of director and auditor in the non-banking companies held by the
directors and auditors of each bank, as the proxy of the strength of connection between banks
and companies. However, this variable might not always be the most appropriate proxy
indicating the strength of connection of banks with non-banking-companies. Therefore, it is
desirable to check robustness of the results using other proxies. We consider two other proxies.
The first candidate is the number of non-banking companies related to each bank through the
director interlocking (FIRM). The second candidate is the number of interlocks per director
(INTDIRC). In other word, we normalize the number of interlocks by the total number of
directors. 14
Table 7 reports the estimation results of equation (1) using these two other proxies in
place of LN(INTERLOCK). Panel A reports the result of estimation, when we replace
LN(INTERLOCK) by the natural log of FIRM (LN(FIRM)).15 It shows that the results are
qualitatively the same as those of the baseline regressions (Table 5, Panel A). Namely, the
negative effect of director interlocking is observed for all banks and small-sized banks,
especially in case the dependent variables are ROA and ROE, whereas it is positive but not
statistically insignificant when the dependent variable is LOANDEPO. Moreover, the results in
14 We also ran regression using the number of interlocks normalized by bank assets and the natural log of bank assets, but the results were qualitatively the same as that of the baseline regression. 15 In estimation, we use LN(FIRM+1).
16
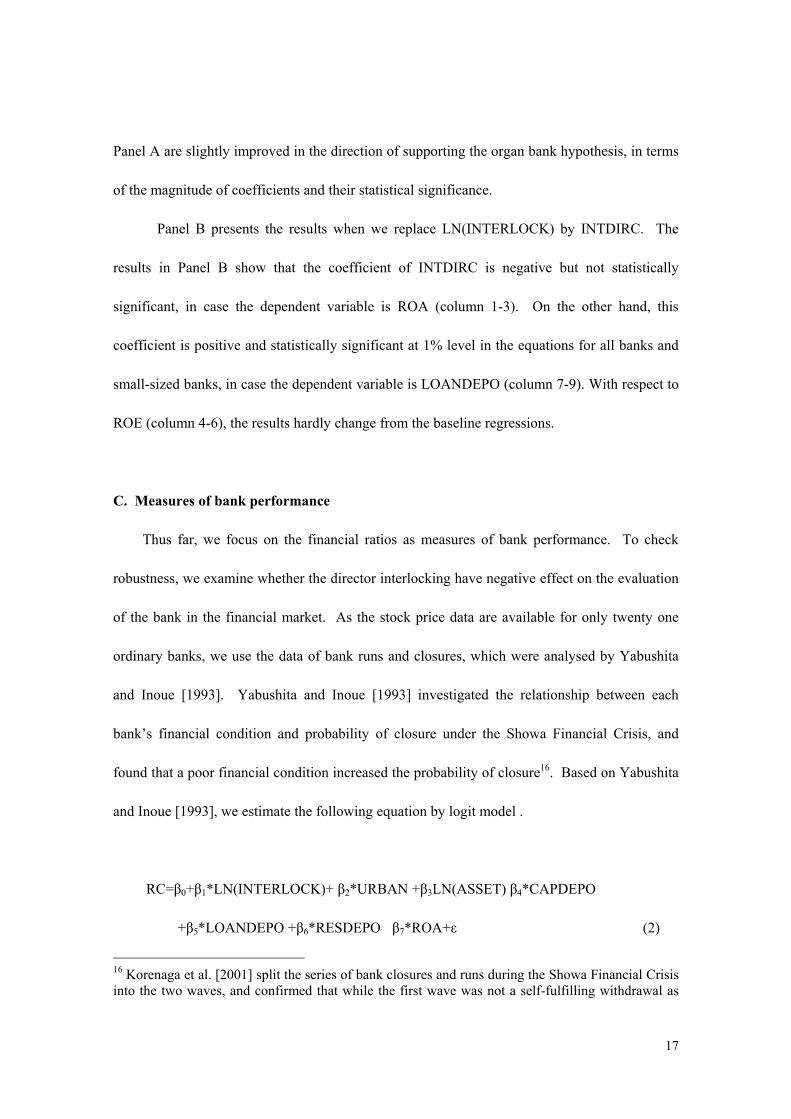
Panel A are slightly improved in the direction of supporting the organ bank hypothesis, in terms
of the magnitude of coefficients and their statistical significance.
Panel B presents the results when we replace LN(INTERLOCK) by INTDIRC. The
results in Panel B show that the coefficient of INTDIRC is negative but not statistically
significant, in case the dependent variable is ROA (column 1-3). On the other hand, this
coefficient is positive and statistically significant at 1% level in the equations for all banks and
small-sized banks, in case the dependent variable is LOANDEPO (column 7-9). With respect to
ROE (column 4-6), the results hardly change from the baseline regressions.
C. Measures of bank performance
Thus far, we focus on the financial ratios as measures of bank performance. To check
robustness, we examine whether the director interlocking have negative effect on the evaluation
of the bank in the financial market. As the stock price data are available for only twenty one
ordinary banks, we use the data of bank runs and closures, which were analysed by Yabushita
and Inoue [1993]. Yabushita and Inoue [1993] investigated the relationship between each
bank’s financial condition and probability of closure under the Showa Financial Crisis, and
found that a poor financial condition increased the probability of closure16. Based on Yabushita
and Inoue [1993], we estimate the following equation by logit model .
RC=β0+β1*LN(INTERLOCK)+ β2*URBAN +β3LN(ASSET) β4*CAPDEPO
+β5*LOANDEPO +β6*RESDEPO�β7*ROA+ε (2)
16 Korenaga et al. [2001] split the series of bank closures and runs during the Showa Financial Crisis into the two waves, and confirmed that while the first wave was not a self-fulfilling withdrawal as
17

The dependent variables, RC, is a dummy variable, which equals 1 if the bank was closed or
faced with a run in the period from 1927 to 1929, and it equals zero, otherwise. 17 CAPDEPO
(RESDEPO) is defined as the book value of capital (reserve) divided by total deposits. The rest
of independent variables are defined in Section 4. The information on bank closures and runs
was collected from various issues of Ginko Jiko Geppo (Monthly Report on the Bank Issue) by
the Bank of Japan, reprinted in the Bank of Japan [1964].
Table 8 reports the results of logit estimation. Column1 and 2 are the results for all banks.
In column 1, the coefficient of LN(INTERLOCK) is positive but not significant.18 Column 2
shows that the coefficient is still statistically insignificant, even if we control for the financial
conditions. On the other hand, the coefficient of the financial ratios are generally consistent
with those of Yabushita and Inoue[1993]. Column3 and 4 reports the results for large and
medium-sized banks. They show that the director interlocking has no effect on the probability
of bank closure or run for large and medium-sized banks. Finally, column 5 and 6 present the
results for small-sized banks. In both cases, the coefficient of LN(INTERLOCK) are positive
and statistically significant, indicating that the director interlocking increased the probability of
closure and run with respect to small-sized banks, which is consistent with our hypothesis.
According to the results of Table 8, director interlocking of the large and medium-sized banks
was not perceived to be unfavourable by the financial market. However, for small-sized-banks,
Yabushita and Inoue[1993] argued, the second wave had an aspect of a self-fulfilling withdrawal. 17Unlike Yabushita and Inoue[1993], we focus not only on bank closures under the Showa Financial Crisis in 1927, but also on bank closures and runs in the ordinary years (1928 and 1929) in order to capture the evaluation of the financial market broadly. 18 We ran additional regressions eliminating LN(ASSET) from independent variables following Yabushita and Inoue[1993]. In this case, the coefficient of LN(INTERLOCK) is positive and statistically significant at 5% or 1% level.
18
director interlocking was evaluated as negative information, in addition to the poor financial
condition.19
5. Concluding Remarks
More than forty years ago, Kato [1957] proposed the organ bank hypothesis, which has
become one of the most basic hypotheses on the Japanese financial history, and it was
consistent with looting view recently proposed (LaPorta et al.[2003]). In this paper, we
examined the organ bank hypothesis, using quantitative data econometric methodology.
First, we compiled a comprehensive database of directors and auditors of banks and non-
banking companies, based on the 1926 issue of Ginko Kaisha Yoroku (Tokyo Koshinjo [1926]).
Using the database we identified the interlocking of directors and auditors between banks and
non-banking companies, and found that interlocking was quite pervasive in the 1920s. In more
than 80% of ordinary banks, at least one director or auditor had at least one position of director
or auditor of a non-banking company, and the average number of interlocks per bank was as
large as 7.28. In addition, interlocking with non-banking companies was universal in the
banking industry across the scale.
Second, using the interlocking variables, we examined the influence of interlocking on
bank performance. Through regression analyses, we confirm that the director interlocking had a
negative effect on bank performance (profitability and ability to collect deposits), and this effect
was serious especially for small-sized banks. Furthermore, it was confirmed that interlocking
19 The similar results were obtained, even if we replaced LN(INTERLOCK) with LN(FIRM) or INTDIRC
19

increased the probability of closures and runs for small-sized banks, which implies that the
financial market negatively evaluated interlocking in small-sized banks.
In sum, business practices in the prewar Japanese banking industry, based on the
connections of directors and auditors, made the banking system unsound and unstable. These
findings support the organ bank hypothesis and the view that the prewar Japanese banking
system suffered from looting.
References
Allen, F. and D. Gale. 2000, Comparing Financial systems, Cambridge, MA: MIT Press.
Aoki, M. (2001), Towards A Comparative Institutional Analysis, Cambridge, MA: MIT Press.
Aoki, M., P. Sheard, and H. Patrick. 1994. “The Japanese Main Bank System: An Introductory
Overview,” in M. Aoki and H. Patrick eds., The Japanese Main Bank System: Its Relevance
for Developing and Transforming Economies, New York: Oxford University Press.
Asakura, K. 1988. Shinpen Nihon Kin’yu Shi (Japanese Financial History: New Edition),
Tokyo: Nihon Keizai Hyoronsha.
Bank of Japan. 1928. “Sho Kyugyo Ginko no Hatan Genin oyobi sono Seiri, (Causes and
Liquidation of the Failed Banks)” in Bank of Japan ed. Nihon Kin’yushi Shiryo (Materials
on Japanese Financial History) Showa edition, vol. 24, Printing Bureau of the Ministry of
Finance, 1969.
Bank of Japan 1964, “Ginko Jiko Geppo (Monthly Report Bank Issue)” in Bank of Japan ed.
Nihon Kin’ yu shi Shiryo (Material on the Japanese Financial History) Showa edition, Vol.
9, Printing Bureau of the Ministry of Finance.
20

Bank of Japan. 1983a. Nihon Ginko Hyakunen Shi (100 Years History of the Bank of Japan),
Vol.2, Tokyo: Bank of Japan.
Bank of Japan. 1983b. Nihon Ginko Hyakunen Shi (100 Years History of the Bank of Japan),
Vol.3, Tokyo: Bank of Japan.
Beim, D. and C. Calomiris. 2001, Emerging Financial Markets, Irwin/Mac-Graw Hill.
Calomiris, C. 2000, U.S.Bank Deleguration in Historical Perspective, New York, Cambridge
University Press.
Goto, S. 1970. Nihon no Kin’yu Tokei (Financial Statistics of Japan), Tokyo: Toyo Keizai
Shinposha
Goto, S. 1991. Ginko Godo no Jisshoteki Kenkyu (Empirical Studies on Bank Mergers), Tokyo:
Nihon Keizai Hyoronsha.
Hoshi, T. and A. Kashyap. (2001), Corporate financing and Governance in Japan, Cambridge,
MA:MIT Press.
Ishii, K. 1999. “Hyaku Sanju Ginko to Matsumoto Jutaro,” (Hyaku Sanju Bank and Jutaro
Mastumoto) in K. Ishii, Kindai Nihon Kin’yu Shi Josetsu, (Towards the Modern Financial
History of Japan), Tokyo: The University of Tokyo Press.
Imuta, T. 1966. “Shohyo: Kazuo Shibagaki, Nihon Kin’yu Shihon Bunseki,” (Book Review of
Kazuo Shibagaki’s Analysis of the Japanese Financial Capital,” Keizaigaku Zasshi (Osaka
Municipal University), vol.54-2.
Kato, T. 1957. Honpo Ginkoshi Ron (History of Banks in Japan), Tokyo: The University of
Tokyo Press.
21

Korenage,T., T. Nagase, and J. Teranishi. 2001 “1927 nen Kin’yu Kyoko kano Yokin Toritsuke
Ginko Kyugyo nikansuru Suryo Bunseki,(The quantitative analysis about bank closures
and runs under the Showa Financial Crisis)” Keizai Kenkyu Vol.52 pp315-332
Lamoreaux, N. 1994. Insider Lending: Banks, Personal Connections, and Economic
Development in Industrial New England, New York, Cambridge Ubiversity Press
LaPorta, R. 1997, “Legal Determinants of External Finance,” Journal of Finance, vol.52-3,
pp.1131-50
LaPorta,R., F. Lopez-Silanes, G. Zamarrip. 2003, “Related Lending”. Quarterly Journal of
Economics 118 p231-268.
Ministry of Finance. 1928. Ginkokyoku Nenpo (Year Book of the Bank Bureau of the Ministry of
Finance) 1926 issue.
Murakami, H. 1983. “Futsu Ginko,” (Ordinary Banks), in T. Kato (ed.) Nihon Kin’yu Ron no
Shiteki Tenkai (History of Research on the Japanese Financial System), Tokyo: The
University of Tokyo Press.
Okazaki, T. 1999. Mochikabu Gaisha no Rekishi (History of Holding Companies in Japan),
Tokyo: Chikuma Shobo.
Okazaki, T. 2001. “The Role of Holding Companies in Pre-war Japanese Economic
Development: Rethinking Zaibatsu in the Perspective of Corporate Governance,”
forthcoming in Social Science Japan.
Okazaki, T.2002 “Ginkogyo niokeru Kigyo Tota to Keiei no Koritsusei,” (Selection, Exits and
Efficiency in the Japanese Banking Industry: An Historical Perspective), in M. Saito ed.
Kin’yu Shhisutemu no Saisei (Revival of the Financial System), Chuo Keizaisha
22
Okazaki,T., and K. Yokoyama. 2002, Measuring the Extent and Implications of Director
Interlocking in the Pre-war Japanese Banking Industry. ADB Institute Research Paper 39
Center For International Research On Japanese Economy Discussion Paper Series F-138.
Patrick, H. 1967. “ Japan, 1968-1914” in Rondo Cameron(eds.) Baking in the Early Stage of
industrialization. A Comparative Study, New York: Oxford University Press.
Shibuya, R. 1975. “Ginko Jiko Shirabe Kaidai: Bibliographical introduction to Investigation
into Bank Accident,” Keizaigaku Ronshu (Komazawa University).
Shiratori, T. 2002, “1920 Nendai niokeru Ginko Kisei no Keisei” (The Formation of
Regulations of Bank Management in the 1920s), Keiei Shigaku 36-3, 25-50
Sugiyama, K. 1976. “Gomeigaisha Mitsui Ginko no Kikan Ginko teki Seikaku,” (Attributes of
the Organ Bank observed in Mitsui Bank,) in T. Ouchi (ed.), Gendai Kin’yu
(Contemporary Finance).
Takahashi K. and W. Morigaki, 1968. Showa Kinyu Kyoko Shi (History of the Showa Financial
Crisis), Tokyo.
Teranishi, J. 1982. Nihon no Keizai Hatten to Kin’yu (Japanese Economic Development and
Finance), Tokyo: Iwanami Shoten.
Teranishi, J. 2000. “The Fall of the Taisho Economic System” in Aoki, M. and G. R.
Saxonhouse eds., Finance, Governance, and Competitiveness in Japan, Oxford: Oxford
University Press, 2000.
Tokyo Koshinjo 1926. Ginko Kaisha Yakuinroku (Directory of the Banks and Firms Directors
of Japan), 1926 issue, Tokyo: Tokyo Kishinjo.
Toyo Keizai Shinposha 1926. Kabushiki Gaisha Nenkan, vol.4, (Year Book of Joint-stock
Companies), Tokyo: Toyo Keizai Shinposha.
23

Toyo Keizai Shinposha 1991. Kanketsu Showa Kokusei Soran (Final Version of the Collected
Statistics of the Showa Era), Vol.2, Tokyo: Toyo Keizai Shinposha.
Yamazaki, H. 2000. Showa Kin’yu Kyoko (The Showa Financial Crisis) Tokyo: Toyo Keizai
Shiposha.
Yabushita, S. and A. Inoue. 1993. “The Stability of the Japanese Banking System: A Historical
Perspective,” Journal of the Japanese and International Economies, vol.7-4.
Appendix: Variable Definitions
INTERLOCK: The number of interlocks. That is, the total number of the positions of directors
and auditors of non-banking companies, held by the directors and auditors of each bank.
FIRM: The number of the non-banking firms connected with the bank through director
interlocking.
INTDIRC: The number of interlocks per director. That is, INTERLOCK divided by the number
of directors.
ASSET: The book value of capital plus deposits. Capital is the sum of paid-in capital, reserved
fund and profit
URBAN: Dummy variable which equals 1, if the bank’s head office was located in Tokyo,
Kanagawa, Aichi, Osaka, Kyoto, or Hyogo prefecture, and 0, otherwise.
ROA: Ratio of profit to ASSET. Profit is the profit of the second half of the fiscal year,
multiplied by two.
ROE: Ratio of profit to the book value of capital. The profit is the profit of the second half of
the fiscal year, multiplied by two.
24

25
LOANDEPO: Ratio of total loans to total deposits.
RESDEPO: Ratio of reserve for repaying deposits to total deposits.
CAPDEPO: Ratio of the book value of capital to total deposits.
RC: Dummy variable which equals to 1, if the bank was closed or faced with run in 1927-1929,
and 0 otherwise.
AGE: 1926 minus the year when the bank was established.

Table1 Composition of the loans of the banks closed under the Showa Financial Crisis (1927)
Panel A Size of the loans to related groupsPercentage of loans to related group
Bank Name Capital ASSET �Directors(million Yen) (million Yen)
Imabari Shogyo 2.50 17.5 - 28.7 -Tokushima 0.70 8.6 9.7 30.9Tokyo Watanabe 2.00 40.4 36.1Nakai 5.00 53.0 2.8 - -Murai 5.13 68.6 25.8 - -Souda 2.50 24.2 9.2 - 31.1Nakazawa 1.25 10.3 23.0 - 71.4Hachijuyon 2.30 20.9 - 18.9 -Toukatsu 0.40 2.4 - 30.2 -Dai Rokujugo 6.25 36.3 22.5 5.9 -Kurita 0.80 7.5 - 22.9 -Oumi 9.38 147.2 - 7.7 -Nishi Ehara 0.40 3.1 - 16.4 -Jugo 49.75 450.6 35.8 4.5 34.0Kasen 0.25 2.1 -
Panel B Comparison of the loan terms between related loans and total bank loans Total bank loans(thousand yen) Unsecured Ratio(%)
Imabari Shogyo 3,566 4,435 8,378 17,270 80.4 48.5Tokushima - - - - - -Tokyo Watanabe - - - - - -Nakai - - - - - -Murai - - - - - -Souda 7,324 9,543 16,512 23,668 76.7 69.8Nakazawa 10,158 11,509 10,378 12,176 88.3 85.2Hachijuyon - - - - - -Toukatsu 396 415 934 1,372 95.5 68.1Dai Rokujugo - - - - - -Kurita 751 1,209 1,718 5,920 62.1 29.0Oumi - - - - - -Nishi Ehara 400 440 1,021 2,679 90.9 38.1Jugo - - - - - -Kasen - - - - - -Total 22,596 27,551 38,941 63,085 82.0 61.7
Panel C Comparison of the loan performances between relate loans and total bank loansRelated Loans(thousand yen) Total bank loans(thousand yen) Unrecovered Ratio(%)
Imabari Shogyo 1,978 5,636 4,122 17,270 35.1% 23.9%Tokushima 352 832 1,127 2,694 42.3% 41.8%Tokyo Watanabe - - - - - -Nakai - - - - - -Murai 13,383 16,293 36,820 63,213 82.1% 58.2%Souda 8,206 9,544 16,263 23,668 86.0% 68.7%Nakazawa 10,896 11,509 11,032 12,176 94.7% 90.6%Hachijuyon 3,096 3,296 8,957 17,441 93.9% 51.4%Toukatsu - - - - - -Dai Rokujugo - - - - - -Kurita - - - - - -Oumi - - - - - -Nishi Ehara - - - - - -Jugo - - - - - -Kasen 445 804 489 1,642 55.3% 29.8%Total 38,356 47,914 78,811 138,104 80.1% 57.1%
Source: Bank of Japan[1964] and Teranishi[1982].
Total bank loans Related loans Total bank
loans
�Shareholders �Related companies
37.7
49.0
Related Loans(thousand yen)
Related loans Total bank loans
Uurecovered Loans
All related loans
Uurecovered Loans
Total bank loans
Unse�ured loans
All related loans
Unse�ured loans

Panel A: ALL directors and auditors of 1007 banksTotal 836 83.0 7332 7.28Top executive 407 40.4 967 0.96Executive directors 158 15.7 208 0.21Ordinary directors 753 74.8 4170 4.14Auditors 637 63.3 1987 1.97
Panel B: Top executive of 1007 banksTotal 484 48.1 1493 1.48Top executive 176 17.5 285 0.28Executive directors 27 2.7 31 0.03Ordinary directors 365 36.2 844 0.84Auditors 204 20.3 333 0.33
Panel C: Executive directors of 1007 banksTotal 205 20.4 531 0.53Top executive 30 3.0 45 0.04Executive directors 17 1.7 20 0.02Ordinary directors 149 14.8 284 0.28Auditors 115 11.4 182 0.18
Panel D: Ordinary directors of 1007 banksTotal 691 68.6 3513 3.49Top executive 239 23.7 428 0.43Executive directors 80 7.9 94 0.09Ordinary directors 589 58.5 2080 2.07Auditors 425 42.2 911 0.90
Panel E: Auditors of 1007 banksTotal 526 52.2 1795 1.78Top executive 132 13.1 209 0.21Executive directors 57 5.7 63 0.06Ordinary directors 420 41.7 962 0.96Auditors 303 30.1 561 0.56
Source: See the text.
Average per bank
Table 2 Interlocking of directors and auditors between banks and non-banking companies
Position in the non-banking companies
Number of banks with interlocking
Ratio to all banks
Number of cases of interlocking

Total 1,007 836 83.0 7.28Total 0-1million yen 789 624 79.1 4.76
1-10million yen 198 192 97.0 14.7010million yen- 20 20 100.0 33.25
Top executive Total 1,007 407 40.4 0.960-1million yen 789 247 31.3 0.581-10million yen 198 140 70.7 2.0310million yen- 20 20 100.0 5.50Total 1,007 158 15.7 0.21
Executive directors 0-1million yen 789 85 10.8 0.141-10million yen 198 62 31.3 0.4310million yen- 20 11 55.0 0.80Total 1,007 753 74.8 4.14
Ordinary directors 0-1million yen 789 545 69.1 2.781-10million yen 198 188 94.9 8.2310million yen- 20 20 100.0 17.25Total 1,007 637 63.3 1.97
Auditors 0-1million yen 789 442 56.0 1.261-10million yen 198 175 88.4 4.0210million yen- 20 20 100.0 9.70
Source: See the text.
Table 3 Interlocking of directors and auditors between banks and non-banking company by scale of banks
Position in the non-banking companies
Classes by paid in capital
Number of observations
Number of banks with interlocking
Ratio to all banks
Average per bank

Table 4 Interlocking and shareholding of the top executives of the selective banks
Name Company Name Position Share of the stocks(%)
Ranking Remarks
Tomitaro hara Yokohama Koshin Bank President 9.8 2Hara Partnership President …Ikeda Seishi Ordinary director n.a.Nihon Yusen Ordinary director -Nikka Sanshi Ordinary director 1.2 4Taisho Kaijo Kasai Ordinary director 1.0 4Toyo Seitetsu Auditor -Yokohama Kasai Kaijo Hoken Ordinary director 4.6 5Yokohama Seimei Hoken Auditor -
Heizaburo Okawa Bushu Bank President 2.8 1 Okawa PartnershipAsano Semento Ordinary director 4.5 3 Okawa PartnershipChosen Saitan Ordinary director n.a.Chosen Denki Kogyo Auditor 1.0 1 Okawa PartnershipChosen Tetsudo Auditor 1.6 7 Okawa PartnershipChuoh Seishi President n.a.Dainihon Jidosha Ordinary director n.a.Enkaishu Mokuzai Ordinary director n.a.Fuji Seishi President 5.9 2 Okawa PartnershipHojo Tanko Ordinary director n.a.Hokkaido Dento Ordinary director 36.0 1 Fuji Seishi, personalIshiwata Sureto Auditor 1.0 8Joto Denki Kido President 3.4 4 Okawa PartnershipKarafuto Kisen President 32.5 1 Karafuto Kogyo, Okawa PartnershipKarafuto Kogyo President 7.2 1 Okawa PartnershipKarafuto Seishigenryo Chairman n.a.Karafuto Tetsudo Ordinary director 53.8 1 Fuji Seishi, personalKeihin Unga Ordinary director 0.8 8 Okawa PartnershipKumamoto Denki Ordinary director 6.1 3 Karafuto Kogyo, Okawa PartnershipKumamoto Denki Kido President 23.0 1 Karafuto Kogyo, Okawa PartnershipKyodo Parupu Ordinary director n.a.Kyushu Seishi President 12.1 1 Okawa PartnershipNakanoshima Seishi Ordinary director 3.7 5 Okawa PartnershipNihon Feruto Ordinary director 30.8 1 Fuji Seishi, Karafuto KogyoNihon Kakou Seishi Ordinary director n.a.Nihon Kokan President 4.6 3 Okawa PartnershipNihon Konkurito Kogyo Ordinary director 1.0 9Nihon Sakusan Seizo Ordinary director n.a.Ninju Seimei Ordinary director -Nisshi Tankou Kisen Ordinary director n.a.Okawa Partnership Representative partner …Okawa Tanaka Jimusho President n.a.Oryokuko Seishi Vice Chairman 28.8 2 Karafuto Kogyo, Okawa PartnershipOsaka Hoteru Ordinary director 2.5 4 Okawa PartnershipOshima Seikojo President 4.2 4 Okawa PartnershipOtaki Kozan Ordinary director n.a.Seibu Tetsudo Ordinary director 2.2 3 Okawa PartnershipShizuoka Denki Tetsudo President 1.2 10 Okawa PartnershipShizuoka Denryoku President 38.5 1 Personal, Okawa PartnershipTeikoku Jinzo Hiryo Ordinary director -Toho Tanko Ordinary director n.a.Tokai Kogyo President 3.8 6 Okawa PartnershipTokyo Chika Tetsudo Ordinary director 1.5 5Tokyo Kanaami Ordinary director 26.0 1 Fuji Seishi, Karafuto KogyoTokyowan Umetate Executive director 5.4 4 Okawa PartnershipToyo Kisen Ordinary director 1.1 3 Okawa Partnership
Shigehiko Ikoma Meiji Bank President 1.5 3Nagoya Hoteru Ordinary director n.a.
Kazue Kumazawa Yokkaichi Bank President 11.2 1Daido Unso Auditor n.a.Daido Yoshiten Auditor -Dainihon Jidosha Ordinary director n.a.Daitai Ringyo President 28.3 1Fuji Seishi Ordinary director 1.2 9Hattori Seisakujo Auditor 8.0 5Hojo Tanko Auditor n.a.Hokkaido Dento Auditor -Karafuto Kisen Ordinary director 2.8 6Karafuto Kogyo Auditor 1.7 8Kumamoto Denki Kido Ordinary director 3.3 5
Kyushu Seishi Auditor 3.5 6Minamitaiheiyou Kogyo Auditor n.a.Nihon Feruto Auditor -Nihon Iou Ordinary director n.a.Nihon Kokan Auditor 2.3 6Oigawa Tetsudo Ordinary director 11.7 2Shizuoka Denryoku Executive director 7.8 3Shizuoka Denkitetsudo Executive director 25.4 1Sumatakyo Suiryoku Denki Ordinary director n.a.Tokai Kogyo Auditor 3.2 7Yokkaichi Tetsudo Ordinary director n.a.
Genemon Mitsui Mitsui Bank President 0.3 10Mitsui Bussan Representative director -Mitsui Partnership Executive partner …
Manzo Kushida Mitsubishi Bank Chairman -Hodogaya Gorufu Auditor -Kokusai Tsushin Ordinary director 7.5 1Meiji Seimei Ordinary director -Mitsubishi Kaijo Kasai Hoken Ordinary director n.a.Mitsubishi Kogyo Auditor 3.1 2 Mitsubishi GinkoMitsubishi Seitetsu Auditor 0.2 3 Mitsubishi Ginko, personalMitsubishi Shoji Auditor 0.5 3 Mitsubishi Ginko, personalMitsubishi Soko Ordinary director 88.5 1 Mitsubishi GinkoMitsubishi Zosen Auditor 0.2 3 Mitsubishi Ginko, personalTokyo Ginko Shukaijo Chairman …Tokyo Tegata Kokanjo Chairman …Tokyo Kaijo Kasai Ordinary director n.a.TokyoKoshinjo Chairman …
Matsujito Ueno Shimotsuke Chuo Bank President -Higashino Tetsudo Auditor -Shimotsuke Seishi Ordinary director n.a.Utsunomiya Gas President 2.9 9
Naruse Kyozou Jugo Ginko President -Chiyoda Kasai Hoken Ordinary director -Hodogaya Golf Ordinary director n.a.Kawasaki Zosenjo Auditor -Kokusai Tsushin Ordinary director n.a.Tokkyo Ginko Shukaijo Chairman …Tokkyo Tegata Kokanjo Chairman …
Zenjiro Yasuda Yasuda Bank President 30.6 1 Yasuda Hozensha, personalAsano Semento Ordinary director 5.4 2 Yasuda GinkoToykowan Umetate Ordinary director 21.4 2 Yasuda HozenshaToyo Kasai Hoken Advisor 22.8 2 Yasuda HozenshaYasuda Hozensha Representative partner …
Sohei Ozawa Joshu Bank President 6.3 1Azumagawa Denryoku Ordinary director n.a.Daini Azumagawa Denryoku Ordinary director n.a.Joshin Denki Vice president 2.5 4Joshu Kenshi Boseki Ordinary director 1.9 8Joshu Unsou Ordinary director n.a.Ozawa Shoten Ordinary director n.a.Takasaki Soko Ordinary director n.a.
Source: Our database (see the text); Toyo Keizai Shinposha[1926]; Shareholder list of each company.
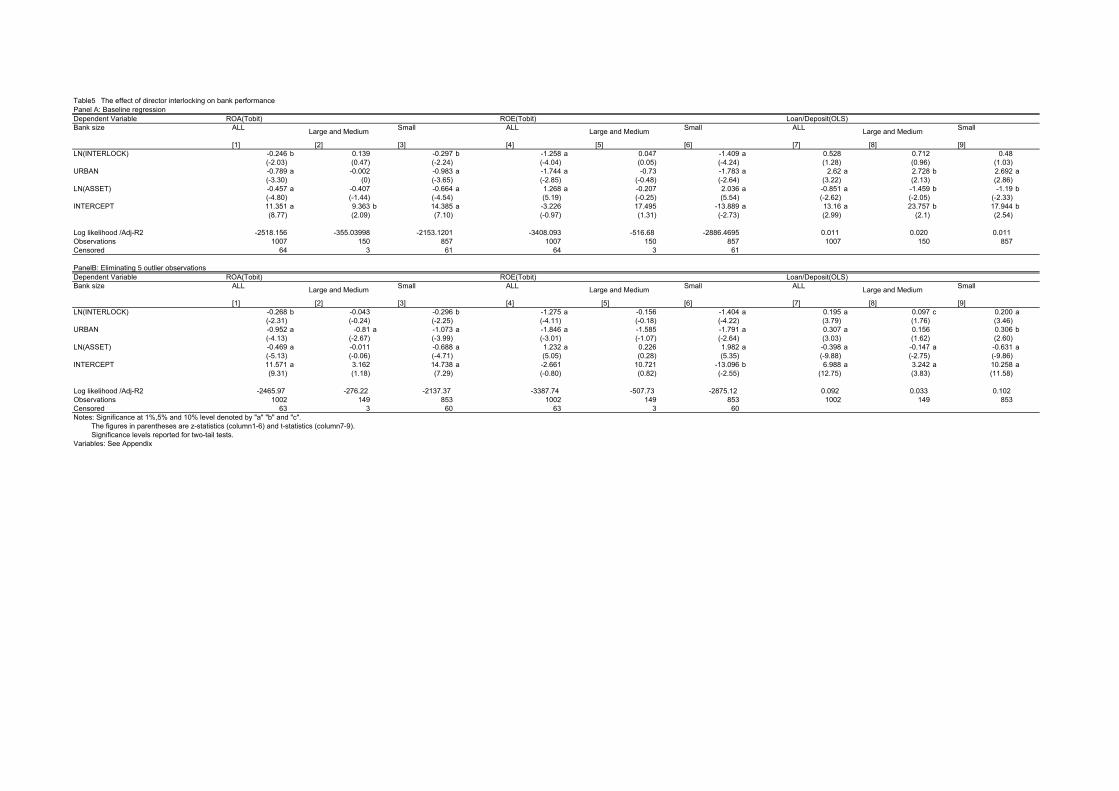
Table5�The effect of director interlocking on bank performancePanel A: Baseline regressionDependent Variable ROA(Tobit) ROE(Tobit) Loan/Deposit(OLS)Bank size ALL Small ALL Small ALL Small
[1] [2] [3] [4] [5] [6] [7] [8] [9]LN(INTERLOCK) -0.246 b 0.139 -0.297 b -1.258 a 0.047 -1.409 a 0.528 0.712 0.48
(-2.03) (0.47) (-2.24) (-4.04) (0.05) (-4.24) (1.28) (0.96) (1.03)URBAN -0.789 a -0.002 -0.983 a -1.744 a -0.73 -1.783 a 2.62 a 2.728 b 2.692 a
(-3.30) (0) (-3.65) (-2.85) (-0.48) (-2.64) (3.22) (2.13) (2.86)LN(ASSET) -0.457 a -0.407 -0.664 a 1.268 a -0.207 2.036 a -0.851 a -1.459 b -1.19 b
(-4.80) (-1.44) (-4.54) (5.19) (-0.25) (5.54) (-2.62) (-2.05) (-2.33)INTERCEPT 11.351 a 9.363 b 14.385 a -3.226 17.495 -13.889 a 13.16 a 23.757 b 17.944 b
(8.77) (2.09) (7.10) (-0.97) (1.31) (-2.73) (2.99) (2.1) (2.54)
Log likelihood /Adj-R2 -2518.156 -355.03998 -2153.1201 -3408.093 -516.68 -2886.4695 0.011 0.020 0.011Observations 1007 150 857 1007 150 857 1007 150 857Censored 64 3 61 64 3 61
PanelB: Eliminating 5 outlier observationsDependent Variable ROA(Tobit) ROE(Tobit) Loan/Deposit(OLS)Bank size ALL Small ALL Small ALL Small
[1] [2] [3] [4] [5] [6] [7] [8] [9]LN(INTERLOCK) -0.268 b -0.043 -0.296 b -1.275 a -0.156 -1.404 a 0.195 a 0.097 c 0.200 a
(-2.31) (-0.24) (-2.25) (-4.11) (-0.18) (-4.22) (3.79) (1.76) (3.46)URBAN -0.952 a -0.81 a -1.073 a -1.846 a -1.585 -1.791 a 0.307 a 0.156 0.306 b
(-4.13) (-2.67) (-3.99) (-3.01) (-1.07) (-2.64) (3.03) (1.62) (2.60)LN(ASSET) -0.469 a -0.011 -0.688 a 1.232 a 0.226 1.982 a -0.398 a -0.147 a -0.631 a
(-5.13) (-0.06) (-4.71) (5.05) (0.28) (5.35) (-9.88) (-2.75) (-9.86)INTERCEPT 11.571 a 3.162 14.738 a -2.661 10.721 -13.096 b 6.988 a 3.242 a 10.258 a
(9.31) (1.18) (7.29) (-0.80) (0.82) (-2.55) (12.75) (3.83) (11.58)
Log likelihood /Adj-R2 -2465.97 -276.22 -2137.37 -3387.74 -507.73 -2875.12 0.092 0.033 0.102Observations 1002 149 853 1002 149 853 1002 149 853Censored 63 3 60 63 3 60Notes: Significance at 1%,5% and 10% level denoted by "a" "b" and "c". The figures in parentheses are z-statistics (column1-6) and t-statistics (column7-9). Significance levels reported for two-tail tests.Variables: See Appendix
Large and Medium Large and Medium Large and Medium
Large and Medium Large and Medium Large and Medium
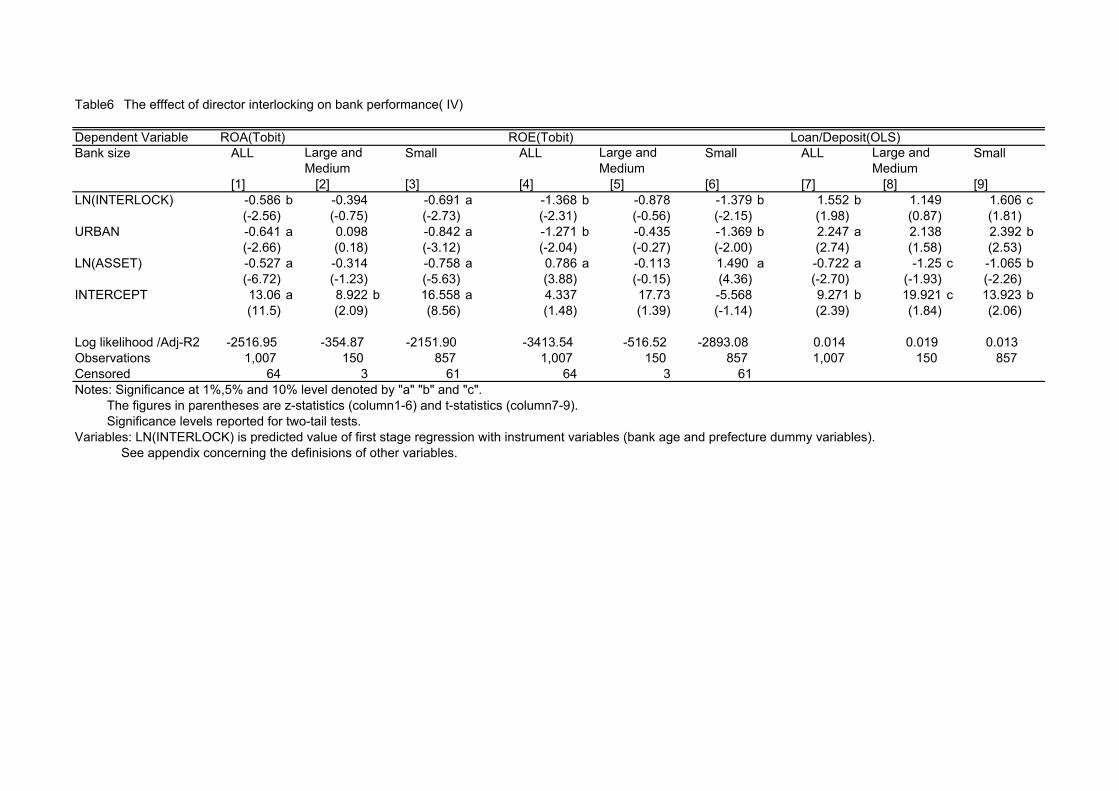
Table6�The efffect of director interlocking on bank performance( IV)
Dependent Variable ROA(Tobit) ROE(Tobit) Loan/Deposit(OLS)Bank size ALL Small ALL Small ALL Small
[1] [2] [3] [4] [5] [6] [7] [8] [9]LN(INTERLOCK) -0.586 b -0.394 -0.691 a -1.368 b -0.878 -1.379 b 1.552 b 1.149 1.606 c
(-2.56) (-0.75) (-2.73) (-2.31) (-0.56) (-2.15) (1.98) (0.87) (1.81)URBAN -0.641 a 0.098 -0.842 a -1.271 b -0.435 -1.369 b 2.247 a 2.138 2.392 b
(-2.66) (0.18) (-3.12) (-2.04) (-0.27) (-2.00) (2.74) (1.58) (2.53)LN(ASSET) -0.527 a -0.314 -0.758 a 0.786 a -0.113 1.490 a -0.722 a -1.25 c -1.065 b
(-6.72) (-1.23) (-5.63) (3.88) (-0.15) (4.36) (-2.70) (-1.93) (-2.26)INTERCEPT 13.06 a 8.922 b 16.558 a 4.337 17.73 -5.568 9.271 b 19.921 c 13.923 b
(11.5) (2.09) (8.56) (1.48) (1.39) (-1.14) (2.39) (1.84) (2.06)
Log likelihood /Adj-R2 -2516.95 -354.87 -2151.90 -3413.54 -516.52 -2893.08 0.014 0.019 0.013Observations 1,007 150 857 1,007 150 857 1,007 150 857Censored 64 3 61 64 3 61Notes: Significance at 1%,5% and 10% level denoted by "a" "b" and "c". The figures in parentheses are z-statistics (column1-6) and t-statistics (column7-9). Significance levels reported for two-tail tests.Variables: LN(INTERLOCK) is predicted value of first stage regression with instrument variables (bank age and prefecture dummy variables). See appendix concerning the definisions of other variables.
Large and Medium
Large and Medium
Large and Medium
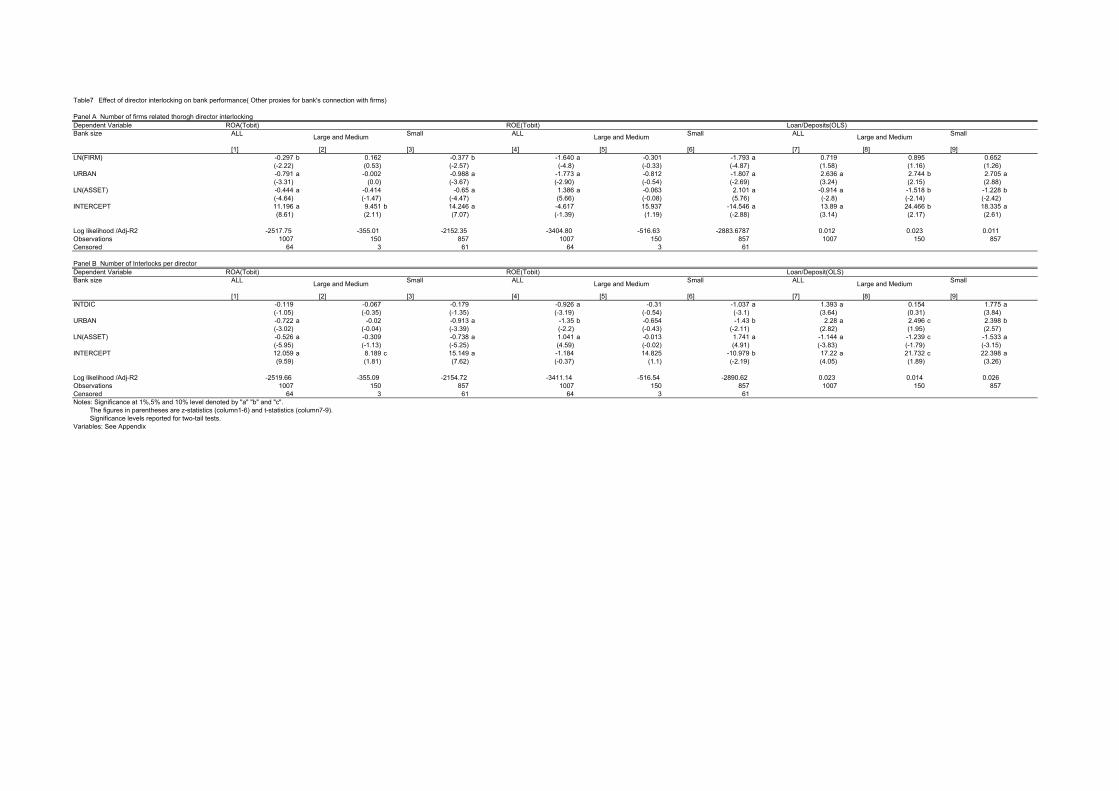
Table7�Effect of director interlocking on bank performance( Other proxies for bank's connection with firms)
Panel A Number of firms related thorogh director interlockingDependent Variable ROA(Tobit) ROE(Tobit) Loan/Deposits(OLS)Bank size ALL Small ALL Small ALL Small
[1] [2] [3] [4] [5] [6] [7] [8] [9]LN(FIRM) -0.297 b 0.162 -0.377 b -1.640 a -0.301 -1.793 a 0.719 0.895 0.652
(-2.22) (0.53) (-2.57) (-4.8) (-0.33) (-4.87) (1.58) (1.16) (1.26)URBAN -0.791 a -0.002 -0.988 a -1.773 a -0.812 -1.807 a 2.636 a 2.744 b 2.705 a
(-3.31) (0.0) (-3.67) (-2.90) (-0.54) (-2.69) (3.24) (2.15) (2.88)LN(ASSET) -0.444 a -0.414 -0.65 a 1.386 a -0.063 2.101 a -0.914 a -1.518 b -1.228 b
(-4.64) (-1.47) (-4.47) (5.66) (-0.08) (5.76) (-2.8) (-2.14) (-2.42)INTERCEPT 11.196 a 9.451 b 14.246 a -4.617 15.937 -14.546 a 13.89 a 24.466 b 18.335 a
(8.61) (2.11) (7.07) (-1.39) (1.19) (-2.88) (3.14) (2.17) (2.61)
Log likelihood /Adj-R2 -2517.75 -355.01 -2152.35 -3404.80 -516.63 -2883.6787 0.012 0.023 0.011Observations 1007 150 857 1007 150 857 1007 150 857Censored 64 3 61 64 3 61
Panel B Number of Interlocks per directorDependent Variable ROA(Tobit) ROE(Tobit) Loan/Deposit(OLS)Bank size ALL Small ALL Small ALL Small
[1] [2] [3] [4] [5] [6] [7] [8] [9]INTDIC -0.119 -0.067 -0.179 -0.926 a -0.31 -1.037 a 1.393 a 0.154 1.775 a
(-1.05) (-0.35) (-1.35) (-3.19) (-0.54) (-3.1) (3.64) (0.31) (3.84)URBAN -0.722 a -0.02 -0.913 a -1.35 b -0.654 -1.43 b 2.28 a 2.496 c 2.398 b
(-3.02) (-0.04) (-3.39) (-2.2) (-0.43) (-2.11) (2.82) (1.95) (2.57)LN(ASSET) -0.526 a -0.309 -0.738 a 1.041 a -0.013 1.741 a -1.144 a -1.239 c -1.533 a
(-5.95) (-1.13) (-5.25) (4.59) (-0.02) (4.91) (-3.83) (-1.79) (-3.15)INTERCEPT 12.059 a 8.189 c 15.149 a -1.184 14.825 -10.979 b 17.22 a 21.732 c 22.398 a
(9.59) (1.81) (7.62) (-0.37) (1.1) (-2.19) (4.05) (1.89) (3.26)
Log likelihood /Adj-R2 -2519.66 -355.09 -2154.72 -3411.14 -516.54 -2890.62 0.023 0.014 0.026Observations 1007 150 857 1007 150 857 1007 150 857Censored 64 3 61 64 3 61Notes: Significance at 1%,5% and 10% level denoted by "a" "b" and "c". The figures in parentheses are z-statistics (column1-6) and t-statistics (column7-9). Significance levels reported for two-tail tests.Variables: See Appendix
Large and Medium Large and Medium Large and Medium
Large and Medium Large and Medium Large and Medium

Table8�Logit estimation of bank closure and bank run
Bank size ALL Large and Medium Small[1] [2] [3] [4] [5] [6]
LN(INTERLOCK) 0.211 0.248 -0.23 -0.234 0.329 c 0.391 b(1.33) (1.55) (-0.67) (-0.66) (1.82) (2.13)
URBAN 0.399 0.361 1.294 b 1.158 c 0.146 0.122(1.43) (1.26) (2.21) (1.88) (0.43) (0.35)
LN(ASSET) 0.329 a 0.099 0.25 0.235 0.945 a 0.576 b(3.06) (0.81) (0.88) (0.81) (4.30) (2.35)
ROA -0.213 a -0.204 -0.222 b(-2.59) (-0.73) (-2.48)
LOANDEPO 0.075 b 0.078 0.061(2.00) (0.72) (1.44)
CAPDEPO -1.518 -1.034 -1.235 c(-2.47) b (-0.55) (-1.85)
RESDEPO -1.097 -0.62 -1.529(-0.8) (-0.13) (-1.06)
INTERCEPT -8.112 a -3.302 c -6.3 -5.244 -17.214 a -10.437 c(-5.58) (-1.84) (-1.43) (-1.15) (-5.42) (-2.85)
Log likelihood -231.207 -218.65 -52.241 -51.36 -168.976 -160.085Pseudo R2 0.071 0.122 0.084 0.099 0.100 0.148Observations 1007 1007 150 150 857 857
Notes: Significance at 1%,5% and 10% level denoted by "a" "b" and "c". The figures in parentheses are z-statistics. Significance levels reported for two-tail tests.Variables: See Appendix
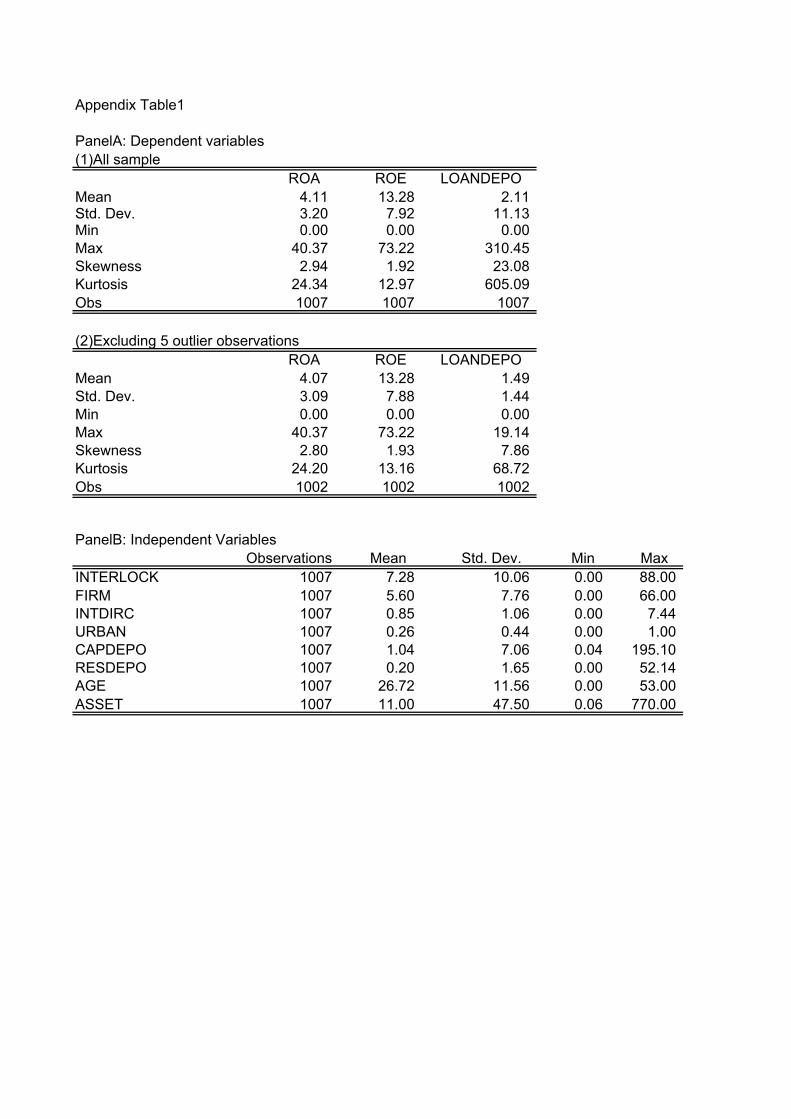
Appendix Table1
PanelA: Dependent variables(1)All sample
ROA ROE LOANDEPOMean 4.11 13.28 2.11Std. Dev. 3.20 7.92 11.13Min 0.00 0.00 0.00Max 40.37 73.22 310.45Skewness 2.94 1.92 23.08Kurtosis 24.34 12.97 605.09Obs 1007 1007 1007
(2)Excluding 5 outlier observationsROA ROE LOANDEPO
Mean 4.07 13.28 1.49Std. Dev. 3.09 7.88 1.44Min 0.00 0.00 0.00Max 40.37 73.22 19.14Skewness 2.80 1.93 7.86Kurtosis 24.20 13.16 68.72Obs 1002 1002 1002
PanelB: Independent VariablesObservations Mean Std. Dev. Min Max
INTERLOCK 1007 7.28 10.06 0.00 88.00FIRM 1007 5.60 7.76 0.00 66.00INTDIRC 1007 0.85 1.06 0.00 7.44URBAN 1007 0.26 0.44 0.00 1.00CAPDEPO 1007 1.04 7.06 0.04 195.10RESDEPO 1007 0.20 1.65 0.00 52.14AGE 1007 26.72 11.56 0.00 53.00ASSET 1007 11.00 47.50 0.06 770.00