Measurement of the Extent of Testing - Cem Kaner · Measuring the Extent of Testing Copyright ©...
36
Measuring the Extent of Testing Copyright © 2000. Cem Kaner. All rights reserved. Page 1 Measurement of the Extent of Testing Invited Address Pacific Northwest Software Quality Conference Portland, Oregon October 17, 2000 Acknowledgment Much of the material in this paper was presented or developed by the participants of the Software Test Managers Roundtable (STMR) and the Los Altos Workshop on Software Testing (LAWST). • STMR 1 (October 3, November 1, 1999) focused on the question, How to deal with too many projects and not enough staff? Participants included Jim Bampos, Sue Bartlett, Jennifer Brock, David Gelperin, Payson Hall, George Hamblen, Mark Harding, Elisabeth Hendrickson, Kathy Iberle, Herb Isenberg, Jim Kandler, Cem Kaner, Brian Lawrence, Fran McKain, Steve Tolman and Jim Williams. • STMR 2 (April 30, May 1, 2000) focused on the topic, Measuring the extent of testing. Participants included James Bach, Jim Bampos, Bernie Berger, Jennifer Brock, Dorothy Graham, George Hamblen, Kathy Iberle, Jim Kandler, Cem Kaner, Brian Lawrence, Fran McKain, and Steve Tolman. • LAWST 8 (December 4-5, 1999) focused on Measurement. Participants included Chris Agruss, James Bach, Jaya Carl, Rochelle Grober, Payson Hall, Elisabeth Hendrickson, Doug Hoffman, III, Bob Johnson, Mark Johnson, Cem Kaner, Brian Lawrence, Brian Marick, Hung Nguyen, Bret Pettichord, Melora Svoboda, and Scott Vernon. Facilities and other support for STMR were provided by Software Quality Engineering, which hosts these meetings in conjunction with the STAR conferences. Facilities for LAWST were provided by the University of California (Extension) Santa Cruz. Background At PNSQC a year ago, I spoke with you about problems inherent in software measurement, and described a framework for developing and evaluating measures (Kaner, 1999). Similar approaches have been laid out by other authors on software measurement (Kitchenham, Pfleeger, & Fenton, 1995; Zuse, 1997) and in other fields, such as physics (see, e.g. Sydenham, Hancock & Thorn, 1989) and psychometrics (see, e.g. Allen & Yen, 1979). My point of departure from the traditional software measurement literature is in the extent to which I ask (a) whether commonly used measures are valid, (b) how we can tell, and (c) what kinds of side effects are
Transcript of Measurement of the Extent of Testing - Cem Kaner · Measuring the Extent of Testing Copyright ©...

Measuring the Extent of Testing Copyright © 2000. Cem Kaner. All rights reserved. Page 1
Measurement of the Extent of Testing
Invited Address
Pacific Northwest Software Quality Conference
Portland, Oregon
October 17, 2000
Acknowledgment
Much of the material in this paper was presented or developed by the participants of the Software TestManagers Roundtable (STMR) and the Los Altos Workshop on Software Testing (LAWST).
• STMR 1 (October 3, November 1, 1999) focused on the question, How to deal with too manyprojects and not enough staff? Participants included Jim Bampos, Sue Bartlett, Jennifer Brock,David Gelperin, Payson Hall, George Hamblen, Mark Harding, Elisabeth Hendrickson, KathyIberle, Herb Isenberg, Jim Kandler, Cem Kaner, Brian Lawrence, Fran McKain, Steve Tolmanand Jim Williams.
• STMR 2 (April 30, May 1, 2000) focused on the topic, Measuring the extent of testing.Participants included James Bach, Jim Bampos, Bernie Berger, Jennifer Brock, Dorothy Graham,George Hamblen, Kathy Iberle, Jim Kandler, Cem Kaner, Brian Lawrence, Fran McKain, andSteve Tolman.
• LAWST 8 (December 4-5, 1999) focused on Measurement. Participants included Chris Agruss,James Bach, Jaya Carl, Rochelle Grober, Payson Hall, Elisabeth Hendrickson, Doug Hoffman,III, Bob Johnson, Mark Johnson, Cem Kaner, Brian Lawrence, Brian Marick, Hung Nguyen, BretPettichord, Melora Svoboda, and Scott Vernon.
Facilities and other support for STMR were provided by Software Quality Engineering, which hosts thesemeetings in conjunction with the STAR conferences. Facilities for LAWST were provided by theUniversity of California (Extension) Santa Cruz.
Background
At PNSQC a year ago, I spoke with you about problems inherent in software measurement, and describeda framework for developing and evaluating measures (Kaner, 1999). Similar approaches have been laidout by other authors on software measurement (Kitchenham, Pfleeger, & Fenton, 1995; Zuse, 1997) andin other fields, such as physics (see, e.g. Sydenham, Hancock & Thorn, 1989) and psychometrics (see,e.g. Allen & Yen, 1979).
My point of departure from the traditional software measurement literature is in the extent to which I ask(a) whether commonly used measures are valid, (b) how we can tell, and (c) what kinds of side effects are
Measuring the Extent of Testing Copyright © 2000. Cem Kaner. All rights reserved. Page 2
we likely to encounter if we use a measure? Even though many authors mention these issues, I don’t thinkthey’ve been explored in enough depth and I don’t think that many of us are thoughtfully enough facingthe risks associated with using a poor software measure (Austin, 1996; Hoffman, 2000).
Developing a valid, useful measure is not easy. It takes time, combined with theoretical and empiricalwork. In Kaner (1999), I provided detailed examples from the history of psychophysics to illustrate thedevelopment of a field’s measures over a 100-year period.
The most common question that has come to me in response to that paper (Kaner, 1999) is what measuresI think are valid and useful. I don’t have a simple answer to that, but I can report on some work inprogress regarding measurement of the extent of testing of a product. This paper is a progress report,based primarily on the work of colleagues who manage software test groups or consult to test managers. Itdescribes some of the data they collect and how they report it to others.
Some of the material in this paper will be immediately useful to some readers, but the point of the paper isnot to present finished work. I’m still at the stage of collecting and sifting ideas, looking for commonthreads and themes, trying to get a better idea of the question that we intend when we ask how to measurehow much testing has been done, and to understand the possible dimensions of an answer to such aquestion.
There’s an enormous amount of detail in this paper and you might get lost. Here’s the one thing that Iwould most like you to take away from the paper:
Bug count metrics reflect only a small part of the work and progressof the testing group. Many alternatives look more closely at whathas to be done and what has been done. These will often be more
useful and less prone to side effects than bug count metrics.
The Measurement Framework
To evaluate any proposed measure (or metric), I propose that we ask the following ten questions. Foradditional details, see Kaner (1999):
1. What is the purpose of this measure? Some measures are used on a confidential basis betweenfriends. The goal is to spot trends, and perhaps to follow those up with additional investigation,coaching, or exploration of new techniques. A measure used only for this purpose can be useful andsafe even if it is relatively weak and indirect. Higher standards must apply as the measurementsbecome more public or as consequences (rewards or punishments) become attached to them.
2. What is the scope of this measure? Circumstances differ across groups, projects, managers,companies, countries. The wider the range of situations and people you want to cover with themethod, the wider the range of issues that can invalidate or be impacted by the measure.
3. What attribute are we trying to measure? If you only have a fuzzy idea of what you are trying tomeasure, your measure will probably bear only a fuzzy relationship to whatever you had in mind.
4. What is the natural scale of the attribute? We might measure a table’s length in inches, butwhat units should we use for extent of testing?

Measuring the Extent of Testing Copyright © 2000. Cem Kaner. All rights reserved. Page 3
5. What is the natural variability of the attribute? If you measure two supposedly identicaltables, their lengths are probably slightly different. Similarly, your weight varies a little bitfrom day to day. What are the inherent sources of variation of “extent of testing”?
6. What instrument are we using to measure the attribute and what reading do we take from theinstrument? You might measure length with a ruler and come up with a reading (a measurement) of 6inches.
7. What is the natural scale of the instrument? Fenton & Pfleeger (1997) discuss this is detail.
8. What is the natural variability of the readings? This is normally studied in terms of“measurement error.”
9. What is the relationship of the attribute to the instrument? What mechanism causes an increase inthe reading as a function of an increase in the attribute? If we increase the attribute by 20%, what willshow up in the next measurement? Will we see a 20% increase? Any increase?
10. What are the natural and foreseeable side effects of using this instrument? If we change ourcircumstances or behavior in order to improve the measured result, what impact are we going to haveon the attribute? Will a 20% increase in our measurement imply a 20% improvement in theunderlying attribute? Can we change our behavior in a way that optimizes the measured result butwithout improving the underlying attribute at all? What else will we affect when we do what we do toraise the measured result? Austin (1996) explores the dangers of measurement—the unintended sideeffects that result—in detail, across industries. Hoffman (2000) describes several specific side effectsthat he has seen during his consultations to software companies.
The phrase “directness of measurement” is often bandied about in the literature. If “directness ofmeasurement” means anything, it must imply something about the monotonicity (preferably linearity?)of the relationship between attribute and instrument as considered in both #9 and #10.
The phrases “hard measure” and “soft measure” are also bandied about a lot. Let me suggest that ameasure is “hard” to the extent that we can describe and experimentally investigate a mechanism thatunderlies the relationship between an attribute and its measure and that accurately predicts the rate ofchange in one variable as a function of the other.
Exploring the Question
When someone asks us for a report on the amount of testing that we’ve completed, what do they mean?The question is ambiguous.
At an early point in a class he teaches, James Bach has students (experienced testers) do some testing of asimple program. At the end of the exercise, James asks them (on a scale from 0 to 100, where 100 meanscompletely tested) how much testing they’ve done, or how much they would get done if they tested foranother 8 hours. Different students give strikingly different answers based on essentially the same data.They also justify their answers quite differently. We found the same broad variation at STMR (acollection of experienced test managers and test management consultants).
If someone asks you how much of the testing you (or your group) has done, and you say 30%, you mightbe basing your answer on any combination of the following dimensions (or on some others that I’vemissed):

Measuring the Extent of Testing Copyright © 2000. Cem Kaner. All rights reserved. Page 4
• Product coverage: In principle, this compares the testing done with the total amount of testing ofthe product that could be done. But that can’t be right because the amount of testing possible isinfinite (Kaner, 1997) and 30% of infinity is unachievable. Instead, this percentage is offered withreference to a model (which might be implicit or explicit) of what would be good enough testing.Of the population of tests needed for sufficient testing, 30% have been done. This measure isinherently dynamic. At the start of testing, you might decide that certain tests need not be done.During testing, you’ll probably discover that some of your assumptions were wrong. If someonefinds bugs that you didn’t expect or you learn something new about market expectations, youmight decide to add new tests. If you do, then what you used to call 30% coverage might now bebetter estimated as 20%.
• Agreement-based: Compare to what has been promised (or planned and committed to). Given alist of tasks that you’ve agreed to do (for example, see Kaner, 1996), what percentage have youfinished? However, if you add tasks or deepen your work in some areas, your percentage“complete” will need revision.
• Project-history based: Compare this project with some others that are similar or that can bracketyour expectations for this one.
• Risk-based: One form of risk-based estimation translates into agreement-based estimation. Youdo a risk analysis of the product, derive a set of tests (or of areas to be tested, with time boxes forthe work), and then report what you’ve done against what you intended or agreed. (For example,see Amland, 1999.) A different estimator is less formal. When someone asks you how much you havegotten done, rather than saying 30%, you tell the person about the most critical areas of risk remaining inthe product. Some areas are untested, others are undertested, others are awaiting difficult bug fixes.Assuming that nothing else bad comes up, you say, it will take about X weeks to deal with these, and thenthe product will probably be ready to release.
• Evaluation (of testing). This is another form of risk evaluation. How has the testing been? Areyou finding surprises that indicate that your testing is weaker than expected? Should youreconsider your plans for the testing effort?
• Results: How much testing have you gotten done? For example, you might reports bug statisticsor statistics on tests completed.
• Results and obstacles: When someone asks you how much testing you’ve actually gotten done,what is their purpose for collecting that information? Perhaps it is predictive (she wants anestimate of when the product can be shipped) or perhaps it is diagnostic or disciplinary. If thehidden question is not just “How far are you?” but is also “Why have you only gotten this far?”then your report of 30% might mean “30% of what was humanly possible to do during thisperiod” and it might be accompanied by a list of obstacles that wasted your time or blocked sometesting tasks.
• Effort: You report that you’ve tested for 400 hours or for 4 calendar weeks. Again, depending onthe purpose of the question, this might be the best thing to report. Perhaps the underlying questionis whether the you (or the testing group) are doing much work (or are able to focus your time ontesting tasks). Or perhaps you work under a fixed budget or schedule, and you are reporting thatyou have consumed 30% of your resources. (If you are testing 10 projects at the same time, suchmeasures can be particularly useful.)

Measuring the Extent of Testing Copyright © 2000. Cem Kaner. All rights reserved. Page 5
Another Look at the Question
When we ask, “What is a good measure of the extent of testing?” what are we looking for? There areseveral related questions to consider:
• The measurement question: What are we trying to measure (what is the attribute) and how canwe measure it?
• The communication question: How should we tell management how much testing is done andhow much is left?
• The control question: Can we use measures of the extent of testing to help us control the testingproject? Which measure(s) will be effective?
• The side effect question. What risks are inherent in measuring the extent of testing? In what waysmight the process of measuring (and of managing on the basis of the measures) have results thatwe didn’t intend or anticipate?
• The organizational effects question. In what ways might the use of this type of measure affectthe organization?
• The requirements question: How does this type of measure serve our testing requirements? Howdo our requirements push us to choose measures?
These questions overlap with the measurement framework analysis but in discussions, they seem tostimulate different answers and different ideas. Therefore, for now, I’m keeping them as an independentlyuseful list.
The Rest of this Paper
The material that follows lists and organizes some of the ideas and examples that we (see theAcknowledgement, above) collected or developed over the last year. I have filtered out many suggestionsbut the lists that remain are still very broad. My intent is to show a range of thinking, to provide you witha collection of ideas from many sources, not (yet) to recommend that you use a particular measure orcombination of them. The ordering and grouping of ideas here are for convenience. The material could bereorganized in several other ways, and probably in some better ways. Suggestions are welcome.
Let me stress that I do not endorse or recommend the listed measures. I think that some of them are likelyto cause more harm than good. My objective is to list ideas that reasonable people in the field have founduseful, even if reasonable people disagree over their value. If you are considering using one, or using acombination of them, I suggest that you evaluate the proposed measure using the measurementframework described above.
The sections below do not make a good enough connection with the software measurement literature.Several sources (for example, Zuse, 1997, and Ross Collard’s software testing course notes) provideadditional measures or details. As I suggested at the start, this paper reports work in progress. The nextreport will provide details that this one lacks.

Measuring the Extent of Testing Copyright © 2000. Cem Kaner. All rights reserved. Page 6
Coverage-Based Measures
“Coverage” is sometimes interpreted in terms of a specific measure, usually statement coverage or branchcoverage. You achieve 100% statement coverage if you execute every statement (such as, every line) inthe program. You achieve 100% branch coverage if you execute every statement and take every branchfrom one statement to another. (So, if there were four ways to reach a given statement, you would try allfour.) I’ll call this type of coverage (coverage based on statements, branches, perhaps also logicalconditions), code coverage.
Code coverage is a tidy measure—it is easy to count, unambiguous, and easy to explain. Unfortunately,this measure carries risks (Marick, 1999). It is easy (and not uncommon) to write a set of relatively weaktests that hit all of the statements and conditions but don’t necessarily hit them very hard. Additionally,code coverage is incomplete. For examples of incompleteness:
• Testing the lines of code that are there does not necessarily reveal the problems arising from thecode that is not there. Marick (2000) summarizes data from cases in which 22% to 54% of theerrors found were faults of omission.
• You can achieve 100% code coverage while missing errors that would have been found by asimple data flow analysis. (Richard Bender provides a clear and simple example of this in hisexcellent course on Requirements Based Testing.)
• Code coverage doesn’t address interrupts (there is an implicit branch from every statement in theprogram to the interrupt handler and back, but because it is implicit—wired into the processorrather than written into the program directly—it just doesn’t show up in a test of every visible lineof code) or other multi-tasking issues.
• Table-driven programming is puzzling for code coverage because much of the work done is in thetable entries, which are neither lines of code nor branches.
• User interface errors, device incompatibilities, and other interactions with the environment arelikely to be under-considered in a test suite based on code coverage.
• Errors that take time to make themselves visible, such as wild pointers or stack corruption ormemory leaks, might not yield visible failures until the same sub-path has been executed manytimes. Repeatedly hitting the same lines of code and the same branches doesn’t add any extent-of-testing credit to the code coverage measure.
Sometimes, the most important coverage measure has nothing to do with code coverage. For example, Iworked on a product that had to print well. This was an essential benefit of the product. We selected 80printers for detailed compatibility testing. We tracked the percentage of those 80 printers that the programcould pass. This was a coverage measure, but it had nothing to do with lines of code. We might passthrough exactly the same code (in our program) when testing two printers but fail with only one of them(because of problems in their driver or firmware).
You have a coverage measure if you can imagine any kind of testing that can be done, and a way tocalculate what percent of that kind of testing you’ve done. Similarly, you have a coverage measure if youcan calculate what percentage of testing you’ve done of some aspect of the program or its environment.As with the 80 printers, you might artificially restrict the population of tests (we decided that testing 80printers was good enough under the circumstances) and compute the percentage of that population thatyou have run.

Measuring the Extent of Testing Copyright © 2000. Cem Kaner. All rights reserved. Page 7
Here are some examples of coverage measures. Some of this list comes from Kaner (1995), whichprovides some additional context and discussion.
• Line coverage: Test every line of code (Or Statement coverage: test every statement).
• Coverage of non-dead code, code that can be reached by a user.
• Branch coverage: Test every line, and every branch on multi-branch lines.
• N-length sub-path coverage: Test every sub-path through the program of length N. For example,in a 10,000 line program, test every possible 10-line sequence of execution.
• Path coverage: Test every path through the program, from entry to exit. The number of paths isimpossibly large to test. (See Myers, 1979, and Chapter 2 of Kaner, Falk, and Nguyen, 1993).
• Multicondition or predicate coverage: Force every logical operand to take every possible value.Two different conditions within the same test may result in the same branch, and so branchcoverage would only require the testing of one of them. (See Myers, 1979, for multiple conditioncoverage, and Beizer, 1990).
• Trigger every assertion check in the program: Use impossible data if necessary.
• Loop coverage: “Detect bugs that exhibit themselves only when a loop is executed more thanonce.” (Marick, 1995, p. 146)
• Every module, object, component, tool, subsystem, etc. This seems obvious until you realize thatmany programs rely on off-the-shelf components. The programming staff doesn’t have the sourcecode to these components, so measuring line coverage is impossible. At a minimum (which iswhat is measured here), you need a list of all these components and test cases that exercise eachone at least once.
• Fuzzy decision coverage. If the program makes heuristically-based or similarity-based decisions,and uses comparison rules or data sets that evolve over time, check every rule several times overthe course of training.
• Relational coverage. “Checks whether the subsystem has been exercised in a way that tends todetect off-by-one errors” such as errors caused by using < instead of <=. (Marick, 1995, p. 147)This coverage includes:
o Every boundary on every input variable. (Boundaries are classically described in numericterms, but any change-point in a program can be a boundary. If the program works oneway on one side of the change-point and differently on the other side, what does it matterwhether the change-point is a number, a state variable, an amount of disk space oravailable memory, or a change in a document from one typeface to another, etc.? Kaner,Falk, & Nguyen, 1993, p. 399-401.)
o Every boundary on every output variable.
o Every boundary on every variable used in intermediate calculations.
• Data coverage. At least one test case for each data item / variable / field in the program.

Measuring the Extent of Testing Copyright © 2000. Cem Kaner. All rights reserved. Page 8
• Constraints among variables: Let X and Y be two variables in the program. X and Y constraineach other if the value of one restricts the values the other can take. For example, if X is atransaction date and Y is the transaction’s confirmation date, Y can’t occur before X.
• Each appearance of a variable. Suppose that you can enter a value for X on three different dataentry screens, the value of X is displayed on another two screens, and it is printed in five reports.Change X at each data entry screen and check the effect everywhere else X appears.
• Every type of data sent to every object. A key characteristic of object-oriented programming isthat each object can handle any type of data (integer, real, string, etc.) that you pass to it. So, passevery conceivable type of data to every object.
• Handling of every potential data conflict. For example, in an appointment calendaring program,what happens if the user tries to schedule two appointments at the same date and time?
• Handling of every error state. Put the program into the error state, check for effects on the stack,available memory, handling of keyboard input. Failure to handle user errors well is an importantproblem, partially because about 90% of industrial accidents are blamed on human error or risk-taking. (Dhillon, 1986, p. 153) Under the legal doctrine of forseeable misuse (this doctrine iscleanly explained in Brown, 1991), the manufacturer is liable in negligence if it fails to protectthe customer from the consequences of a reasonably forseeable misuse of the product.
• Every complexity / maintainability metric against every module, object, subsystem, etc. Thereare many such measures. Jones (1991, p. 238-341) lists 20 of them. Beizer (1990) provides asympathetic introduction to these measures. Glass (1992) and Grady & Caswell, (1987) providevaluable perspective. People sometimes ask whether any of these statistics are grounded in atheory of measurement or have practical value. (For example, Kaner, Falk, & Nguyen, 1993, p.47-48; also Glass, 1992, p. 303, “Software metrics to date have not produced any software qualityresults which are useful in practice.”) However, it is clear that, in practice, some organizationsfind them an effective tool for highlighting code that needs further investigation and might needredesign. (For example, see Grady & Caswell, 1987, and Grady, 1992, p. 87-90.)
• Conformity of every module, subsystem, etc. against every corporate coding standard. Severalcompanies believe that it is useful to measure characteristics of the code, such as total lines permodule, ratio of lines of comments to lines of code, frequency of occurrence of certain types ofstatements, etc. A module that doesn’t fall within the “normal” range might be summarilyrejected (bad idea) or re-examined to see if there’s a better way to design this part of the program.
• Table-driven code. The table is a list of addresses or pointers or names of modules. In atraditional CASE statement, the program branches to one of several places depending on thevalue of an expression. In the table-driven equivalent, the program would branch to the placespecified in, say, location 23 of the table. The table is probably in a separate data file that canvary from day to day or from installation to installation. By modifying the table, you can radicallychange the control flow of the program without recompiling or relinking the code. Someprograms drive a great deal of their control flow this way, using several tables. Coveragemeasures? Some examples:
o check that every expression selects the correct table element
o check that the program correctly jumps or calls through every table element
Measuring the Extent of Testing Copyright © 2000. Cem Kaner. All rights reserved. Page 9
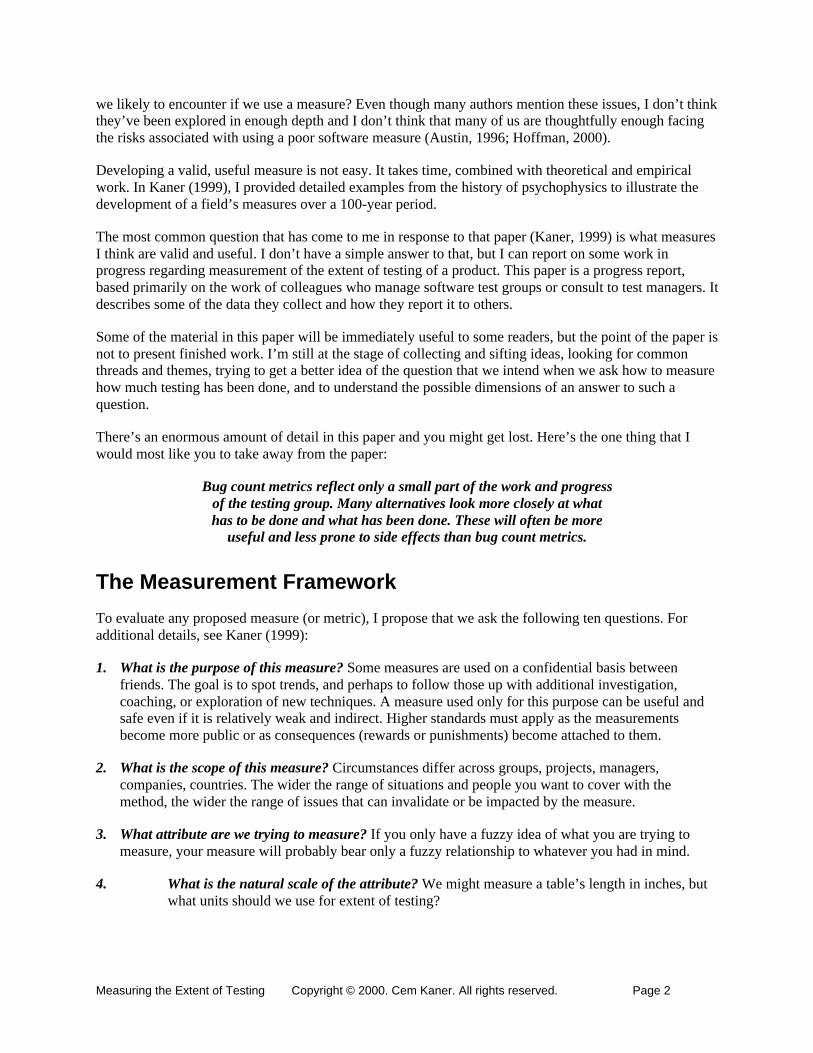
o check that every address or pointer that is available to be loaded into these tables is valid(no jumps to impossible places in memory, or to a routine whose starting address haschanged)
o check the validity of every table that is loaded at any customer site.
• Every interrupt. An interrupt is a special signal that causes the computer to stop the program inprogress and branch to an interrupt handling routine. Later, the program restarts from where itwas interrupted. Interrupts might be triggered by hardware events (I/O or signals from the clockthat a specified interval has elapsed) or software (such as error traps). Generate every type ofinterrupt in every way possible to trigger that interrupt.
• Every interrupt at every task, module, object, or even every line. The interrupt handling routinemight change state variables, load data, use or shut down a peripheral device, or affect memory inways that could be visible to the rest of the program. The interrupt can happen at anytime—between any two lines, or when any module is being executed. The program may fail if theinterrupt is handled at a specific time. (Example: what if the program branches to handle aninterrupt while it’s in the middle of writing to the disk drive?) The number of test cases here ishuge, but that doesn’t mean you don’t have to think about this type of testing. This is path testingthrough the eyes of the processor (which asks, “What instruction do I execute next?” and doesn’tcare whether the instruction comes from the mainline code or from an interrupt handler) ratherthan path testing through the eyes of the reader of the mainline code. Especially in programs thathave global state variables, interrupts at unexpected times can lead to very odd results.
• Every anticipated or potential race. (Here as in many other areas, see Appendix 1 of Kaner, Falk,& Nguyen, 1993 for a list and discussion of several hundred types of bugs, including interrupt-related, race-condition-related, etc.) Imagine two events, A and B. Both will occur, but theprogram is designed under the assumption that A will always precede B. This sets up a racebetween A and B—if B ever precedes A, the program will probably fail. To achieve racecoverage, you must identify every potential race condition and then find ways, using random dataor systematic test case selection, to attempt to drive B to precede A in each case. Races can besubtle. Suppose that you can enter a value for a data item on two different data entry screens.User 1 begins to edit a record, through the first screen. In the process, the program locks therecord in Table 1. User 2 opens the second screen, which calls up a record in a different table,Table 2. The program is written to automatically update the corresponding record in the Table 1when User 2 finishes data entry. Now, suppose that User 2 finishes before User 1. Table 2 hasbeen updated, but the attempt to synchronize Table 1 and Table 2 fails. What happens at the timeof failure, or later if the corresponding records in Table 1 and 2 stay out of synch?
• Every time-slice setting. In some systems, you can control the grain of switching between tasksor processes. The size of the time quantum that you choose can make race bugs, time-outs,interrupt-related problems, and other time-related problems more or less likely. Of course,coverage is an difficult problem here because you aren’t just varying time-slice settings throughevery possible value. You also have to decide which tests to run under each setting. Given aplanned set of test cases per setting, the coverage measure looks at the number of settings you’vecovered.
• Varied levels of background activity. In a multiprocessing system, tie up the processor withcompeting, irrelevant background tasks. Look for effects on races and interrupt handling. Similarto time-slices, your coverage analysis must specify:

Measuring the Extent of Testing Copyright © 2000. Cem Kaner. All rights reserved. Page 10
o categories of levels of background activity (figure out something that makes sense) and
o all timing-sensitive testing opportunities (races, interrupts, etc.).
• Each processor type and speed. Which processor chips do you test under? What tests do you rununder each processor? You are looking for:
o speed effects, like the ones you look for with background activity testing, and
o consequences of processors’ different memory management rules, and
o floating point operations, and
o any processor-version-dependent problems that you can learn about.
• Every opportunity for file / record / field locking.
• Every dependency on the locked (or unlocked) state of a file, record or field.
• Every opportunity for contention for devices or resources.
• Performance of every module / task / object: Test the performance of a module then retest itduring the next cycle of testing. If the performance has changed significantly, you are eitherlooking at the effect of a performance-significant redesign or at a symptom of a new bug.
• Free memory / available resources / available stack space at every line or on entry into and exitout of every module or object.
• Execute every line (branch, etc.) under the debug version of the operating system: This showsillegal or problematic calls to the operating system.
• Vary the location of every file. What happens if you install or move one of the program’scomponent, control, initialization or data files to a different directory or drive or to anothercomputer on the network?
• Check the release disks for the presence of every file. It’s amazing how often a file vanishes. Ifyou ship the product on different media, check for all files on all media.
• Every embedded string in the program. Use a utility to locate embedded strings. Then find a wayto make the program display each string.
• Every menu option.
• Every dialogue or other data entry screen.
Operation of every function / feature / data handling operation under:
• Every program preference setting.
• Every character set, code page setting, or country code setting.

Measuring the Extent of Testing Copyright © 2000. Cem Kaner. All rights reserved. Page 11
• The presence of every memory resident utility (inits, TSRs).
• Each operating system version.
• Each distinct level of multi-user operation.
• Each network type and version.
• Each level of available RAM.
• Each type / setting of virtual memory management.
Compatibility
• Compatibility with every previous version of the program.
• Ability to read every type of data available in every readable input file format. If a file format issubject to subtle variations (e.g. CGM) or has several sub-types (e.g. TIFF) or versions (e.g.dBASE), test each one.
• Write every type of data to every available output file format. Again, beware of subtle variationsin file formats—if you’re writing a CGM file, full coverage would require you to test yourprogram’s output’s readability by every one of the main programs that read CGM files.
• Every typeface supplied with the product. Check all characters in all sizes and styles. If yourprogram adds typefaces to a collection of fonts that are available to several other programs, checkcompatibility with the other programs (nonstandard typefaces will crash some programs).
• Every type of typeface compatible with the program. For example, you might test the programwith (many different) TrueType and Postscript typefaces, and fixed-sized bitmap fonts.
• Every piece of clip art in the product. Test each with this program. Test each with otherprograms that should be able to read this type of art.
• Every sound / animation provided with the product. Play them all under different device (e.g.sound) drivers / devices. Check compatibility with other programs that should be able to play thisclip-content.
• Every supplied (or constructible) script to drive other machines / software (e.g. macros) / BBS’sand information services (communications scripts).
• All commands available in a supplied communications protocol.
• Recognized characteristics. For example, every speaker’s voice characteristics (for voicerecognition software) or writer’s handwriting characteristics (handwriting recognition software)or every typeface (OCR software).
• Every type of keyboard and keyboard driver.
• Every type of pointing device and driver at every resolution level and ballistic setting.

Measuring the Extent of Testing Copyright © 2000. Cem Kaner. All rights reserved. Page 12
• Every output feature with every sound card and associated drivers.
• Every output feature with every type of printer and associated drivers at every resolution level.
• Every output feature with every type of video card and associated drivers at every resolutionlevel.
• Every output feature with every type of terminal and associated protocols.
• Every output feature with every type of video monitor and monitor-specific drivers at everyresolution level.
• Every color shade displayed or printed to every color output device (video card / monitor /printer / etc.) and associated drivers at every resolution level. And check the conversion to greyscale or black and white.
• Every color shade readable or scannable from each type of color input device at everyresolution level.
• Every possible feature interaction between video card type and resolution, pointing device typeand resolution, printer type and resolution, and memory level. This may seem excessivelycomplex, but I’ve seen crash bugs that occur only under the pairing of specific printer and videodrivers at a high resolution setting. Other crashes required pairing of a specific mouse and printerdriver, pairing of mouse and video driver, and a combination of mouse driver plus video driverplus ballistic setting.
• Every type of CD-ROM drive, connected to every type of port (serial / parallel / SCSI) andassociated drivers.
• Every type of writable disk drive / port / associated driver. Don’t forget the fun you can havewith removable drives or disks.
• Compatibility with every type of disk compression software. Check error handling for every typeof disk error, such as full disk.
• Every voltage level from analog input devices.
• Every voltage level to analog output devices.
• Every type of modem and associated drivers.
• Every FAX command (send and receive operations) for every type of FAX card under everyprotocol and driver.
• Every type of connection of the computer to the telephone line (direct, via PBX, etc.; digital vs.analog connection and signalling); test every phone control command under every telephonecontrol driver.
• Tolerance of every type of telephone line noise and regional variation (including variationsthat are out of spec) in telephone signaling (intensity, frequency, timing, other characteristicsof ring / busy / etc. tones).

Measuring the Extent of Testing Copyright © 2000. Cem Kaner. All rights reserved. Page 13
• Every variation in telephone dialing plans.
• Every possible keyboard combination. Sometimes you’ll find trap doors that the programmerused as hotkeys to call up debugging tools; these hotkeys may crash a debuggerless program.Other times, you’ll discover an Easter Egg (an undocumented, probably unauthorized, andpossibly embarrassing feature). The broader coverage measure is every possible keyboardcombination at every error message and every data entry point. You’ll often find different bugswhen checking different keys in response to different error messages.
• Recovery from every potential type of equipment failure. Full coverage includes each type ofequipment, each driver, and each error state. For example, test the program’s ability to recoverfrom full disk errors on writable disks. Include floppies, hard drives, cartridge drives, opticaldrives, etc. Include the various connections to the drive, such as IDE, SCSI, MFM, parallel port,and serial connections, because these will probably involve different drivers.
Computation
• Function equivalence. For each mathematical function, check the output against a known goodimplementation of the function in a different program. Complete coverage involves equivalencetesting of all testable functions across all possible input values.
• Zero handling. For each mathematical function, test when every input value, intermediatevariable, or output variable is zero or near-zero. Look for severe rounding errors or divide-by-zero errors.
• Accuracy of every graph, across the full range of graphable values. Include values that forceshifts in the scale.
Information Content
• Accuracy of every report. Look at the correctness of every value, the formatting of every page,and the correctness of the selection of records used in each report.
• Accuracy of every message.
• Accuracy of every screen.
• Accuracy of every word and illustration in the manual.
• Accuracy of every fact or statement in every data file provided with the product.
• Accuracy of every word and illustration in the on-line help.
• Every jump, search term, or other means of navigation through the on-line help.
Threats, Legal Risks
• Check for every type of virus / worm that could ship with the program.
Measuring the Extent of Testing Copyright © 2000. Cem Kaner. All rights reserved. Page 14
• Every possible kind of security violation of the program, or of the system while using theprogram.
• Check for copyright permissions for every statement, picture, sound clip, or other creationprovided with the program.
Usability tests of:
• Every feature / function of the program.
• Every part of the manual.
• Every error message.
• Every on-line help topic.
• Every graph or report provided by the program.
Localizability / localization tests:
• Every string. Check program’s ability to display and use this string if it is modified by changingthe length, using high or low ASCII characters, different capitalization rules, etc.
• Compatibility with text handling algorithms under other languages (sorting, spell checking,hyphenating, etc.)
• Every date, number and measure in the program.
• Hardware and drivers, operating system versions, and memory-resident programs that arepopular in other countries.
• Every input format, import format, output format, or export format that would be commonlyused in programs that are popular in other countries.
• Cross-cultural appraisal of the meaning and propriety of every string and graphic shipped withthe program.
Verifications
• Verification of the program against every program requirement and published specification.(How well are we checking these requirements? Are we just hitting line items or getting to theessence of them?)
• Verify against every business objectives associated with the program (these may or may not belisted in the requirements).
• Verification of the program against user scenarios. Use the program to do real tasks that arechallenging and well-specified. For example, create key reports, pictures, page layouts, or other
Measuring the Extent of Testing Copyright © 2000. Cem Kaner. All rights reserved. Page 15
documents events to match ones that have been featured by competitive programs as interestingoutput or applications.
• Verification against every regulation (IRS, SEC, FDA, etc.) that applies to the data orprocedures of the program.
Coverage of specific types of tests:
• Automation coverage: Percent of code (lines, branches, paths, etc.) covered by the pool ofautomated tests for this product.
• Regression coverage: Percent of code that is covered by the standard suite of regression testsused with this program.
• Scenario (or soap opera) coverage: Percent of code that is covered by the set of scenario testsdeveloped for this program.
• Coverage associated with the set of planned tests.
o Percent that the planned tests cover non-dead code (code that can be reached by acustomer)
o Extent to which tests of the important lines, branches, paths, conditions (etc.—importantin the eyes of the tester) cover the total population of lines, branches, etc.
o Extent to which the planned tests cover the important lines, branches, paths, conditions,etc.
o Extent to which the scenario tests cover the important lines, branches, paths, conditions,or other variables of interest.
Inspection coverage
• How much code has been inspected.
• How many of the requirements inspected/reviewed.
• How many of the design documents inspected.
• How many of the unit tests inspected.
• How many of the black box tests inspected.
• How many of the automated tests inspected.
• How many test artifacts reviewed by developers.
User-focused testing
• How many of the types of users have been covered or simulated.

Measuring the Extent of Testing Copyright © 2000. Cem Kaner. All rights reserved. Page 16
• How many of the possible use cases have been covered.
Agreement-Based Measures
Agreement-based measures start from an agreement about what testing will and will not be done. Theagreement might be recorded in a formal test plan or in a memo cosigned by different stakeholders. Or itmight simply be a work list that the test group has settled on. The list might fully detailed, spelling outevery test case. Or it might list more general areas of work and describe the depth of testing (and the timebudget) for each one. The essence of agreement-based measures is progress against a plan.
All of these measures are proportions: amount of work done divided by the amount of work planned. Wecan convert these to effort reports easily enough just by reporting the amount of work done.
• Percent of test requirements turned into tests.
• Percent of specification items turned into tests.
• Percent of planned tests developed.
• Percent of tests planned that have been executed.
• Percent of tests executed that have passed.
• Percent of tests passing, but that are old (haven’t been rerun recently).
• Percent (and list) of tests not yet executed.
• Percent (list, whatever) of deliverables given to the client vs. total expected, where deliverablesinclude bugs, scripts, reports and documentation (e.g. the matrix).
• Test hours (or number of tests executed) per priority level (compared to the proportional levelsof work intended for different priorities).
• Test hours (or number of tests executed) per feature area (compared to the time intended fordifferent areas).
• Pattern of progress of testing (how much planned, how much done, how much left to do)across different test types across feature (or activity) areas.
• Timesheet report of how tester hours were spent this week, against a pre-existing set ofcategories of tasks (time consumption types).
• All test cases written / run.
• Compare current results / status to product release criteria.
• It’s Tuesday – time to ship.

Measuring the Extent of Testing Copyright © 2000. Cem Kaner. All rights reserved. Page 17
Effort-Based Measures
These can be turned into agreement-based measures if we have an expected level of effort for comparisonto the actual level completed.
• How much code must be tested.
• How many spec pages / manual pages are associated with the material to be tested.
• How many changes have been specified for the new version of an old product? How changesmany are not specified but are being made?
• How different is the new test plan from the old test plan.
• Number of hours spent testing.
• Amount of overtime per tester.
• Compare the amount of overtime worked by testers and developers.
• Number of test cycles completed.
• Number of tests performed in each cycle.
• Duration of each test cycle.
• Number of tests executed on production hardware.
• Number of test sessions (or some other unit of exploratory testing effort). See Bach (2000) for adiscussion of exploratory testing sessions.
• Number of functional areas in which we’re doing exploratory testing on a weekly basis.
• Average cost of finding and/or fixing a bug.
• Time spent maintaining automated tests {total, to date, per test cycle}.
• Time to add new tests. How long it takes to add manual or automated tests to your population oftests. Include the time it takes to document the test, to file it in your source control system (if youhave one), to plan the test, including checking whether it is redundant with current tests, etc.
• Time spent debugging the tests.
• Time spent checking failures to see if you are reporting duplicates.
• Time spent by testers writing defect reports.
Measuring the Extent of Testing Copyright © 2000. Cem Kaner. All rights reserved. Page 18
Project-History Based Measures
If you’ve run several projects, you can compare today’s project with historical results. When someoneclaims that the project has reached “beta”, you might compare current status with the state of the otherproducts when they reached the beta milestone. For example, some groups add features until the lastminute. At those companies, “all code complete” is not a criterion for alpha or beta milestones. But youmight discover that previous projects were 90% code complete 10 weeks before their ship date.
Many of the measures flagged as based on risk, effort, or agreement can be used as project-history basedif you have measured those variables previously, under circumstances that allow for meaningfulcomparison, and have the data available for comparison.
• How much time spent, compared to time expected from prior projects
• Counts of defects discovered, fixed, open compared to previous project patterns. For example,number (or proportion) of defects open at alpha or beta milestone. These reports are widely usedand widely abused. Significant side effects (impacts on the test planning, bug hunting, bugreporting, and bug triage processes) seem to be common, even though they are not oftendiscussed in print. For a recent discussion that focuses on bug counts, see Hoffman (2000). For anexcellent but more general discussion, see Austin (1996)..
• Arrival rates of bugs (how many bugs opened) per week, compared to rates on previousprojects. I have the same concerns about the curves that show bugs per week as the single point(e.g. beta milestone) comparisons.
• How many (or percent of) modules or components coded compared to previous releases at thispoint in the project.
Risk Based Measures
As I am using the term, the risk measures focus on risk remaining in the project. Imagine this question: Ifwe were to release the product today, without further testing, what problems would we anticipate?Similarly, if we were to release the product on its intended release date, what problems would weanticipate?
• Of the test cases planned using hazard or risk analysis, how many have been written, run, orpassed?
• In a group that creates new tests throughout the testing project, have we reached a point inwhich we don’t have any more questions? This might tell us that there is a problem with the testgroup, or it might tell us that we are close to being finished. (There might be plenty of errors leftin the product, but if we’re out of ideas, we’re not going to find those errors.)
• How many bugs have been found in third party software that you include with or run with yourproducts?
• How many failures found per unit (per test case, per thousand pages printed, per thousandlines of code, per report, per transaction, per hour, etc.)
• Mean time (transactions, etc.) between failures?

Measuring the Extent of Testing Copyright © 2000. Cem Kaner. All rights reserved. Page 19
• Length of time before system failure (or other detectable failures) in a stochastic test or a loador stress test.
• Rate at which you are finding new bugs.
• Rate at which previously fixed bugs are reappearing.
• Number of complaints from beta testers.
• Number of bugs found in the first manufactured copy of the product. If you release a product tomanufacturing, you should test the first few manufactured copies, before sending the rest tocustomers. Manufacturing errors happen. The disks (books, collaterals) that you sent out forduplication may or may not match what you get back.
• Number of bugs found in a random selection of manufactured copies. In most products, all ofthe manufactured copies are identical. Some products, however, vary from copy to copy. Even ifthe only difference across products is in the serial number, problems might show up on one copythat don’t show up on others. The more extensively customized each copy is, the more relevant isthis type of testing.
• After the product is released, we obtain data from the field that tell us whether we shouldreopen the product, such as:
o Angry letters to the CEO.
o Published criticism of the product.
o Rate of customer complaints for technical support.
o Number of “surprise” defects (problems found by customers that were not found pre-release by testers).
• Number of “surprisingly serious” defects (deferred problems that have generated more calls orangrier calls than anticipated.)
• Perceived risk. For example, the group might provide a rough estimate of risk for each area of theproduct on a 5-point scale (from low risk to very high risk), in order to think through the patternof work left to be done in a short time available.
• Desperation level of triage team. The triage team is the group that decides whether or not to fixeach defect. Toward the end of the project (especially if this “end” is a long time after the initiallyscheduled ship date), this team might be pushed very hard to stop fixing and just ship it. The moredesperate the team is to ship the product soon, the higher the risk that the product will leave inbad shape.
• Number of defects resolved without being fixed.
• Frequency of tester outbursts. This measure is informal but can be extremely important. As apoor quality product marches to release, many testers or test groups feel increasing pressure tofind defects that will block the shipment. Frustration mounts as perfectly “good” bugs are

Measuring the Extent of Testing Copyright © 2000. Cem Kaner. All rights reserved. Page 20
deferred. Indication of high stress among the testers is a signal of danger in the product or thereview process.
• Level of confusion or dissent among the development team as a whole or among sub-groups.(You measure this by talking with people, asking them how they feel about the product and theproject, and its projected release date.
Obstacle Reports
Obstacles are risks to the testing project (or to the development project as a whole). These are the thingsthat make it hard to do the testing or fixing well. This is not intended as a list of everything that can gowrong on a project. Instead, it is a list of common problems that make the testing less efficient.
• Turnover of development staff (programmers, testers, writers, etc.)
• Number of marketing VPs per release. (Less flippantly, what is the rate of turnover amongexecutives who influence the design of the product?).
• Layoffs of testing (or other development) staff.
• Number of organizational changes over the life of the project.
• Number of people who influence product release, and level of consensus about the productamong them.
• Appropriateness of the tester to programmer ratio. (Note: I’ve seen successful ratios rangingfrom 1:5 through 5:1. It depends on the balance of work split between the groups and the extentto which the programmers are able to get most of the code right the first time.)
• Number of testers who speak English (if you do your work in English).
• Number of testers who speak the same language as the programmers.
• How many bugs are found by isolated (such as remote or offsite) testers compared to testerswho are co-located with or in good communication with the programmers?
• Number of tests blocked by defects.
• List of defects blocking tests.
• Defect fix percentage (if low).
• Slow defect fix rate compared to find rate.
• Average age of open bugs.
• Average time from initial report of defect until fix verification.
• Number of times a bug is reopened (if high).
• Number of promotions and demotions of defect priority

Measuring the Extent of Testing Copyright © 2000. Cem Kaner. All rights reserved. Page 21
• Number of failed attempts to get builds to pass smoke tests.
• Number of changes to (specifications or) requirements during testing.
• Percentage of tests changed by modified requirements.
• Time lost to development issues (such as lack of specifications or features not yet coded).
• Time required to test a typical emergency fix.
• Percentage of time spent on testing emergency fixes.
• Percentage of time spent providing technical support for pre-release users (such as betatesters).
• How many billable hours per week (for a consulting firm) or the equivalent task-focused hours(for in-house work) are required of the testers and how does this influence or interfere withtheir work?
• Ability of test environment team (or information systems support team) to build the system to betested as specified by the programming team.
• Time lost to environment issues (such as difficulties obtaining test equipment or configuring testsystems, defects in the operating system, device drivers, file system or other 3rd party, systemsoftware).
Evaluation-of-Testing Based Measures
These help you assess the testing effort. How hard are the testers doing, how well are they doing it, whatcould they improve? A high number for one of these measures might be good for one group and bad foranother. For example, in a company that relies on an outside test lab to design a specialized set of tests fora very technical area, we’d expect a high bug find rate from third party test cases. In a company thatthinks of its testing as more self-contained, a high rate from third parties is a warning flag.
• Number of crises involving test tools.
• Number of defects related to test environment.
• Number of bugs found by boundary or negative tests vs. feature tests.
• Number of faults found in localized versions compared to base code.
• Number of faults found in inspected vs. uninspected areas.
• Number of defects found by inspection of the testing artifacts.
• Number of defects discovered during test design (rather than in later testing).
• Number of defects found by 3rd party test cases.
• Number of defects found by 3rd party test group vs. your group.

Measuring the Extent of Testing Copyright © 2000. Cem Kaner. All rights reserved. Page 22
• Number of defects found by developers.
• Number of defects found by developers after unit testing.
• Backlog indicators. For example, how many unverified bug fixes are there (perhaps as a ratio ofnew bug fixes submitted) or what is the mean time to verify a fix?
• How many phone calls were generated during beta.
• Number of surprise bugs (bugs you didn’t know about) reported by beta testers. (the content ofthese calls indicate holes in testing or, possibly, weaknesses in the risk analysis that allowed aparticular bug to be deferred)..
• After the product is released,
o Number of “surprise” defects (problems found by customers that were not found pre-release by testers).
o Number of “surprisingly serious” defects (deferred problems that have generated morecalls or angrier calls than anticipated.).
o Angry letters to the CEO. (Did testers mis-estimate severity?)
o Published criticism of the product. (Did testers mis-estimate visibility?)
o Rate of customer complaints for technical support? (Did testers mis-estimate customerimpact?)
• Number of direct vs. indirect bug finds (were you looking for that bug or did you stumble on itas a side effect of some other test?)
• Number of irreproducible bugs (perhaps as a percentage of total bugs found).
• Number of noise bugs (issues that did not reflect software errors).
• Number of duplicate bugs being reported.
• Rumors of off-the-record defects (defects discovered but not formally reported or tracked. Thediscoveries might be by programmers or by testers who are choosing not to enter bugs into thetracking system—a common problem in companies that pay special attention to bug counts.)
• Number of test cases that can be automated.
• Cyclomatic complexity of automated test scripts.
• Size (e.g. lines of code) of test automation code. Appraisal of the code’s maintainability andmodularity.
• Existence of requirements analyses, requirements documents, specifications, test plans andother software engineering processes and artifacts generated for the software test automationeffort.

Measuring the Extent of Testing Copyright © 2000. Cem Kaner. All rights reserved. Page 23
• Percentage of time spent by testers writing defect reports.
• Percentage of time spent by testers searching for bugs, writing bug reports, or doing focusedtest planning on this project. (Sometimes, you’re getting a lot less testing on a project than youthink. Your staff may be so overcommitted that they have almost no time to focus and make realprogress on anything. Other times, the deallocation of resources is intentional. For example, onecompany has an aggressive quality control group who publish bug curves and comparisons acrossprojects. To deal with the political hassles posed by this external group, the software developmentteam sends the testers to the movies whenever the open bug counts get too high or the fix ratesget too low.)
• Percentage of bugs found by planned vs. exploratory vs. unplanned methods, compared to thepercentage that you intended.
• What test techniques were applied compared to the population of techniques that you think areapplicable compared to the techniques the testers actually know.
• Comparative effectiveness: what problems were found by one method of testing or one source vs.another.
• Comparative effectiveness over time: compare the effectiveness of different test methods overthe life cycle of the product. We might expect simple function tests to yield more bugs early intesting and complex scenario tests to be more effective later.
• Complexity of causes over time: is there a trend that bugs found later have more complex causes(for example, require a more complex set of conditions) than bugs found earlier? Are thereparticular patterns of causes that should be tested for earlier?
• Differential bug rates across predictors: defect rates tracked across different predictors. Forexample, we might predict that applications with high McCabe-complexity numbers would havemore bugs. Or we might predict that applications that were heavily changed or that were rated byprogrammers as more fragile, etc., would have more bugs.
• Delta between the planned and actual test effort.
• Ability of testers to articulate the test strategy.
• Ability of the programmers and other developers to articulate the test strategy.
• Approval of the test effort by an experienced, respected tester.
• Estimate the prospective effectiveness of the planned tests. (How good do you think these are?)
• Estimate the effectiveness of the tests run to date (subjective evaluation by testers, otherdevelopers).
• Estimate confidence that the right quality product will ship on time (subjective evaluation bytesters, other developers).

Measuring the Extent of Testing Copyright © 2000. Cem Kaner. All rights reserved. Page 24
Results Reports
So what has the test group accomplished? Most of the bug count metrics belong here.
• Build acceptance test criteria and results.
• Benchmark performance results.
• Number of builds submitted for testing.
• Number of builds tested.
• Number of revisions (drafts) of the test plan
• Number of test cases created / coded / documented.
• Number of reusable test cases created.
• Percent or number of reusable test artifacts in this project.
• Number of times reusable artifacts are reused.
• Number of defects in test cases.
• List of failing (defective) tests.
• Number of promotions and demotions of defect priority.
• Tester to developer ratio.
• Defects per 1000 lines of code.
• Total bugs found / fixed / deferred / rejected.
• Find and close rate by severity.
• Total number of open bugs.
• Number of open bugs by {feature, subsystem, build, database, supplier}.
• Number of open bugs assigned to {programmer, tester, someone else, total}.
• Number of open bugs by platform.
• Defect find rate per week (open defects/week).
• Cumulative defects each week (Total defects found/time.)
• Defect find rate normalized by the amount of time spent testing.
• Number of bugs found from regression testing.

Measuring the Extent of Testing Copyright © 2000. Cem Kaner. All rights reserved. Page 25
• Number of bugs fixed or failed from regression testing.
• Number of bugs found in beta/real customer testing over time.
• Percent of tests per build {passing, failing, not yet analyzed}.
• Number of defects found in requirements / specifications / other development planningdocuments.
• Number of defects found in unit testing.
• Number of bugs found after a ship candidate has been declared
• Number of defects found in LAN vs. modem testing. (Similarly for other configurationvariations.)
• Percentage of bugs found per project phase.
• Number or percentage of bugs found by programmers.
• Number of bugs found by programmers after unit testing.
• Number of bugs found in first article (first item manufactured by manufacturing).
• Proportion of unreviewed bugs that become critical after review. (Some companies don’t havea review process. Others have each bug report reviewed by (depending on the company)another tester, a programmer, or the triage team as a whole. )
Progress Reporting Examples
The following examples are based on ideas presented at LAWST and STMR, but I’ve made somechanges to simplify the description, or because additional ideas came up at the meeting (or since) thatseem to me to extend the report in useful ways. Occasionally, the difference between my version and theoriginal occurs because (oops) I misunderstood the original presentation.
Feature Map
This description is based on a presentation by Jim Bampos and an ensuing discussion. This illustrates anapproach that is primarily focused on agreement-based measures.
For each feature, list different types of testing that would be appropriate (and that you intend to do).Different features might involve different test types. Then, for each feature / testing type pair, determinewhen the feature will be ready for that type of testing, when you plan to do that testing, how much youplan to do, and what you’ve achieved.
A spreadsheet that tracked this might look like:
Feature Test Type Ready Primary Testing(week of. . .)
TimeBudget
TimeSpent
Notes
Measuring the Extent of Testing Copyright © 2000. Cem Kaner. All rights reserved. Page 26
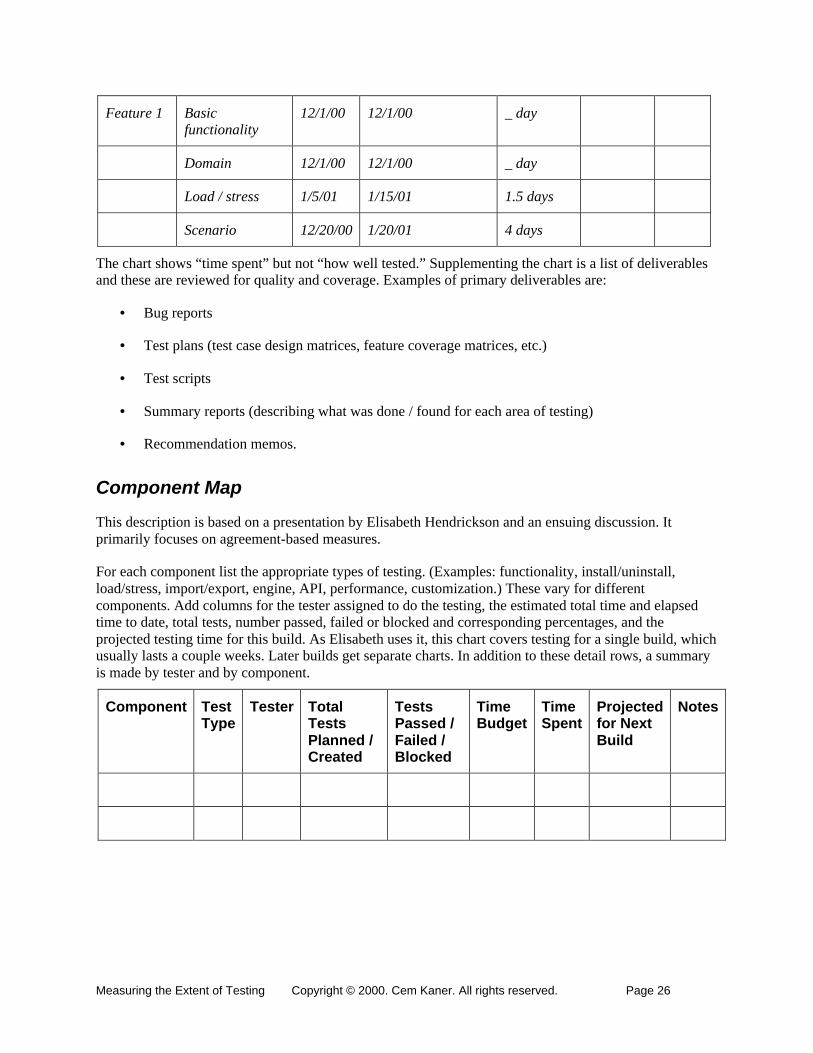
Feature 1 Basicfunctionality
12/1/00 12/1/00 _ day
Domain 12/1/00 12/1/00 _ day
Load / stress 1/5/01 1/15/01 1.5 days
Scenario 12/20/00 1/20/01 4 days
The chart shows “time spent” but not “how well tested.” Supplementing the chart is a list of deliverablesand these are reviewed for quality and coverage. Examples of primary deliverables are:
• Bug reports
• Test plans (test case design matrices, feature coverage matrices, etc.)
• Test scripts
• Summary reports (describing what was done / found for each area of testing)
• Recommendation memos.
Component Map
This description is based on a presentation by Elisabeth Hendrickson and an ensuing discussion. Itprimarily focuses on agreement-based measures.
For each component list the appropriate types of testing. (Examples: functionality, install/uninstall,load/stress, import/export, engine, API, performance, customization.) These vary for differentcomponents. Add columns for the tester assigned to do the testing, the estimated total time and elapsedtime to date, total tests, number passed, failed or blocked and corresponding percentages, and theprojected testing time for this build. As Elisabeth uses it, this chart covers testing for a single build, whichusually lasts a couple weeks. Later builds get separate charts. In addition to these detail rows, a summaryis made by tester and by component.
Component TestType
Tester TotalTestsPlanned /Created
TestsPassed /Failed /Blocked
TimeBudget
TimeSpent
Projectedfor NextBuild
Notes
Measuring the Extent of Testing Copyright © 2000. Cem Kaner. All rights reserved. Page 27
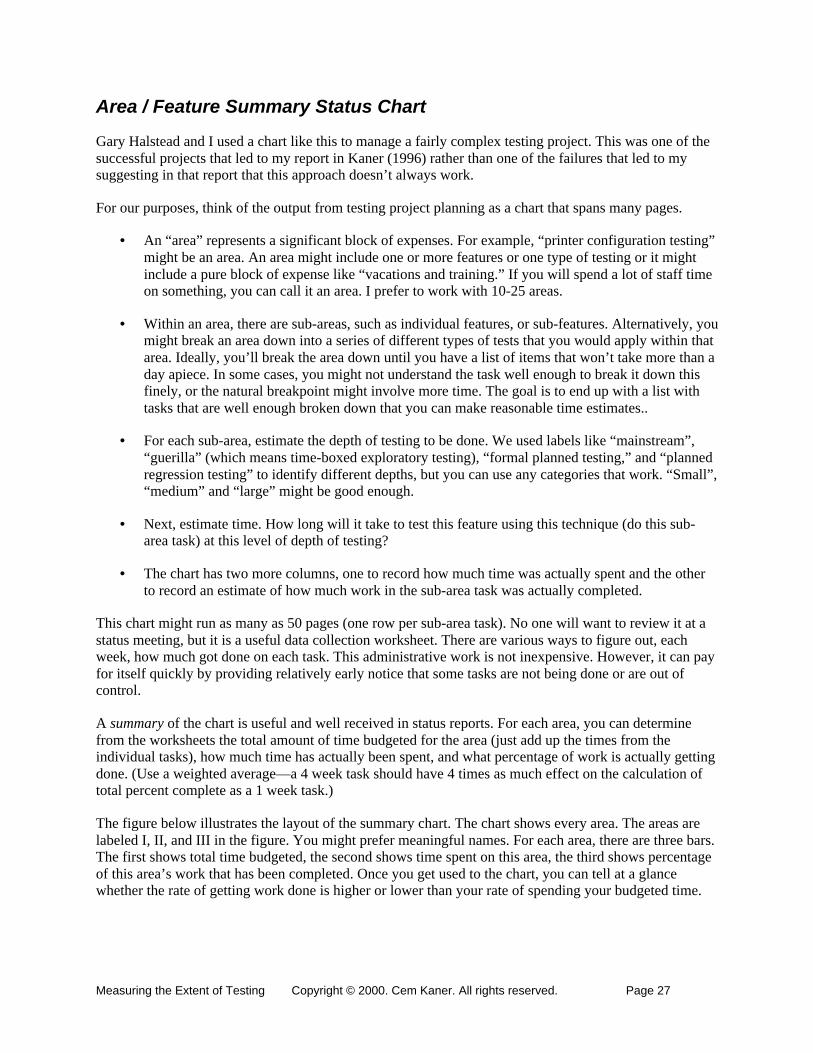
Area / Feature Summary Status Chart
Gary Halstead and I used a chart like this to manage a fairly complex testing project. This was one of thesuccessful projects that led to my report in Kaner (1996) rather than one of the failures that led to mysuggesting in that report that this approach doesn’t always work.
For our purposes, think of the output from testing project planning as a chart that spans many pages.
• An “area” represents a significant block of expenses. For example, “printer configuration testing”might be an area. An area might include one or more features or one type of testing or it mightinclude a pure block of expense like “vacations and training.” If you will spend a lot of staff timeon something, you can call it an area. I prefer to work with 10-25 areas.
• Within an area, there are sub-areas, such as individual features, or sub-features. Alternatively, youmight break an area down into a series of different types of tests that you would apply within thatarea. Ideally, you’ll break the area down until you have a list of items that won’t take more than aday apiece. In some cases, you might not understand the task well enough to break it down thisfinely, or the natural breakpoint might involve more time. The goal is to end up with a list withtasks that are well enough broken down that you can make reasonable time estimates..
• For each sub-area, estimate the depth of testing to be done. We used labels like “mainstream”,“guerilla” (which means time-boxed exploratory testing), “formal planned testing,” and “plannedregression testing” to identify different depths, but you can use any categories that work. “Small”,“medium” and “large” might be good enough.
• Next, estimate time. How long will it take to test this feature using this technique (do this sub-area task) at this level of depth of testing?
• The chart has two more columns, one to record how much time was actually spent and the otherto record an estimate of how much work in the sub-area task was actually completed.
This chart might run as many as 50 pages (one row per sub-area task). No one will want to review it at astatus meeting, but it is a useful data collection worksheet. There are various ways to figure out, eachweek, how much got done on each task. This administrative work is not inexpensive. However, it can payfor itself quickly by providing relatively early notice that some tasks are not being done or are out ofcontrol.
A summary of the chart is useful and well received in status reports. For each area, you can determinefrom the worksheets the total amount of time budgeted for the area (just add up the times from theindividual tasks), how much time has actually been spent, and what percentage of work is actually gettingdone. (Use a weighted average—a 4 week task should have 4 times as much effect on the calculation oftotal percent complete as a 1 week task.)
The figure below illustrates the layout of the summary chart. The chart shows every area. The areas arelabeled I, II, and III in the figure. You might prefer meaningful names. For each area, there are three bars.The first shows total time budgeted, the second shows time spent on this area, the third shows percentageof this area’s work that has been completed. Once you get used to the chart, you can tell at a glancewhether the rate of getting work done is higher or lower than your rate of spending your budgeted time.
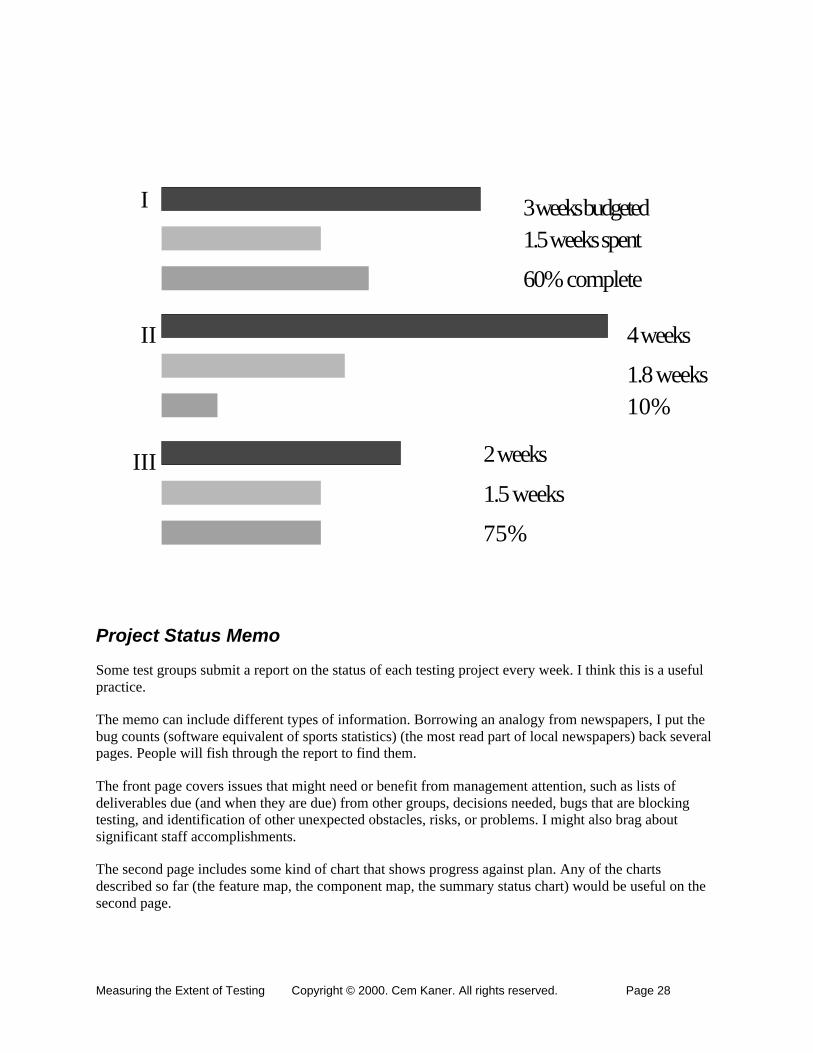
Measuring the Extent of Testing Copyright © 2000. Cem Kaner. All rights reserved. Page 28
3 weeks budgeted
4 weeks
2 weeks
1.5 weeks spent
75%
1.5 weeks
60% complete
10%1.8 weeks
I
II
III
Project Status Memo
Some test groups submit a report on the status of each testing project every week. I think this is a usefulpractice.
The memo can include different types of information. Borrowing an analogy from newspapers, I put thebug counts (software equivalent of sports statistics) (the most read part of local newspapers) back severalpages. People will fish through the report to find them.
The front page covers issues that might need or benefit from management attention, such as lists ofdeliverables due (and when they are due) from other groups, decisions needed, bugs that are blockingtesting, and identification of other unexpected obstacles, risks, or problems. I might also brag aboutsignificant staff accomplishments.
The second page includes some kind of chart that shows progress against plan. Any of the chartsdescribed so far (the feature map, the component map, the summary status chart) would be useful on thesecond page.

Measuring the Extent of Testing Copyright © 2000. Cem Kaner. All rights reserved. Page 29
The third page features bug counts. The fourth page typically lists the recently deferred bugs, which we’lltalk about at the weekly status meeting.
Across the four pages (or four sections), you can fit information about effort, obstacles, risk, agreement-based status, bug counts, and anything else you want to bring to the project team’s or management’sattention.
Effort Report
When you assign someone to work on a project, you might not get much of their time for that project.They have other things to do. Further, even if they were spending 100% of their time on that project, theymight only be running tests a few hours per week. The rest of their time might be spent on test planning,meetings, writing bug reports, and so on.
The following chart is a way of capturing how your staff spend their time.
Rather than using percentages, you might prefer to work in hours. This might help you discover that theonly people who are getting to the testing tasks are doing them in their overtime. (Yes, they are spending20% of their time on task, but that 20% is 10 hours of a 50 hour week.)
Effort-based reporting is useful when people are trying to add new projects or new tasks to your group’sworkload, or when they ask you to change your focus. You show the chart and ask which things to cutback on, in order to make room for the new stuff.
0-10% 10%-20% 20%-30% 30%-40% 40%-60%
Coordination 8 2 0 2 0
StatusReporting
12 0 0 0 0
SetupEnvironment
4 3 3 0 1
Scoping 5 5 2 0 0
Ad Hoc 7 2 1 2 0
Design/Doc 1 3 5 1 2
Execution 1 3 5 3 0
Inspections 7 5 0 0 0
Maintenance 9 3 0 0 0
Review 10 2 0 0 0

Measuring the Extent of Testing Copyright © 2000. Cem Kaner. All rights reserved. Page 30
BugAdvocacy
5 5 2 0 0
A Set of Charts for Requirements-Driven Testing
Jim Kandler manages testing in an FDA-regulated context. He tracks/reports the progress of the testingeffort using a set of charts similar to the following four:
• Traceability matrix that traces test cases to requirements
• Test case status chart
• Testing effort charts
• Bug status charts
Traceability Matrix
In the traceability matrix, you list specification items or requirements items across the top (one percolumn). Each row is a test case. A cell in the matrix pairs a test case with a requirement. Check it off ifthat test case tests that requirement.
Requirement 1 Requirement 2 Requirement 3 Requirement 4 Requirement 5 Etc.
Test 1 * *
Test 2 * * *
Test 3 *
Totals 1 1 3 0 1
The chart shows several things:
• If Requirement 5 changes, then you know that you need to update test case 2 and that youprobably don’t need to update the others.
• Requirement 4 is untested
• Requirement 3 is tested in every test. The matrix is unbalanced—there appears to be too muchtesting of some features compared to others.
Notice that if we don’t write down a requirement, we won’t know from this chart what is the level ofcoverage against that requirement. This is less of an issue in an FDA-regulated shop because allrequirements (claims) must be listed, and there must be tests that trace back to them.

Measuring the Extent of Testing Copyright © 2000. Cem Kaner. All rights reserved. Page 31
Test Case Status Chart
For each test case, this chart tracks whether it is written, has been reviewed, has been used, and what bugshave been reported on the basis of it. If the test is blocked (you can’t complete it because of a bug), thechart shows when the blocking bug was discovered.
Many companies operate with a relatively small number of complex regression tests (such as 500). Achart that shows the status of each test is manageable in size and can be quite informative.
Test CaseID
Written Reviewed Executed Blocked SoftwareChangeRequest
1 1 1
2 1 1 1 118
3 1 1 1 10/15/00 113
4 1
5
6
7
Totals 7 4 3 2
100% 57% 42% 29%
Testing Effort Chart
For each tester, this shows how many hours the person spent testing that week, how many bugs (issues)she found and therefore how many hours per issue. The numbers are rolled up across testers for asummary report to management that shows the hours and issues of the group as a whole.
Week of Hours Issues Hr/Issue
20 Aug 19.5 19 1.03
27 Aug 40.0 35
3 Sept 62 37
10 Sept 15 10
Measuring the Extent of Testing Copyright © 2000. Cem Kaner. All rights reserved. Page 32
A chart like this helps the manager discover that individual staff members have conflicting commitments(not enough hours available for testing) or that they are taking remarkably short or long times per bug.Trends (over a long series of weeks) in availability and in time per failure can be useful for highlightingproblems with individuals, the product, or the project staffing plan.
As a manager, I would not share the individuals’ chart with anyone outside of my group. There are toomany risks of side effects. Even the group totals invite side effects, but the risk might be moremanageable.
Bug Status
Bug handling varies enough across companies that I’ll skip the chart. For each bug, it is interesting toknow when it was opened, how long it’s been opened, who has to deal with it next, and its currentresolution status (under investigation, fixed, returned for more info, deferred, etc.). Plenty of otherinformation might be interesting. If you put too much in one chart, no one will understand it.
Summary
Jim shared some lessons learned with these four charts (traceability, test case status, effort, and bugstatistics) that are generally applicable for project status reporting. In summary, he said:
• It doesn’t have to be complicated to be valuable. Simple charts are valuable.
• It’s important to understand your universe (or scope) of tests.
• It’s important to have very clean tracking of progress against the universe of tests.
• Under the right circumstances, repeated use of the same tests can be very valuable.
• You learn a lot of project status issues by reporting multi-week statistics instead of a snapshot.
• It’s valuable to track human hours against a specific activity. The process of tracking this leadsyou to questions that help you manage the project more effectively.
• You can pinpoint high risk areas once you’ve established scope.
• You can use this tool as a guide to the chronology of the project.
• This approach to tracking is time effective and easy to delegate.
• It’s instructive to note that not all tests are created equal—the percentages in the chart may bemisleading.
These lessons apply well in highly regulated industries. In mass-market software, some of them will beless applicable.

Measuring the Extent of Testing Copyright © 2000. Cem Kaner. All rights reserved. Page 33
Project Dashboard
James Bach has spoken several times about his project status dashboard. See, for example, Bach (1999),which includes the following picture as an example. This is a simple tool, but a very useful one.
The dashboard is created on a large whiteboard, typically in the main project conference room.
Different groups vary the columns and the headings. Bach prefers to keep the design as simple anduncluttered as possible. Here’s the variation that I prefer (which breaks one of James’ columns in two).
• Area: Break the testing project down into not more than 25 or 30 areas (at most).
• Effort: How much work / time are we currently spending on this area? (“Blocked” means that wewant to test in this area but we can’t because the code isn’t testable, perhaps because of missingcode or a blocking bug.)
• Coverage planned: However we define coverage, how much coverage do we intend to achieve inthis area? (0 = untested, 3 = very high coverage).
• Coverage achieved: How much have we gotten done?
• Quality: Blank = no data. Frowny-face = bad quality. Neutral-face = not great yet but not a crisis.Smiley-face = high quality.
• Comments: Includes notes and bug report numbers. Whatever is needed to quickly flag issues.
• Green means things go well. Red indicates a serious problem. Yellow indicates a problemthat needs attention.
A manager can read the testing project status at a glance from this board. If there are lots of frowny facesand red rows, the project has trouble. If planned and achieved coverage don’t match, the product needs

Measuring the Extent of Testing Copyright © 2000. Cem Kaner. All rights reserved. Page 34
more testing. Update the dashboard frequently (every day or few days) and it becomes a focal point forproject status discussions.
Bach (1999) provides more information about the dashboard in practice. His live presentation is worthattending.
Summing Up
Many test groups focus their progress reports on bug counts. When you ask how much testing they’vedone, they say, 322 bugs worth. Or they speak in terms of a product coverage measure, like codecoverage.
There are many other ways to answer the questions:
• How much testing have you gotten done?
• How much do you have left to do?
• How are you going to tell management about it?
This paper has provided a survey of suggested answers, a framework for evaluating them, and samples ofpresentation approaches used by several successful test managers and consultants.
This paper doesn’t provide what we might think that we really need—a small set of measures that areknown to be useful and valid, and a standardized reporting style that everyone will anticipate and learn tounderstand.
It takes time to develop and validate a good set of metrics. I’m not there yet. I don’t think the field is thereyet. I don’t expect us to be there next year or the year after, but we’ll make progress. Unless we have abreakthrough, progress is incremental.
References
Amland (1999), “Risk Based Testing and Metrics” 16th International Conference on Testing ComputerSoftware.
Austin, R.D. (1996) Measuring and Managing Performance in Organizations.
Bach, James (1999) “A Low Tech Testing Dashboard”, STAR Conference East, Available atwww.satisfice.com/presentations/dashboard.pdf.
Bach, Jonathan. (2000) “Measuring Ad Hoc Testing”, STAR Conference West.
Beizer, B. (1990) Software Testing Techniques (2nd Ed.)
S. Brown (Ed., 1991) The Product Liability Handbook: Prevention, Risk, Consequence, and Forensics ofProduct Failure.
Cornett, S., Code Coverage Analysis, www.bullseye.com/coverage.html

Measuring the Extent of Testing Copyright © 2000. Cem Kaner. All rights reserved. Page 35
Dhillon, B.S. (1986) Human Reliability With Human Factors.
Fenton, N. & Pfleeger S. (1997) Software Metrics: A Rigorous & Practical Approach.
Glass, R.L. (1992) Building Quality Software.
Grady, R.B. (1992) Practical Software Metrics for Project Management and Process Improvement.
Grady, R.B. & D.L. Caswell, (1987) Software Metrics: Establishing a Company-Wide Program.
Hoffman, D. (2000) “The darker side of metrics”, Pacific Northwest Software QualityConference.
Johnson, M.A. (1996) Effective and Appropriate Use of Controlled Experimentation in SoftwareDevelopment Research, Master's Thesis (Computer Science), Portland State University.
Jones, C. (1991) Applied Software Measurement, 1991, p. 238-341.
Kaner, C. (1995) “Software negligence and testing coverage”, Software QA Quarterly, Volume 2, #2, 18.Available at www.kaner.com.
Kaner, C. (1996) “Negotiating testing resources: A collaborative approach”, Ninth International SoftwareQuality Week Conference. Available at www.kaner.com.
Kaner, C. (1997) “The impossibility of complete testing”, Software QA, Volume 4, #4, 28. Available atwww.kaner.com.
Kaner, C. (1999) “Yes, but what are we measuring?”, Pacific Northwest Software Quality Conference,available from the author at [email protected].
Kaner, C., J. Falk, & H.Q. Nguyen (1993, reprinted 1999) Testing Computer Software (2nd. Ed.)
Kitchenham, Pfleeger, & Fenton (1995) “Towards a framework for software measurement andvalidation.” IEEE Transactions on Software Engineering, vol. 21, December, 929.
Marick, B. (1995) The Craft of Software Testing.
Marick, B. (1999), “How to Misuse Code Coverage”, 16th International Conference on TestingComputer Software. Available at www.testing.com/writings.html.
Marick, B. (2000), “Faults of Omission”, Software Testing & Quality Engineering, January issue.Available at www.testing.com/writings.html.
Myers, G. (1979) The Art of Software Testing.
Schneidewind, N. (1994) “Methodology for Validating Software Metrics,” Encyclopedia of SoftwareEngineering (Marciniak, ed.) see also IEEE 1061, Standard for a Software Quality MetricsMethodology.
Weinberg, G.M. (1993) Quality Software Management, Volume 2, First-Order Measurement.

Measuring the Extent of Testing Copyright © 2000. Cem Kaner. All rights reserved. Page 36
Weinberg, G.M. & E.L. Schulman (1974) "Goals and performance in computer programming," HumanFactors, 16(1), 70-77.
Zuse, H. (1997) A Framework of Software Measurement.