Surface prediction and measurement for modulated tool path ...

Measurement and prediction of the relationshipbetween capillary pressure, saturation, and interfacialarea in a NAPL‐water‐glass bead system
Mark L. Porter,1 Dorthe Wildenschild,1 Gavin Grant,2 and Jason I. Gerhard3
Received 28 January 2009; revised 3 March 2010; accepted 10 March 2010; published 6 August 2010.
[1] In this work, the constitutive relationship between capillary pressure (Pc), saturation(Sw), and fluid‐fluid interfacial area per volume (IFA) is characterized using computedmicrotomography for drainage and imbibition experiments consisting of a nonaqueousphase liquid and water. The experimentally measured relationship was compared to athermodynamic model that relates the area under the Pc − Sw curve to the total IFA, an, andthe capillary‐associated IFA, anw. Surfaces were fit to the experimental and modeledPc − Sw − an and Pc − Sw − anw data in order to characterize the relationship in threedimensions (3D). For the experimental system, it was shown that the Pc − Sw − anrelationship does not exhibit hysteresis. The model is found to provide a reasonableapproximation of the magnitude of the 3D surfaces for an and anw, with a mean absolutepercent error of 26% and 15%, respectively. The relatively high mean absolute percenterrors are primarily the result of discrepancies observed at the wetting‐ andnonwetting‐phase residual saturation values. Differences in the shapes of the surfaces arenoted, particularly in the curvature (arising from the addition of scanning curves andpresence of an − Sw hysteresis in the predicted results) and endpoints (particularly theinherent nature of thermodynamic models to predict significant anw associated withresidual nonwetting‐phase saturation). Overall, the thermodynamic model is shown to be apractical, inexpensive tool for predicting the Pc − Sw − an and Pc − Sw − anw surfaces fromPc − Sw data.
Citation: Porter, M. L., D. Wildenschild, G. Grant, and J. I. Gerhard (2010), Measurement and prediction of the relationshipbetween capillary pressure, saturation, and interfacial area in a NAPL‐water‐glass bead system, Water Resour. Res., 46, W08512,doi:10.1029/2009WR007786.
1. Introduction
[2] Fluid‐fluid interfacial area (IFA) plays a critical rolein many subsurface multiphase flow and transport processes.Two distinct contributions to the total fluid‐fluid IFA, an,have been identified in the literature. These include capillary‐associated IFA, anw, and film‐associated IFA. Capillary‐associated IFA includes all nonwetting interfaces in contactwith the bulk, mobile wetting‐phase and wetting‐phasependular rings, whereas film‐associated IFA consists of thenonwetting‐phase in contact with the wetting‐phase filmsthat exist on solids of pores occupied by the nonwetting‐phase [Gladkikh and Bryant, 2003]. Figure 1 illustrates thefluid‐fluid interfacial area distinguished in the two‐fluidporous media system addressed in this work. The distinctionbetween an and anw relies on the ability of a particular mea-surement technique to resolve the different components of the
wetting‐phase [Bryant and Johnson, 2004], which will bediscussed further in the following paragraphs.[3] In the past decade, a number of investigations have
focused on the characterization and validation of theconstitutive relationship between capillary pressure, Pc,wetting‐phase saturation, Sw, and anw proposed byHassanizadeh and Gray [1993]. This relationship is anextension of the traditional Pc − Sw constitutive relationship,in which it is assumed that the macroscale variables Pc and Swuniquely describe the microscale physics of the system.Although the traditional approach is useful for modelingpurposes, concerns have been raised regarding its short-comings [e.g., Hassanizadeh and Gray, 1993; Miller et al.,1998; Muccino et al., 1998; Gray, 2000]. Furthermore,modeling complexities arise since hysteresis exists betweendrainage and imbibition events. In an effort to better representthe microscale physics, Hassanizadeh and Gray [1993]expanded the functional dependence of the Pc − Sw rela-tionship to include anw, which explicitly accounts for thenumerous fluid‐fluid interfacial configurations that may existfor any given Sw value. In addition, Hassanizadeh and Gray[1993] hypothesized that the inclusion of anw in the macro-scale formulation of Pc would account for hysteresis observedin the traditional Pc − Sw relationship (i.e., a single 3D surfaceexists in Pc − Sw − anw space).
1School of Chemical, Biological, and Environmental Engineering,Oregon State University, Corvallis, Oregon, USA.
2Geosyntec Consultants, Guelph, Ontario, Canada.3Department of Civil and Environmental Engineering, University of
Western Ontario, London, Ontario, Canada.
Copyright 2010 by the American Geophysical Union.0043‐1397/10/2009WR007786
WATER RESOURCES RESEARCH, VOL. 46, W08512, doi:10.1029/2009WR007786, 2010
W08512 1 of 10

[4] Experimental investigations focused on simulta-neously measuring Pc, Sw, and fluid‐fluid IFA in porousmedia are often difficult, expensive, and subject to limita-tions, thus only a few have been reported in the literature[e.g., Cheng et al., 2004; Culligan et al., 2004, 2006;Brusseau et al., 2006; Chen and Kibbey, 2006; Chen etal., 2007]. Cheng et al. [2004] and Chen et al. [2007]conducted drainage and imbibition experiments (Sw valuesranging from 0.4 to 1.0) in a thin porous micromodel andanalyzed two‐dimensional (2D) images of the fluid con-figurations within the pores to obtain anw estimates. In bothcases the maximum magnitude of the surfaces ranged fromapproximately 2.0–4.5 mm−1, while exhibiting convex cur-vature along the Sw‐axis and relatively little curvature alongthe Pc‐axis (except at high Sw values where a slight convexcurvature exists). Culligan et al. [2004, 2006] used computedmicrotomography (CMT) to quantify anw for air‐water andNAPL‐water drainage and imbibition column experiments;however, these studies focused on characterizing anw − Swcurves and did not directly address the Pc − Sw − anw rela-tionship. Brusseau et al. [2006] related independent mea-surements of Pc − Sw and interfacial tracer technique (IFTT)measurements of an for statistically similar porous media,but did not investigate Pc − Sw − an in 3D. Chen and Kibbey[2006] used IFTT to investigate the Pc − Sw − an relationshipin 3D; however, they only measured an during drainage.The above literature review clearly indicates that there is aneed for further experimental studies focused on character-izing the relationship between Pc − Sw − an and Pc − Sw −anw, particularly for NAPL‐water systems.[5] In lieu of experimental data, pore scale numerical
modeling techniques have proven to be a useful tool forinvestigating the Pc − Sw − anw relationship. A number ofworks have focused on pore network modeling, which have
resulted in a variety of characteristics for the Pc − Sw − anwrelationship [Reeves and Celia, 1996; Held and Celia, 2001;Joekar‐Niasar et al., 2007; Helland and Skjaeveland, 2007;Joekar‐Niasar et al., 2009]. Reeves and Celia [1996] pre-sented a surface that exhibited notable convex curvaturealong both the Sw‐ and Pc‐axis, whereas the surfacespresented by Held and Celia [2001] and Joekar‐Niasar etal. [2007] exhibited a slight concave curvature along thePc‐axis at higher Sw values. Helland and Skjaeveland[2007] investigated the effect of mixed wet media on thePc − Sw − anw relationship and showed that the shape of thesurface was sensitive to contact angle hysteresis. Recently,Joekar‐Niasar et al. [2009] successfully simulated the non-hysteretic Pc − Sw − anw experiments reported by Chen et al.[2007], which exhibited negligible curvature along the Pc‐axis. Lattice‐Boltzmann simulations of the Pc − Sw − anwrelationship were also recently reported [Porter et al., 2009],and the results showed that the modeled surface exhibitedconvex curvature along the Sw‐axis, while there was negli-gible curvature along the Pc‐axis.[6] Thermodynamic considerations suggest that an is
proportional to the work of fluid displacement as estimatedby the area under the Pc − Sw curve [Leverett, 1941;Morrow, 1970]. Although originally employed for predict-ing an − Sw during nonwetting‐phase displacing wetting‐phase (i.e., drainage), this approach has been furtherdeveloped for estimating (1) an − Sw during imbibition[Bradford and Leij, 1997], (2) an at residual NAPL satura-tion [Dobson et al., 2006], and (3) an for any Sw value whenthe saturation history is known [Grant and Gerhard, 2007a;Schroth et al., 2008]. While the thermodynamic methodestimates an, heuristic conversion to anw can be achieved byemploying, for example, anw/an functions from the literatureand accounting for the energy dissipation associated withnon‐reversible capillary instabilities [Grant and Gerhard,2007a]. The Grant and Gerhard [2007a] model (hereafter,Explicit IFA model) for predicting anw − Sw was demon-strated to provide reasonable approximations of measureddata sets [Culligan et al., 2004, 2006] without any calibra-tion to the data [Grant and Gerhard, 2007a]. Such models,once validated, provide a relatively simple method to esti-mate an and anw, and thereby avoid the expense of directmeasurement. Furthermore, the dependence of an and anw onPc − Sw functions, which are already embedded in multi-phase flow simulators, can provide a straightforward andreliable means to simulate processes that depend on IFA(e.g., nonwetting‐phase dissolution) without resorting tolumped mass transfer coefficients [Grant and Gerhard,2007b]. However, rigorous validation for these modelshas been limited by lack of appropriate data [Schroth etal., 2008]. To the authors’ knowledge, thermodynamicmodels have not been evaluated for their ability to predictPc − Sw − an or Pc − Sw − anw surfaces.[7] The objective of this study is to directly measure Pc,
Sw, an, and anw during drainage and imbibition and compareobservations with those predicted from a thermodynamicmodel. These direct measurements are used to establishPc − Sw − an and Pc − Sw − anw relationships. The comparisonbetween observations and predictions provides insight intothe value of thermodynamic models to provide reasonableapproximations of Pc − Sw − an and Pc − Sw − anw. We alsohighlight aspects of CMT image analysis that distinguishbulk wetting‐phase funicular patterns from pendular rings.
Figure 1. Illustration of the interfacial areas defined for thetwo‐fluid porous system addressed in this work.
PORTER ET AL.: CAPILLARY PRESSURE, SATURATION, AND IFA W08512W08512
2 of 10

The differentiation of these separate wetting‐phasemorphologies allows for more detailed characterization ofthe experimental data and quantification of the amount ofwetting‐phase associated with each morphology.
2. Methods
2.1. NAPL‐Water Experiments
[8] The drainage and imbibition experiments presentedhere were carried out at the GeoSoilEnviro Consortium forAdvanced Radiation Sources (GSECARS) bending mag-netic beamline, Sector 13, Advanced Photon Source (APS),Argonne National Laboratory. A detailed description ofsynchrotron CMT is beyond the scope of this work; detailsregarding CMT applied to similar multiphase systems canbe found in the works of Wildenschild et al. [2002, 2005],Culligan et al. [2004, 2006], and Porter and Wildenschild[2010, and references therein].[9] The experiments were conducted in a glass column
(inside diameter = 7.0 mm; length = 25.0 mm) packed withsoda‐lime glass beads (r = 2.5 g/cm3). The size distributionof the bead diameters are provided in Table 1. A semi‐permeable, hydrophilic membrane (Nylaflo Nylon Mem-brane, 0.2 mm) was placed at the bottom of the column toprevent NAPL from entering the water line. The water linewas connected to a syringe pump (Gilson 402, Gilson Inc.),which precisely controlled (± 1.0 ml) the amount of waterpumped into and out of the porous medium. A small rubberstopper containing a NAPL outlet tube connected to a res-ervoir was placed inside the column in contact with the topof the porous medium. The NAPL used in this study wasSoltrol 220 (Chevron Philips, r = 0.79 g/cm3) dyed red withOil Red O (Sigma Aldrich) and the interfacial tension was0.0378 N/m [Schaap et al., 2007]. The water was doped
with KI at a 1:6 mass ratio of KI:H2O, which increased thecontrast between the water and NAPL phases in the CMTimages. The pressure of each phase was measured (ValidyneP55 Differential Pressure Transducer) in the fluid linesabove and below the porous medium throughout the entireexperiment. A quasi‐static point on the Pc − Sw curve wasobtained by pumping a precise amount of water into(imbibition) or out of (drainage) the column at a flow rateof 0.6 ml/hr, shutting off the pump and then waiting for15 minutes to allow for the system to equilibrate. It is ex-pected that this equilibration time is appropriate for Sw > 0.5,although it is known that pressure equilibrium after a satu-ration change tends to increase with decreasing Sw [Gerhardand Kueper, 2003]. However, it is also known that themajority of saturation change occurs at early time [Gerhardand Kueper, 2003] and the CMT images were visually in-spected for fluid movement. In the few cases that fluidmovement was observed in the images, the system wasallowed to equilibrate until fluid movement was no longerobserved. Thus, it was assumed that the system was at near‐equilibrium conditions for all Pc − Sw points. The CMTimage data consisted of scanning a 5.5 mm section in themiddle of the column at a resolution of 13 mm/voxel. Theimaged region and the experimental setup are illustrated inFigure 2.
2.2. Image Analysis
[10] Gray‐scale CMT images require further image anal-ysis to accurately quantify phase distributions and fluid‐fluid IFA. The wetting‐, nonwetting‐ and solid‐phasevolume fractions were quantified via a segmentation routineand IFA was quantified using the commercially availableimage analysis software Avizo™. Details regarding oursegmentation algorithm and its validation are available in thework of Porter and Wildenschild [2010]. The segmenteddata consists of three integer values (trinary), each re-presenting a single phase. Porosity and saturation valueswere quantified by counting the voxels for each phase in thesegmented data, and the resulting porosity of the imagedsection was 0.36.
Figure 2. Illustration of the experimental column and sub‐volumes from which Sw and IFA weremeasured.
Table 1. Size Distribution of Soda Lime Beads
Percent Weight Diameter (mm)
0.35 0.60.35 0.80.30 1.0–1.4
PORTER ET AL.: CAPILLARY PRESSURE, SATURATION, AND IFA W08512W08512
3 of 10

[11] In order to distinguish between the bulk wetting‐phase and pendular rings (see Figure 5) we used the IDL™LABEL_REGION function to consecutively label all of thedisconnected regions of each wetting‐phase binary data set.Technically, the wetting‐phase is fully connected via films;however, films are not resolved at a resolution of 13 mm,thus the wetting‐phase appears disconnected in the CMTimages. It was assumed that the regions connected to thebottom of the imaged column section (where the waterenters and exits the section) represent bulk wetting‐phase,whereas the remaining regions were considered to be pen-dular rings. It is acknowledge that this criteria does notguarantee that the identified bulk wetting‐phase is connectedto the outlet of the column; therefore, it was visually con-firmed that the identified bulk wetting‐phase exhibited afunicular pattern that spanned the entire length of the imagedsection in every instance. Furthermore, it was visually con-firmed that the bulk wetting‐phase swelled between suc-cessive imbibition points, whereas the pendular rings did notshow any significant increase in size, suggesting that the bulkwetting‐phase was indeed connected to the outlet of thecolumn.[12] The total interfacial area for the solid phase, as,
wetting‐phase, aw, and nonwetting‐phase, an, was estimatedvia a generalized marching cubes algorithm in Avizo™,which generates isosurfaces between phases based upon asingle isovalue chosen to separate one phase from the otherphases. In this analysis the trinary data was mapped intothree binary images, one for each phase, and then smoothedwith a Gaussian filter (3 × 3 × 3 kernel) prior to constructingthe isosurfaces. The isovalue for each isosurface was set to0.5, which is half of the maximum and minimum values ineach binary data set. Estimates of anw were calculated usingthe following equation [Montemagno and Ma, 1999; Dallaet al., 2002]
anw ¼ 1
2aw þ an � asð Þ ð1Þ
[13] Due to the relatively small size of the imaged section,we performed a representative elementary volume (REV)analysis for Sw, anw, an, and porosity. The REV analysisconsisted of calculating these values for volumes rangingfrom approximately 6 × 10 −5 ‐ 213 mm3. Figure 3 shows
the REV analysis for the subset of Sw and anw values. Thevertical lines in Figure 3 represent the volume (128 mm3) ofthe cube analyzed in section 3. The REV analysis for Sw(Figure 3a) illustrates that Sw is essentially constant forvolumes near 128 mm3 implying that the cube is an REV.Furthermore, no significant changes in Sw are observed dueto the presence of the column walls (213 mm3 correspondsto the entire imaged section of the column), thus edge effectsare considered to be small. The REV analysis for anw(Figure 3b) clearly shows that the anw values also vary littleas the volume approaches that of the cube, indicating thatthe cube indeed comprises an REV for anw as well. Esti-mates of anw for volumes larger than the analyzed cube arenot shown since the column wall introduces a fourth phasein the interfacial area calculation. It is noted that the cube isan REV for an and porosity; however, this is not shown.
2.3. Explicit IFA Model
[14] Grant and Gerhard [2007a] developed the ExplicitIFA model, which is an extension of the thermodynamicmodel presented by Leverett [1941]. The thermodynamicapproach hypothesizes that for a given Sw value, an can becalculated according to [Leverett, 1941]:
an Swð Þ ¼ �Fnw Swð Þ�nw
; Sr < Sw � 1:0 ð2Þ
where � is the porosity, snw is the interfacial tensionbetween the aqueous phase and the NAPL, and Fnw (Sw) isthe area under the Pc − Sw curve:
Fnw Swð Þ ¼ �ZSwX
Pc Swð ÞdSw ð3Þ
Here X is equal to the value of Sw when Pc = 0, and Pc(Sw) isthe capillary pressure–saturation function for drainage orimbibition. In order to provide a model that can predict anwfor all possible Sw values and be incorporated into multi-phase flow and transport models, the Explicit IFA modelincorporates five modifications to the basic thermodynamicmodel: (1) incorporating the Gerhard and Kueper [2003]hysteretic constitutive functions, which were validated forNAPL migration in heterogeneous porous media by Grantet al. [2007], (2) implementing continuity of saturation
Figure 3. REV analysis for a subset of (a) Sw and (b) anw values. The vertical lines represent the volumeof the cube that was analyzed in section 3.
PORTER ET AL.: CAPILLARY PRESSURE, SATURATION, AND IFA W08512W08512
4 of 10
history at all saturation reversal points, (3) conversion of anto anw using a saturation‐dependent function derived fromprimary drainage data reported by Dalla et al. [2002],(4) accounting for energy losses via an energy dissipationfactor, Ed, obtained by calibration to the data of Brusseau etal. [2006], and (5) implementation of an anw − Sw relation-ship for the dissolution of residual NAPL.[15] The Explicit IFA model is summarized as [Grant and
Gerhard, 2007a]:
anw Siw� � ¼ Y Siw
� � � Ed � � Fnw Swð Þ½ �D; I*;D*�nw
ð4Þ
where Y is the ratio of anw/an that was obtained by cali-bration to data reported by Dalla et al. [2002] and Sw
i is thecurrent Sw value. The superscripts D, I* and D* denoteprimary drainage, main imbibition and all subsequentimbibition events, and main drainage and all other drainageevents, respectively. Thus, the model is able to predict bothan and anw for any Pc − Sw curve and any saturation history.Further details regarding equation (4) can be found in thework of Grant and Gerhard [2007a, equations (12)–(15)].[16] The model employs the Gerhard and Kueper [2003]
constitutive relationships, which are extensions of theBrooks and Corey [1964] Pc − Sw relationship that accountfor complex Sw history. The primary drainage curve isdefined as [Gerhard and Kueper, 2003]:
Pc ¼ PE S���1
de
� �ð5Þ
where PE is the entry (displacement) pressure defined by theextension of the primary drainage curve to Sw = 1.0, ld isthe pore‐size distribution index associated with drainageprocesses, and Se = Sw�Sr
1�Sris the effective wetting phase
saturation, in which Sr is the wetting phase residual satu-
ration parameter corresponding to infinite Pc. The mainimbibition curve, which results if the minimum possible Swwas attained on primary drainage, is defined by a modifiedform of the drainage curve [Gerhard and Kueper, 2003]:
Pc ¼ PTSw � Sr
SX*w � Sr
!���1i
ð6Þ
where PT is the terminal capillary pressure, li is the imbi-bition pore‐size distribution index, and Sw
X* is the maximumnonwetting‐phase residual Sw value. Further details (e.g., forscanning curves) are provided by Gerhard and Kueper[2003]. Relevant to this work, the parameters PE, PT, ld,li, Sw
X* and Sr are best‐fit to the measured Pc − Sw data.[17] The Explicit IFA model therefore relies only on the
independently measured Pc − Sw parameters, porosity, andfluid‐fluid interfacial tension in order to predict an and anwfor any Sw value. Predicted anw − Sw was demonstrated byGrant and Gerhard [2007a] to reproduce both the magni-tude and the shape of measured anw − Sw data, includingthe peak interfacial area at 0.2 < Sw < 0.3. Furthermore, themodel was found to reproduce negligible anw at Sr and theobserved hysteresis of anw − Sw [Grant and Gerhard, 2007a].Moreover, the predicted anw values were found useful forpredicting the dissolution of pooled and residual NAPL inheterogeneous porous media [Grant and Gerhard, 2007b].Note that the model’s assumed relationship between anw andSw for the dissolution of residual NAPL is not evaluated inthis work.[18] The method of Brusseau et al. [2006] is employed in
this work to develop experimental relationships of Pc − Sw −anw and Pc − Sw − an. The column Pc − Sw data was best‐fitwith the Gerhard and Kueper [2003] hysteretic constitutiverelationships (i.e., modified Brooks‐Corey). These relation-ships were then used to determine Pc for each an − Sw andanw − Sw pair measured on the cube (Figure 2). This couplingof the two data sets at different scales via the Sw valueassumes that (1) the cube is an REVwith respect to Pc, whichis reasonable since it was shown to be an REV for both Swand anw (section 2.2), and (2) that the Pc − Sw relationshipsfor the column and the cube are similar.
3. Results and Discussion
3.1. Capillary Pressure–Saturation Curves
[19] The drainage and imbibition Pc − Sw curves for thecolumn are shown in Figure 4. Excellent repeatability isobserved on drainage and imbibition cycles beyond primarydrainage; it is hypothesized that the latter is less represen-tative of the REV because the nonwetting‐phase has notpenetrated the length of the entire column at high Sw values.The best‐fit parameters to the data, presented in Table 2,were therefore determined with the primary drainage valuesomitted. The entry pressure and high pore size distributionindices are in the range of values for sand with similar grain
Figure 4. Hysteretic Pc − Sw curves for the NAPL‐water‐glass bead system. Drainage and imbibition are representedby the open and solid symbols, respectively. The solidline was obtained using equations (5) and (6). The lowestSw values (corresponding to Pc values of approximately1900 Pa) are not shown here in order to preserve thevertical resolution.
Table 2. Best Fit Parameters for the Modified Brooks and CoreyRegression Curves
PE PT ld li SwX* Sr
220 Pa 90.0 Pa 5.2 7.5 0.91 0.07
PORTER ET AL.: CAPILLARY PRESSURE, SATURATION, AND IFA W08512W08512
5 of 10
size distributions (e.g., medium to coarse) [Brooks andCorey, 1964; Liu et al., 1998; Oostrom and Lenhard, 1998].
3.2. Interfacial Area Estimates
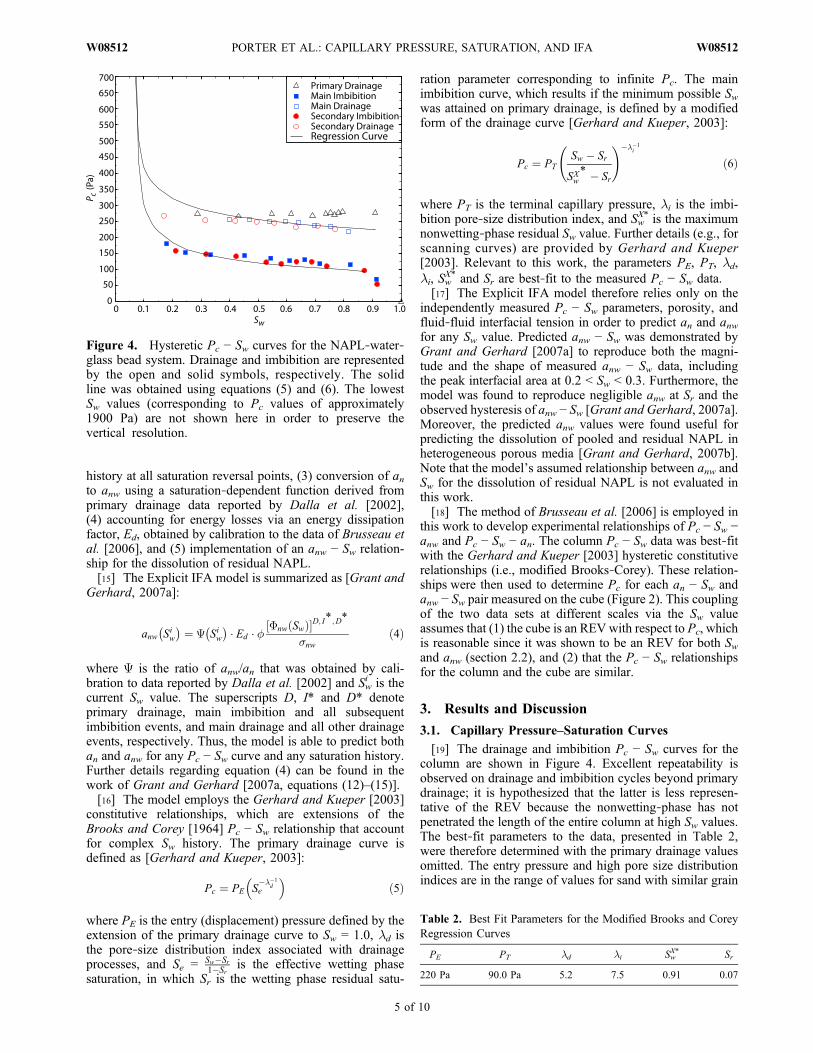
[20] A few examples of the nonwetting‐ and wetting‐phase isosurfaces used to estimate IFA are shown inFigure 5. The isosurfaces shown represent primary drainage,main drainage, and secondary imbibition. The wetting‐phaseisosurface for primary drainage shows the existence ofnumerous pendular rings and wetting‐phase bridges at asaturation of 0.09. Figure 5 (right) shows the portion of thewetting‐phase isosurface associated with pendular rings andthat associated with the bulk wetting‐phase, demonstratingthat even at low saturations the wetting‐phase was relativelywell connected in funicular patterns. In fact, approximately80% of the water at Sw = 0.09 is associated with the bulk
wetting phase. During main drainage very few pendular ringshave formed at Sw = 0.64, whereas during imbibitionnumerous pendular rings are still present at Sw = 0.53.[21] Figure 6 shows the measured an − Sw and anw − Sw
curves. Clearly, an in Figure 6a is a linear function of Sw thattends toward the solid surface area (as = 3.75 mm−1) as Swdecreases. The shape and magnitude of this curve is con-sistent with other experimentally measured curves [e.g., Kimand Rao, 1997; Anwar et al., 2000; Costanza‐Robinson etal., 2008] for similar porous media. It is interesting tonote that virtually no hysteresis is observed in the an − Swcurves in Figure 6a. This result is somewhat unexpectedsince hysteresis is observed in Figure 6b. The shape andmagnitude of the anw − Sw curves are consistent with curvesobserved in other CMT experiments [Culligan et al., 2004,2006; Brusseau et al., 2007] and predicted by pore‐scalenumerical models [Reeves and Celia, 1996; Held and Celia,2001; McClure et al., 2004; Joekar‐Niasar et al., 2007;Porter et al., 2009].
3.3. Experimental Constitutive Relationship
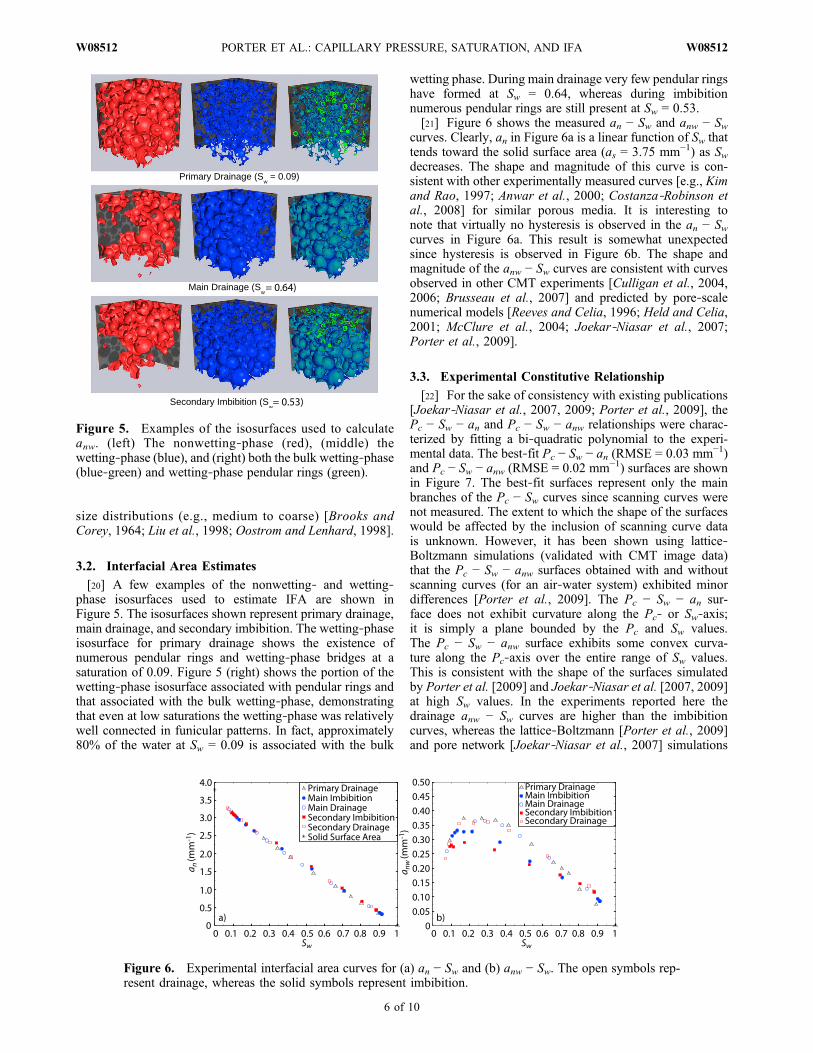
[22] For the sake of consistency with existing publications[Joekar‐Niasar et al., 2007, 2009; Porter et al., 2009], thePc − Sw − an and Pc − Sw − anw relationships were charac-terized by fitting a bi‐quadratic polynomial to the experi-mental data. The best‐fit Pc − Sw − an (RMSE = 0.03 mm−1)and Pc − Sw − anw (RMSE = 0.02 mm−1) surfaces are shownin Figure 7. The best‐fit surfaces represent only the mainbranches of the Pc − Sw curves since scanning curves werenot measured. The extent to which the shape of the surfaceswould be affected by the inclusion of scanning curve datais unknown. However, it has been shown using lattice‐Boltzmann simulations (validated with CMT image data)that the Pc − Sw − anw surfaces obtained with and withoutscanning curves (for an air‐water system) exhibited minordifferences [Porter et al., 2009]. The Pc − Sw − an sur-face does not exhibit curvature along the Pc‐ or Sw‐axis;it is simply a plane bounded by the Pc and Sw values.The Pc − Sw − anw surface exhibits some convex curva-ture along the Pc‐axis over the entire range of Sw values.This is consistent with the shape of the surfaces simulatedby Porter et al. [2009] and Joekar‐Niasar et al. [2007, 2009]at high Sw values. In the experiments reported here thedrainage anw − Sw curves are higher than the imbibitioncurves, whereas the lattice‐Boltzmann [Porter et al., 2009]and pore network [Joekar‐Niasar et al., 2007] simulations
Figure 5. Examples of the isosurfaces used to calculateanw. (left) The nonwetting‐phase (red), (middle) thewetting‐phase (blue), and (right) both the bulk wetting‐phase(blue‐green) and wetting‐phase pendular rings (green).
Figure 6. Experimental interfacial area curves for (a) an − Sw and (b) anw − Sw. The open symbols rep-resent drainage, whereas the solid symbols represent imbibition.
PORTER ET AL.: CAPILLARY PRESSURE, SATURATION, AND IFA W08512W08512
6 of 10
predict imbibition anw − Sw curves that are higher thandrainage curves. In addition, the magnitude of the surfacesare similar to those presented by Porter et al. [2009], butsmaller (by a maximum factor of approximately 3) than thosereported by Joekar‐Niasar et al. [2007]. Note that the anwvalues reported by Joekar‐Niasar et al. [2007] range overan order of magnitude depending upon the displacementrules and porous media configurations, thus the magnitudedifferences observed between those simulations and thedata reported here are most likely due to differences in themodeled system.[23] An interesting observation can be made about
hysteresis in the Pc − Sw − an relationship. Based on thefact that no hysteresis was observed in the an − Sw curves(see Figure 6a), the scanning curves for an would all lieon the same curve and thus fill in the surface (Figure 7a)along the same plane, indicating that a unique surface(i.e., one that exhibits negligible hysteresis) describes thePc − Sw − an relationship. This result is in contrast to IFTTexperiments reported by Chen and Kibbey [2006] in whichhysteresis was observed for successive drainage an − Swcurves.
3.4. Explicit IFA Model Comparison
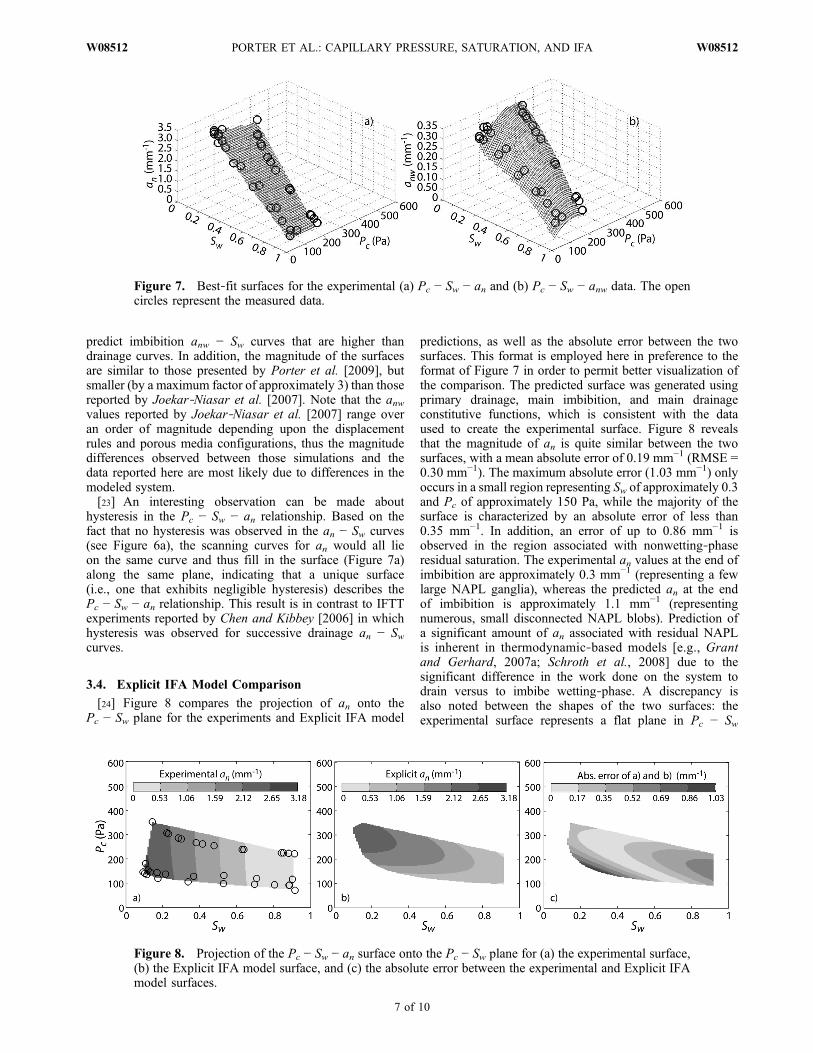
[24] Figure 8 compares the projection of an onto thePc − Sw plane for the experiments and Explicit IFA model
predictions, as well as the absolute error between the twosurfaces. This format is employed here in preference to theformat of Figure 7 in order to permit better visualization ofthe comparison. The predicted surface was generated usingprimary drainage, main imbibition, and main drainageconstitutive functions, which is consistent with the dataused to create the experimental surface. Figure 8 revealsthat the magnitude of an is quite similar between the twosurfaces, with a mean absolute error of 0.19 mm−1 (RMSE =0.30 mm−1). The maximum absolute error (1.03 mm−1) onlyoccurs in a small region representing Sw of approximately 0.3and Pc of approximately 150 Pa, while the majority of thesurface is characterized by an absolute error of less than0.35 mm−1. In addition, an error of up to 0.86 mm−1 isobserved in the region associated with nonwetting‐phaseresidual saturation. The experimental an values at the end ofimbibition are approximately 0.3 mm−1 (representing a fewlarge NAPL ganglia), whereas the predicted an at the endof imbibition is approximately 1.1 mm−1 (representingnumerous, small disconnected NAPL blobs). Prediction ofa significant amount of an associated with residual NAPLis inherent in thermodynamic‐based models [e.g., Grantand Gerhard, 2007a; Schroth et al., 2008] due to thesignificant difference in the work done on the system todrain versus to imbibe wetting‐phase. A discrepancy isalso noted between the shapes of the two surfaces: theexperimental surface represents a flat plane in Pc − Sw
Figure 7. Best‐fit surfaces for the experimental (a) Pc − Sw − an and (b) Pc − Sw − anw data. The opencircles represent the measured data.
Figure 8. Projection of the Pc − Sw − an surface onto the Pc − Sw plane for (a) the experimental surface,(b) the Explicit IFA model surface, and (c) the absolute error between the experimental and Explicit IFAmodel surfaces.
PORTER ET AL.: CAPILLARY PRESSURE, SATURATION, AND IFA W08512W08512
7 of 10

space, whereas the predicted surface exhibits convex cur-vature in the Pc‐axis. This curvature is primarily due to thefact that an values predicted by thermodynamic models arehysteretic between drainage and imbibition events.[25] Figure 9 compares the projection of anw onto the Pc −
Sw plane for the experiments and Explicit IFA model pre-dictions. Once again, the data used to generate the predictedsurface includes primary drainage, main imbibition, andmain drainage. There is good correspondence between themagnitudes of anw for the experiments and predictions. Themaximum absolute error (0.20 mm−1) occurs in a smallregion at low Sw values, with a mean absolute error for theentire surface of 0.04 mm−1 (RMSE = 0.06 mm−1). Themaximum difference at high Sw values is 0.10 mm−1 andcorresponds to discrepancies in the morphology of residualnonwetting‐phase. There are also discrepancies between theshape of the experimental and predicted Pc − Sw − anwsurfaces. The predicted anw surface in Figure 9b exhibitsmore pronounced convex curvature along the Pc‐axis thanobserved in the experimental surface. In addition, the pre-dicted surface peaks with a maximum anw = 0.30 mm−1 atSw values ranging from 0.35–0.60, whereas the experimentalsurface peaks with a maximum anw = 0.36 mm−1 at Sw va-lues ranging from 0.10–0.45. The differences in the shapesof the experimental and predicted surface can, in part, beexplained by differences in the relative magnitudes of suc-cessive anw − Sw curves. The experiments consistently show
all drainage anw − Sw curves higher than all imbibitioncurves, whereas the Explicit IFA model predicts this formain drainage but predicts lower anw for the primarydrainage curve (due to the absence of residual non‐wettingphase).[26] Figure 10 highlights the influence of scanning curves
on the magnitude and shape of the predicted surface andtheir affect on the comparison between the experimental andmodeled surfaces. Thus, the data used to create the surfacein Figure 10b includes primary drainage, main imbibition,and main drainage, as well as 16 drainage and 16 imbibitionscanning curves (corresponding to turnaround Sw values at0.05 increments across the range of 0.1 < Sw < 0.85). Theinclusion of the scanning curves affects the shape of thesurface most notably a low Pc values over the entire range ofSw values. Figure 10c indicates that the maximum absoluteerror is 0.20 mm−1 in a very small region at low Sw values;however, over the majority of the surface the mean absoluteerror is less than 0.07 mm−1. Thus, overall, the predictedmagnitude of the Pc − Sw − anw surface is very good. In factthe mean absolute error between these two surfaces is0.04 mm−1 (RMSE = 0.06 mm−1), the same as obtained withthe surface that did not include scanning curve data. Clearly,the addition of the scanning curve data has caused the for-mation of a saddle; the surface is convex along the Sw‐axisand slightly concave along the Pc‐axis at mid‐range Swvalues. Interestingly, the shape of this predicted surface is
Figure 9. Projection of the Pc − Sw − anw surface onto the Pc − Sw plane for (a) the experimental surface,(b) the Explicit IFA model surface without scanning curves, and (c) the absolute error between the exper-imental and Explicit IFA model surfaces.
Figure 10. Projection of the Pc − Sw − anw surface onto the Pc − Sw plane for (a) the experimental sur-face, (b) the Explicit IFA model surface with scanning curves, and (c) the absolute error between theexperimental and Explicit IFA model surfaces.
PORTER ET AL.: CAPILLARY PRESSURE, SATURATION, AND IFA W08512W08512
8 of 10

similar to the pore network model surface presented byJoekar‐Niasar et al. [2007].
4. Conclusions
[27] In this study, the Pc − Sw − an and Pc − Sw − anwrelationships were characterized using CMT imaging datafor NAPL‐water drainage and imbibition experiments, andsubsequently modeled using the Explicit IFA model [Grantand Gerhard, 2007a]. Image analysis of the CMT dataindicated that at low Sw values the majority of the wetting‐phase (80% or more) consisted of a few funicular paths thatspanned the length of the imaged section, whereas the re-maining wetting‐phase consisted of numerous pendularrings. Both the an − Sw and anw − Sw curves were consistentwith those reported in the literature. Moreover, the experi-mental an − Sw curves indicated that hysteresis was notobserved in an.[28] A bi‐quadratic polynomial was used to characterize
the Pc − Sw − an and Pc − Sw − anw relationships. Theresulting best‐fit experimental surfaces were similar inmagnitude and shape with those previously reported in theliterature, and specific differences were consistent withdifferences in the fluid distributions. In addition, it wasshown that hysteresis in the experimental Pc − Sw − anrelationship is negligible based on the fact that the an − Swcurves were all on the same line.[29] Comparisons between the experiments and the
Explicit IFA model revealed that, as a whole, the model iscapable of reproducing the magnitudes of both Pc − Sw − anand Pc − Sw − anw surfaces. The most notable differencesoccurred in regions associated with the wetting‐ and non-wetting‐phase residual saturations. Thermodynamic modelswill inherently have difficulty reproducing experimentaldata that exhibits values of an and anw for residual NAPLthat is less than those for primary drainage at the same Swvalues. Experimental systems for measuring Pc, Sw, an andanw, and constitutive relationships based on those data, areknown to be less representative of REV’s at the functionextremities. In addition, there were discrepancies betweenthe shapes of the experimental and predicted surfaces. Thesediscrepancies are attributed, in part, to the primary drainagean − Sw and anw − Sw pathway present in the model that isunique from the main imbibition–main drainage closedloop. It is further acknowledged that the experimental datadoes not include scanning curves which may alter the shapeof the surface.[30] Overall, the Explicit IFA predicted Pc − Sw − an and
Pc − Sw − anw results are encouraging since the modelprovides a practical tool for constructing these surfaces fromany measured or estimated Pc − Sw curve. In so doing, itprovides the opportunity to avoid characterizing all soiltypes and fluid pairs via expensive imaging techniques.Further research is needed in order to define the influence ofscanning curves on the experimental surfaces, particularly toconfirm the absence of hysteresis in the surface. It isacknowledged that additional validation of thermodynamicmodels against more complex and representative systemswould be valuable. Further research is also required to(1) determine the model validity and appropriate modelparameters across a wider range of fluid‐fluid‐porous mediasystems, and (2) explore the value of thermodynamicmodels to advance the simulation of interfacial area‐
dependent phenomena at the field scale, such as NAPLsource zone dissolution and NAPL‐aqueous phase reactionkinetics (e.g., in situ chemical oxidation).
[31] Acknowledgments. Porter and Wildenschild were supported byNSF‐EAR‐06101108 and NSF‐EAR‐0337711. We thank Kendra Brownfor her assistance with the experiments at Argonne National Lab and inthe laboratory at Oregon State University. A portion of this work was con-ducted at GeoSoilEnviroCARS (Sector 13), Advanced Photon Source(APS), Argonne National Laboratory. GeoSoilEnviroCARS is supportedby the National Science Foundation‐Earth Sciences (EAR‐0622171) andDepartment of Energy‐Geosciences (DE‐FG02‐94ER14466). Use of theAdvanced Photon Source was supported by the U.S. Department of Energy,Office of Science, Office of Basic Energy Sciences, under contractDE‐AC02‐06CH11357. We thank Mark Rivers and the entire staffat GSECARS for experimental support.
ReferencesAnwar, A., M. Bettahar, and U. Matsubayashi (2000), A method for deter-
mining air‐water interfacial area in variably saturated porous media,J. Contam. Hydrol., 43, 129–146.
Bradford, S. A., and F. J. Leij (1997), Estimating interfacial areas for multi‐fluid soil systems, J. Contam. Hydrol., 27, 83–105.
Brooks, R. H., and A. T. Corey (1964), Hydraulic properties of porousmedia, in Hydrology Papers, Colo. State Univ., Ft. Collins.
Brusseau, M. L., S. Peng, G. Schnaar, and M. S. Costanza‐Robinson(2006), Relationship among air‐water interfacial area, capillary pressureand water saturation for a sandy porous medium,Water Resour. Res., 42,W03501, doi:10.1029/2005WR004058.
Brusseau, M. L., S. Peng, G. Schnaar, and A. Murao (2007), Measuringair‐water interfacial areas with X‐ray microtomography and interfacialpartitioning tracer tests, Environ. Sci. Technol., 41, 1956–1961.
Bryant, S. L., and A. S. Johnson (2004), Bulk and film contributions tofluid/fluid interfacial area in granular media, Chem. Eng. Commun.,191, 1660–1670.
Chen, D., L. J. Pyrak‐Nolte, J. Griffin, and N. J. Giordano (2007), Mea-surement of interfacial area per volume for drainage and imbibition,Water Resour. Res., 43, W12504, doi:10.1029/2007WR006021.
Chen, L., and C. Kibbey (2006), Measurement of air‐water interfacial areafor multiple hysteretic drainage curves in an unsaturated fine sand,Langmuir, 22(16), 6874–6880.
Cheng, J.‐T., L. J. Pyrak‐Nolte, D. D. Nolte, and N. J. Giordano (2004),Linking pressure and saturation through interfacial areas in porousmedia, Geophys. Res. Lett., 31, L08502, doi:10.1029/2003GL019282.
Costanza‐Robinson, M. S., K. H. Harrold, and R. M. Lieb‐Lappen (2008),X‐ray microtomography determination of air‐water interfacial area‐water saturation relationships in sandy porous media, Environ. Sci.Technol., 42(8), 2949–2956.
Culligan, K. A., D. Wildenschild, B. S. Christensen, W. G. Gray, M. L.Rivers, and A. B. Tompson (2004), Interfacial area measurements forunsaturated flow through porous media, Water Resour. Res., 40,W12413, doi:10.1029/2004WR003278.
Culligan, K. A., D. Wildenschild, B. S. Christensen, W. G. Gray, and M. L.Rivers (2006), Pore‐scale characteristics of multiphase flow in porousmedia: A comparison of air‐water and oil‐water experiments, Adv. WaterResour., 29, 227–238.
Dalla, E., M. Hilpert, and C. T. Miller (2002), Computation of the interfa-cial area for two‐fluid porous systems, J. Contam. Hydrol., 56, 25–48.
Dobson, R., M. H. Schroth, M. Oostrom, and J. Zeyer (2006), Determina-tion of NAPL‐water interfacial areas in well‐characterized porous media,Environ. Sci. Technol., 40, 815–822.
Gerhard, J. I., and B. H. Kueper (2003), Capillary pressure characteristicsnecessary for simulating DNAPL infiltration, redistribution, and immobi-lization in saturated porous media, Water Resour. Res., 39(8), 1212,doi:10.1029/2002WR001270.
Gladkikh, M., and S. Bryant (2003), Prediction of interfacial areas duringimbibition in simple porous media, Adv. Water Resour., 26, 609–622.
Grant, G. P., and J. I. Gerhard (2007a), Simulating the dissolution of a com-plex dense nonaqueous phase liquid source zone: 1. Model to predictinterfacial area, Water Resour. Res., 43, W12410, doi:10.1029/2007WR006038.
PORTER ET AL.: CAPILLARY PRESSURE, SATURATION, AND IFA W08512W08512
9 of 10

Grant, G. P., and J. I. Gerhard (2007b), Simulating the dissolution of acomplex dense nonaqueous phase liquid source zone: 2. Experimentalvalidation of an area‐based mass transfer model, Water Resour. Res.,43, W12409, doi:10.1029/2007WR006039.
Grant, G. P., J. I. Gerhard, and B. H. Kueper (2007), Multidimensional val-idation of a numerical model for simulating a DNAPL release in hetero-geneous porous media, J. Contam. Hydrol., 92, 109–128.
Gray, W. G. (2000), Macroscale equilibrium conditions for two‐phase flowin porous media, Int. J. Multiphase Flow, 26, 467–501.
Hassanizadeh, M. S., and W. G. Gray (1993), Thermodynamic basis of cap-illary pressure in porous media, Water Resour. Res., 29(10), 3389–3405.
Held, R. J., and M. A. Celia (2001), Modeling support of functionalrelationships between capillary pressure, saturation, interfacial area andcommon lines, Adv. Water Resour., 24, 325–343.
Helland, J., and S. Skjaeveland (2007), Relationship between capillarypressure, saturation, and interfacial area from a model of mixed‐wettriangular tubes, Water Resour. Res., 43, W12S10, doi:10.1029/2006WR005698.
Joekar‐Niasar, V., S. M. Hassanizadeh, and A. Leijnse (2007), Insights intothe relationship among capillary pressure, saturation, interfacial area andrelative permeability using pore‐network modeling, Transp. PorousMed., 74(2), 201–219.
Joekar‐Niasar, V., S. M. Hassanizadeh, L. Pyrak‐Nolte, and C. Berentsen(2009), Simulating drainage and imbibition experiments in a high poros-ity micromodel using an unstructured pore‐network model, WaterResour. Res., 45, W02430, doi:10.1029/2007WR006641.
Kim, H., and P. S. C. Rao (1997), Determination of effective air‐waterinterfacial area in partially saturated porous media using surfactantadsorption, Water Resour. Res., 33(12), 2705–2711.
Leverett, M. (1941), Capillary behavior in porous solids, Trans. Am. Inst.Min. Metall. Pet. Eng., 142, 152–169.
Liu, Y., J. W. Hopmans, M. Grismer, and J. Chen (1998), Direct estimationof air‐oil and oil‐water capillary pressure and permeability relations frommulti‐step outflow experiments, J. Contam. Hydrol., 32, 223–245.
McClure, J., C. Pan, D. Adalsteinsson, W. Gray, and C. Miller (2004), Esti-mating interfacial areas resulting from lattice‐Boltzmann simulation oftwo‐fluid‐phase flow in a porous medium, in Computational Methodsin Water Resources XV, vol. 1., edited by C. T. Miller et al., Elsevier,New York.
Miller, C. T., G. Christakos, P. T. Imhoff, J. F. McBride, J. A. Pedit, andJ. A. Trangestein (1998), Multiphase flow and transport modeling inheterogeneous porous media: Challenges and approaches, Adv. WaterResour., 21(2), 77–120.
Montemagno, C. D., and Y. Ma (1999), Measurement of interfacial surfaceareas for two‐phase flow in porous media from PVI data, in Character-ization and Measurements of Hydraulic Properties of Unsaturated
Porous Media, edited by M. T. van Genuchten, F. Leije, and L. Wu,pp. 121–132, University of Calif. Press, Riverside.
Morrow, N. R. (1970), Physics and thermodynamics of capillary action inporous media, Ind. Eng. Chem., 62(6), 32–56.
Muccino, J. C., W. G. Gray, and L. A. Ferrand (1998), Toward animproved understanding of multiphase flow in porous media, Rev. Geo-phys., 36(3), 401–422.
Oostrom, M., and R. J. Lenhard (1998), Comparison of relativepermeability‐saturation‐pressure parametric models for infiltration andredistribution of a light nonaqueous‐phase liquid in sandy porous media,Adv. Water Resour., 21(2), 145–157.
Porter, M. L., and D. Wildenschild (2010), Image analysis algorithms forestimating porous media multiphase flow variables from computedmicrotomography data: A validation study, Comput. Geosci., 14(1),15–30, doi:10.1007/s10596-009-9130-5.
Porter, M. L., M. G. Schaap, and D. Wildenschild (2009), Lattice‐Boltzmann simulations of the capillary pressure–saturation–interfacialarea relationship in porous media, Adv. Water Resour., 32(11),1632–1640, doi:10.1016/j.advwatres.2009.08.009.
Reeves, P. C., and M. A. Celia (1996), A functional relationship betweencapillary pressure, saturation and interfacial area as revealed by apore‐scale network model, Water Resour. Res., 32(8), 2345–2358.
Schaap, M. G., M. L. Porter, B. S. Christensen, and D. Wildenschild(2007), Comparison of pressure‐saturation characteristics derived fromcomputed tomography images and lattice Boltzmann simulations, WaterResour. Res., 43, W12S06, doi:10.1029/2006WR005730.
Schroth, M. H., M. Oostrom, R. Dobson, and J. Zeyer (2008), Thermody-namic model for fluid‐fluid interfacial areas in porous media for arbitrarydrainage‐imbibition sequences, Vadose Zone J., 7(3), 966–971.
Wildenschild, D., J. W. Hopmans, C. Vaz, M. L. Rivers, D. Rikard, andB. S. Christensen (2002), Using X‐ray computed microtomographyin hydrology: Systems, resolution and limitations, J. Hydrol., 267,285–297.
Wildenschild, D., J. W. Hopmans, M. L. Rivers, and A. J. Kent (2005),Quantitative analysis of flow processes in a sand using synchrotron‐based X‐ray microtomography, Vadose Zone J., 4, 112–126.
J. I. Gerhard, Department of Civil and Environmental Engineering,University of Western Ontario, London, ON N6A 5B9, Canada.G. Grant, Geosyntec Consultants, 130 Research Ln., Ste. 2, Guelph, ON
N1G 5G3, Canada.M. L. Porter and D. Wildenschild, School of Chemical, Biological, and
Environmental Engineering, Oregon State University, 102 Gleeson Hall,Corvallis, OR 97331, USA. ([email protected])
PORTER ET AL.: CAPILLARY PRESSURE, SATURATION, AND IFA W08512W08512
10 of 10