
Emissions Prediction and Measurement for Liquid-Fueled TVC ...
21
A. Brankovic and R.C. Ryder, Jr. Flow Parametrics, LLC, Ivoryton, Connecticut R.C. Hendricks and N.-S. Liu Glenn Research Center, Cleveland, Ohio D.T. Shouse and W.M. Roquemore Wright-Patterson Air Force Base, Dayton, Ohio Emissions Prediction and Measurement for Liquid-Fueled TVC Combustor With and Without Water Injection NASA/TM—2005-213441 March 2005 AIAA–2005–0215
Transcript of Emissions Prediction and Measurement for Liquid-Fueled TVC ...

A. Brankovic and R.C. Ryder, Jr.Flow Parametrics, LLC, Ivoryton, Connecticut
R.C. Hendricks and N.-S. LiuGlenn Research Center, Cleveland, Ohio
D.T. Shouse and W.M. RoquemoreWright-Patterson Air Force Base, Dayton, Ohio
Emissions Prediction and Measurementfor Liquid-Fueled TVC Combustor Withand Without Water Injection
NASA/TM—2005-213441
March 2005
AIAA–2005–0215

The NASA STI Program Office . . . in Profile
Since its founding, NASA has been dedicated tothe advancement of aeronautics and spacescience. The NASA Scientific and TechnicalInformation (STI) Program Office plays a key partin helping NASA maintain this important role.
The NASA STI Program Office is operated byLangley Research Center, the Lead Center forNASA’s scientific and technical information. TheNASA STI Program Office provides access to theNASA STI Database, the largest collection ofaeronautical and space science STI in the world.The Program Office is also NASA’s institutionalmechanism for disseminating the results of itsresearch and development activities. These resultsare published by NASA in the NASA STI ReportSeries, which includes the following report types:
• TECHNICAL PUBLICATION. Reports ofcompleted research or a major significantphase of research that present the results ofNASA programs and include extensive dataor theoretical analysis. Includes compilationsof significant scientific and technical data andinformation deemed to be of continuingreference value. NASA’s counterpart of peer-reviewed formal professional papers buthas less stringent limitations on manuscriptlength and extent of graphic presentations.
• TECHNICAL MEMORANDUM. Scientificand technical findings that are preliminary orof specialized interest, e.g., quick releasereports, working papers, and bibliographiesthat contain minimal annotation. Does notcontain extensive analysis.
• CONTRACTOR REPORT. Scientific andtechnical findings by NASA-sponsoredcontractors and grantees.
• CONFERENCE PUBLICATION. Collectedpapers from scientific and technicalconferences, symposia, seminars, or othermeetings sponsored or cosponsored byNASA.
• SPECIAL PUBLICATION. Scientific,technical, or historical information fromNASA programs, projects, and missions,often concerned with subjects havingsubstantial public interest.
• TECHNICAL TRANSLATION. English-language translations of foreign scientificand technical material pertinent to NASA’smission.
Specialized services that complement the STIProgram Office’s diverse offerings includecreating custom thesauri, building customizeddatabases, organizing and publishing researchresults . . . even providing videos.
For more information about the NASA STIProgram Office, see the following:
• Access the NASA STI Program Home Pageat http://www.sti.nasa.gov
• E-mail your question via the Internet [email protected]
• Fax your question to the NASA AccessHelp Desk at 301–621–0134
• Telephone the NASA Access Help Desk at301–621–0390
• Write to: NASA Access Help Desk NASA Center for AeroSpace Information 7121 Standard Drive Hanover, MD 21076

A. Brankovic and R.C. Ryder, Jr.Flow Parametrics, LLC, Ivoryton, Connecticut
R.C. Hendricks and N.-S. LiuGlenn Research Center, Cleveland, Ohio
D.T. Shouse and W.M. RoquemoreWright-Patterson Air Force Base, Dayton, Ohio
Emissions Prediction and Measurementfor Liquid-Fueled TVC Combustor Withand Without Water Injection
NASA/TM—2005-213441
March 2005
National Aeronautics andSpace Administration
Glenn Research Center
Prepared for the43rd Aerospace Sciences Meeting and Exhibitsponsored by the American Institute of Aeronautics and AstronauticsReno, Nevada, January 10–13, 2005
AIAA–2005–0215

Acknowledgments
The authors wish to thank Dr. Anthony Strazisar, Dr. Marvin Goldstein, Dr. Dan Bulzan, and Dr. John Marek,NASA Glenn Research Center, for technical support, the NASA GRC Strategic Research Fund, and the
Revolutionary Aeropropulsion Concepts Project at NASA Glenn for support of this work. The authors express theirappreciation to the Air Force Research Laboratory, Dayton, Ohio, for permission to publish this research.
Available from
NASA Center for Aerospace Information7121 Standard DriveHanover, MD 21076
National Technical Information Service5285 Port Royal RoadSpringfield, VA 22100
Available electronically at http://gltrs.grc.nasa.gov

NASA/TM—2005-213441 1
Emissions Prediction and Measurement for Liquid-Fueled TVC Combustor With and Without Water Injection
A. Brankovic and R.C. Ryder, Jr.
Flow Parametrics, LLC Ivoryton, Connecticut 06442
R.C. Hendricks and N.-S. Liu
National Aeronautics and Space Administration Glenn Research Center Cleveland, Ohio 44135
D.T. Shouse and W.M. Roquemore
Air Force Research Laboratory Wright-Patterson Air Force Base
Dayton, Ohio 45433
Abstract An investigation is performed to evaluate the performance of a computational fluid dynamics (CFD) tool for the prediction of the reacting flow in a liquid-fueled combustor that uses water injection for control of pollutant emissions. The experiment consists of a multisector, liquid-fueled combustor rig operated at different inlet pressures and temperatures, and over a range of fuel/air and water/fuel ratios. Fuel can be injected directly into the main combustion airstream and into the cavities. Test rig performance is characterized by combustor exit quantities such as temperature and emissions measurements using rakes and overall pressure drop from upstream plenum to combustor exit. Visualization of the flame is performed using gray scale and color still photographs and high-frame-rate videos. CFD simulations are performed utilizing a methodology that includes computer-aided design (CAD) solid modeling of the geometry, parallel processing over networked computers, and graphical and quantitative post-processing. Physical models include liquid fuel droplet dynamics and evaporation, with combustion modeled using a hybrid finite-rate chemistry model developed for Jet-A fuel. CFD and experimental results are compared for cases with cavity-only fueling, while numerical studies of cavity and main fueling was also performed. Predicted and measured trends in combustor exit temperature, CO and NOx are in general agreement at the different water/fuel loading rates, although quantitative differences exist between the predictions and measurements.
Introduction Natural-gas-fired, water-injected industrial gas turbine combustors have been operational for many years (e.g., GE–LM2500), with more recent efforts focused on inlet fogging. Water injection into the combustion airstream provides enhanced efficiency with decreased emissions at lower costs. For example, dropping the compressor inlet air temperature 11 °C (20 °F) of a 100-MW facility, by fogging the inlet, produces nearly a 10-percent increase in power, an overall turbine efficiency increase of 3 percent with 30 percent less fuel, 20 percent less CO2 and 10 percent less total NOx (Peterson, 2003). Compare capital costs of $20/kW for inlet fogging that can be installed in 3 months to new plant costs of $750/kW that require 3 years to build (Peterson, 2003). Further, the GE–7EA turbine as normally steam injected and evaporatively cooled producing about 140 ppm NOx, with inlet fogging will experience an additional 18-percent reduction in NOx (Mee, 1999).

NASA/TM—2005-213441 2
These benefits may not be entirely realized in aircraft gas turbomachines (or liquid-fueled power generation turbines), yet the B–47 with six J47–GE–25A turbojets at 6000 lb of thrust (dry), or 7200 lb of thrust (using water injection for takeoff) provided a 20-percent increase in thrust necessary to get off the runway. Still today, B52–B, powered by eight PW J–57–19 turbojet engines, produce 12 000 lb of thrust with water injection, and the water-injected 747–200 is an old yet well proven system (Daggett, 2004). In a preliminary emissions study of the impact of water-injected systems on design, airplane performance, maintenance, and cost implications for takeoff and climb-out only, (Daggett, 2004) found water misting the low-pressure compressor may be preferable to either direct combustor injection or using the high-pressure compressor. If the water misting rate were increased from current industrial gas turbine rates of 0.83 percent water-to-air ratio to near 2.2 percent, NOx emissions could be reduced some 47 percent from nonwater misted engines without specific fuel consumption (SFC) penalties and estimated reductions up to 242 °C (436 R) in turbine inlet temperature, which could lead to increased hot section life. A 0.61-db noise reduction was also calculated. Daggett estimates a NOx emissions reduction cost/benefit ratio of about $1,663/ton. More in-depth studies are required to substantiate these benefits. In one such study, Eames (1988) determined that a water- and methanol-injected engine for a tiltrotor craft would yield a 35-percent power boost with a 6.5- to 7.3-percent improvement in Direct Operating Cost (DOC). The final design of the water- and methanol-injected engine had a smaller envelope and lighter weight with a 15-percent improvement in fuel burn for the 200 nautical mile mission over that of the baseline engine. Herein, we investigate combustor emissions for a trapped vortex combustor (TVC), as illustrated schematically in figure 1, and with diffuser and combustor hardware shown in figure 2. Liquid fuel is injected into the main combustion air through orifices in the individual tripass diffuser legs, and also into the upper and lower cavities. Water is injected directly into the upstream plenum, with sufficient residence time for complete evaporation. The plenum air and water flow feeds all combustion and cooling air injection ports and slots. Test rig instrumentation includes temperature and emissions probes along rakes at the combustor exit plane. Previous studies (Hendricks et al., 2001 and 2004) have characterized the TVC combustor flow fields, including detailed comparisons of predictions and measurements of aerodynamics and combustion performance. CFD code performance had been investigated and documented in a number of previous efforts (Ebrahimi et al., 2001; and Ryder and McDivitt, 2001) for different aerodynamic and reacting flow cases. In this effort, computed and measured results are compared for the case of cavity-only fueling. Specifically, comparisons are made of combustor exit temperature, CO and NOx emissions, at different water/fuel loading ratios.
Trapped Vortex Combustor Rig The trapped vortex combustor (TVC) sector rig at the Air Force Research Laboratory, Wright-Patterson Air Force Base is used for the experiments. A schematic of the test rig is shown in figure 1, which illustrates the air and water flow and fuel injection sites, and the general flow patterns expected in the combustor. A photograph of the combustor hardware is shown in figure 2, with the side wall removed. Components of the rig include the tripass diffuser, combustor bulkhead, heat shield, and combustor duct that exhausts to a vent. Combustor walls are cooled through effusion holes along the entire interior wall, and film cooling through slots along the combustor upper and lower walls. Engine compressor exit air is emulated by a plenum, and is connected to the TVC combustor through a tripass diffuser (figs. 1 and 2). This diffuser configuration splits the flow evenly, with the upper and lower diffuser flow paths providing high-speed shear layers that drive the cavity flows and entrain products of combustion into the main flow. The center diffuser flow path provides a high-speed jet that interacts with the outer diffuser flows and further mixes the products as the flow approaches the combustor exit. The result is a stable combustion process with high efficiency, within a compact configuration. The TVC combustor is fueled in two different ways. Liquid fuel is injected through simple orifice injectors into the main diffuser flow paths, with the high-speed cross flow atomizing the liquid fuel jet

NASA/TM—2005-213441 3
into a fine mist. Independently, liquid fuel is injected into the TVC cavities through simple orifice injectors. The cavity spray droplets are injected into a hot, reacting flow environment and evaporate rapidly. The effects of the spray droplet injection conditions on the combustor flow field and combustor exit pattern factor has been investigated (Hendricks et al., 2004). During that effort, the initial droplet size distributions were determined for the engine operating conditions used in this investigation. For the main injector, and for a nominal plenum pressure of 50 psi (344.6 kPa), the Rosin-Rammler droplet size distribution was R32,10 = 3 µm, R32,50 = 6 µm, and R32,90 = 12 µm. For the cavity injector, the Rosin-Rammler droplet size distribution was R32,10 = 5 µm, R32,50 = 8 µm, and R32,90 = 10 µm. Through a combination of cavity-only, cavity and main, and main-only fueling schemes, different operating conditions can be produced in the rig, allowing for investigation of a wide variety of flow phenomena in the experiment.
TVC Flow Visualization Studies The combustion flow in the TVC has been visualized in several ways, and examples are shown in figures 3, 4, and 5. Gray scale photos at different water loading ratios are shown in figure 3. With no water injection, the flame is highly luminous, with flame attached to the rear cavity wall. Entrainment of products into the main combustor stream is visible. At 50 percent water/fuel, the flame is less luminous, and the entrainment process is more difficult to observe directly. At 90 percent water/fuel, the flame appears faint, although combustion temperatures are only slightly lower. Time-averaged color photos for cavity-only fueling are shown in figure 4. On the left, combustion without water injection is shown, with a highly luminous flame filling the cavity, and entrainment into the combustor duct. A cool jet through the center is observed, due to the nonfueled combustor air entering through the central diffuser leg. On the right, flow with 90 percent water/fuel water injection is shown. The flame in this case is highly luminous, and appears better mixed than the nonwater-injected case. Still frames extracted from AVI video clips, taken at frame rates of 11 200 frames per second (fig. 5) show the variation in flame structure and luminosity over different conditions. In figure 5(a), a higher plenum pressure (100 psi or 689.3 kPa) is examined and displays a much higher luminosity than at lower pressures. Reduced fueling into the cavity (fig. 5(b)) results in a lower luminosity. Lower plenum pressure (50 psi, fig. 5(c)), and no water injection, still displays a high cavity luminosity, while 90 percent water/fuel water injection (fig. 5(d)) results in much lower luminosity. A detailed examination of the video clips show that at all pressures and water/fuel loading ratios, a dynamic combustion process, is taking place in the cavities. In particular, rotation of the primary vortex, precession of the vortices, and splitting of the primary vortex into two or more smaller vortices are observable.
Flow Modeling Numerical simulations of the experiments were performed in order to determine whether the major trends in combustor exit quantities (temperature and emissions) could be predicted at the different water injection levels. To investigate this, a computational model of the TVC combustor rig was developed, including full geometry, and representation of all airflows. The model included the main diffuser airflow, cavity driving hole flow, cavity wall effusion cooling, slot cooling, and combustor wall liner film cooling (Hendricks et al., 2004). The combustion air and cooling airflow rates were determined through rigorous A cd analysis of the test rig, and were matched precisely in the simulations. In a related work (Hendricks et al., 2004), combustion was modeled using the eddy dissipation concept (EDC) heat release model, which proved adequate for predicting combustor exit temperatures, system pressure drop, and major flow structures with good agreement. In order to predict emissions in this effort, a hybrid chemistry model developed at the NASA Glenn Research Center, Cleveland, Ohio, by

NASA/TM—2005-213441 4
Molnar and Marek (2003) was utilized. This hybrid model blends the mixing and ignition characteristics of the EDC model with the temporal accuracy of finite-rate chemistry. In developing the finite-rate chemistry formulation, hydrocarbon fuel kinetics equations for fuel and air combustion, including pressure dependency effects, were evaluated using stirred reactor codes. The computed results were used to develop kinetic reaction rates for a reduced three-step reaction mechanism:
OHCOOC FuelH 2212 23 +⎯⎯ →⎯+ τ (1)
2221 COOCO CO⎯⎯ →⎯+ τ (2)
NOON NO 222 ⎯⎯ →⎯+ τ (3) Chemical kinetic times for the fuel (τFuel), CO (τCO), and NOx (τNO) are available as correlations covering a broad range of pressures, temperatures, and equivalence ratios, and are derived from GLSENS (see appendix) analysis of the 23-step, 16-species mechanism developed for Jet-A by Kundu et al. (1999), and Penko et al. (2000). Blending of the finite-rate component of the model with the EDC model is based on the evaluation of rate-limiting time steps. Computationally, switching between the EDC and the finite-rate model is dependent on the longer time scale determined for turbulent mixing rate and chemical kinetic formation rate (Marek and Molnar, 2003). Spray droplet initial size, droplet heat up and evaporation rate, and total droplet lifetime are key design parameters for injectors. These details must be understood for good matching of injectors and combustors to produce the desired heat release characteristics. In this effort, an analysis of the behavior of single droplets was performed to confirm aspects of the spray droplet modeling in the full CFD simulation. Specifically, single droplet characteristics were studied using a computer program developed for injection into crossflows (Liew et al., 2004). Injection into the cavities and diffuser legs were studied individually, with key results shown in figure 6. For the cavity injector, (figure 6, left column), spray droplets at the selected Rosin-Rammler sizes (5, 8, and 10 µm) and the computed liquid velocities were investigated for cold flow and hot flow ambient conditions. Cold flow ambient conditions represent a maximum droplet lifetime due to evaporation, while hot flow ambient conditions represent a minimum expected droplet lifetime. Inspection of the results for total droplet trajectory distance before complete evaporation (middle graph) indicate that the droplet trajectory analysis and the full CFD simulation results are in excellent agreement for the spray stream, with the stream fully evaporated before striking the opposite cavity wall. In particular, the smaller droplets evaporate more rapidly, while the larger droplets reside slightly longer in the cavity before reaching the boiling temperature and fully evaporating. For the main injector, the airflow is at a higher cross stream velocity; however, the analysis procedure is the same. Inspection of the right column of figure 6 shows similar trends as for the cavity injector, although the total distance traveled is much higher due to the high cross stream velocity. While large droplets injected into cold flow exit the combustor before complete evaporation, the hot flow condition shows these droplets fully evaporating within the combustor duct. This corresponds to the situation where some large droplets are not fully evaporated within the duct, and this is in fact the situation observed in the CFD simulations.
Results Simulation cases were run to determine the overall trends in combustor exit plane temperatures and emissions for the case of main + cavity fueling. Following this, a set of cases was run corresponding to specific runs performed in the TVC rig at Wright-Patterson Air Force Base. For the numerical study, a
NASA/TM—2005-213441 5
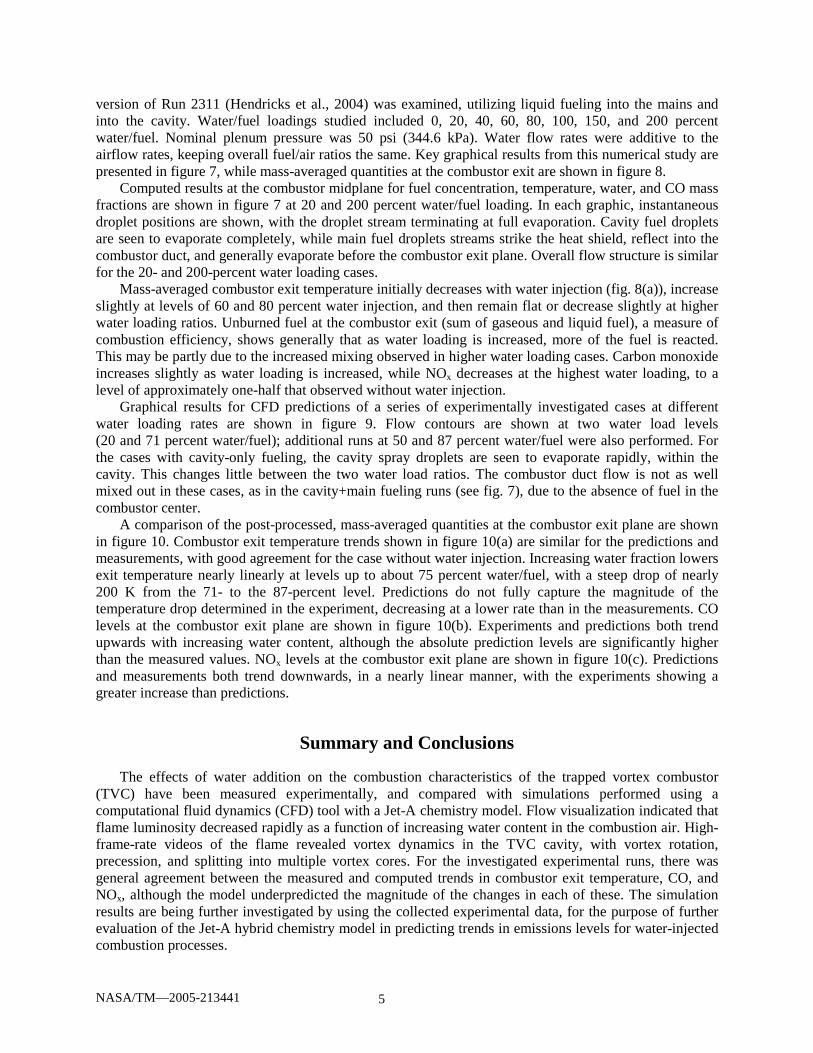
version of Run 2311 (Hendricks et al., 2004) was examined, utilizing liquid fueling into the mains and into the cavity. Water/fuel loadings studied included 0, 20, 40, 60, 80, 100, 150, and 200 percent water/fuel. Nominal plenum pressure was 50 psi (344.6 kPa). Water flow rates were additive to the airflow rates, keeping overall fuel/air ratios the same. Key graphical results from this numerical study are presented in figure 7, while mass-averaged quantities at the combustor exit are shown in figure 8. Computed results at the combustor midplane for fuel concentration, temperature, water, and CO mass fractions are shown in figure 7 at 20 and 200 percent water/fuel loading. In each graphic, instantaneous droplet positions are shown, with the droplet stream terminating at full evaporation. Cavity fuel droplets are seen to evaporate completely, while main fuel droplets streams strike the heat shield, reflect into the combustor duct, and generally evaporate before the combustor exit plane. Overall flow structure is similar for the 20- and 200-percent water loading cases. Mass-averaged combustor exit temperature initially decreases with water injection (fig. 8(a)), increase slightly at levels of 60 and 80 percent water injection, and then remain flat or decrease slightly at higher water loading ratios. Unburned fuel at the combustor exit (sum of gaseous and liquid fuel), a measure of combustion efficiency, shows generally that as water loading is increased, more of the fuel is reacted. This may be partly due to the increased mixing observed in higher water loading cases. Carbon monoxide increases slightly as water loading is increased, while NOx decreases at the highest water loading, to a level of approximately one-half that observed without water injection. Graphical results for CFD predictions of a series of experimentally investigated cases at different water loading rates are shown in figure 9. Flow contours are shown at two water load levels (20 and 71 percent water/fuel); additional runs at 50 and 87 percent water/fuel were also performed. For the cases with cavity-only fueling, the cavity spray droplets are seen to evaporate rapidly, within the cavity. This changes little between the two water load ratios. The combustor duct flow is not as well mixed out in these cases, as in the cavity+main fueling runs (see fig. 7), due to the absence of fuel in the combustor center. A comparison of the post-processed, mass-averaged quantities at the combustor exit plane are shown in figure 10. Combustor exit temperature trends shown in figure 10(a) are similar for the predictions and measurements, with good agreement for the case without water injection. Increasing water fraction lowers exit temperature nearly linearly at levels up to about 75 percent water/fuel, with a steep drop of nearly 200 K from the 71- to the 87-percent level. Predictions do not fully capture the magnitude of the temperature drop determined in the experiment, decreasing at a lower rate than in the measurements. CO levels at the combustor exit plane are shown in figure 10(b). Experiments and predictions both trend upwards with increasing water content, although the absolute prediction levels are significantly higher than the measured values. NOx levels at the combustor exit plane are shown in figure 10(c). Predictions and measurements both trend downwards, in a nearly linear manner, with the experiments showing a greater increase than predictions.
Summary and Conclusions The effects of water addition on the combustion characteristics of the trapped vortex combustor (TVC) have been measured experimentally, and compared with simulations performed using a computational fluid dynamics (CFD) tool with a Jet-A chemistry model. Flow visualization indicated that flame luminosity decreased rapidly as a function of increasing water content in the combustion air. High-frame-rate videos of the flame revealed vortex dynamics in the TVC cavity, with vortex rotation, precession, and splitting into multiple vortex cores. For the investigated experimental runs, there was general agreement between the measured and computed trends in combustor exit temperature, CO, and NOx, although the model underpredicted the magnitude of the changes in each of these. The simulation results are being further investigated by using the collected experimental data, for the purpose of further evaluation of the Jet-A hybrid chemistry model in predicting trends in emissions levels for water-injected combustion processes.

NASA/TM—2005-213441 6
References 1. Daggett, D.L. (2004) “Water Misting and Injection of Commercial Aircraft Engines to Reduce
Airport NOx,” NASA/CR—2004-212957 (C&EA-BQ130-Y04-002) March. 2. Eames, David J.H. (1988) “Short Haul Civil Tiltrotor Contingency Power System Preliminary
Design,” Final Report. NAS3–97029 (EDR 18694) December. 3. Peterson, R. (2003) Fog Power: More Efficient, Cleaner and Less Expensive Power. Mee Industries:
http://www.meefog.com/fogpoturbinewer.html. 4. Mee, T.R. III (1999) Reduction of Gas Turbine NOx Emissions by Inlet Air Fogging. Mee Industries:
http://www.meefog.com/turbine/gtnp.html http://www.meefog.com/turine/nox-emissions.pdf
5. Hendricks, R.C., Shouse, D.T., and Roquemore, W.M. (2004) “Water Injected Turbomachinery,” ISROMAC10–2004–039, Honolulu, Hawaii.
6. Hendricks, R.C., Shouse, D.T., Roquemore, W.M., Burrus, D.L., Duncan, B.S., Ryder, R.C., Brankovic, A., Gallagher, J.R., and Hendricks, J.A. (2001) “Experimental and Computational Study of Trapped Vortex Combustor Sector Rig With High-Speed Diffuser Flow,” Int. Journal of Rotating Machinery, 7(6), pp. 375–385.
7. Hendricks, R.C., Ryder, R.C., Brankovic, A., Shouse, D.T., Roquemore, W.M., and Liu, N.-S. (2004) “Computational Parametric Study of Fuel Distribution in an Experimental Trapped Vortex Combustor Sector Rig,” ASME–IGTI–GT2004–53225.
8. Ryder, R.C., and McDivitt, T. (2000) “Application of the National Combustion Code Towards Industrial Gas Fired Heaters,” AIAA 2000–0456.
9. Molnar, M., and Marek, C.J. (2003) “Reduced Equations for Calculating the Combustion Rates of Jet-A and Methane Fuel,” NASA/TM—2003-212702, NASA Glenn Research Center.
10. Penko, P.F., Kundu, K.P., Siow, Y.K., and Yang, S.L. (2000) “A Kinetic Mechanism for Calculation of Pollutant Species in Jet-A Combustion,” AIAA 2000–3035.
11. Kundu, K.P., Penko, P.F., and VanOverbeke, T.J. (1999) “A Practical Mechanism for Computing Combustion in Gas Turbine Engines,” AIAA 99–2218.
12. Liew, K.H., Urip, E., Yang, S.L. and Marek, C.J. (2004) “An Interactive Microsoft Excel Program for Tracking a Single Evaporating Droplet in Crossflow,” NASA/TM—2004-212910.

NASA/TM—2005-213441 7
Appendix
GLSEN S is a Generalized Extension of LSENS (Bittker (1966)). LSENS is the NASA Lewis general chemical kinetics and sensitivity analysis code that computes the progress of complex multistep molecular processes in a homogenous gas mixture for several reaction models. For a static, nonflowing chemical reaction, it also enables the user to perform a sensitivity analysis of the reacting system simultaneously with the chemical kinetics computation. The sensitivity analysis is important to the CFD user, as it gives the user the ability to rapidly determine the relatively few individual reactions that are rate controlling in a system where many simultaneous steps are occurring for the static or quasi-static process (Radhakrishnan, Bittker (1994) in three parts and McBride and Gordon (1994, 1996)). Bittker, D.A.; GLSEN S, A Generalized Extension of LSENS, Including Global Reactions and Added
Sensitivity Analysis for the Perfectly Stirred Reactor. NASA Reference Publication 1362, 1966. Bittker, D.A.; and Radhakrishnan, K.: LSENS- A General Chemical Kinetics and Sensitivity Analysis
Code for Homogeneous Gas-Phase Reactions, Part III: Illustrative Test Problems. NASA RP–1330, 1994.
Gordon, S.; and McBride, B.J.: Computer Program for Calculation of Complex Chemical Equilibrium Compositions and Applications, Part I–Analysis NASA RP–1311, 1994.
McBride, B.J.; and Gordon, S.: Computer Program for Calculation of Complex Chemical Equilibrium Compositions and Applications, Part II–Users Manual and Program Description NASA RP–1311, 1996.
Radhakrishnan, K.: LSENS- A General Chemical Kinetics and Sensitivity Analysis Code for Homogeneous Gas-Phase Reactions, Part I: Theory and Numerical Solutions Procedures. NASA RP–1328, 1994.
Radhakrishnan, K; and Bittker, D.A.: LSENS- A General Chemical Kinetics and Sensitivity Analysis Code for Homogeneous Gas-Phase Reactions, Part II: Code Description and Usage. NASA RP–1329, 1994.

Figure 2.—Test rig hardware, showing 10 fuel injector modules in the spanwise direction.
Cavity air and H2O+ fuel
Cavity air and H2O+ fuel
Added cavity air and H2O
Added cavity air and H2O
Main combustion air and H2O through tripassdiffuser
Dualtrapped vortex
Combustion
Products
To exhaustvent
Figure 1.—Schematic diagram of the trapped vortex combustor with water-injection strategy. Arrows indicating major flow components. Liquid fuel is injected into the TVC cavity and also directly into the main combustor air through orifices in the diffuser. Water mist mixed in with plenum air, feeding the cavity driving air and all cooling flows.
Dualtrappedvortex
NASA/TM—2005-213441 8

Figure 3.—Gray scale images of TVC, cavity fueling only, at different water-injection ratios.φCavity = 2.0 and φOverall = 0.46. Left: 0 percent H2O. Middle: 50 percent water/fuel. Right: 90 percent water/fuel. Plenum pressure = 50 psi (344.6 kPa).
Figure 5.—AVI-file video clips. (a) 100 psi (689.3 kPa), φCavity = 2.0, and 0 percent water/fuel. (b) 100 psi, φCavity = 0.8, and 0 percent water/fuel. (c) 50 psi (344.6 kPa), φCavity = 2.2, and 0 percent water/fule. (d) 50 psi, φCavity = 2.2, and 90 percent water/fuel.
Figure 4.—Time-averaged color images of the flow. φCavity = 2.2 and φOverall = 0.46. Left: 0 percent water/fuel. Right: 90 percent water/fuel. Both cases, plenum pressure = 50 psi(344.6 kPa).
(a) (b)
(c) (d)
NASA/TM—2005-213441 9
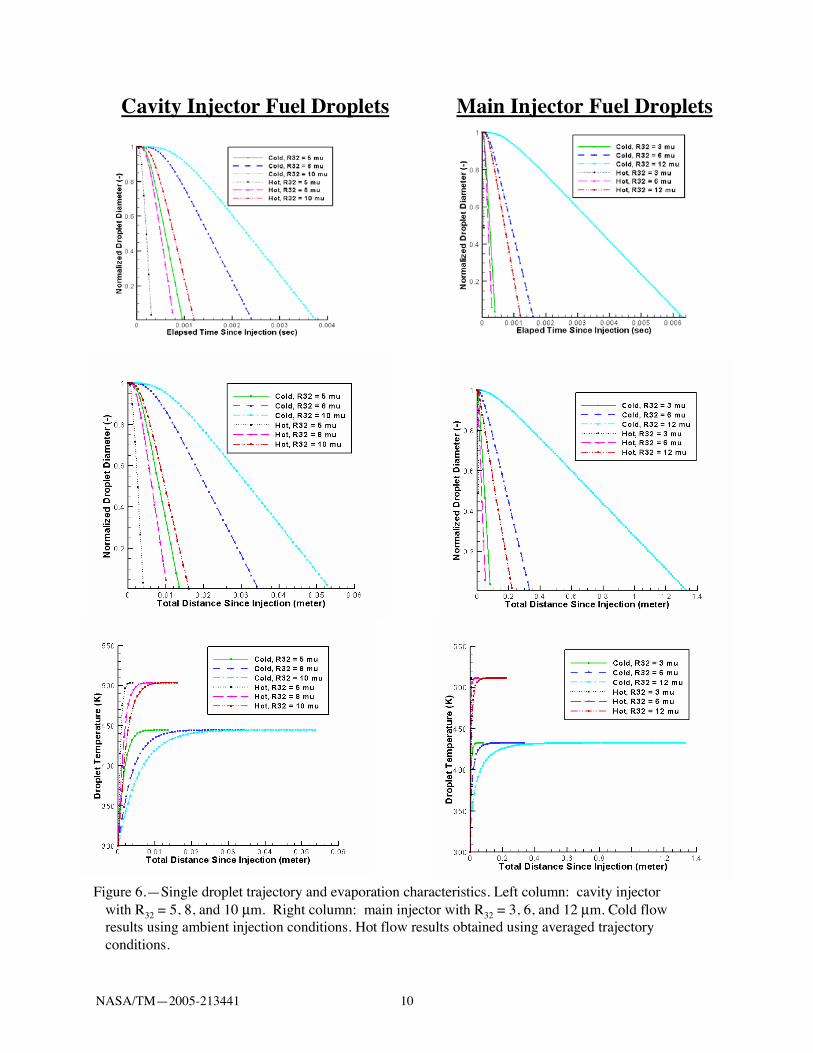
Figure 6.—Single droplet trajectory and evaporation characteristics. Left column: cavity injector with R32 = 5, 8, and 10 µm. Right column: main injector with R32 = 3, 6, and 12 µm. Cold flow results using ambient injection conditions. Hot flow results obtained using averaged trajectory conditions.
Main Injector Fuel DropletsCavity Injector Fuel Droplets
NASA/TM—2005-213441 10

Figure 7.—Cavity + main fueling. Midplane contours of combustion quantities, including evaporated fuel, static temperature, and water and carbon monoxide mass fractions. Spray droplets instantaneous positions shown. Left column: 20 percent water/fuel mass fraction. Right column: 200 percent water/fuel mass fraction.
Water and Fuel = 200%Water and Fuel = 20%
(a) Fuel
(b) Statictemperature
(c) Water
(d) CO
(a) Fuel
(b) Statictemperature
(c) Water
(d) CO
NASA/TM—2005-213441 11

Figure 8.—Mass-averaged quantities at combustor exit plane. Parametric study of water injection, ranging from 0 to 200 percent water/fuel mass fraction, with main and cavity injector fueling.
(a) Combustor exit temperature. (b) Unburned fuel (gaseous + liquid) atmass fraction at combustor exit plane.
(c) Carbon monoxide mass fraction. (d) Nitric oxide (NOx) mass fraction.
NASA/TM—2005-213441 12

Figure 9.—Cavity-only fueling. Midplane contours of combustion quantities including evaporated fuel, static temperature, and water and carbon monoxide mass fractions. Spray droplets instantaneous positions shown. Left column: 20-percent water/fuel mass fraction. Right column: 71-percent water/fuel mass fraction.
Water and Fuel = 71%Water and Fuel = 20%
(a) Fuel
(b) Statictemperature
(c) Water
(d) CO
(a) Fuel
(b) Statictemperature
(c) Water
(d) CO
NASA/TM—2005-213441 13

Figure 10.—Mass-averaged quantities at combustor exit plane. Parametric study of water injection, ranging from 0 to 100 percent water/fuel mass fraction, with cavity-only injector fueling.
(a) Combustor exit temperature.
(b) Carbon monoxide mass fraction at combustor exit plane.
(c) Nitric oxide (NOx) mass fraction at combustor exit plane.
NASA/TM—2005-213441 14
This publication is available from the NASA Center for AeroSpace Information, 301–621–0390.
REPORT DOCUMENTATION PAGE
2. REPORT DATE
19. SECURITY CLASSIFICATION OF ABSTRACT
18. SECURITY CLASSIFICATION OF THIS PAGE
Public reporting burden for this collection of information is estimated to average 1 hour per response, including the time for reviewing instructions, searching existing data sources,gathering and maintaining the data needed, and completing and reviewing the collection of information. Send comments regarding this burden estimate or any other aspect of thiscollection of information, including suggestions for reducing this burden, to Washington Headquarters Services, Directorate for Information Operations and Reports, 1215 JeffersonDavis Highway, Suite 1204, Arlington, VA 22202-4302, and to the Office of Management and Budget, Paperwork Reduction Project (0704-0188), Washington, DC 20503.
NSN 7540-01-280-5500 Standard Form 298 (Rev. 2-89)Prescribed by ANSI Std. Z39-18298-102
Form ApprovedOMB No. 0704-0188
12b. DISTRIBUTION CODE
8. PERFORMING ORGANIZATION REPORT NUMBER
5. FUNDING NUMBERS
3. REPORT TYPE AND DATES COVERED
4. TITLE AND SUBTITLE
6. AUTHOR(S)
7. PERFORMING ORGANIZATION NAME(S) AND ADDRESS(ES)
11. SUPPLEMENTARY NOTES
12a. DISTRIBUTION/AVAILABILITY STATEMENT
13. ABSTRACT (Maximum 200 words)
14. SUBJECT TERMS
17. SECURITY CLASSIFICATION OF REPORT
16. PRICE CODE
15. NUMBER OF PAGES
20. LIMITATION OF ABSTRACT
Unclassified Unclassified
Technical Memorandum
Unclassified
National Aeronautics and Space AdministrationJohn H. Glenn Research Center at Lewis FieldCleveland, Ohio 44135–3191
1. AGENCY USE ONLY (Leave blank)
10. SPONSORING/MONITORING AGENCY REPORT NUMBER
9. SPONSORING/MONITORING AGENCY NAME(S) AND ADDRESS(ES)
National Aeronautics and Space AdministrationWashington, DC 20546–0001
Available electronically at http://gltrs.grc.nasa.gov
March 2005
NASA TM—2005-213441AIAA–2005–0215
E–14977
Cost Center 2250000013
Emissions Prediction and Measurement for Liquid-Fueled TVC Combustor Withand Without Water Injection
A. Brankovic, R.C. Ryder, Jr., R.C. Hendricks, N.-S. Liu, D.T. Shouse,and W.M. Roquemore
Combustors; Water injection; Emissions; CFD; Liquid fuels
Unclassified -UnlimitedSubject Categories: 07, 25, 28, 37, and 45 Distribution: Nonstandard
Prepared for the 43rd Aerospace Sciences Meeting and Exhibit sponsored by the American Institute of Aeronauticsand Astronautics, Reno, Nevada, January 10–13, 2005. A. Brankovic and R.C. Ryder, Jr., Flow Parametrics, LLC,Ivoryton, Connecticut 06442; R.C. Hendricks and N.-S. Liu, NASA Glenn Research Center; and D.T. Shouse andW.M. Roquemore, Air Force Research Laboratory, Wright-Patterson Air Force Base, Dayton, Ohio 45433. Responsibleperson, R.C. Hendricks, organization code R, 216–977–7507.
An investigation is performed to evaluate the performance of a computational fluid dynamics (CFD) tool for the prediction
of the reacting flow in a liquid-fueled combustor that uses water injection for control of pollutant emissions. The experiment
consists of a multisector, liquid-fueled combustor rig operated at different inlet pressures and temperatures, and over a range
of fuel/air and water/fuel ratios. Fuel can be injected directly into the main combustion airstream and into the cavities. Test
rig performance is characterized by combustor exit quantities such as temperature and emissions measurements using rakes
and overall pressure drop from upstream plenum to combustor exit. Visualization of the flame is performed using gray scale
and color still photographs and high-frame-rate videos. CFD simulations are performed utilizing a methodology that
includes computer-aided design (CAD) solid modeling of the geometry, parallel processing over networked computers, and
graphical and quantitative post-processing. Physical models include liquid fuel droplet dynamics and evaporation, with
combustion modeled using a hybrid finite-rate chemistry model developed for Jet-A fuel. CFD and experimental results are
compared for cases with cavity-only fueling, while numerical studies of cavity and main fueling was also performed.
Predicted and measured trends in combustor exit temperature, CO and NOx are in general agreement at the different water/
fuel loading rates, although quantitative differences exist between the predictions and measurements.
20


