MBON Progress Report Year 3: 2016 2017 - nopp.org · AmeriGEOSS in the Americas c) Further develop...
45
NNX14AP62A – 2016-2017 (Y3) Progress Report: Sanctuaries MBON Demonstration Team 1 | Sanctuaries MBON MBON Progress Report Year 3: 2016 – 2017 Title: National Marine Sanctuaries as Sentinel Sites for a Demonstration Marine Biodiversity Observation Network (MBON) Cooperative Agreement Number: NASA NNX14AP62A Submitted by: Frank Muller-Karger 1 (Principal Investigator), F. Chavez 2 , S. Doney 3 , M. Kavanaugh 3 , E. Montes 1 , S. Gittings 4 (Co-Principal Investigators), and Partners: M. Breitbart 1 , A. Djurhuus 1 , A. Boehm 5 , Collin J. Closek 5 , D. Otis 1 , C. Reynolds 1 , M. Howard 6 , Marion Stössel 6 , J. Brown 7 , K. O'Keife 8 , Luke McEachron 8 , Katherine Hubbard 8 , Benjamin Best 9 , Chris Kelble 10 1 College of Marine Science, University of South Florida (USF), St Petersburg, FL; 2 Monterey Bay Aquarium Research Institute (MBARI/CenCOOS), Moss Landing, CA; 3 Woods Hole Oceanographic Institution (WHOI), Woods Hole, MA; 4 NOAA Office of National Marine Sanctuaries (ONMS), Washington, DC; 5 Center for Ocean Solutions, Stanford University, Pacific Grove, CA; 6 Texas A&M University (TAMU/GCOOS), College Station, TX; 7 NOAA Monterey Bay National Marine Sanctuary (MBNMS), Monterey, CA; 8 Florida Fish and Wildlife Research Institute (FWRI), St Petersburg, FL; 9 EcoQuants, Santa Barbara, CA; 10 NOAA Atlantic Oceanographic and Meteorological Laboratory (AOML), Miami, FL; Period Covered by Report: Year 03: August 18, 2016 – August 17, 2017 Recipient Institution: USF – College of Marine Science, 140 7th Ave. South, St. Petersburg, FL 33701
Transcript of MBON Progress Report Year 3: 2016 2017 - nopp.org · AmeriGEOSS in the Americas c) Further develop...

NNX14AP62A – 2016-2017 (Y3) Progress Report: Sanctuaries MBON Demonstration Team
1 | S a n c t u a r i e s M B O N
MBON Progress Report Year 3: 2016 – 2017
Title: National Marine Sanctuaries as Sentinel Sites for a Demonstration Marine Biodiversity
Observation Network (MBON)
Cooperative Agreement Number: NASA NNX14AP62A
Submitted by: Frank Muller-Karger1
(Principal Investigator), F. Chavez2, S. Doney
3, M.
Kavanaugh3, E. Montes
1, S. Gittings
4 (Co-Principal Investigators), and Partners: M.
Breitbart1, A. Djurhuus
1, A. Boehm
5, Collin J. Closek
5, D. Otis
1, C. Reynolds
1, M.
Howard6, Marion Stössel
6, J. Brown
7, K. O'Keife
8, Luke McEachron
8, Katherine
Hubbard8, Benjamin Best
9, Chris Kelble
10
1 College of Marine Science, University of South Florida (USF), St Petersburg, FL;
2 Monterey Bay Aquarium Research Institute (MBARI/CenCOOS), Moss Landing, CA;
3 Woods Hole Oceanographic Institution (WHOI), Woods Hole, MA;
4 NOAA Office of National Marine Sanctuaries (ONMS), Washington, DC;
5 Center for Ocean Solutions, Stanford University, Pacific Grove, CA;
6 Texas A&M University (TAMU/GCOOS), College Station, TX;
7 NOAA Monterey Bay National Marine Sanctuary (MBNMS), Monterey, CA;
8 Florida Fish and Wildlife Research Institute (FWRI), St Petersburg, FL;
9 EcoQuants, Santa Barbara, CA;
10 NOAA Atlantic Oceanographic and Meteorological Laboratory (AOML), Miami, FL;
Period Covered by Report: Year 03: August 18, 2016 – August 17, 2017
Recipient Institution: USF – College of Marine Science, 140 7th Ave. South, St.
Petersburg, FL 33701

NNX14AP62A – 2016-2017 (Y3) Progress Report: Sanctuaries MBON Demonstration Team
2 | S a n c t u a r i e s M B O N
SECTION 1: PROGRAM GOALS AND SUMMARY
Research Objectives:
Under this Cooperative Agreement, the project elements are administrated by the University of
South Florida. The Cooperative Agreement includes the following agreed objectives:
1. Implement a demonstration Marine Biodiversity Observation Network (MBON) to monitor
changes in marine biodiversity within the Florida Keys National Marine Sanctuary and the
Monterey Bay National Marine Sanctuary.
2. Integrate, synthesize, and augment information from ongoing monitoring programs to:
a. Provide geographically-integrated time-series metrics of biodiversity and ecosystem
health;
b. Define a minimum set of observations required for implementing a practical MBON;
c. Develop environmental DNA technology and autonomous sample collection methods for
conducting biodiversity assessments; and
d. Bring biodiversity measurements together in a relational database with links to national
and international databases.
3. Establish a protocol for rapid use of MBON information by stakeholders in the National
Marine Sanctuary System and elsewhere.
4. Build understanding of the connections between marine biodiversity and the social-economic
context of a region.
5. Develop a plan to transition the MBON into an operational system through partnerships with
the U.S. Government and other partners.
6. Integrate this MBON activity into the international Group on Earth Observations
Biodiversity Observation Network (GEO BON) and the Global Ocean Observing System
(GOOS - UNESCO).
Summary of Progress
Efforts during the third year of this Cooperative Agreement focused on continuing the
development of a demonstration Marine Biodiversity Observation Network (MBON) to address
these objectives. The demonstration is building capacity to monitor changes in marine
biodiversity within three US National Marine Sanctuaries (NMS): Florida Keys and Flower
Garden Banks in the Gulf of Mexico, and Monterey Bay on the U.S. west coast. The project is
also deeply engaged in international activities including:
- GEO BON, by promoting a global MBON;
- AmeriGEOSS to organize a regional network in the Americas under the name Pole to
Pole MBON in the Americas;
- GEO Blue Planet: MBON is considered the marine biodiversity arm of Blue Planet;
- Various United Nations efforts including:
o In December, 2016, MBON signed a collaboration agreement with the Global
Ocean Observing System (GOOS) and the Ocean Biogeographic Information
System (OBIS). The goal of signing the agreement is to:
NNX14AP62A – 2016-2017 (Y3) Progress Report: Sanctuaries MBON Demonstration Team
3 | S a n c t u a r i e s M B O N
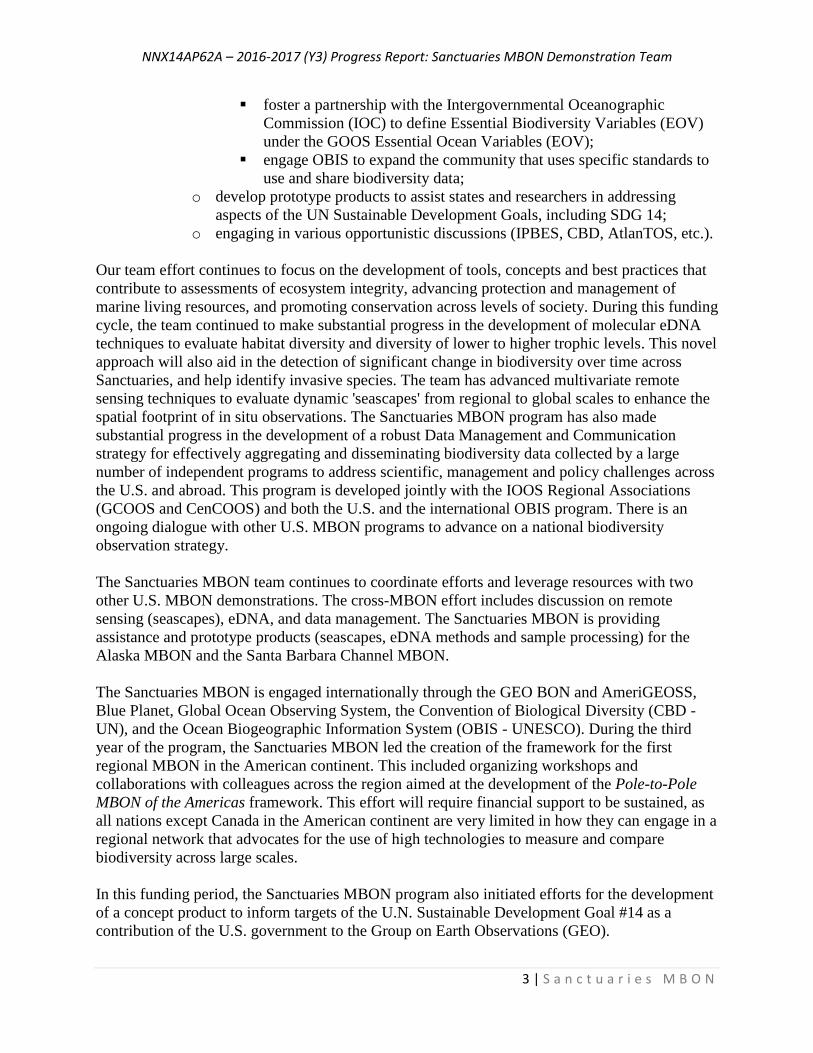
foster a partnership with the Intergovernmental Oceanographic
Commission (IOC) to define Essential Biodiversity Variables (EOV)
under the GOOS Essential Ocean Variables (EOV);
engage OBIS to expand the community that uses specific standards to
use and share biodiversity data;
o develop prototype products to assist states and researchers in addressing
aspects of the UN Sustainable Development Goals, including SDG 14;
o engaging in various opportunistic discussions (IPBES, CBD, AtlanTOS, etc.).
Our team effort continues to focus on the development of tools, concepts and best practices that
contribute to assessments of ecosystem integrity, advancing protection and management of
marine living resources, and promoting conservation across levels of society. During this funding
cycle, the team continued to make substantial progress in the development of molecular eDNA
techniques to evaluate habitat diversity and diversity of lower to higher trophic levels. This novel
approach will also aid in the detection of significant change in biodiversity over time across
Sanctuaries, and help identify invasive species. The team has advanced multivariate remote
sensing techniques to evaluate dynamic 'seascapes' from regional to global scales to enhance the
spatial footprint of in situ observations. The Sanctuaries MBON program has also made
substantial progress in the development of a robust Data Management and Communication
strategy for effectively aggregating and disseminating biodiversity data collected by a large
number of independent programs to address scientific, management and policy challenges across
the U.S. and abroad. This program is developed jointly with the IOOS Regional Associations
(GCOOS and CenCOOS) and both the U.S. and the international OBIS program. There is an
ongoing dialogue with other U.S. MBON programs to advance on a national biodiversity
observation strategy.
The Sanctuaries MBON team continues to coordinate efforts and leverage resources with two
other U.S. MBON demonstrations. The cross-MBON effort includes discussion on remote
sensing (seascapes), eDNA, and data management. The Sanctuaries MBON is providing
assistance and prototype products (seascapes, eDNA methods and sample processing) for the
Alaska MBON and the Santa Barbara Channel MBON.
The Sanctuaries MBON is engaged internationally through the GEO BON and AmeriGEOSS,
Blue Planet, Global Ocean Observing System, the Convention of Biological Diversity (CBD -
UN), and the Ocean Biogeographic Information System (OBIS - UNESCO). During the third
year of the program, the Sanctuaries MBON led the creation of the framework for the first
regional MBON in the American continent. This included organizing workshops and
collaborations with colleagues across the region aimed at the development of the Pole-to-Pole
MBON of the Americas framework. This effort will require financial support to be sustained, as
all nations except Canada in the American continent are very limited in how they can engage in a
regional network that advocates for the use of high technologies to measure and compare
biodiversity across large scales.
In this funding period, the Sanctuaries MBON program also initiated efforts for the development
of a concept product to inform targets of the U.N. Sustainable Development Goal #14 as a
contribution of the U.S. government to the Group on Earth Observations (GEO).

NNX14AP62A – 2016-2017 (Y3) Progress Report: Sanctuaries MBON Demonstration Team
4 | S a n c t u a r i e s M B O N
The program includes graduate education and public outreach efforts in coordination with the
Sanctuary programs, IOOS, and various other regional NOAA outreach and extension programs.
Transition of the MBON to operations is currently under discussion in partnership with NASA,
NOAA and the IOOS program. A positive outcome is a commitment by NOAA NESDIS to
engage in discussions to host both U.S. regional seascape products at high spatial resolution (1
km) and global products at reduced resolution (possibly 4 or 9 km). This dialogue started in June
2017. MBON is also holding active discussions with the new NASA COVERAGE team at the
Jet Propulsion Lab, after their COVERAGE concept was approved by CEOS in May 2017.
Expected products and Outcomes in Program Years 4-5:
1. Further development of conceptual models of ecosystem structure within each Sanctuary
including key indicator groups.
2. A centralized data management plan that provides:
a) integrated existing biodiversity information spatially and over time from each Sanctuary
b) an implementation strategy for IOOS and Sanctuary programs.
3. A fully operational ‘seascape’ framework to integrate merged satellite and in situ
observations in partnership with IOOS Data Management and Communication (DMAC)
systems.
4. Coordination of sample collection, methods, and data integration into DMAC. This includes:
a) the design of an alert system triggered by changes in diversity indices that is readily
accessible to the Sanctuary’s Research Coordinators, researchers at scientific institutions
and regulatory agencies, and the public in general.
b) the implementation of the framework into IOOS DMAC.
c) a list of minimum observations required for an MBON for each Sanctuary.
5. Development, validation and deployment of eDNA technologies for continuously assessing
biodiversity in the Sanctuaries. Identify and train appropriate personnel in the use of these
technologies.
6. Implementation of a protocol for dynamic, digital input to the Sanctuary Condition Reports:
a) Include the publication of continuously updated indices of status and trends in key
Sanctuary state variables.
b) Design and implement an interactive online biodiversity geospatial information system in
collaboration with OBIS; this will be the regional/local scale version of the product being
designed to address aspects of UN SDG 14 (i.e. SDG 14.2 and SDG 14.a). The reasoning
is that any resource manager that requires marine biodiversity information in any place
around the world will have similar problems to address as those of the U.S. National
Marine Sanctuaries. These problems are captured in the series of questions that guide
development of the Sanctuary Condition Reports.
7. Evaluation of socio-economic value and policy options
a) Annual information needs assessments in Monterey, FL Keys, Flower Garden Banks
using smaller workshops and stakeholder surveys
8. Further develop the international dimensions of the MBON
a) Consolidate plans for the GEO MBON concept, including refining the MBON
implementation plan.

NNX14AP62A – 2016-2017 (Y3) Progress Report: Sanctuaries MBON Demonstration Team
5 | S a n c t u a r i e s M B O N
b) Advance planning on a Pole to Pole MBON pilot, specifically working with
AmeriGEOSS in the Americas
c) Further develop the pilot interactive information tool to support targets of the U.N.
Sustainable Development Goal 14.
d) Contribute to the convergence on GOOS Essential Ocean Biological and GEO BON
Biodiversity Variables.
e) Participate in the development of marine elements to BON in a Box.
f) Participate in the BON Development Working Group and other GEO BON Working
Groups.
g) Participate in GEO Blue Planet and other GEO initiatives and promote linkages between
them.

NNX14AP62A – 2016-2017 (Y3) Progress Report: Sanctuaries MBON Demonstration Team
6 | S a n c t u a r i e s M B O N
SECTION 2: PROGRESS AND ACCOMPLISHMENTS
This report presents brief descriptions of accomplishments during Year 3 of the project
according to the following table of content:
1. Gulf of Mexico Coastal Ocean Observing System (GCOOS) and Florida Fish and
Wildlife Conservation Commission (FWC) Efforts
GCOOS Data Management and Communications (DMAC) Team Activities:
Addition of Environmental Datasets to Florida Portal
FWC DMAC Activities
FWC Ecosystem Model Development
FWC Harmful Algal Bloom (HAB) Activities
2. DMAC Efforts in the Monterey Bay National Marine Sanctuary
Development of Conceptual Ecosystem Models and Interactive Data Visualization
Tools for Condition Report Assessments and the California Current Integrated
Ecosystem Assessment
Tracking Document for Monterey Bay MBON Education and Outreach
Outreach to and Collaboration with the California Current Integrated Ecosystem
Assessment (CCIEA)
3. MBON field campaigns
Expeditions to the Florida Keys National Marine Sanctuary and surrounding
waters
Seascape Validation Experiment in South Florida Waters
Environmental DNA and Microbial Assessments in the FKNMS
Standardized Methods for eDNA Collection, Extraction, and Analysis
Microbes to Whales: Cross-Trophic Level Analysis
Environmental DNA (eDNA) Sequencing Provides a Window Into Biological
Diversity in the Florida Keys National Marine Sanctuary
Comparing Diversity Estimates of Florida Keys Zooplankton Using Traditional
Microscopic Versus Environmental DNA Methods
Seascape-Informed Analyses of Microbial and Viral Diversity in Southwest
Florida and the Florida Keys National Marine Sanctuary
Analysis of historical and current satellite and oceanographic cruise data of the
northern Gulf of Mexico to evaluate the causes of a mortality event that affected
the Flower Gardens Bank National Marine Sanctuary in June and July, 2016
Expedition to the Flower Gardens Bank National Marine Sanctuary during a coral
spawning event in 2016 and plans for a similar visit in 2017
Sample Collections in the Monterey Bay National Marine Sanctuary
Environmental DNA Method Optimization Efforts at the Center for Ocean
Solutions
Anchovies to Whales
Microbes to Whales (m2w)
qPCR Assays for Detecting Organisms
Results from the 2015 CANON Cruise
Summary of planned activities in the MBNMS for next year

NNX14AP62A – 2016-2017 (Y3) Progress Report: Sanctuaries MBON Demonstration Team
7 | S a n c t u a r i e s M B O N
4. Seascapes and High-Resolution Satellite Remote Sensing Products
Sanctuaries MBON
X-MBON
The Arctic MBON (AmBON)
Santa Barbara Channel Long Term Environmental Research
U.N. Sustainable Development Goal 14 Biodiversity Product
Global synoptic seascapes
Horizontal Co-Location With Annual And Seasonal Ecological Marine Units
(EMU’s)
Water Column Variability Underlying Global Seascapes
Current and Future Multidisciplinary Remote Sensing Work : Sustainable Marine
Biogeographic Framework for Conservation and Management: IOOS, ESRI and
COVERAGE
MBON and SDG-14 Satellite Products
5. GEO BON MBON and Other International Efforts
6. Highlights from PR And E&O
7. Budget Expenditures
8. Peer-Reviewed Publications and Other Products
9. References
1. Gulf of Mexico Coastal Ocean Observing System (GCOOS) and Florida Fish and
Wildlife Conservation Commission (FWC) Efforts
GCOOS Data Management and Communications (DMAC) Team Activities: Addition of
Environmental Datasets to Florida Portal
The GCOOS DMAC teams have been assembling and reformatting environmental datasets for
the Florida Keys MBON program. These datasets were produced by various organizations
including NOAA’s Southeast Fisheries Science Center, Florida’s Fish and Wildlife Research
Institute, the University of Miami, the Florida Department of Environmental Protection, and
many others.
The GCOOS team has been transforming these datasets into NetCDF files along with
comprehensive standardized metadata conforming to standards endorsed by the National Centers
of Environmental Information (NCEI) NetCDF Feature Templates and OBIS-USA (U.S.
Geological Survey). These transformations enable data to be served via the GCOOS ERDDAP
server which provides data access for both people and automated computer programs. Datasets
transformed by the GCOOS team include fish observations from the Florida Keys Reef Visual
Census (RVC; 1994-2014), the Dry Tortugas Reef Visual Census (DT-RVC; 1999-2014), the
Comparative Assessment of Gulf Estuarine ecoSystems (CAGES; 1998-2005) and the Florida
Keys Coral Reef Monitoring Project (CREMP; 1996-2013), as well as water quality data (e.g.
dissolved oxygen, nutrients, chlorophyll-a, salinity) for the Florida Keys from 1970 through
2013 extracted from the GCOOS Hypoxia-Nutrient Data Portal (Figure 1).

NNX14AP62A – 2016-2017 (Y3) Progress Report: Sanctuaries MBON Demonstration Team
8 | S a n c t u a r i e s M B O N
Over the next few months, environmental data from 31 field surveys (2006-2016) conducted by
the University of Miami’s R/V Walton Smith as part of the South Florida program (SFP), and
historical and near real-time oceanographic and marine meteorological data from NOAA’s
National Data Buoy Center, water level data from NOAA’s National Ocean Survey, and salinity
and temperature data from the Everglades National Park will be added to the ERDDAP server
(Figure 2).
Fish data from the Fisheries Independent Monitoring (FIM) program led by the Florida Fish and
Wildlife Commission have been transformed by the SE Coastal Ocean Observing Regional
Association (SECOORA) and will soon be available through the ERDDAP server. The
Southeast Area Monitoring and Assessment Program (SEAMAP) fishery-independent datasets
are being assessed for assimilation into the MBON program.
Figure 1. Locations of dissolved oxygen data from the GCOOS Hypoxia-Nutrient Data Portal.
Figure 2. Station locations for NOAA’s National Data Buoy Center and National Ocean Service,
and Everglades National Park stations.
Florida FWRI DMAC Activities
This year, the Florida Fish and Wildlife Research Institute (FWRI) DMAC group worked to
acquire all relevant data to aid in the study of biodiversity in the Florida Keys. We have collected
fishing data from NOAA’s Recreational Fisheries Statistics Survey (MRFSS) for use in the
EcoSpace model as well as some FWC datasets that have never been disseminated for GIS use;

NNX14AP62A – 2016-2017 (Y3) Progress Report: Sanctuaries MBON Demonstration Team
9 | S a n c t u a r i e s M B O N
such as the Queen Conch Survey Sites. In all, the Fish and Wildlife Research Institute is now
hosting 40 datasets and their associated tables. These are all available through FWC’s Open
Data Platform by easily found by using the search term “MBON”. This platform allows users to
easily search, visualize, filter, download and even create charts based on attributes (Bar, Donut,
Line and Scatter Plot).
Currently available datasets for MBON are (added to or reformatted since last year’s update are
shown with an asterisk):
REEF.org Fish Sightings and Abundance 1993-2000
REEF.org Fish Sightings and Abundance 2001-2008
REEF.org Fish Sightings and Abundance 2009-2015
Multi Agency RVC Biomass 1994-2003*
Multi Agency RVC Biomass 2004-2009*
Multi Agency RVC Biomass 2010-2012*
Multi Agency RVC Abundance 1994 -2003*
Multi Agency RVC Abundance 2004-2009*
Multi Agency RVC Abundance 2010-2012*
Florida Shorebird Nesting Database 2011-2013*
Beach Nesting Birds 2005-2010*
Wildlife Observation Locations Florida*
SECOORA In Situ Weather Observations
Lobster Abundance Transects
Timed Searched Lobster Abundance
Postlarval Collectors
Queen Conch Survey Sites
Walton Smith Stations
Middle Keys Nearshore Hardbottom Survey
FIM Inshore SFL Subset
FIM Offshore Tortugas
FIM Middle Keys Seine Surveys Sample Locations
FKNMS Observed Fish Aggregations
Recent HAB Events (2014-2016)
Terrapin Observation Locations in Florida
Manatee Synoptic Survey
Acropora Presence/Absence Locations in Caribbean
Rare and Imperiled Fish
Artificial Reefs Florida
Patch Reefs SE FL
Coral Reef Evaluation and Monitoring Projects in FL (CREMP, SECREMP,
DRTO CREMP)
National Benthic Inventory (NBI)
Water Quality STORET EPA FL
Proposed Sites
Unified Florida Reef Tract Benthic Habitat

NNX14AP62A – 2016-2017 (Y3) Progress Report: Sanctuaries MBON Demonstration Team
10 | S a n c t u a r i e s M B O N
Seagrass Florida
Saltwater Marsh Florida
Tidal Flats Florida
Coral Hardbottom
Florida Keys National Marine Sanctuary Boundary*
Tables:
MiddleKeys_SeineSurveys_Samples
NearshoreHardbottom_Algae
NearshoreHardbottom_Fish
NearshoreHardbottom_Lobster
NearshoreHardbottom_MotileInverts
NearshoreHardbottom_Surveys_master
NearshoreHardbottom_SessileInverts
The team continues to enhance the MBON-FKNMS JavaScript-based data viewer, our main GIS
data visualization tool for the Florida Keys, and expand its use among various stakeholders. The
map data viewer remains our preferred application for visualizing all MBON datasets and is now
at version 2.2 of the ESRI Web App Builder. The data viewer includes custom filters for
selecting species within the Reef Visual Census (RVC) data (Figure 3) so stakeholders can look
at changes in abundance for a single species. It also includes a new selection tool (Figure 4) for
acquiring statistics about any of the datasets and creating a new data layer based on the selection.
Figure 3: JavaScript Viewer RVC Species Data Filters

NNX14AP62A – 2016-2017 (Y3) Progress Report: Sanctuaries MBON Demonstration Team
11 | S a n c t u a r i e s M B O N
Figure 4: JavaScript Viewer Data Selection Tool with statistical functionality.
FWRI has ensured that all partners have access to relevant data layers and that they are in the
correct format to function across all data portals. We have created a new webpage to allow easy
access to information and updates on our continuing data management work and successful
partnerships with other groups within the MBON team http://myfwc.com/research/gis/regional-
projects/mbon/. We continue to develop new ways for researchers to access and work with our
data as well as collecting new data that is being released from the eDNA team and updates to the
current data sources.
FWRI Ecosystem Model Development
Coral reefs are one of the most speciose ecosystems in the world and are an extremely important
economic resource for local communities, with high levels of productivity, yet generally occur in
nutrient poor and plankton-poor oceanic waters (Lewis 1981). Coral reefs survive in seemingly
unfavorable conditions due to a combination of complex species interactions, efficient nutrient
recycling, and conservation (Opitz 1996). Understanding species interactions is increasingly
important in complex reef environments, where a variety of mechanisms for species co-
occurrence and distribution can occur.
As a complex interactive system, monitoring coral reefs from an ecosystem-based management
perspective presents a significant challenge to natural resource managers. Monitoring single
species within a coral reef generally does not account for larger scale regulatory dynamics such
as anthropogenic pressure, competition, predation, habitat degradation, and natural perturbations
(Heymans et al. 2014). On the other hand, deriving cogent information from all species
simultaneously is often untenable. Increasingly, ecosystem models are used to fill the gap
between overly simple and unwieldy ecosystem indicators to synthesize complex interactions
into fundamental structural and functional components as a monitoring tool (Heymans et al.
2016).
The purpose of this study is to provide an ecosystem level monitoring tool for the Florida Reef
Tract. The most common ecosystem modeling framework for the marine environment is the

NNX14AP62A – 2016-2017 (Y3) Progress Report: Sanctuaries MBON Demonstration Team
12 | S a n c t u a r i e s M B O N
Ecopath with Ecosim (EwE) suite (Colleter et al. 2014). The EwE model suite consists of a series
of mass balance and delay difference equations to construct a food web that can be used to model
ecosystem dynamics over time; the model assumes that the energy input and output of all living
things must balance (Christensen and Walters 2004, Chagaris 2013). Initially established by
Polovina (1984) to estimate biomass and energy flow between ecosystem components, EwE
continues to develop and incorporate more complex dynamics.
Trophic groups in EwE are represented by aggregations of species or individual species of
interest, which are initially governed by two master equations. First, the production of each
functional group is defined as the sum of predation mortality, catch, net migration, biomass
accumulation, and other mortality. Second, energy balance within each group is achieved by
assuming that consumption is equal to the sum of production, respiration, and unassimilated
energy. In addition to biomass, production, and consumption, the mass balance model requires
the ecotrophic efficiency (EE) of each group, which represents the proportion of biomass from
each group that is used in the system; EE is commonly estimated from the other three parameters
(i.e., biomass, production, and consumption) (Christensen et al. 2008).
The data required to initialize EwE are often available from stock assessments, ecological
studies, or the primary literature: biomass, mortality estimates, consumption estimates, diet
compositions, and catch data. We derived biomass data for reef fish in the Florida Reef Tract
from the South Florida Reef Fish Visual Census (RVC) multi-agency program. Biomass data
were aggregated by trophic group, per year from 1994 to 2012, and averaged over a 2,151 km2
area representing the sampling domain of the Florida Reef Tract from the Marquesas to Miami.
Biomass for most non-fish trophic groups was estimated using EE values from existing regional
food web models or estimates from existing literature (Thornhill et al. 2011, Hill et al. 2014).
The primary managers of the RVC database, the National Oceanographic and Atmospheric
Administration (NOAA) National Marine Fisheries Services (NMFS), assisted with assigning
224 fish species to 19 fish trophic groups based on diet, mobility, behaviour, and taxonomy using
established literature (Randall 1967), regional fish identification guides, expert opinion, and
FishBase (Froese and Pauly 2006). Diet, mobility, behavior, and taxonomy were chosen to
represent ecological roles representative of several species in aggregate to achieve broad
inference in terms of ecological function (e.g., Purkis et al. 2008). Production, consumption,
mortality rates, and diet composition were derived from other Gulf of Mexico and Caribbean
food web models (Opitz 1996, Venier and Pauly 1997, Walters et al. 2008, Chagaris 2013).
Fishing fleets were separated by recreational and commercial catch, with sourcing from the
NOAA marine recreational informational program and the Florida Fish and Wildlife
Conservation Commission (FWC) dependent monitoring trip ticket program for Monroe County.
Results:
The Florida Reef Tract is an efficient system that is a net producer, at least on an annual basis,
with a production to respiration ratio of 1.02 (Table 1). The total system throughput in 1994, or
the amount of energy and carbon flowing through the food web, was estimated at 8,004
tons/km2/year; of which consumption by organisms accounted for 51%. The system omnivory
index (Christensen et al. 2008), a measure of the number of trophic levels consumers use in the

NNX14AP62A – 2016-2017 (Y3) Progress Report: Sanctuaries MBON Demonstration Team
13 | S a n c t u a r i e s M B O N
system, is slightly lower than similar reefs at 0.19, but within a normal range (e.g., 0.23 for the
virgin islands, Opitz 1996).
Table 1. Initial fit of the 1994 Ecopath model for the Florida Reef Tract. After mass-balance is
achieved within an initial year, the model is fit to a time-series of biomass values to express
changes in the system over time.
FWRI Harmful Algal Bloom (HAB) Activities
Since the project’s inception, the FWRI HAB group (Hubbard, Olesin) has prepared sampling
kits for all Walton Smith cruises, and have >250 Lugol’s preserved samples. In 2016-2017, 87
samples were examined and all HAB taxa were enumerated. Of those 87 samples, 13 were
analyzed to determine the full community composition in a 3 mL subsample. To date, 97
different “taxa” have been identified, representing different levels of taxonomic resolution from
species to family, depending on features that can be discriminated readily. A few non-specific
classifications such as “detritus” were also recorded for those samples.
In addition, a taxa list for Monroe County was generated from the FWRI Harmful Algal Bloom
Monitoring Database, using historical as well as contemporary observations, and annotated with
differing levels of taxonomic classification to help with the analysis and interpretation of 18S
sequences from phytoplankton in relevant eDNA datasets (see below). Current and future efforts
are further focused on integrating phytoplankton taxonomic composition data (eDNA and/or
traditional methods) with seascape analyses, pigment composition, and absorption spectra.

NNX14AP62A – 2016-2017 (Y3) Progress Report: Sanctuaries MBON Demonstration Team
14 | S a n c t u a r i e s M B O N
The FWRI HAB group also participated in numerous project meetings with the CA and FL
eDNA groups. Lab space at FWRI was prepared specifically for the FL MBON eDNA
extractions, and relevant extractions were staged and jointly executed by USF/FWRI (this is
described further in the section Standardized Methods for eDNA Collection, Extraction, and
Analysis of this progress report). FWRI also assisted with PCRs to confirm that the extractions
were successful, and is working with the USF genomics team to prepare some of this work for
publication. Discussion will encompass the potential of incorporating eDNA sampling into
biodiversity surveys in the FKNMS.
As referenced in the section Standardized Methods for eDNA Collection, Extraction, and
Analysis, an interactive web article describing the overall project approach in the FKNMS was
prepared to assist with public and stakeholder outreach, and published online in the 2017 FWRI
Programs document:
http://myfwc.maps.arcgis.com/apps/Cascade/index.html?appid=fae996592ba74da7bd6ddba3ee6
6b159
2. DMAC Efforts in the Monterey Bay National Marine Sanctuary
All Sanctuaries have a need to better characterize the diversity of habitats and animals in the
sanctuary and to determine if any changes in the condition of those resources are due to natural
or anthropogenic pressures. In the 2016-2017 year, we made great progress in developing a
variety of products that are going to improve our ability to characterize and understand the status
and trends of biodiversity in sanctuaries, as well as climate and ocean drivers and human
pressures on those resources.
Development of Conceptual Ecosystem Models and Interactive Data Visualization Tools for
Condition Report Assessments and the California Current Integrated Ecosystem Assessment
MBON team members from MBNMS, along with CINMS and the Office of National Marine
Sanctuaries (ONMS), have developed the concept of using interactive visualizations to access
key data products relevant to the questions in Sanctuary Condition Reports. The purpose of these
new tools is to improve real-time availability of status and trend information and to increase
accessibility to key data sets. The conceptual models, developed as 'infographics', are now being
developed for the Florida Keys National Marine Sanctuary as a test pilot to see whether they also
meet the need of local Sanctuary and other resource managers. These interactive visualizations
will serve as a portal to data products that will support dynamically-updated sanctuary Condition
Reports which is a core goal of the Sanctuaries MBON project.
The approach is based on visual conceptual models created by MBNMS in collaboration with the
California Current Integrated Ecosystem Assessment (Greg Williams and Su Kim). We
recently integrated reviewer comments into updated versions of the conceptual models for the
eight major habitats in MBNMS as well as an overview (Figures 5 and 6).
An Infographics Working Group was created at the Sanctuary MBON meeting in March 15-17,
2017, focused on delivering products to support the United Nation’s Sustainable Development
Goal 14 (SDG14; Life Below Water). This group is leading the development of habitat-based

NNX14AP62A – 2016-2017 (Y3) Progress Report: Sanctuaries MBON Demonstration Team
15 | S a n c t u a r i e s M B O N
conceptual models for key habitats in Florida Keys NMS. In addition, Jennifer Brown
(MBNMS) is collaborating with the research team at CINMS and the CCIEA team to customize
the MBNMS infographics for CINMS.
Figure 5. Overview conceptual model illustrating the eight major habitats within Monterey Bay
National Marine Sanctuary, and icons representing land-based pressures, human activities, and
climate and ocean drivers.
The approach to turn static conceptual models into interactive infographics is being piloted in 2-3
sanctuary-habitat combinations:
1) Monterey Bay NMS pelagic habitat (based on conceptual model above)
2) Florida Keys NMS coral reef habitat
3) Channel Islands NMS kelp forest habitat
These pilot interactive examples are being developed by Ben Best (EcoQuants) and available at
https://marinebon.github.io/cr-metrics/pelagic.html. When a user clicks on a silhouette, the time
series and status charts pop up (Figure 7). The goal is to enable a broad range of people – from
decision makers to educators and engaged citizens – to identify species (or other targets) of
interest and, with one or two clicks, see a snap shot of their current status and change over time.
The visualization infographics are currently being revised and when ready, the online products
will be accessible through various NOAA program websites.
This infographic product is one of a suite of online MBON applications whose technical
development is being led by Ben Best in collaboration MBON and Sanctuary scientists for
interactive exploration of various data types: taxonomic, seascape, eDNA, and connectivity. The
infographic approach for exploring taxonomy will be applied to MBON sites (Florida Keys,
Monterey Bay and Channel Islands) as well as globally using OBIS data and summarizing by
country and protected areas. The Seascape explorer will display seascape categorical data in a
map as well as time series of relative concentrations for regions of interest (ROI). Continuous
data, such as SST and chlorophyll will be displayed with measures of spatial heterogeneity over
time for ROI. The eDNA explorer will be applied to the FKNMS and MBNMS datasets (Fig. 8).

NNX14AP62A – 2016-2017 (Y3) Progress Report: Sanctuaries MBON Demonstration Team
16 | S a n c t u a r i e s M B O N
Figure 6. Conceptual model depicting the portfolio of indicators of ecosystem components
(black font), climate and ocean drivers (green font), and human pressures (blue font) for the
pelagic habitat in Monterey Bay National Marine Sanctuary. Q numbers align with the
standardized questions in Office of National Marine Sanctuaries condition reports.

NNX14AP62A – 2016-2017 (Y3) Progress Report: Sanctuaries MBON Demonstration Team
17 | S a n c t u a r i e s M B O N
Figure 7. A print-screen from the demonstration website under-development by the Sanctuaries
MBON project to inform National Marine Sanctuaries status assessments using an interactive
infographic approach for displaying habitat-based elements that link to time series data.
Figure 8. The eDNA explorer app to visualizes operational taxonomic units with filtering
available by space, time and taxa and is available at https://marinebon.github.io/edna-vis.
Ben Best is in the process of creating a Connectivity Explorer app this summer of 2017, with
UCSB Bren School student Stephanie Gad. She completed the technical analysis for Gray’s Reef
master’s group project at UCSB’s Bren School under Ben Best's advisement. The project yielded
a digital products (https://graysreef.github.io) including interactive maps and animations that
describe source locations of fish larvae based on sea surface current patterns, target species
spawning locations and times. These source locations act as potential areas for additional
protection to ensure healthy recruitment of fish populations to the sanctuary. Similar products
will be generated for other sanctuaries, prioritizing Florida Keys, Monterey Bay, Flower Garden
Banks and Channel Islands.
We will work with sanctuary managers and scientists to ensure the best available data are used
and sanctuary-specific concerns are addressed. We will consider using habitats as proxies for
known spawning locations, and representative spawning dates to capture variation between
seasons and years with varying oceanographic regimes (e.g. El Niño vs. La Niña vs. normal). We
will use Marine Geospatial Ecology Tools and contribute open-source functions (e.g. to create

NNX14AP62A – 2016-2017 (Y3) Progress Report: Sanctuaries MBON Demonstration Team
18 | S a n c t u a r i e s M B O N
maps of cumulative percent larvae, and plots of area vs. percent larvae). A final report and digital
datasets will be posted to MBON outlets, as well as manuscript drafted for submission to a peer
reviewed journal.
We have identified key data sets that link to condition report questions that are the target for both
icon development and for incorporation into data services and design of sanctuary-specific
products (maps and/or time series). Key physical and biological time series for the MBNMS
pelagic infographic include:
• basin-scale oceanographic indices (e.g., PDO, NPGO, ONI) (lead: Schroeder et al.);
• seascapes (lead: Kavanaugh et al.);
• SST and other satellite-based physical parameters (lead: CeNCOOS);
• temperature, DO and other platform-based physical parameters (lead: MBARI);
• phytoplankton (MBARI);
• HABs (CeNCOOS);
• krill (RREAS, MBARI, CIMT, ACCESS?),
• forage species by taxa and by biodiversity indices (NMFS-RREAS),
• seabirds nesting success (ACCESS/Point Blue and Oikonos),
• seabird and mammal sightings (NMFS RREAS)
• midwater assemblage (MBARI)
We have also identified some data sets linked to human activities that are good targets for
incorporation into data services:
• vessel AIS (U. S. Coast Guard)
• whale entanglement reports (NOAA Fisheries Protected Resources Division)
• seabird and marine mammals strandings (Beach COMBERS, Marine Mammals
Center/SCOOS)
After incorporation into data services, we will with data providers to design time series products
that can be dynamically generated as new data become available.
Tracking Document for Monterey Bay MBON Education and Outreach
Jennifer Brown continues to track education and outreach efforts primarily for the Monterey Bay
portion of the Sanctuaries MBON demonstration project. The tracking document contains
information on presentations, publications, and press coverage. The Google document is shared
with the members of the MBON team and all team members are encouraged to add entries. The
Google documents is available here https://docs.google.com/a/noaa.gov/document/d/1v6-
kPElFHRgVIBLqYNseBZqLfcO25zh77Bk5OmDOStI/edit?usp=sharing

NNX14AP62A – 2016-2017 (Y3) Progress Report: Sanctuaries MBON Demonstration Team
19 | S a n c t u a r i e s M B O N
Outreach to and Collaboration with the California Current Integrated Ecosystem Assessment
(CCIEA)
As an active collaborator with members of CCIEA science team, MBNMS helps provide
periodic outreach to the larger CCIEA group on MBON processes and product development.
For example, Jennifer Brown periodically meets with the CCIEA web data visualization working
group to share information and ideas for better web-based data visualizations. During the
February 2017 meeting of this group, Brown presented the concept of the web-based data portal
for dynamic sanctuary condition assessments, with early-stage demonstration of the MBON
interactive infographic. Additionally, Jennifer periodically attends the monthly conference call of
the CCIEA program and highlights opportunities for cross-program collaboration between
sanctuaries, the CCIEA, and MBON. During the May 2017 monthly meeting, Gabrielle
Canonico, Isaac Schroeder, and Jennifer Brown gave short informational presentations about the
MBON demonstration program. Jennifer provided an overview of how MBON and CCIEA are
both helping to provide status and trend data for sanctuary condition reports and progress on the
interactive infographic concept to help display that data.
3. MBON Field Campaigns
Expeditions to the Florida Keys National Marine Sanctuary (FKNMS) and surrounding waters
Multiple sites within the FKNMS and surrounding waters were sampled during Year 3 as in
previous years of the project (Figure 9). Specifically, MBON ‘anchor stations’ in the FKNMS
(Molasses Reef, Looe Key and Western Sambo) were occupied monthly to build a time series of
microbial, bio-optical, genomics, and environmental observations, using small boats provided by
FKNMS and aboard the R/V Walton Smith (South Florida Program, AOML).
Figure 9. Location of the MBON and South Florida Program stations
Molasses Reef
Looe Key
Western Sambo

NNX14AP62A – 2016-2017 (Y3) Progress Report: Sanctuaries MBON Demonstration Team
20 | S a n c t u a r i e s M B O N
Fort this annual reporting period, as of May 2017, six research cruises aboard the R/V Walton
Smith and three field campaigns on small boats lead by the FKNMS science team for the MBON
have been completed as follows:
May 9-13, 2016; R/V Walton Smith
July 25-29, 2016; R/V Walton Smith
September 19-23, 2016; R/V Walton Smith
November 14-18, 2016; R/V Walton Smith
January 30 – February 3, 2017; R/V Walton Smith
March 27-31, 2017; R/V Walton Smith
Additional sampling was conducted in the intervening months from small boats operated by the
FKNMS. An additional set of samples was collected in a collaboration with the NOAA
Genomics project (Jim Hendee, Kelly Goodwin) by Chris Sinigalliano (AOML) for eDNA
analyses at Cheeca Rocks, to complement dissolved inorganic carbon and CO2 sampling ongoing
at this site by AOML as part of the NOAA Ocean Acidification monitoring program.
Seascape Validation Experiment in South Florida Waters
Since early 2016, sampling efforts have been focused on collecting observations that will assist
in identifying relationships between in situ biodiversity of lower trophic levels and distributions
of various seascape types. We also seek to validate the seascape classification model using in situ
observations of the various constituents that affect inherent and apparent optical properties of the
FKNMS, FL Bay, and the West FL Shelf. Sampling different seascapes will allow us to examine
how biodiversity of different trophic levels is influenced by changes in ocean chemical and
physical properties derived from ocean color data.
The seascape classification for south Florida waters is currently being improved with the use of
satellite Chl-a input fields from an algorithm developed for shallow and optically complex
coastal environments (Wattelez et al., 2016). The shallow water Chl-a algorithm (SW Chl-a)
performs significantly better than the standard OCx Chl-a in this region. The SW Chl-a
significantly improves the classification, especially over the shallow shelf area (Figure 10).

NNX14AP62A – 2016-2017 (Y3) Progress Report: Sanctuaries MBON Demonstration Team
21 | S a n c t u a r i e s M B O N
Figure 10. Maps show 8-day (March 11-18, 2016) composites of seascape distributions
(MODISA 1-km) with classifications made using the standard Ocean Color (OCx) and shallow-
water (SW; Wattelez et al., 2016) Chl-a algorithms.
Preliminary results show that phytoplankton pigment distributions and specific absorption
spectra (aphy*) spectra are strongly related to environmental conditions (salinity and NH4+ levels)
and seascape type (coastal vs. oceanic; Figure 11). This indicates that phytoplankton
assemblages in oceanic seascapes (≤ 11: high-salinity, low nutrient) are different from those in
coastal seascapes (>12), which highlight areas more influenced by run-off. Seascapes > 14
highlight phytoplankton bloom (i.e. HAB’s) conditions reported by the Florida Fish and Wildlife
Conservation Commission (FWC). These results aid in the ecological interpretation of varying
seascape distributions in south Florida waters and yield promising results on the utility of
satellite seascapes for tracking areas dominated by HAB’s in coastal ecosystems.

NNX14AP62A – 2016-2017 (Y3) Progress Report: Sanctuaries MBON Demonstration Team
22 | S a n c t u a r i e s M B O N
Figure 11. Seascape classification maps during three MBON - South Florida Program cruises are
shown on the left. Sampled stations are highlighted with stars on each map. Dendrograms
constructed with a Hierarchical Agglomerative Clustering (HAC) algorithm show classification
of stations sampled for corresponding periods. Phytoplankton pigments (HPLC) and aphy* spectra
collected at each site were used as vector fields for HAC classifications. Plots below each
dendrogram show salinity and ammonium levels for each station. Colors on labels in each
dendrogram indicate mean seascape type for each station for a particular sampling period.
Environmental DNA and Microbial Assessments in the FKNMS
Various Sanctuary MBON groups continue to participate in bimonthly sampling cruises on board
the R/V Walton Smith (Figure 12). In addition to collecting environmental DNA (eDNA)
samples at the core sites (Molasses Reef, Looe Key, Western Sambo), we have been working
with Maria Kavanaugh to identify and collect samples along seascapes. We have collected
seascape-informed samples for multiple seasons, some of which will be selected for the
microbes-to-whales analysis (see below). From several of these samples, including the outflow
from Shark River, we will be performing metagenomic analyses of the microbial and viral

NNX14AP62A – 2016-2017 (Y3) Progress Report: Sanctuaries MBON Demonstration Team
23 | S a n c t u a r i e s M B O N
communities in addition to the group-specific amplicon analyses. In total, we have over 1000
samples ready for analyses, and have shifted our focus towards strategic processing of these
samples. We have also collected samples of opportunity from the Flower Gardens Banks in
August 2016, after the June-July 2016 die-off of invertebrates.
Figure 12. (Left) USF MBON researchers Anni Djurhuus and Natalie Sawaya collect eDNA
samples on board the R/V Walton Smith in September 2016. (Right) Kate Hubbard (FWRI),
Anni Djurhuus (USF) and Natalie Sawaya (USF) extract DNA from these samples (with great
enthusiasm!)
Standardized Methods for eDNA Collection, Extraction, and Analysis
The Sanctuaries MBON eDNA team, including Ali Boehm’s group at Stanford, Francisco
Chavez’s group at MBARI, Mya Breitbart's lab at USF, and Kate Hubbard's HAB group at
FWRI, completed method tests to determine the effects of different filter types and DNA
extraction methods on diversity of bacteria (16S rDNA), phytoplankton (18S rDNA),
invertebrates (COI), and vertebrates (12S rDNA). We have now identified several protocols that
are acceptable for collecting and processing eDNA samples suitable for cross-trophic level
analysis and developed a standard operating protocol. Other notable methodological progress
includes the establishment and effective utilization of a common bioinformatics pipeline for
analyzing all genetic markers. A manuscript describing this work is currently submitted at the
journal Ecology and Evolution: Djurhuus, A, J Port, C Closek, K Yamahara, O Romero, K Walz,
D Goldsmith, R Michisaki, M Breitbart, A Boehm, F Chavez (in review). Evaluation of filtration
and DNA extraction methods for eDNA biodiversity assessments across multiple trophic levels.

NNX14AP62A – 2016-2017 (Y3) Progress Report: Sanctuaries MBON Demonstration Team
24 | S a n c t u a r i e s M B O N
Microbes to Whales: Cross-Trophic Level Analysis
We have made tremendous progress towards one of the main goals of this MBON project,
namely a cross-trophic level analysis including bacteria, phytoplankton, zooplankton,
invertebrates, and vertebrates, from both the Florida Keys and Monterey Bay sanctuaries. For a
subset of samples capturing spatial and temporal variability from each sanctuary, eDNA has been
collected and extracted and the following genes are currently being amplified and sequenced: the
16S rRNA gene for microbes (bacteria & archaea), the 18S rRNA gene for phytoplankton, the
cytochrome oxidase I (COI) gene for invertebrates, and the 12S rRNA gene from vertebrates.
All data will be processed through a common pipeline and statistically analyzed together.
Environmental DNA (eDNA) Sequencing Provides a Window Into Biological Diversity in the
Florida Keys National Marine Sanctuary
We are currently preparing a manuscript describing 18S rDNA and COI sequences generated
from eDNA collected from the three main stations in the FKNMS at four time points (April,
June, September, November 2015). This manuscript will compare three biological replicates
from each of the different genetic markers, the three different reefs, and the four seasons. These
data reveal the wealth of taxa that can be identified using eDNA analysis from the smallest
phytoplankton in the oceans to large organisms such as sea turtles and sharks. Since zooplankton
(primarily arthropods) dominate both gene data sets, we have also performed detailed
zooplankton analyses (see below). Discussion will encompass the potential of this molecular
species inventory approach for describing biodiversity and how these data compare to our prior
knowledge of diversity in the FKNMS. From these data, we expect to make recommendations
for the amount and frequency of sampling and sequencing that needs to be done moving forward
to obtain diversity estimates in a resource-effective matter. This manuscript is being led by PhD
student Natalie Sawaya at the University of South Florida. An interactive web article describing
the overall project approach in the FKNMS was prepared to assist with public and stakeholder
outreach, and published online in the 2017 FWRI Programs document.
Comparing Diversity Estimates of Florida Keys Zooplankton Using Traditional Microscopic
Versus Environmental DNA Methods
This completed study, led by USF postdoc Anni Djurhuus, compared three different methods
used to assess zooplankton diversity: (1) microscopy versus amplicon (18S rDNA, COI)
sequencing of (2) zooplankton tissue, and (3) environmental DNA (eDNA). The first two
methods are collected directly from zooplankton net tows while eDNA is collected from the
surrounding water, thus allowing researchers to compare eDNA to the physical presence of
zooplankton. We also performed surveys with and without a pre-filter on the eDNA samples to
determine the influence of copepod nauplii being caught on the filter. The preliminary results
from this study, which demonstrated that most families seen through microscopy were also
detected through eDNA sequencing, were presented by Anni Djurhuus as a talk at the 2016
Ocean Sciences Meeting. Further samples have been collected and processed for an in-depth,
statistically robust taxonomic validation of zooplankton biodiversity as determined with eDNA
vs. microscopy methods. We have now completed the full study and bioinformatic analysis of
the sequence data. We expect this to yield a manuscript for submission within the next two

NNX14AP62A – 2016-2017 (Y3) Progress Report: Sanctuaries MBON Demonstration Team
25 | S a n c t u a r i e s M B O N
months, which will be one of the first studies to groundtruth eDNA for documenting pelagic
zooplankton diversity in the oceans.
Seascape-Informed Analyses of Microbial and Viral Diversity in Southwest Florida and the
Florida Keys National Marine Sanctuary
Satellite seascape maps created by Maria Kavanaugh were used to guide the sampling during the
March and September 2016 cruises. These maps (8-day composites) were developed for the
week before the cruise and during the cruise to study the spatiotemporal evolution of seascapes
across the region. Four seascape types were sampled across 27 stations on each cruise for
hydrography, eDNA, phytoplankton taxonomy, and bio-optical properties. Seascape
distributions were compared to concurrent underway observations and discrete observations of
chlorophyll-a concentrations, specific absorption of phytoplankton, detritus, and colored
dissolved organic matter (CDOM), and harmful algae counts from the Florida Fish and Wildlife
Conservation Commission HAB program. Metagenomic sequencing of microbial and viral
samples, 16S rDNA and 18S rDNA amplicon sequencing, and targeted flow cytometric and
microscopy analyses for prokaryotes/eukaryotes, is currently underway and Anni Djurhuus
presented a poster on this research at the 2017 Ocean Sciences Meeting.
Analysis of historical and current satellite and oceanographic cruise data of the northern Gulf of
Mexico to evaluate the causes of a mortality event that affected the Flower Gardens Bank
National Marine Sanctuary in June and July, 2016
The Sanctuaries MBON team engaged with the Flower Gardens Bank National Marine
Sanctuary, NOAA Atlantic Oceanographic and Meteorological Laboratory, and Texas A&M
University immediately upon Sanctuary personnel detecting a die-off in the organisms of the
coral community in in June and July, 2016. The background research on possible causes for this
event continue at this time. The Sanctuary MBON project analyzed an extensive series of
satellite images that suggest the event was caused by a combination of anomalous rainfall over
Texas in the preceding two months and subsequent runoff, and a coastal upwelling event that
advected this coastal water over the Flower Garden Banks. The Sanctuaries MBON hypothesis is
that this nutrient- and organic-matter rich water led to formation of hypoxic plumes or layers at
the bottom of the surface low-salinity plume. The hypothesis is that mortality occurred when one
of these hypoxic layers intersected the crown of the coral banks. The hypothesis is being tested
using historical oceanographic cruise observations of salinity and oxygen, and time series of
historical ocean color data collected from satellites.
Expedition to the Flower Gardens Bank National Marine Sanctuary during a coral spawning
event
The USF team joined an expedition coordinated by the Flower Garden Banks National Marine
Sanctuary (FGBNMS) to the East and West Flower Garden Banks during August 24-26, 2016, to
test eDNA techniques during a massive coral spawning event. The team sailed on the Sanctuary
vessel, the R/V Manta, and collected samples while diving to measure the diversity of genetic
material swirling in the water above the coral during the spawning event. The team sought to
determine whether eDNA can detect the diversity of spawning corals, sponges, and brittle stars

NNX14AP62A – 2016-2017 (Y3) Progress Report: Sanctuaries MBON Demonstration Team
26 | S a n c t u a r i e s M B O N
as they released their sperm and eggs into the water during this annual massive reproduction
event.
Mass coral spawning events are one of nature’s most spectacular phenomena. They happen every
year in the FGBNMS like clockwork, one week after the last full moon just before the end of
summer. We were therefore ready for the reef to start spawning on the night of August 24, 2016,
one hour after sunset. The team was uncertain whether this year’s spawning event was going to
happen on time due to an unprecedented die-off of corals, sponges, brittles stars, sea urchins,
fish, and many other organisms in the eastern FGBNMS in June-July 2016. The causes of this
die-off are still under investigation but we suspect this was the result of a massive and very quick
offshore movement of coastal brackish water in late June and early July after weeks of heavy
rainfall in Texas.
The FGBNMS diving team was led by Michelle Johnston, John Embesi, Ryan Eckert, Kelly
Drinnen, and Dustin Picard. They went overboard right after the sunset to collect seawater
bathing the corals before, during, and after the spawning event. They collected the samples in 1-
liter sterile bags (Figures 12, 13, and 14).
Figure 12. USF graduate student Megan Hepner (left) and Michelle Johnston (right) collecting
eDNA samples above a Montastraea spp. colony in August, 2016. Picture courtesy of the
FGBNMS Research Staff.

NNX14AP62A – 2016-2017 (Y3) Progress Report: Sanctuaries MBON Demonstration Team
27 | S a n c t u a r i e s M B O N
Figure 13. Diver collecting eDNA samples above a Montastraea spp. colony using 1-liter sterile
bag in August, 2016. Picture courtesy of the FGBNMS Research Staff.
Figure 14. Pseudodiploria strigosa during spawning on August 24, 2016. Picture courtesy of the
FGBNMS Research Staff.
Samples were processed on the deck of the R/V Manta. The water was filtered through sterile
filters, which were then stored frozen in liquid nitrogen for transportation to USF for eDNA
analyses. Breitbart’s group is currently extracting and sequencing DNA from this samples.

NNX14AP62A – 2016-2017 (Y3) Progress Report: Sanctuaries MBON Demonstration Team
28 | S a n c t u a r i e s M B O N
Sample Collections in the Monterey Bay National Marine Sanctuary (MBNMS)
From April 25 – June 7, 2016, the Stanford University (SU) group collected eDNA water
samples on the annual NOAA Rockfish Cruise. The group collected over 300 filtered water
samples (0.2 µm) across 7 stations at the depths of 10, 40, and 80m from Point Reyes to Piedras
Blancas. The selected stations span beyond 276-mile length of the MBNMS, allowing us to
observe and compare eDNA biodiversity across the largest NMS in the U.S. A subset of samples
were processed to determine that all groups could use a standardized extraction protocol and
therefore could share extracts for all targeted loci. Select samples from the 2016 Rockfish Cruise
are currently being processed for sequencing the targeted 12S rRNA gene.
The MBNMS team (i.e. SU and MBARI) went on the annual CANON Cruise, a 9-day cruise
(September 23 - October 1, 2016), to sample water for eDNA from 50 stations within MB. We
sampled select stations and depths to expand our understanding of the MB ecosystem. The Bay
environment was quite different from the conditions during our Rockfish Cruise in spring 2016,
as there were algal blooms occurring throughout the Bay. The samples are contributing to the
historical MB Time Series, a portion of which we are using as part of the MBON project.
From April 26 – May 5, 2017, Collin Closek, from the SU group, joined the annual Rockfish
Cruise to collect a new set of eDNA water samples from some of the same locations as 2016.
The samples were collected before trawls to compare eDNA richness to trawl catches. For the
last 2 days of the sampling trip the Rockfish cruise rendezvoused with MBARI’s Western Flyer
and long-range autonomous underwater vehicle (LR-AUV) to simultaneously characterize the
biodiversity within the water column (i.e. through eDNA collected via CTD, via LR-AUV, and
fish trawls) (see Figure 15). Additionally, SU collected water samples for nutrients and filtered
liquids from trawl catches.
Environmental DNA Method Optimization Efforts at the Center for Ocean Solutions
To optimize our methods for detecting Eukaryotes using eDNA, the eDNA team has compared
multiple loci as well as the extraction methods to determine the limitations and preferences
across the groups for robust taxa detection. Ryan Kelly and Collin Closek from the SU group
along with other co-authors from NOAA compared detection of organisms across manual (i.e.
visual counts) and three conserved eukaryotic molecular makers (16S, 18S, and COI). The
Frontiers in Marine Science paper (Genetic and Manual Survey Methods Yield Different and
Complementary Views of an Ecosystem) by Kelly et al., 2017, showed increased detection of a
taxonomic group through multiple methods, however there were some taxa identified through
manual counts that were not detected with the loci tested.
The eDNA team also conducted a methods comparison test to determine which filter type and
extraction method yielded the most consistant results across the loci of interest. This comparison
informed the standard method the eDNA team uses to collect and extract our eDNA water filter
samples. The paper by Djurhuus et al. is currently under review.

NNX14AP62A – 2016-2017 (Y3) Progress Report: Sanctuaries MBON Demonstration Team
29 | S a n c t u a r i e s M B O N
Anchovies to Whales
Using historical samples from the MB Time Series, we examined the diversity of 12S rRNA
sequences from samples collected during falls of 2008-2015. The sequences were compared to
whale observation data collected by whale watching companies during the eight years. Anchovy
DNA was quantified in the samples by a species-specific qPCR assay designed by Sassoubre et
al., 2016. Patterns in these species of interest showed presence of specific organismal
communities during certain years and an oscillation between sardine and anchovy in MB (Figure
14). The manuscript is in progress and is being prepared by Co-PI F. Chavez.
Microbes to Whales (m2w)
The biological communities in samples collected from both the Florida Keys (FK) and MB
NMSs are being compared. Representative samples from the two Sanctuaries are being
sequenced to identify taxa from different trophic levels by targeting the COI mtDNA, 16S, 12S,
and 18S rRNA genes. We aim to gain a deeper understanding of the food webs and changes in
the biodiversity in these environments by comparing the biodiversity trends across seasons and
years. We are currently in the process of submitting our samples for sequencing. Collin Closek
and Anni Djurhuus will be analyzing the resulting data and writing the corresponding
manuscript.
Figure 15. Left panel: 2017 Rockfish cruise photos. The team joined NOAA SWFSC’s annual Juvenile Groundfish
Cruise along the central California coast to compare eDNA samples collected to the diversity captured during trawl
assessments. MBARI’s RV Western Flyer joined the cruise on May 3 & 4, 2017. The rendezvous allowed for
simultaneous collections of water using the LRAUV and CTD as well as fish counts from trawls. Right panel: The
time series was dominated by sequences from Clupeidae (Sardine, Herring, Menhaden), Engraulidae (Anchovy), and
Paralichthyidae (Large-tooth flounders). Sardine sequences dominated samples from MB during Fall 2008 and 2010,
while Anchovy sequences dominated during Fall 2013 and 2014, which agrees with California fish catch numbers.

NNX14AP62A – 2016-2017 (Y3) Progress Report: Sanctuaries MBON Demonstration Team
30 | S a n c t u a r i e s M B O N
qPCR Assays for Detecting Organisms
We are designing quantitative PCR (qPCR) assays to detect DNA from specific species. The
species targeted were selected based on their trophic importance in the MB food web by the
entire MB MBON team. The SU group has designed qPCR assays to target Humpback Whale
(Megaptera novaeangliae), Common Murre (Uria aalge), and Shortbelly Rockfish (Sebastes
jordani). Samples of U. aalge tissue as well as tissue from other seabird species were acquired
from the Ornithology Collection at Drexel University’s Academy of Natural Sciences. S. jordani
samples were obtained from the NOAA SWFSC Fisheries Ecology Division. We collected other
fish species during the Rockfish Cruise in May 2016. M. novaeangliae and other marine
mammal tissue samples were acquired from the Marine Mammal Center (MMC) in Sausalito,
CA. DNA from all tissues samples have been extracted. qPCR optimization trials are currently in
process for both the U. aalge and M. novaeangliae assays.
Results from the 2015 CANON Cruise
We finished analysis of the metabarcoding data from the 2015 CANON Cruise. The work was
published in PLOS ONE.
Activities: Collin presented the Anchovies to Whales work as an oral presentation at Stanford’s
Postdoctoral Research Symposium and at the AGU Meeting in December 2016. Collin also
presented this work as posters at Stanford’s BIO-X Research Summer 2016 Symposium, Woods
Institute’s Young Environmental Scholars 2017 Conference, and at the American Society for
Limonology and Oceanography 2017 Meeting.
We conduct eDNA calls twice per month. In addition, we had a 2-day MB-focused meeting
across all the MBON teams in July 2016. Collin attended the SDG-14 MBON meeting in St.
Petersburg, FL in March 2017 and continues to work with the biodiversity team to create a
MBON SDG-14 product.
Summary of planned activities in the MBNMS for next year
1) We will complete the microbes to whales (m2w) sequencing and begin data analysis and
writing.
2) We plan to work on the qPCR assays and hopefully finalize them and test them on eDNA
extracts from the field.
3) Contribute to continued work on the anchovies to whales project with collaborators at
MBARI.
4) Work with MBARI to harmonize results between autonomous vehicle and grab samples
during the Rockfish Cruise. Work with MBARI to complete the autonomous vehicle assays.
5) Continue outreach with managers and policy makers on the use of eDNA for biomonitoring.

NNX14AP62A – 2016-2017 (Y3) Progress Report: Sanctuaries MBON Demonstration Team
31 | S a n c t u a r i e s M B O N
4. Seascapes and High-Resolution Satellite Remote Sensing Products
Sanctuaries MBON
Modern seascape classification
merges lower trophic level ecology,
geography, and ocean dynamics
using observations that are updated
regularly and that provide a
historical context for reference
against which to measure change
(Figure 16).
Objective classification and
validation of remotely-sensed
dynamic seascapes using high
resolution (1 km) satellite data has
occurred at regional to local scales
in temperate-upwelling (California)
and tropical reef environments
(Florida) as part of the US MBON
pilot program. Seascapes provide a
framework to assess and scale up
patterns of biodiversity and effects
of environmental change on pelagic
community structure, ranging from
microbes to fish, and provide
indicators of habitat quality to
inform National Marine Sanctuary
Condition Reports. A goal of the
MBON is to better understand the
effects of climate and coastal ocean
dynamics on spatiotemporal
dynamics of marine species
distributions in order to inform state
and federal management. In concert
with ship, buoy, and autonomous
platform measurements, seascapes
categories are being used as an
objective extent to plan sampling,
conduct rarefaction studies, inter-
compare spatial and temporal
patterns across trophic levels, test
hypotheses of fisheries habitat
affinities (e.g. Santora et al., 2012;
Figure 16. Seascapes as an observational and management
tool. From Kavanaugh et al., 2016. Blue arrows denote the
interplay between mechanistic hypotheses testing and analyses
of emergent patterns. The conservation goal, spatiotemporal
scale, and parameters of interest may determine whether
synoptic time series of satellite remote sensing (2-D),
assimilated marine ecosystem models (3-D) or both are used to
define seascapes. Higher resolution in situ data can provide
vertical data, but also higher resolution organismal information
than that provided by remote sensing reflectances or model
functional types. Finally, in addition to informing conservation
(e.g. rarefaction, patch and boundary analyses), management
(trends and oscillations of major habitats) inter- and intra-
seascape analyses can inform basic scientific inquiry such as
dominant environmental drivers, and scales of biological self-
organization (e.g. through partial-mantel tests).
Conservation GoalExample: Establishing a baseline of marine biodiversity
Covariance AnalysisClustering, neural network, edge or gradient detection
Temporally evolving seascape:e.g. Central California, USA with National Marine Sanctuary
boundaries, showing areal extent of seascapes over time
Spatiotemporal scaleDiurnal, seasonal, interannual, climate
Local ,mesoscale, basin, global
Multivariate distribution: size =spherical variance
Seascape parametersSynoptic variables via model or satellite that
capture ecosystem dynamics
Inter- and intra-seascape metrics or analyses:e.g. expansion, habitat diversity, occupancy,
group differences, rarefaction, environmental drivers, self organization scales.
High resolution validation and technological comparison: e.g. eDNA, in situ optics, pigments, plankton imagery
Topology to dynamic topography
Define
SST

NNX14AP62A – 2016-2017 (Y3) Progress Report: Sanctuaries MBON Demonstration Team
32 | S a n c t u a r i e s M B O N
Kavanaugh et al., in prep; Figure 15), quantify seascape habitat diversity (Whitaker, 1977;
Turner, 2005), and examine temporal shifts in habitat quality and availability within existing
jurisdictional units.
MBON seascapes are classified at 1 and 4 km spatial resolution and at 8-day and monthly
temporal resolution. The high spatial resolution is reserved for local regions; 4 km is used to
characterize regional to basin scale patterns (such as the Pacific Arctic Sector, see Goal 3). The 8
day average allows for sufficient data density during periods where cloud cover obscures remote
sensing of ocean color variables. For the 1 km case, Level-2 (L2) mapped files subsetted to a
particular ROI will be ordered and then downloaded from the OBPG, which will allow greater
flexibility to develop non-standard satellite products suited to the ecological regions of those
areas. For example, the generalized ocean color inversion model (Werdell et al., 2013) will be
used to approximate CDOM for the Arctic and thus provide more robust and universal inputs to
regionally-tuned seascapes than default satellite products previously designed for use in the open
ocean. Additional products include phytoplankton functional types, derived from empirical
relationships to remote sensing reflectances (e.g. diatoms in Antarctic coastal waters; Kavanaugh
et al., 2015) or from theoretical inversions to absorbance and scattering (e.g. Mouw and Yoder,
2010; Kostadinov et al., 2009). These algorithms provide information on community structure
and habitat quality beyond that of chl-a. The raw data are processed and stored at University of
South Florida Institute for Marine Remote Sensing.
Cross MBON efforts (X-MBON)
Multivariate satellite seascapes allow us to document change in pelagic habitat type and water
quality within coastal national exclusive economic zone boundaries (EEZs), provide
oceanographic context for long term ecological monitoring projects (e.g. the NSF-funded Long
Term Ecological Research program) and internationally over the high seas and Ecological or
Biologically Significant Marine Areas. The latter are regions identified by the Convention on
Biological Diversity as areas in open-ocean waters and deep sea habitats in need of protection
based on the following criteria: uniqueness and rarity, special importance for life history stages,
importance for threatened, endangered or declining species or habitats, vulnerability,
productivity, diversity, and naturalness, the latter indicating the degree of human impact.
Some X-MBON efforts led by the Sanctuaries MBON are further described below.
The Arctic MBON (AmBON)
The Arctic is experiencing dramatic change, with declining seasonal sea ice, earlier sea ice
retreat, increased ocean temperatures and freshening of the water column with increased glacial
and permafrost melt (Woodgate et al., 2012; Stroeve et al., 2014; Frey et al., 2014, 2015; Wood
et al., 2015).These environmental shifts result in significant alteration of marine structure and
function, driving shifts in marine species composition, phenology, and carbon cycling
(Grebmeier et al., 2006b; Bluhm and Gradinger, 2008; Nelson et al., 2014). An important co-
factor in this trend is the advection of Pacific water into the Arctic (Carmack and Wassmann,
2006) from the northern Bering Sea to the Chukchi Sea (Stigebrandt, 1984; Kinder et al., 1986;
Danielson et al., 2014). Additional heat, nutrients, organic carbon and organisms are advected

NNX14AP62A – 2016-2017 (Y3) Progress Report: Sanctuaries MBON Demonstration Team
33 | S a n c t u a r i e s M B O N
through the Bering Sea into the Chukchi Sea, contributing substantially to seasonal local
production (Coachman et al., 1975; Sambrotto et al., 1984; Walsh et al., 1989). Following
several inflowing pathways driven by bathymetry, the inflow of Bering Sea water leaves a
signature on seasonal sea ice retreat as unique water mass characteristics within the melting ice
edge (Paquette and Bourke, 1981; Wood et al., 2015). The importance of the Arctic Ocean to
global climate and ecosystem processes, and the speed at which climate changes are already
occurring in the Arctic, elevate the urgency for coordinated observations of Arctic marine
biodiversity.
The Arctic Marine Biodiversity Network or AMBON involves an experienced team of multi-
institutional and multi-sector partners already active in a variety of Arctic biodiversity observing
programs. However, until recently, the AMBON has not had an integrated satellite seascape
observing component. This partnership within AMBON and across the US-MBON program will
allow us to better coordinate, sustain, and synthesize all efforts, and make data available to a
broad audience of users and stakeholders, from local to the pan-Arctic region up to the global
system. Effective data management, integration and dissemination will provide critical
information on the status of Arctic ecosystem health and resilience to decision makers and local,
regional and global communities.
Figure 17. Preliminary results showing feasibility for satellite derived seascape classification for
the Arctic. A. June seascapes for three different years classified from sea-ice concentration,
CDOM, Chl-a, nflh, and SST. Mean qualities of classified seascapes showing relative influence
of sea ice and ocean color in open water (1-3, blues in A) ice edge (5 and 6) and high productive
shelf seascape (4, 7) C. Time Series of high Chl-a shelf seascape (orange) extent and ice
coverage within the domain .

NNX14AP62A – 2016-2017 (Y3) Progress Report: Sanctuaries MBON Demonstration Team
34 | S a n c t u a r i e s M B O N
An important feature of the AMBON is the focus on benthic biodiversity. Benthic macrofaunal
communities on the shallow continental shelves of the Pacific Arctic accumulate high biomass in
response to high levels of seasonal export of pelagic production that is either being advected into
the system from upstream primary production or produced locally and exported to the
underlying sediments directly (Grebmeier et al., 2006a; Nelson et al., 2014). The interaction
between circulation features and local production inputs have resulted in persistent benthic
hotspots. These four hotspots are also associated with high chlorophyll a (chl a) content in the
water column (Springer et al., 1996; Hill and Cota, 2005; Lee et al., 2007; Brown et al., 2011;
Cooper et al., 2013), and thus are visible from satellite ocean color.
We have hypothesized that changes in Chl-a, dissolved organic matter and temperature will be
evident from the spatial patterns of satellite derived seascapes. Seascapes will provide context for
the Chukchi Sea AMBON and DBO programs, and the identification and geographic analyses of
dynamic surface water masses will contribute to understanding the relative influence of regional
and local inputs to both pelagic and benthic hot spots. Because of the unique nature of the
environment, a seascape classification scheme will also consider the dynamics of sea ice and
create indices (e.g. Figure 17-C) that are of use to end users interested in pelagic-benthic
relationships. Indices will include variability of seascape habitat extent and persistence of high
productivity seascapes over benthic hotspots.
Data to validate remotely sensed seascapes will come from the AMBON for the Chukchi Shelf
and the Distributed Biological Observatory (DBO) for the northern Bering, Chukchi, and
Beaufort Seas.
Santa Barbara Channel Long Term Environmental Research
PI Kavanaugh is working with Investigator Dan Otis at University of South Florida and PI
Robert Miller of the Santa Barbara Channel LTER MBON to develop seascape prototypes for
the Santa Barbara Bight. These maps will form the basis of neutral models of larval dispersal as
well as environmental indices for kelp forests. Kavanaugh is classifying seascapes based on a
regional classification model of the California Current to provide a means of comparison
between US West Coast MBONs.
U.N. Sustainable Development Goal 14 Biodiversity Product
The Group on Earth Observations (GEO, https://www.earthobservations.org) Thematic Marine
Biodiversity Observing Network (MBON) supports the operational monitoring of marine
biodiversity, defined broadly as the variety of life at the gene, species and ecosystem levels.
Understanding how biodiversity changes across these levels provides insight to ecosystem
resiliency or vulnerability to global change, and their capacity to maintain the vital ecosystem
services on which humans depend. The systematic observation of life in the global ocean
requires both standardized in-situ (field observations) and remote sensing methods, and a means
for stakeholders to compare status and trends between locations.
Biogeographic studies have sought to characterize variation of life forms and ecosystems at
different space and time scales for some time (Dasmann, 1968; Longhurst, 1998; Briggs and

NNX14AP62A – 2016-2017 (Y3) Progress Report: Sanctuaries MBON Demonstration Team
35 | S a n c t u a r i e s M B O N
Bowen, 2012). Recently, a new map of global ecological land units (ELUs) was developed from
an integration of climate, landform, lithology, and land cover (Sayre et al., 2014). The mapping
effort was commission by GEO, was data-driven, and based on the physical environmental
controls which are understood to be the primary control of species distributions (Bailey, 2009).
Partnering with ESRI and several other partners (including NatureServe, University of Auckland,
GRID-Arendal, and WHOI), the USGS now has a similar environmental stratification approach
for extending the global ecosystems map into the oceans through the delineation of global
ecological marine units (EMUs; Sayre et al., in accepted). The EMU process recognizes that
marine ecosystems are not two dimensional, but operate as both 2D (e.g. sea surface and
seafloor) and 3D (e.g. water column) entities (e.g., Li and Gold, 2004; Wright et al., 2007).
The EMU project classified distinct volumetric regions using data from the World Ocean Atlas
(Locarmini et al., 2013; Garcia et al., 2013; Garcia et al., 2014). Temperature, salinity, dissolved
oxygen, nitrate, silicate, and phosphate multi-year climatological means populate a ¼ degree
ocean mesh horizontally that is extended over 102 depth zones in the vertical direction. A k-
means statistical clustering of the six physicochemical variables listed above at over 52 million
latitude x longitude x depth zone locations, identified 37 physically distinct, relatively
homogenous, volumetric regions in the water column (EMUs). Temporally the EMUs represent a
57 year climatological mean of water mass location. A paper highlighting the results and process
is in review (Sayre et al., accepted) and an informational web site, data portal, and interactive
tool are available to stakeholders through ESRI (http://www.esri.com/ecological-marine-units).
Ongoing efforts by the EMU project seek to extend the multi-year climatological classification
of physical and chemical data to a seasonal climatological classification.
The Sanctuaries MBON team is working with the EMU team to link global synoptic seascapes.
Global synoptic seascapes
Over the last decade, methods to study spatiotemporal patterns of biological variables using
satellite-based remote sensing have improved significantly (Saraceno et al., 2006; Platt and
Sathyendranath, 2008; Mouw and Yoder, 2010; Mouw et al., 2012; Reygondeau et al., 2013).
The dynamic ‘seascape’ concept was introduced as a means of categorizing the complex, multi-
scale patterns of open ocean ecosystems into an organized, hierarchical biogeographical
framework (Kavanaugh 2014; 2016). Satellite seascapes incorporate the complexity of
biophysical interactions and the circulation of the fluid environment. The method is robust to
nonlinear responses of marine taxa to physical forcing, which are prevalent at cellular (Jassby
and Platt, 1976) to community levels of organization (Steele and Henderson, 1992; Litzow and
Ciannelli, 2007). The use of synoptic satellite data allows for seascapes to be objectively defined
at multiple, nested scales (Kavanaugh et al., 2014). For open ocean systems, this objective
method is more efficient than more subjective static biogeographic assessments (Longhurst,
1998). Satellite derived seascapes provide the necessary context for understanding biodiversity
across the diverse coastal habitats represented by the US-MBON pilot program.
Seascapes are classified within the MBON using a suite of synoptic time series including satellite
and modeled variables. These variables include satellite-derived SST, PAR, chl-a, normalized
fluorescence line height (a metric of phytoplankton nutrient status), dynamic height (SSH), and

NNX14AP62A – 2016-2017 (Y3) Progress Report: Sanctuaries MBON Demonstration Team
36 | S a n c t u a r i e s M B O N
modeled salinity and mixed layer depth. Most variables are direct satellite based measurements;
some however (e.g. salinity and mixed layer depth) are modeled (Estimating the Circulation and
Climate of the Ocean: ECCO v.2). Salinity was available from the Aquarius satellite mission for
a short period, however the spatial footprint (1 degree) is too large for local application.
Horizontal Co-Location with Annual and Seasonal Ecological Marine Units (EMUs)
The WOA data upon which the EMUS are based have several native temporal resolutions
(seasonal, annual, and decadal) that we plan to exploit as a next step. We now have we have
established a framework for constructing temporally-sequenced EMU distribution maps for
seasonal, annual, and decadal characterizations. We are developing the present 3D framework to
show changes at each location over time, to facilitate the horizontal co-location of annual and
seasonal EMUs with surface seascapes.
Water Column Variability Underlying Global Seascapes
Current vertical distribution of the EMUs through the water column shows cluster either slowly
disappearing with depth, with no clear-cut horizontal boundary (Sayre et al., 2017). A
comparison between the boundaries of realms and ecosystems in the upper water column
underlying global seascapes should indicate what environmental gradients have most strongly
influenced the evolution of biodiversity by being barriers to species dispersal. This in turn should
inform as to what volumetric regions (realms and ecosystems) may be the most valuable for
environmental management because of similar environmental conditions and species
composition (Costello et al., in press). Fidelity of EMUs (discrete sense) and coherence of
variability (continuous sense) are being compared to surface signature of distinct seascapes and
their boundaries. Multivariate analysis of variance and clustering are being used to determine
where or if surface seascapes can determine unique properties in the underlying water column.
Seascapes and Large Marine Ecosystems
A manuscript entitled Megaregions Among the Large Marine Ecosystems of the Americas was
published in 2017 by a team of Sanctuary MBON co-authors (*Muller-Karger, F., Digna Rueda-
Roa, Francisco Chavez, Maria Kavanaugh, and Mitchell A. Roffer. 2017. Megaregions Among
the Large Marine Ecosystems of the Americas. Environmental Development.
http://dx.doi.org/10.1016/j.envdev.2017.01.005.). With this study, we found:
1) Three megaregions emerged when considering similarities in species composition of
fisheries landings, fisheries-derived diversity indices, and characteristic environmental
conditions among LMEs. Specifically, these include (A) the South Brazil Shelf, East Brazil
Shelf, and North Brazil Shelf LMEs, (B) the Gulf of Mexico and Southeast U.S. Continental
Shelf LMEs, and (C) the Northeast U.S. Continental Shelf, Scotian Shelf, and
Newfoundland-Labrador Shelf LMEs.
2) No apparent megaregions emerged for the Pacific Ocean. While there were some shared
species assemblages between the California Current and the Gulf of Alaska, the Gulf of
California, and the Pacific Central-American Coastal LMEs, these showed different average

NNX14AP62A – 2016-2017 (Y3) Progress Report: Sanctuaries MBON Demonstration Team
37 | S a n c t u a r i e s M B O N
environmental conditions and fishery-derived diversity indices, so they don’t form one
ecological megaregion.
3) Between 1982 and 2010, seven different LMEs diversified their fisheries (Pacific Central-
America Coastal, Patagonian Shelf, South Brazil Shelf, East Brazil Shelf, North Brazil Shelf,
Southeast U.S. Continental Shelf, and Newfoundland-Labrador Shelf). Three LMEs showed
increasingly less diversified fisheries, namely the California Current, the Northeast U.S.
Continental Shelf, and the Caribbean Sea LMEs. The causes for either an increase or
decrease in the diversification of the fisheries are numerous, and can range from large-scale
environmental forcing like warming of the Atlantic Ocean to focused conservation efforts
such as in the California Current LME.
Current and Future Multidisciplinary Remote Sensing Work : Sustainable Marine Biogeographic
Framework for Conservation and Management: IOOS, ESRI and COVERAGE
PI Kavanaugh has been involved in several activities geared toward sustainability of MBON-
related products. Satellite seascape processing and products are in the process of being
automated so that maps can be provided to stakeholders in real time. At the local scale (e.g.
within the existing US-MBON projects), IOOS data portals are used to store seascape output. On
the global scale we are collaborating with NASA Jet Propulsion Lab and ESRI to trace a path to
the sustained generation of MBON satellite products. Initially, collaborators at JPL will serve as
advisors in the capacity of the Physical Oceanography Distributed Active Archive Center (PO-
DAAC). The PO-DAAC is a key source of multiscale satellite data to classify seascapes.
However, our colleagues at JPL are also initiating the COVERAGE program (CEOS Ocean
Variables Enabling Research and Applications for GEO). COVERAGE is intended to integrate
observations from four separate international oceanographic satellite constellations in near real-
time.
Kavanaugh is also working closely with ESRI, who were responsible for building the original 3-
D point mesh framework out of over 52M points extracted from the World Ocean Atlas, for
performing the statistical clustering, creating the project web site and data portal, and for
producing a range of data products (e.g., open access downloads of the 3D point mesh and EMU
clusters at the surface, bottom, and within the water column, as well as 2D and 3D web apps for
exploration of the EMUs and the original World Ocean Atlas data, data dictionaries, and data
sheets) (Figure 18). ESRI will continue to host these data products as well as additional data
products resulting from this project and new tools for 3D web viewing, 3D cross sections, and
analysis tools as they are developed (e.g., compare multiple locations, multidimenstional range
slider, and 3D kriging). ESRI will collaborate with the JPL COVERAGE group in hosting data
to ensure that all data and map products are accessible in multiple formats and regularly updated.
ESRI will also continue to take the lead in adding more associative attributes to the EMUs from
other globally available resources, including Ocean Biogeographic Information System (OBIS)
species records at the surface and at depth where available, and the direction and velocity of
currents. All the aforementioned work will be provided as in-kind support at no cost to the
project due to the alignment of this project with ESRI ‘s current R&D initiative in ocean GIS
(ESRI invests ~31% of its revenues back into R&D). ESRI Chief Scientist Dawn Wright will

NNX14AP62A – 2016-2017 (Y3) Progress Report: Sanctuaries MBON Demonstration Team
38 | S a n c t u a r i e s M B O N
continue to supervise this work at ESRI in concert with ESRI product development teams in
content and spatial statistics.
The NOAA NESDIS CoastWatch program (Paul DiGiacomo) has expressed a commitment to
engage in discussions to host both U.S. regional seascape products at high spatial resolution (1
km) and global products at reduced resolution (possibly 4 or 9 km). These discussions are now
underway as of June 2017.
MBON and SDG-14 Satellite Products
Satellite products for the MBON and SDG-14 projects are created at three different spatial
resolutions, 1-km, 9-km and 0.25 degree. Global ocean color products are binned to monthly
intervals, while regional 1-km products are binned to 8-day time intervals (Table 2 and 3). All
ocean color products utilize data from the Moderate Resolution Imaging Spectroradiometer
(MODIS-Aqua) satellite sensor and are obtained from the Ocean Biology Processing Group
(OBPG) at NASA’s Goddard Space Flight Center. Satellite image files are downloaded via ftp to
USF servers and subsequently processed at USF. Output products are stored and distributed to
MBON and SDG-14 team members via ftp from USF servers.
In Year 3, we have added regions of interest (ROI) to cover the Santa Barbara Channel and
Flower Garden Banks. We have also added a full set of products that cover the entire globe as
part of the SDG-14 project. Information on ROI, spatial resolution and parameters of satellite
products are given in the two tables below. To establish an extended SST record, we have also
added a Global High Resolution Sea Surface Temperature (GHRSST) product that extends back
to 1982. This product incorporates data from both satellite and instrument measurements and has
Figure 18. Intercomparison of surface
classification schemes showing surface
EMUs (A), dominant seascape classified
from SST, Chl-a and nflh, the latter giving a
sense of nutrient stress (B), and number of
seascapes represented in a given pixel (C).
Note the similarity in boundaries between A
and B and the importance of seasonal
boundary shifts that C represents.
A B
C

NNX14AP62A – 2016-2017 (Y3) Progress Report: Sanctuaries MBON Demonstration Team
39 | S a n c t u a r i e s M B O N
a spatial resolution of 0.25 degree. Daily image files are obtained from the Jet Propulsion
Laboratory (JPL) Physical Oceanography Distributed Active Archive Center (PODAAC) and
binned temporally to monthly intervals to match the rest of our global products.
Our plans for Year 4 include further automation of our processing scheme and incorporation of
the final seascape generation to make the overall process as streamlined as possible while
requiring the least amount of day to day input by USF personnel. We also plan to add other ROI
as needed to facilitate seascape analysis, particularly with potential international partners.
Table 2. Regions of interest (ROI) for MBON and SDG-14 satellite products
Region ID Resolution Latitude Longitude
Global GLOB 9-km, 0.25 Deg. 90°S – 90°N 180°W – 180°E
Chukchi Sea CHUK 1-km 64°N – 73°N 180°W – 160°W
Florida Keys FK 1-km 23°N – 26°N 84°W – 79°W
Flower Garden Banks FGB 1-km 24°N – 31°N 98°W – 88°W
Gulf of Mexico GOM 1-km 18°N – 31°N 98°W – 79°W
Monterey Bay MONB 1-km 34°N – 40°N 128°W – 120°W
Santa Barbara Channel SBA 1-km 31°N – 35°N 121°W – 117°W
Table 3. Output products being generated
Parameter Algorithm ID Code Units Reference
Chlor_a CI (default) chlor_a mg/m3 Hu et al. (2012)
Chlor_a ocx chl_ocx mg/m3 O’Reilly et al. (2000)
Chlor_a Statistical chl_sw mg/m3 Wattelez et al. (2016)
CDOM
absorption
GIOP adg_443 m-1
Werdell et al. (2013)
Backscatter slope GIOP bbp_s_44
3
nm-1
m-1
Werdell et al. (2013)
PAR Default par einstein/m2/day Frouin et al. (1989)
NFLH Default nflh W/m2/μm
2/sr Behrenfeld et al. (2009)
SST – Day Long-wave sstd Deg. C N/A
SST – Night Short-wave sstn Deg. C N/A
5. GEO BON MBON and Other International Efforts
The leadership of the Sanctuaries MBON of the MBON task team of the GEO Bon Working
Group 5, jointly with Mark Costello (U. Auckland) and Isabel Sousa Pinto (U. Porto), led to the
formal establishment of the Thematic MBON under GEO BON in summer 2016. The MBON
group has been meeting monthly over webinars. The team has continued to develop a vision of
“a global network of marine observation networks that monitors all key aspects of biodiversity-
relevant change to support policy, decision making, and healthy and sustainable oceans” to:
• promote the establishment of best practices for global biodiversity observations;

NNX14AP62A – 2016-2017 (Y3) Progress Report: Sanctuaries MBON Demonstration Team
40 | S a n c t u a r i e s M B O N
• improve the collection of harmonized data, developing data standards and methodologies for
data management and dissemination;
• facilitate data sharing without compromising national concerns;
• integrate biodiversity information with physical and chemical data over time (status and
trends); and
• generate the products needed for informed management of the global ocean.
The GEO MBON seeks to assist in identifying change in the diversity of life in the ocean as an
indicator of ecosystem change, in support of critical management decisions by coastal and ocean
resource managers. Changes in communities, species and habitats are indicators of
environmental change relevant to ecosystem services and the well-being of humanity. The
MBON helps the integration and coordination of national and international programs for marine
biodiversity observation by providing improved access to data, tools, and expertise. The MBON
will contribute to the development and measurement of marine Essential Biodiversity Variables,
and contribute methods and tools for a Marine BON in a Box.
The GEO MBON grows out of the priority activities of the GEO BON WG5. It includes and
builds on the Global Marine Ecosystem Mapping effort (Sayre et al., 2015). It incorporates the
biodiversity priorities of various GEO initiatives, including Blue Planet and AmeriGEOSS, and
coordinates with IOC/UNESCO (GOOS and I-OBIS), and other national and international
groups to serve the broadest possible community.
The MBON seeks to help nations and regions to improve conservation planning and
environmental impact mitigation, serve the scientific community, and satisfy commitments to the
Convention of Biological Diversity (CBD) and the Intergovernmental Science-Policy Platform
on Biodiversity and Ecosystem Services (IPBES).
GEO MBON and SDG14 pilot product developments were presented at many meetings and
workshops, including:
The GEO Marine Biodiversity Observation Network (MBON) Workshop, July 6-7, 2016,
Leipzig, Germany.
GEO MBON Pole-to-Pole of the Americas Workshop, September 26-30, 2016, Puerto
Morelos, México.
GEO Ministerial Meeting / November 2016 / St. Petersburg, Russia.
CBD Side Event: 3rd
Science for Biodiversity Forum - Mainstreaming Biodiversity for well-
being: Contributions form Science. December 1-2, 2016, Cancun, Mexico.
Future Earth Meeting – December 2016, Kiel, Germany
SDG14 Demonstration Product, March 15-17, 2017, St Petersburg, FL.
Blue Planet, May 2017, Washington DC.
An important international initiative led by MBON was the signing of a collaboration agreement
between MBON, the Global Ocean Observing System (GOOS), and the Ocean Biogeographic
Information System (OBIS). The goal of signing the agreement is to:

NNX14AP62A – 2016-2017 (Y3) Progress Report: Sanctuaries MBON Demonstration Team
41 | S a n c t u a r i e s M B O N
foster a partnership with the Intergovernmental Oceanographic
Commission (IOC) to define Essential Biodiversity Variables (EOV)
under the GOOS Essential Ocean Variables (EOV);
engage OBIS to expand the community that uses specific standards to
use and share biodiversity data.
MBON will continue to be fully engaged in the GOOS Bio-Eco panel to promote and implement
the amalgamation of the EOV and EBV.
6. Highlights from PR and E&O
Newsletters and websites: Reynolds and Montes edited/produced four issues of the Sanctuaries
MBON Update in 2016-2017 to inform partners and external collaborators about current research
activities. The marinbon.org website, launched in Feb 2016, was revised to focus on U.S. MBON
strategies and initiatives. The Sanctuaries MBON project site
http://www.sanctuaries.marinebon.org was launched June 22.
Presentations and Videos: Dr. Kathy Sullivan (NOAA Administrator and Under Secretary of
Commerce for Oceans and Atmosphere through 2016) gave a 20 minute presentation at the
IUCN World Conservation Congress (September, 2016) about programs and new tools to
monitor marine biodiversity. The Sanctuaries MBON team supported her communications staff
with images of MBON projects including: AUVs, eDNA, integrated datasets/interactive portals;
seascapes and collaboration with USGS on the EMUs tool. A clip from a video created by Ben
Best to showcase the MBON portal was included in Dr. Sullivan’s presentation. The full three-
minute video is on several MBON websites. Reynolds is working with Sanctuaries staff and
AOML researchers to create short videos, similar to the “Earth is Blue” series. Interviews were
conducted in March 2016, b-roll collected in April-June. Editing will be completed in the
summer. Release is planned for Sept 2017.
Topic-focused outreach: MBON researchers and the communications staff at the Florida Fish
and Wildlife Conservation Commission/ Fish and Wildlife Research Institute (FWCC/FWRI)
and Stanford University Center for Ocean Solutions (COS) implemented activities on
environmental DNA. In Nov. 2016, the FWCC/FWRI created a visually engaging story map to
inform managers and stakeholders about the use of environmental DNA sampling methods and
its importance to FWRI's Harmful Algal Blooms (HAB) research program. The story map
focuses on the use of the genomics tools/methods developed by MBON, as part of FWCC/FWRI
monitoring and event response. In Dec 2016, MBON eDNA was featured on the BBC World
Service radio. Collin Closek (COS) was interviewed about the work he and Alexandria Boehm
conducted on vertebrate fishery assessments with metabarcoding eDNA. In Feb. 2016, Closek
presented MBON eDNA research and the Monterey Bay, CA Fall historical time series at
Stanford’s Young Environmental Scholars (YES) Conference. In June 2017, Kristen Weiss
(COS) created “Solutions,” a new video series, one of which featured MBON eDNA to create
awareness of early career scientists and innovative research.
Youth Outreach and Education: In St. Petersburg, Florida, GCOOS O/E lead Chris Simoniello
conducted activities at three school science festivals and the 2016 St. Petersburg Science

NNX14AP62A – 2016-2017 (Y3) Progress Report: Sanctuaries MBON Demonstration Team
42 | S a n c t u a r i e s M B O N
Festival, which reaches more than 200 children. Simonello combined resources from MBON and
a grant from the NOAA Climate Stewards Program to develop 12 hands-on STEM lessons
aligned to Florida education standards for grades 1-8. She taught four lessons to 60 gifted
elementary students. Lesson were adapted and taught by teachers to more than 640 elementary
students and high school students in schools which have a majority of students who qualify for
Title 1 status and 60% are African American. In August 2016, Simonello, Montes and Reynolds
led a small group discussion with teachers at the Hillsborough Public High School district-wide
Science Educator Professional Development Day.
MBON webinars: F. Muller-Karger convenes the following separate monthly MBON webinars:
- Sanctuary MBON: a monthly call to review Sancuary requirements and provide
project updates to Sanctuary personnel.
- X-MBON coordination: Muller-Karger has tried to promote a dialogue between the
various U.S. MBON projects (AK MBON, SBC MBON, Sanctuaries MBON and the
Smithsonian Institution's Tennenbaum Marine Observatory)
- Global MBON: a monthly webinar with the international GEO BON MBON
community has highlighted a variety of things such as the GEO Wetlands concept,
specific international programs focused on a particular region, links between MBON,
GOOS, and OBIS, various scientific paper discussions, and concepts for BON in a
Box, among many other topics.
7. Budget Expenditures:
At the University of South Florida, we continue to support one Master’s graduate student (M.
Hepner) and Research Associate E. Montes. PI Muller-Karger has 1 month summer salary
charged to this grant. Other students, postdocs and researchers are supported through the several
project subcontracts.
Budget expenditures are on track. There are no changes to the budget for Year 4.
8. Peer-Reviewed Publications and Other Products
Andruszkiewicz, E. A., H. A. Starks, F. P. Chavez, L. M. Sassoubre, B. A. Block, A. B. Boehm.
2017. Biomonitoring of marine vertebrates in Monterey Bay using eDNA metabarcoding.
PLOS ONE 12(4): e0176343.
Anni Djurhuus, Collin J. Closek, Jesse Port, Hilary Starks, Kevan Yamahara, Ofelia Romero,
Kristine Walz, Dawn Goldsmith, Reiko Michisaki, Mya Breitbart, Alexandria A. Boehm,
Francisco P. Chavez. Standardizing filter type and extraction method for marine biodiversity
monitoring using environmental DNA. (in review).
Biller, S.J., L.D. McDaniel, M. Breitbart, E. Rogers, J.H. Paul, S.W. Chisholm (2017).
Membrane vesicles in seawater: heterogeneous DNA content and implications for viral
abundance estimates. ISME Journal. 11: 394-404.
Kavanaugh, M.T., Rheuban, J., Luis, K. and S. Doney, Thirty-four years of benthic warming on
the New England Shelf: patterns, drivers and ecological consequences. Submitted JGR
Oceans

NNX14AP62A – 2016-2017 (Y3) Progress Report: Sanctuaries MBON Demonstration Team
43 | S a n c t u a r i e s M B O N
Kavanaugh, M.T., Oliver, M., Chavez, F., Letelier, R.M., Muller Karger, F. and Doney, S.C.
2016. Quo Vadimus: Seascapes as a new vernacular for ocean monitoring, management and
conservation. ICES Journal of Marine Science 73 (7), 1839-1850
Mackey, K.M., Kavanaugh, M.T. Chen, Y., Liu, F., Glover, D., Paytan, A. Atmospheric and
fluvial nutrients fuel harmful algal blooms in the East China Sea. 2017. Front. Mar. Sci. 4:2.
doi: 10.3389/fmars.2017.00002
Montes, E., M. T. Kavanaugh, J. P. Cannizzaro, D. Otis, A. Djurhuus, L. Visser, K. Hubbard, F.
Muller-Karger (in prep). Validation of dynamic satellite seascapes classification for
understanding marine biogeography and scaling ocean biodiversity observations in the
Florida Keys National Marine Sanctuary. Marine Ecology Progress Series.
Muller-Karger, F.E., Rueda-Roa, D., Chavez, F.P., Kavanaugh, M.T. and Roffer, M.A., 2017.
Megaregions among the large marine ecosystems of the Americas. 2017. Environmental
Development. http://dx.doi.org/10.1016/j.envdev.2017.01.005 In press
Rheuban, J., Kavanaugh, M.T., and S. Doney, Implications of future Northwest Atlantic bottom
temperatures on the American Lobster (Homerus americanus) fishery. Submitted JGR
Oceans
Ryan P. Kelly, Collin J. Closek, James L. O’Donnell, James E. Kralj, Andrew O. Shelton,
Jameal F. Samhouri (2017). Genetic and Manual Survey Methods Yield Different and
Complementary Views of an Ecosystem. Frontiers in Marine Science, 3:283
Sayre, R. , D. J. Wright, S. P. Breyer, K. A. Butler, K. Van Graafeiland, M. J. Costello, P. T.
Harris, K. L. Goodin, J. M. Guinotte, Z. Basher, M. T. Kavanaugh, P. N. Halpin, M. E.
Monaco, N. A. Cressie, P. Aniello, C. E. Frye, and D. Stephens. A three-dimensional
mapping of the ocean based on environmental data. In press. Oceanography
Sassoubre, L. M., K. M. Yamahara, L. Gardner, B. Block, A. B. Boehm. 2016. Environmental
DNA (eDNA) shedding and decay rates of three marine fish. Environmental Science &
Technology, 50(19), 10456-10464
Symonds, E., C. Sinigalliano, M. Gidley, W. Ahmed, S.M. McQuaig-Ulrich, M. Breitbart
(2016). Fecal pollution along the southeastern coast of Florida and insight into the use of
pepper mild mottle virus as an indicator. Journal of Applied Microbiology. 121: 1469-1481.
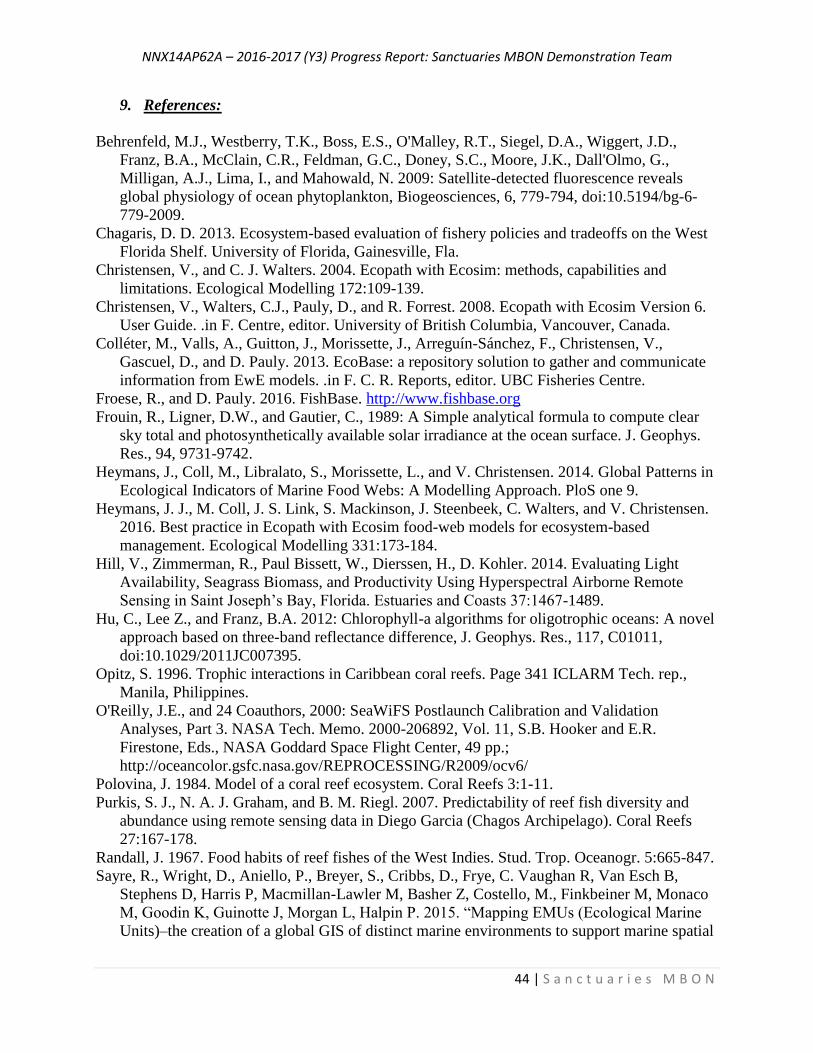
NNX14AP62A – 2016-2017 (Y3) Progress Report: Sanctuaries MBON Demonstration Team
44 | S a n c t u a r i e s M B O N
9. References:
Behrenfeld, M.J., Westberry, T.K., Boss, E.S., O'Malley, R.T., Siegel, D.A., Wiggert, J.D.,
Franz, B.A., McClain, C.R., Feldman, G.C., Doney, S.C., Moore, J.K., Dall'Olmo, G.,
Milligan, A.J., Lima, I., and Mahowald, N. 2009: Satellite-detected fluorescence reveals
global physiology of ocean phytoplankton, Biogeosciences, 6, 779-794, doi:10.5194/bg-6-
779-2009.
Chagaris, D. D. 2013. Ecosystem-based evaluation of fishery policies and tradeoffs on the West
Florida Shelf. University of Florida, Gainesville, Fla.
Christensen, V., and C. J. Walters. 2004. Ecopath with Ecosim: methods, capabilities and
limitations. Ecological Modelling 172:109-139.
Christensen, V., Walters, C.J., Pauly, D., and R. Forrest. 2008. Ecopath with Ecosim Version 6.
User Guide. .in F. Centre, editor. University of British Columbia, Vancouver, Canada.
Colléter, M., Valls, A., Guitton, J., Morissette, J., Arreguín-Sánchez, F., Christensen, V.,
Gascuel, D., and D. Pauly. 2013. EcoBase: a repository solution to gather and communicate
information from EwE models. .in F. C. R. Reports, editor. UBC Fisheries Centre.
Froese, R., and D. Pauly. 2016. FishBase. http://www.fishbase.org
Frouin, R., Ligner, D.W., and Gautier, C., 1989: A Simple analytical formula to compute clear
sky total and photosynthetically available solar irradiance at the ocean surface. J. Geophys.
Res., 94, 9731-9742.
Heymans, J., Coll, M., Libralato, S., Morissette, L., and V. Christensen. 2014. Global Patterns in
Ecological Indicators of Marine Food Webs: A Modelling Approach. PloS one 9.
Heymans, J. J., M. Coll, J. S. Link, S. Mackinson, J. Steenbeek, C. Walters, and V. Christensen.
2016. Best practice in Ecopath with Ecosim food-web models for ecosystem-based
management. Ecological Modelling 331:173-184.
Hill, V., Zimmerman, R., Paul Bissett, W., Dierssen, H., D. Kohler. 2014. Evaluating Light
Availability, Seagrass Biomass, and Productivity Using Hyperspectral Airborne Remote
Sensing in Saint Joseph’s Bay, Florida. Estuaries and Coasts 37:1467-1489.
Hu, C., Lee Z., and Franz, B.A. 2012: Chlorophyll-a algorithms for oligotrophic oceans: A novel
approach based on three-band reflectance difference, J. Geophys. Res., 117, C01011,
doi:10.1029/2011JC007395.
Opitz, S. 1996. Trophic interactions in Caribbean coral reefs. Page 341 ICLARM Tech. rep.,
Manila, Philippines.
O'Reilly, J.E., and 24 Coauthors, 2000: SeaWiFS Postlaunch Calibration and Validation
Analyses, Part 3. NASA Tech. Memo. 2000-206892, Vol. 11, S.B. Hooker and E.R.
Firestone, Eds., NASA Goddard Space Flight Center, 49 pp.;
http://oceancolor.gsfc.nasa.gov/REPROCESSING/R2009/ocv6/
Polovina, J. 1984. Model of a coral reef ecosystem. Coral Reefs 3:1-11.
Purkis, S. J., N. A. J. Graham, and B. M. Riegl. 2007. Predictability of reef fish diversity and
abundance using remote sensing data in Diego Garcia (Chagos Archipelago). Coral Reefs
27:167-178.
Randall, J. 1967. Food habits of reef fishes of the West Indies. Stud. Trop. Oceanogr. 5:665-847.
Sayre, R., Wright, D., Aniello, P., Breyer, S., Cribbs, D., Frye, C. Vaughan R, Van Esch B,
Stephens D, Harris P, Macmillan-Lawler M, Basher Z, Costello, M., Finkbeiner M, Monaco
M, Goodin K, Guinotte J, Morgan L, Halpin P. 2015. “Mapping EMUs (Ecological Marine
Units)–the creation of a global GIS of distinct marine environments to support marine spatial

NNX14AP62A – 2016-2017 (Y3) Progress Report: Sanctuaries MBON Demonstration Team
45 | S a n c t u a r i e s M B O N
planning, management and conservation”. GEOHAB 2015, Marine Geological and
Biological Habitat Mapping, May 3-8, Salvador Bahia Brazil: 21.
Thornhill DJ, R. R., Todd BD, Chilcoat GC, Iglesias-Prieto R, et al. 2011. A Connection
between Colony Biomass and Death in Caribbean Reef-Building Corals. PloS one 6.
Venier, J., and D. Pauly. 1997. Trophic dynamics of a Florida Keys ecosystem.
Walters, C., Martell, S., Christensen, V., and B. Mahmoudi. 2008. An ecosim model for
exploring Gulf of Mexico ecosystem management options: Implications of including
multistanza life-history models for policy predictions. Bulletin of Marine Science 83:251-
271.
Wattelez, G., Dupouy, C., Mageas, M., Lefevre, J., Touraivane, and Frouin, R. 2016: A
statistical algorithm for estimating chlorophyll concentration in the New Caledonia Lagoon.
Remote Sensing. Vol. 8. No. 45. doi:10.3390/rs8010045.
Werdell, P. J., Franz, B.A., Bailey, S.W., Feldman, G.C., Boss, E., Brando, V.E., Dowell, M.,
Hirata, T., Levander, S.J., Lee, Z.P., Loisel, H., Maritorena, S., Melin, F., Moore, T.S.,
Smyth, T.J., Antoine, D., Devred, E., d'Andon, O., and Mangin, A. (2013). "Generalized
ocean color inversion model for retrieving marine inherent optical properties." Appl. Opt.
52(10): 2019-2037.