MBMC Measuring the Price Level and Inflation. MBMC Copyright c 2004 by The McGraw-Hill Companies,...
55
MB MC Measuring the Price Level and Inflation
-
date post
20-Dec-2015 -
Category
Documents
-
view
218 -
download
4
Transcript of MBMC Measuring the Price Level and Inflation. MBMC Copyright c 2004 by The McGraw-Hill Companies,...
MB MC
Measuring the Price Level and Inflation
Measuring the Price Level and Inflation
Chapter 6: Measuring the Price Level and Inflation Slide 2
MB MC
Copyright c 2004 by The McGraw-HillCompanies, Inc. All rights reserved.
Introduction
What Do You Think?Could you retire in thirty years if you have
$100 million?
Chapter 6: Measuring the Price Level and Inflation Slide 3
MB MC
Copyright c 2004 by The McGraw-HillCompanies, Inc. All rights reserved.
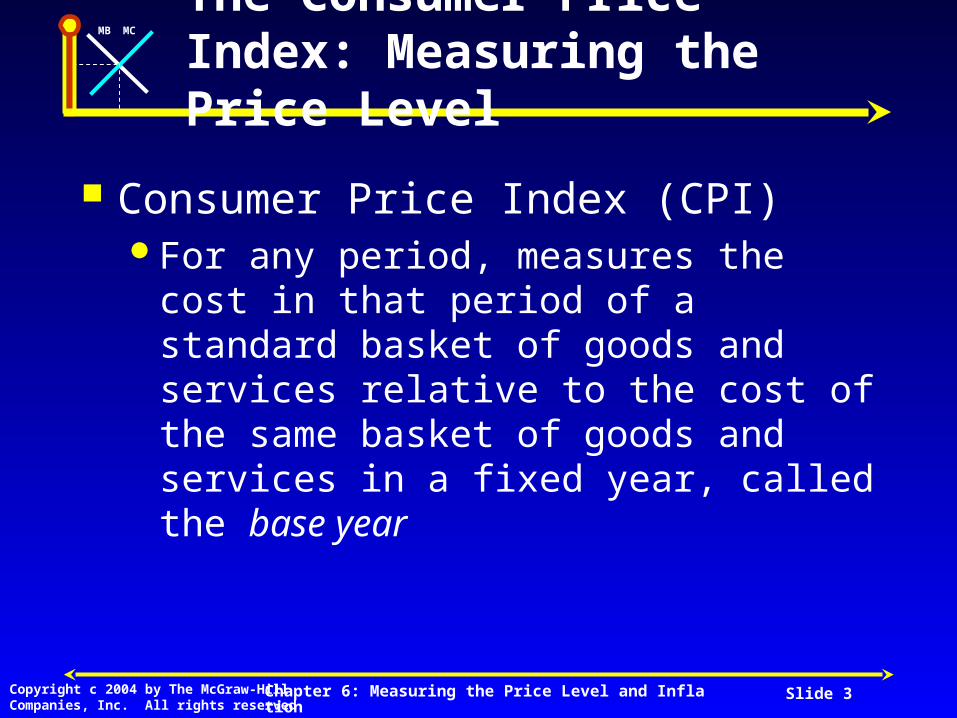
The Consumer Price Index: Measuring the Price Level
Consumer Price Index (CPI)For any period, measures the cost in that
period of a standard basket of goods and services relative to the cost of the same basket of goods and services in a fixed year, called the base year
Chapter 6: Measuring the Price Level and Inflation Slide 4
MB MC
Copyright c 2004 by The McGraw-HillCompanies, Inc. All rights reserved.
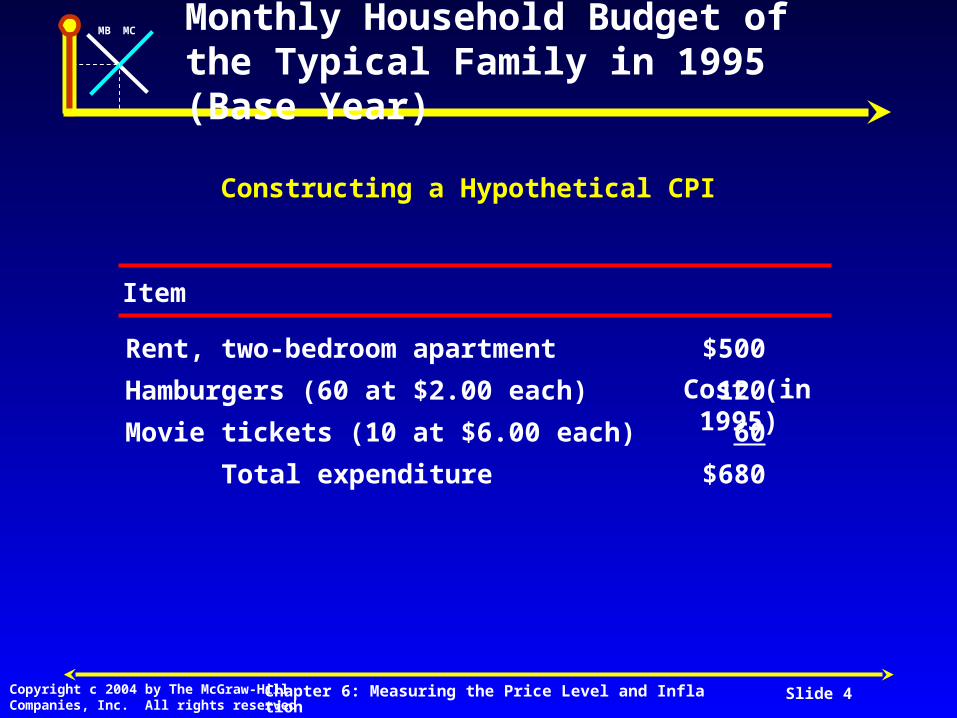
Monthly Household Budget of the Typical Family in 1995 (Base Year)
Item Cost (in 1995)
Rent, two-bedroom apartment $500
Hamburgers (60 at $2.00 each) 120
Movie tickets (10 at $6.00 each) 60
Total expenditure $680
Constructing a Hypothetical CPI
Chapter 6: Measuring the Price Level and Inflation Slide 5
MB MC
Copyright c 2004 by The McGraw-HillCompanies, Inc. All rights reserved.
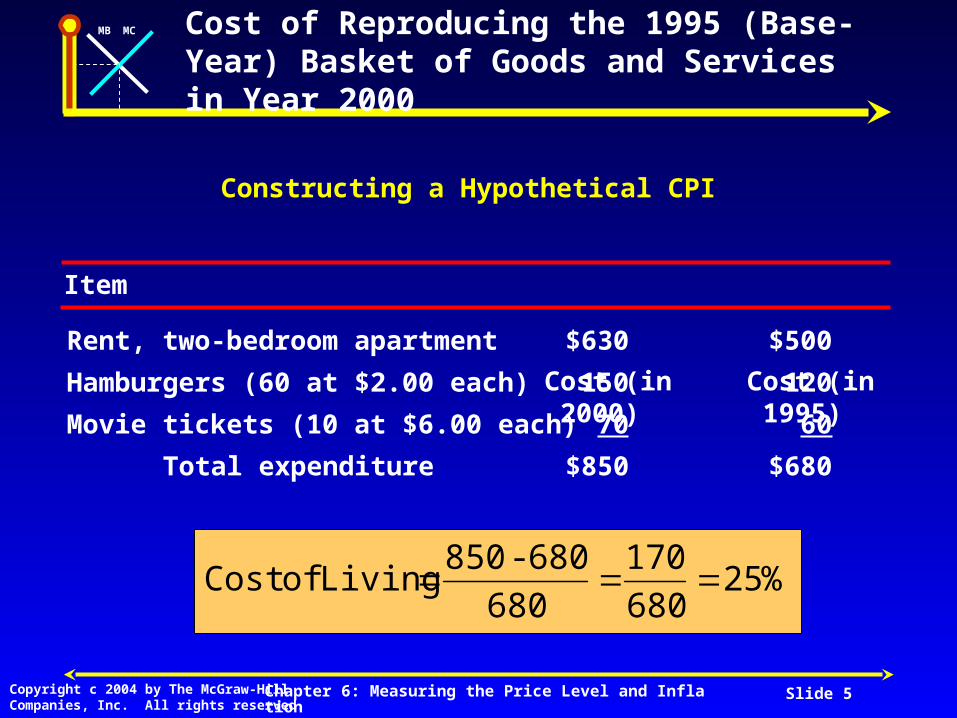
Cost of Reproducing the 1995 (Base-Year) Basket of Goods and Services in Year 2000
Item Cost (in 1995)
Rent, two-bedroom apartment $630 $500
Hamburgers (60 at $2.00 each) 150 120
Movie tickets (10 at $6.00 each) 70 60
Total expenditure $850 $680
Cost (in 2000)
Constructing a Hypothetical CPI
%25680
170
680
680 - 850 Living of Cost

Chapter 6: Measuring the Price Level and Inflation Slide 6
MB MC
Copyright c 2004 by The McGraw-HillCompanies, Inc. All rights reserved.
The Consumer Price Index: Measuring the Price Level
Constructing the CPIBureau of Labor Statistics (BLS)
Pick a base yearConduct the consumer expenditure survey to
determine the base-year basket of goods and services
Measure the current prices of the base-year basket
yearbase in services and goods of basket year-base of Cost
yearcurrent in services and goods of basket year-base of Cost CPI
Chapter 6: Measuring the Price Level and Inflation Slide 7
MB MC
Copyright c 2004 by The McGraw-HillCompanies, Inc. All rights reserved.
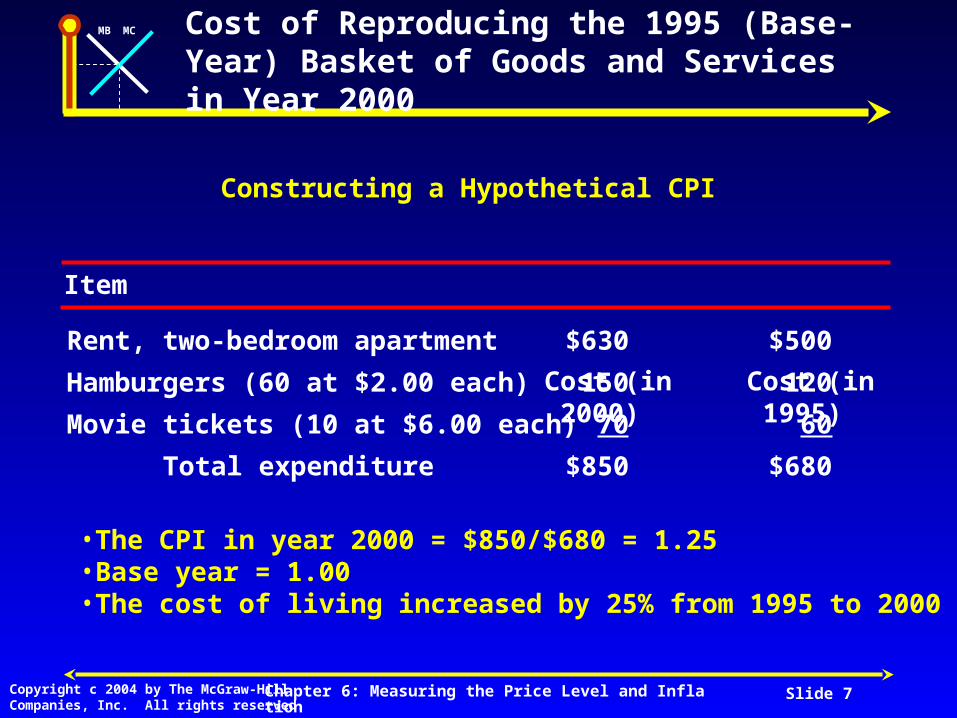
Cost of Reproducing the 1995 (Base-Year) Basket of Goods and Services in Year 2000
Item Cost (in 1995)
Rent, two-bedroom apartment $630 $500
Hamburgers (60 at $2.00 each) 150 120
Movie tickets (10 at $6.00 each) 70 60
Total expenditure $850 $680
Cost (in 2000)
Constructing a Hypothetical CPI
•The CPI in year 2000 = $850/$680 = 1.25•Base year = 1.00•The cost of living increased by 25% from 1995 to 2000

Chapter 6: Measuring the Price Level and Inflation Slide 8
MB MC
Copyright c 2004 by The McGraw-HillCompanies, Inc. All rights reserved.
The Consumer Price Index: Measuring the Price Level
Constructing the CPIThe CPI for a given period measures the
cost of living for that period relative to the base year
Chapter 6: Measuring the Price Level and Inflation Slide 9
MB MC
Copyright c 2004 by The McGraw-HillCompanies, Inc. All rights reserved.
The Consumer Price Index: Measuring the Price Level
Constructing the CPIThe CPI is a price index.
Price IndexA measure of the average price of a given
class of goods or services relative to the price of the same goods and services in a base year

Chapter 6: Measuring the Price Level and Inflation Slide 10
MB MC
Copyright c 2004 by The McGraw-HillCompanies, Inc. All rights reserved.
Inflation
CPIMeasures the average level of prices
relative to prices in the base year
InflationMeasures how fast the average price level
is changing over time
Chapter 6: Measuring the Price Level and Inflation Slide 11
MB MC
Copyright c 2004 by The McGraw-HillCompanies, Inc. All rights reserved.
Inflation
Rate of InflationThe annual percentage rate of change in
the price level
Chapter 6: Measuring the Price Level and Inflation Slide 12
MB MC
Copyright c 2004 by The McGraw-HillCompanies, Inc. All rights reserved.
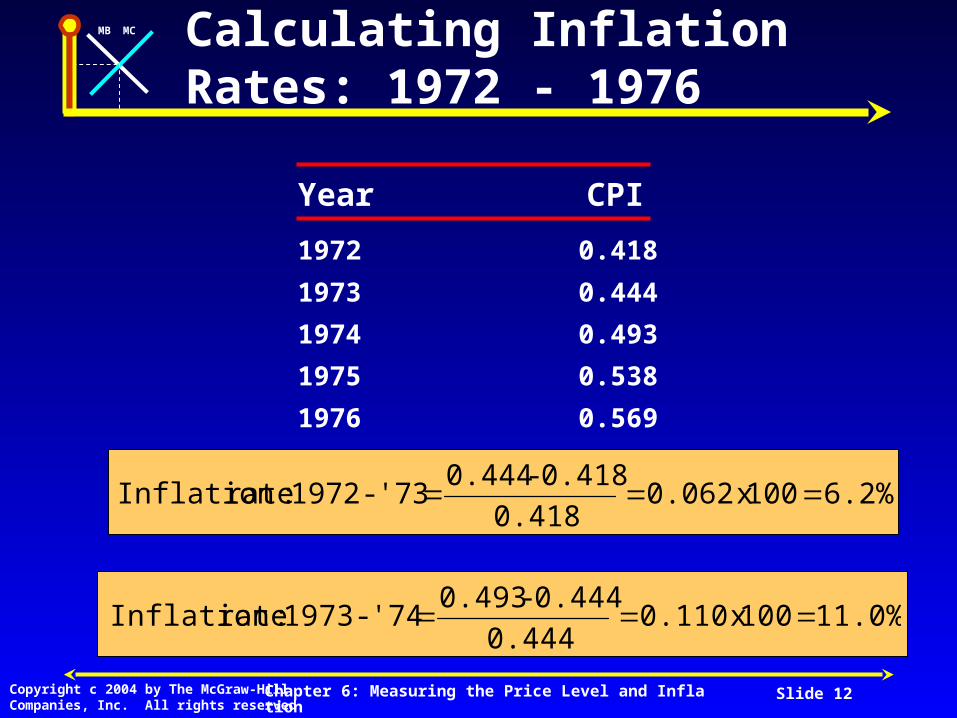
Calculating InflationRates: 1972 - 1976
Year CPI
1972 0.418
1973 0.444
1974 0.493
1975 0.538
1976 0.569
6.2% 100 x 0.062 0.418
0.418 - 0.444 '73 - 1972 :rate Inflation
11.0% 100 x 0.110 0.444
0.444 - 0.493 '74 - 1973 :rate Inflation
Chapter 6: Measuring the Price Level and Inflation Slide 13
MB MC
Copyright c 2004 by The McGraw-HillCompanies, Inc. All rights reserved.
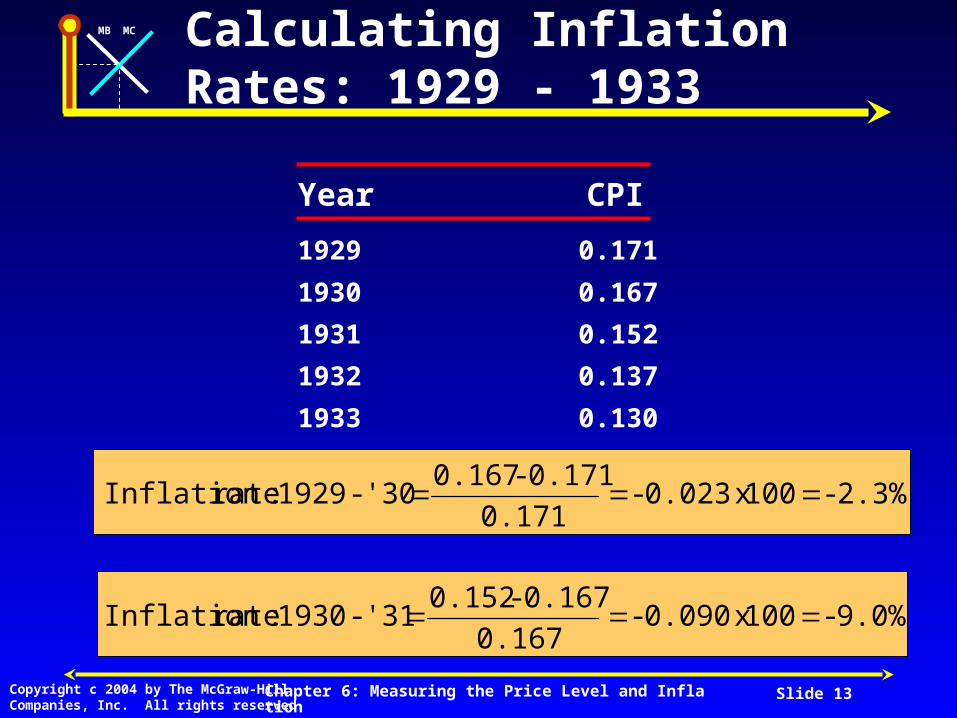
Calculating InflationRates: 1929 - 1933
Year CPI
1929 0.171
1930 0.167
1931 0.152
1932 0.137
1933 0.130
2.3%- 100 x 0.023- 0.171
0.171 - 0.167 '30 - 1929 :rate Inflation
9.0%- 100 x 0.090- 0.167
0.167 - 0.152 '31 - 1930 :rate Inflation
Chapter 6: Measuring the Price Level and Inflation Slide 14
MB MC
Copyright c 2004 by The McGraw-HillCompanies, Inc. All rights reserved.
Inflation
DeflationA situation in which the prices of most
goods and services are falling over time so that inflation is negative
Chapter 6: Measuring the Price Level and Inflation Slide 15
MB MC
Copyright c 2004 by The McGraw-HillCompanies, Inc. All rights reserved.
Adjusting for Inflation
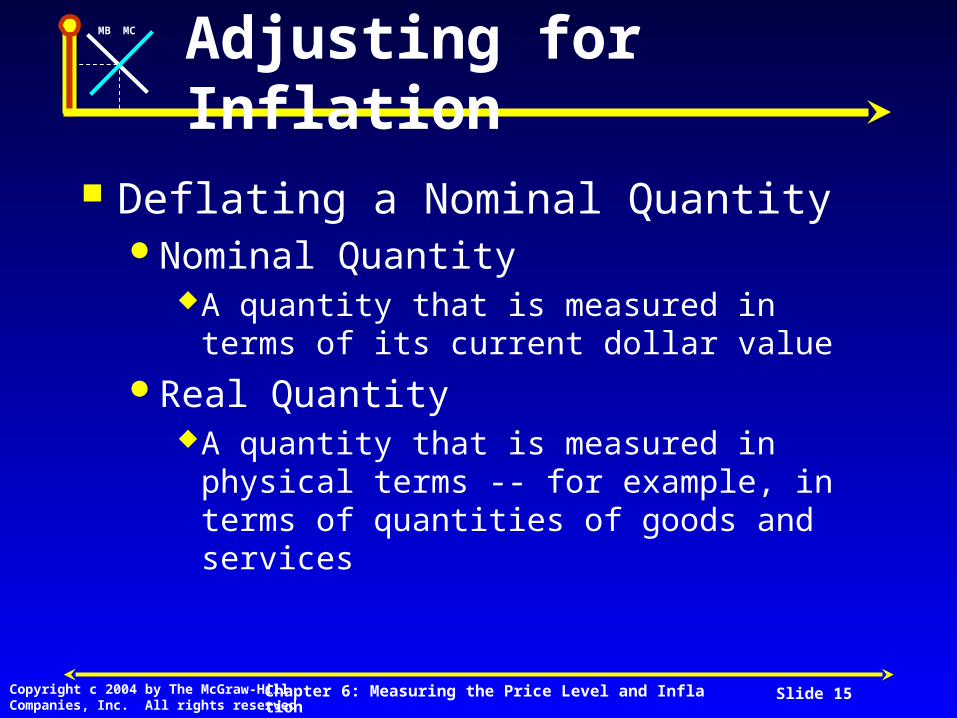
Deflating a Nominal QuantityNominal Quantity
A quantity that is measured in terms of its current dollar value
Real QuantityA quantity that is measured in physical terms --
for example, in terms of quantities of goods and services

Chapter 6: Measuring the Price Level and Inflation Slide 16
MB MC
Copyright c 2004 by The McGraw-HillCompanies, Inc. All rights reserved.
Adjusting for Inflation
Deflating a Nominal QuantityDeflating (a nominal quantity)
A process of dividing a nominal quantity by a price index (such as the CPI) to express the quantity in real terms

Chapter 6: Measuring the Price Level and Inflation Slide 17
MB MC
Copyright c 2004 by The McGraw-HillCompanies, Inc. All rights reserved.
Comparing the Real Values of a Family’s Income in 1995 and 2000
YearReal family income =
Nominal family income/CPI
1995 $20,000 1.00 $20,000/1.00 = $20,000
2000 $22,000 1.25 $22,000/1.25 = $17,600
Nominal family income CPI
Chapter 6: Measuring the Price Level and Inflation Slide 18
MB MC
Copyright c 2004 by The McGraw-HillCompanies, Inc. All rights reserved.
Adjusting for Inflation
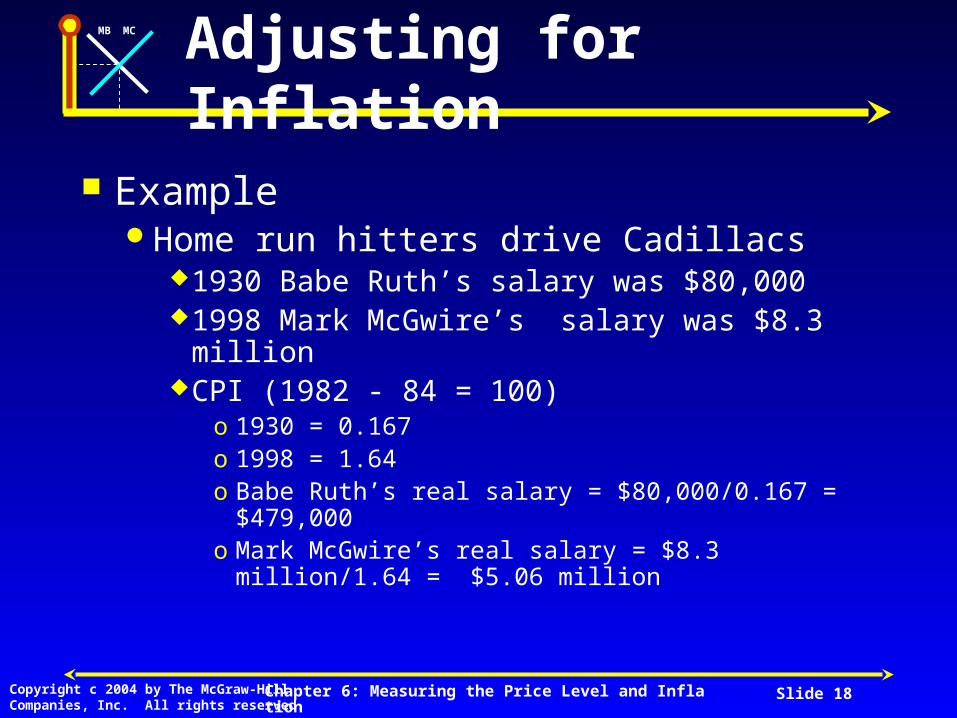
ExampleHome run hitters drive Cadillacs
1930 Babe Ruth’s salary was $80,0001998 Mark McGwire’s salary was $8.3 millionCPI (1982 - 84 = 100)
o 1930 = 0.167o 1998 = 1.64o Babe Ruth’s real salary = $80,000/0.167 = $479,000o Mark McGwire’s real salary = $8.3 million/1.64 =
$5.06 million
Chapter 6: Measuring the Price Level and Inflation Slide 19
MB MC
Copyright c 2004 by The McGraw-HillCompanies, Inc. All rights reserved.
Adjusting for Inflation
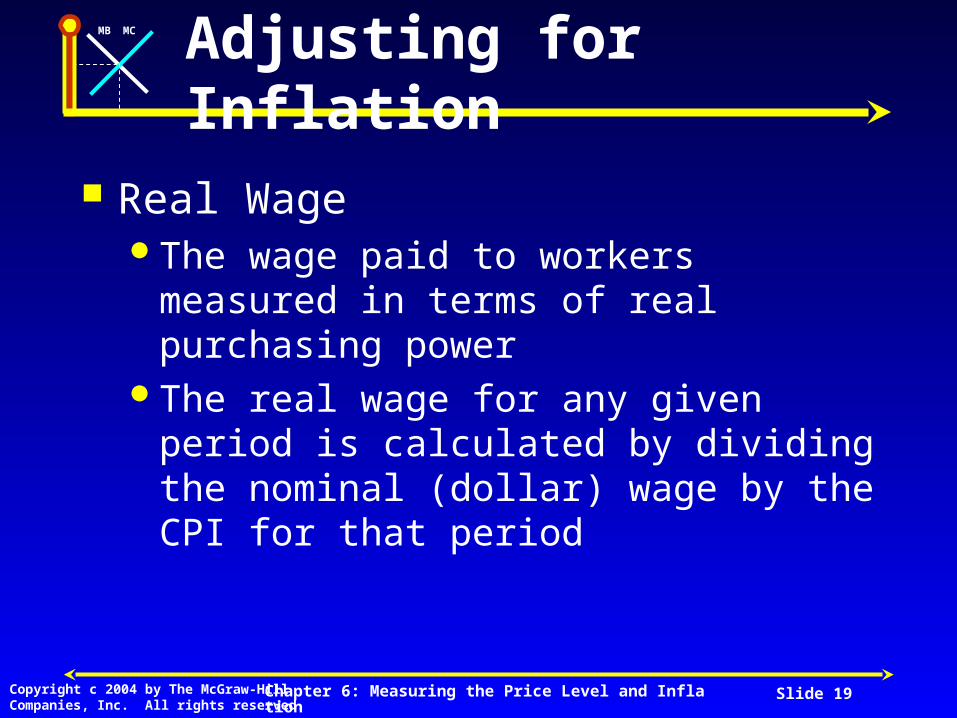
Real WageThe wage paid to workers measured in
terms of real purchasing powerThe real wage for any given period is
calculated by dividing the nominal (dollar) wage by the CPI for that period
Chapter 6: Measuring the Price Level and Inflation Slide 20
MB MC
Copyright c 2004 by The McGraw-HillCompanies, Inc. All rights reserved.
Adjusting for Inflation
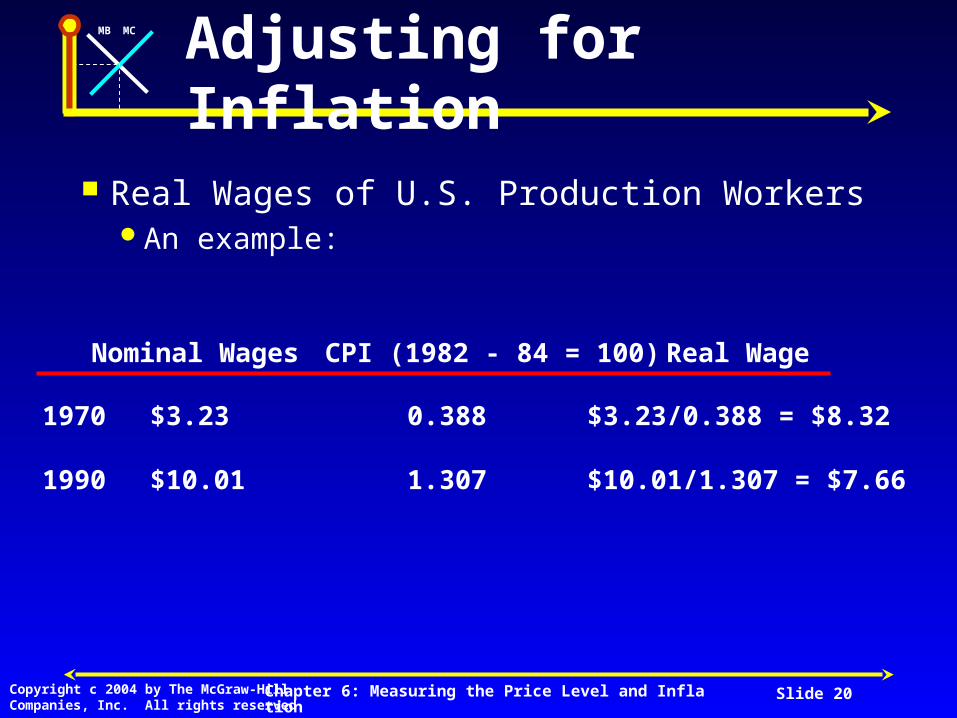
Real Wages of U.S. Production WorkersAn example:
Nominal Wages CPI (1982 - 84 = 100) Real Wage
1970 $3.23 0.388 $3.23/0.388 = $8.32
1990 $10.01 1.307 $10.01/1.307 = $7.66

Chapter 6: Measuring the Price Level and Inflation Slide 21
MB MC
Copyright c 2004 by The McGraw-HillCompanies, Inc. All rights reserved.
Nominal and Real Wages for Production Workers’ 1960 - 2001
Chapter 6: Measuring the Price Level and Inflation Slide 22
MB MC
Copyright c 2004 by The McGraw-HillCompanies, Inc. All rights reserved.
Adjusting for Inflation
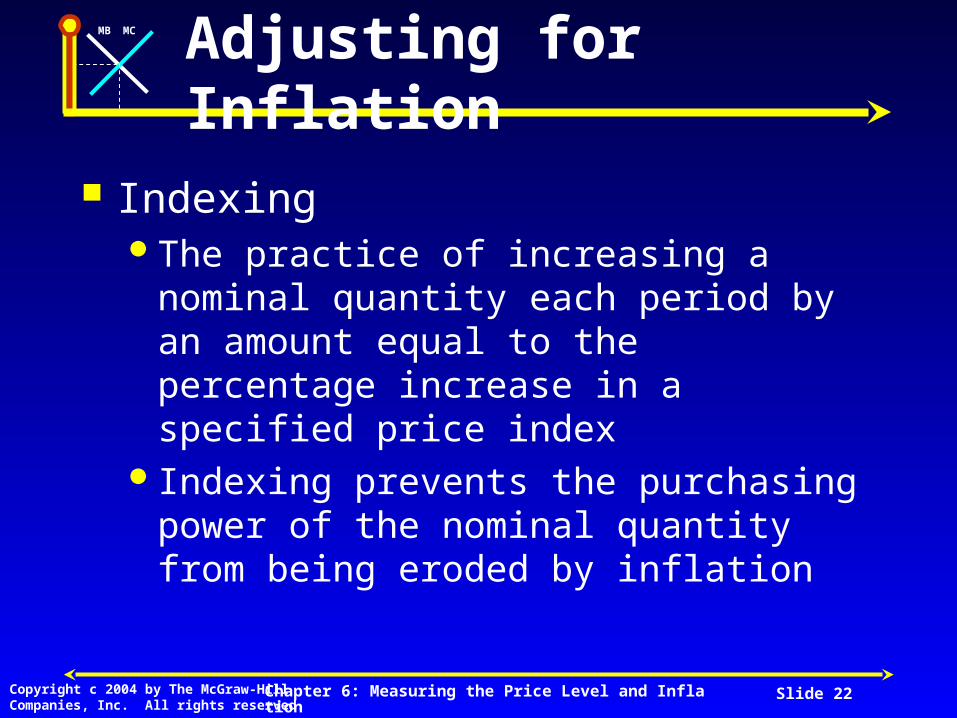
IndexingThe practice of increasing a nominal
quantity each period by an amount equal to the percentage increase in a specified price index
Indexing prevents the purchasing power of the nominal quantity from being eroded by inflation

Chapter 6: Measuring the Price Level and Inflation Slide 23
MB MC
Copyright c 2004 by The McGraw-HillCompanies, Inc. All rights reserved.
Adjusting for Inflation
Indexing to Maintain Buying PowerAn example:
Social Security Payment Inflation
2000 $1,000/month 2000 - 2005 = 20%
2005 $1,200/month indexed to inflation
Chapter 6: Measuring the Price Level and Inflation Slide 24
MB MC
Copyright c 2004 by The McGraw-HillCompanies, Inc. All rights reserved.
Adjusting for Inflation
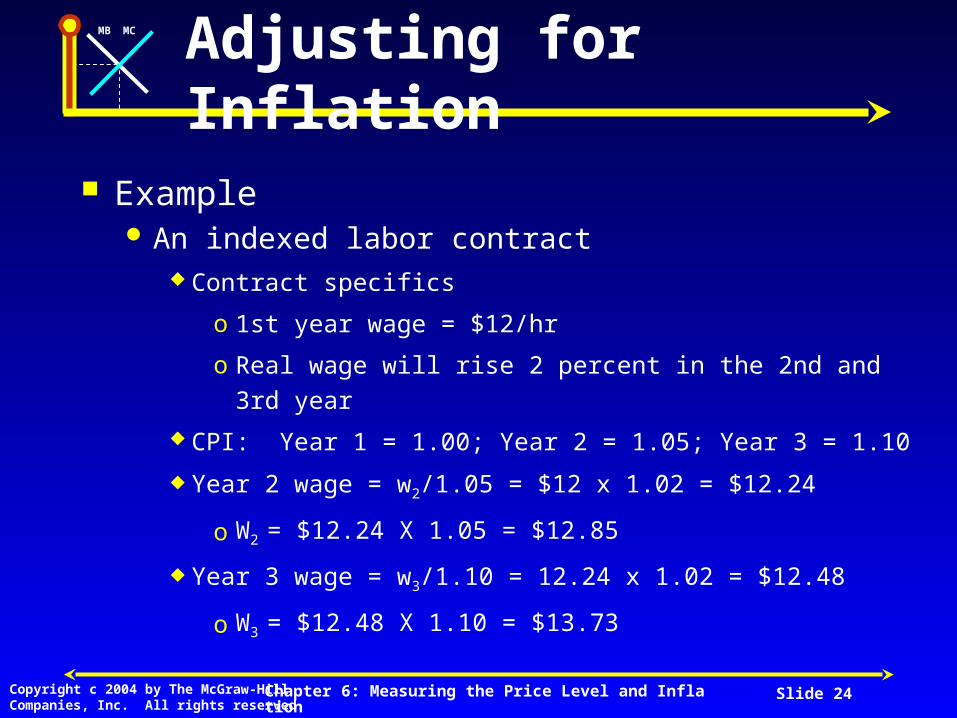
Example An indexed labor contract
Contract specifics
o 1st year wage = $12/hr
o Real wage will rise 2 percent in the 2nd and 3rd year
CPI: Year 1 = 1.00; Year 2 = 1.05; Year 3 = 1.10
Year 2 wage = w2/1.05 = $12 x 1.02 = $12.24
o W2 = $12.24 X 1.05 = $12.85
Year 3 wage = w3/1.10 = 12.24 x 1.02 = $12.48
o W3 = $12.48 X 1.10 = $13.73
Chapter 6: Measuring the Price Level and Inflation Slide 25
MB MC
Copyright c 2004 by The McGraw-HillCompanies, Inc. All rights reserved.
Adjusting for Inflation
Economic NaturalistEvery few years there is a well-publicized
battle in Congress over whether the minimum wage should be raised.
Why do these heated debates recur so regularly?
Chapter 6: Measuring the Price Level and Inflation Slide 26
MB MC
Copyright c 2004 by The McGraw-HillCompanies, Inc. All rights reserved.
Does the CPI Measure“True” Inflation?
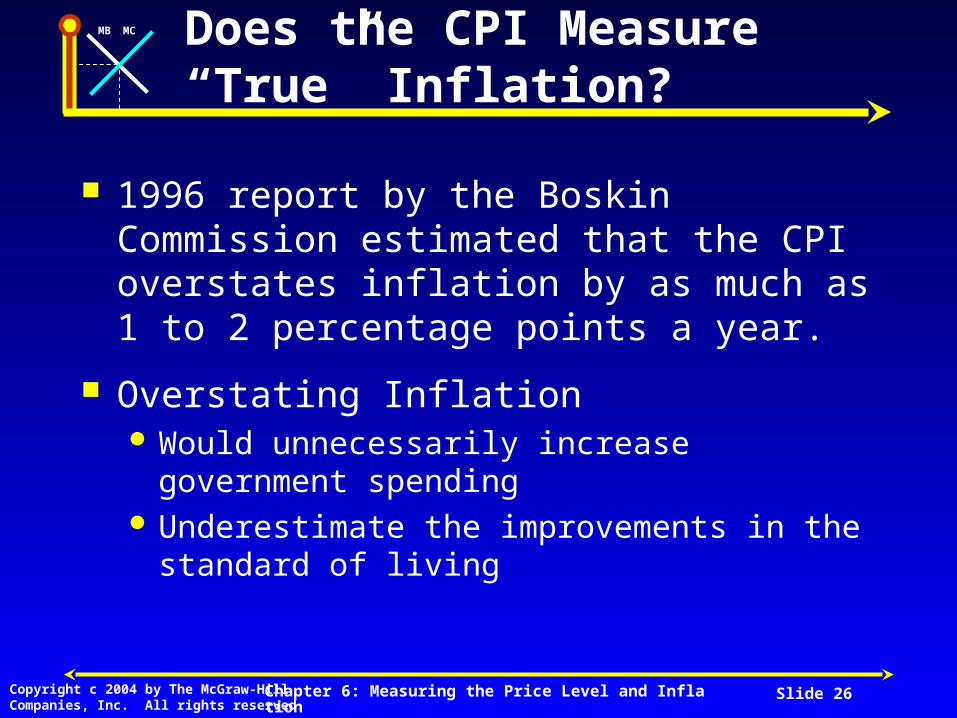
1996 report by the Boskin Commission estimated that the CPI overstates inflation by as much as 1 to 2 percentage points a year.
Overstating Inflation Would unnecessarily increase government
spending Underestimate the improvements in the standard
of living
Chapter 6: Measuring the Price Level and Inflation Slide 27
MB MC
Copyright c 2004 by The McGraw-HillCompanies, Inc. All rights reserved.
Does the CPI Measure“True” Inflation?
Two Causes of the CPI Overestimation of InflationQuality adjustment biasSubstitution bias

Chapter 6: Measuring the Price Level and Inflation Slide 28
MB MC
Copyright c 2004 by The McGraw-HillCompanies, Inc. All rights reserved.
Items Expenditure1995 Prices 2000 Prices
Does the CPI Measure“True” Inflation?
Coffee (50 cups at $1/cup) $50 $2/cup = $100
Tea (50 cups at $1/cup) $50 $1/cup = $50
Scones (100 at $1 each) $100 $1.50/cup = $150
Total $200 $300
Substitution Bias -- An ExampleAssume 1995 CPI basket
Inflation: 1995 - 2000 = $300/$200 = 1.50 or 50%
Chapter 6: Measuring the Price Level and Inflation Slide 29
MB MC
Copyright c 2004 by The McGraw-HillCompanies, Inc. All rights reserved.
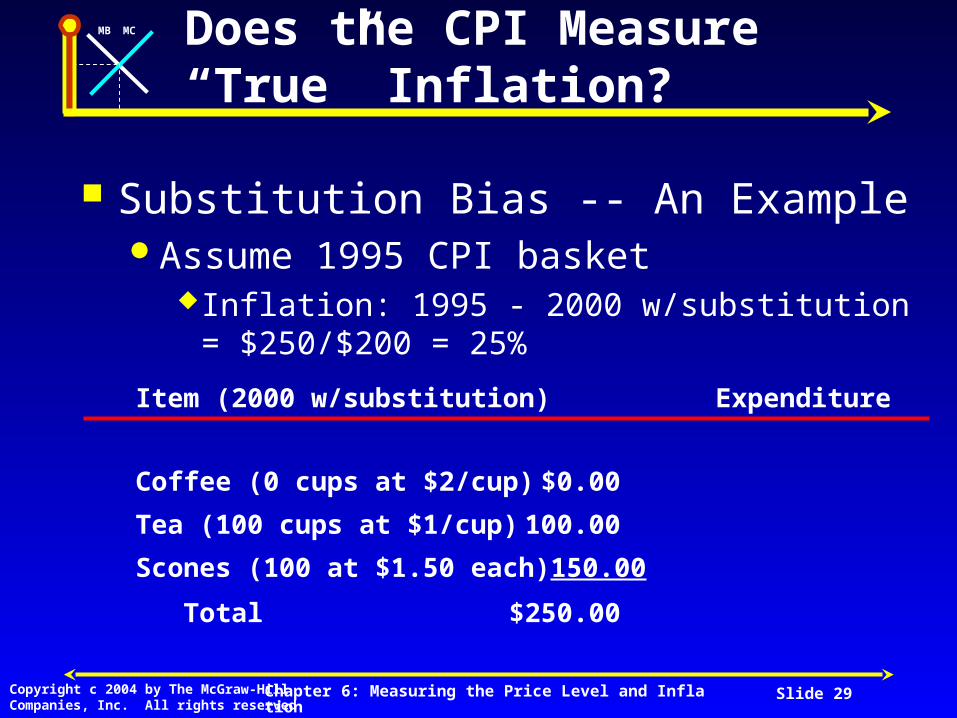
Item (2000 w/substitution) Expenditure
Does the CPI Measure“True” Inflation?
Coffee (0 cups at $2/cup) $0.00
Tea (100 cups at $1/cup) 100.00
Scones (100 at $1.50 each) 150.00
Total $250.00
Substitution Bias -- An ExampleAssume 1995 CPI basket
Inflation: 1995 - 2000 w/substitution = $250/$200 = 25%
Chapter 6: Measuring the Price Level and Inflation Slide 30
MB MC
Copyright c 2004 by The McGraw-HillCompanies, Inc. All rights reserved.
Does the CPI Measure“True” Inflation?
Economic NaturalistWhy is inflation in the health care sector
apparently high?
Chapter 6: Measuring the Price Level and Inflation Slide 31
MB MC
Copyright c 2004 by The McGraw-HillCompanies, Inc. All rights reserved.
The Costs of Inflation:Not What You Think
Price LevelA measure of the overall level of prices at a
particular point in time as measured by a price index such as the CPI
Relative PriceThe price of a specific good or service in
comparison to the prices of other goods and services
Chapter 6: Measuring the Price Level and Inflation Slide 32
MB MC
Copyright c 2004 by The McGraw-HillCompanies, Inc. All rights reserved.
The Costs of Inflation:Not What You Think
ObservationsChanges in relative price do not
necessarily imply a significant amount of inflation.
Inflation can be high without affecting relative prices.
Chapter 6: Measuring the Price Level and Inflation Slide 33
MB MC
Copyright c 2004 by The McGraw-HillCompanies, Inc. All rights reserved.
The Costs of Inflation:Not What You Think
ObservationsTo counteract relative price changes,
government policy would have to affect the market for specific goods.
To counteract inflation, the government must use monetary and fiscal policy.
Chapter 6: Measuring the Price Level and Inflation Slide 34
MB MC
Copyright c 2004 by The McGraw-HillCompanies, Inc. All rights reserved.
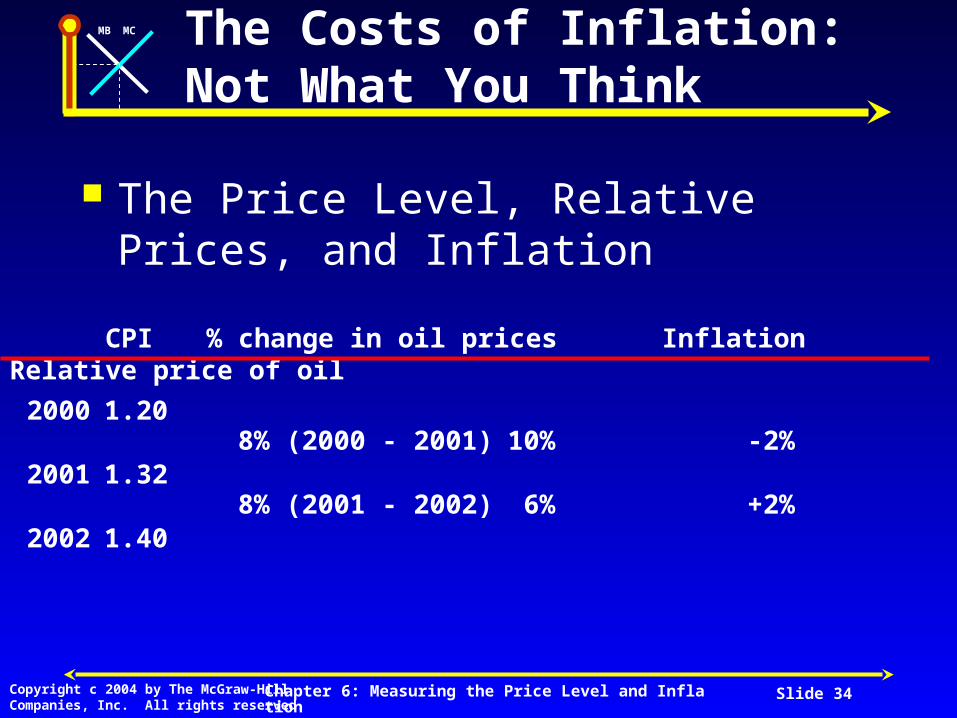
CPI % change in oil prices Inflation Relative price of oil
2000 1.20
2001 1.32
2002 1.40
The Costs of Inflation:Not What You Think
The Price Level, Relative Prices, and Inflation
8% (2000 - 2001) 10% -2%
8% (2001 - 2002) 6% +2%
Chapter 6: Measuring the Price Level and Inflation Slide 35
MB MC
Copyright c 2004 by The McGraw-HillCompanies, Inc. All rights reserved.
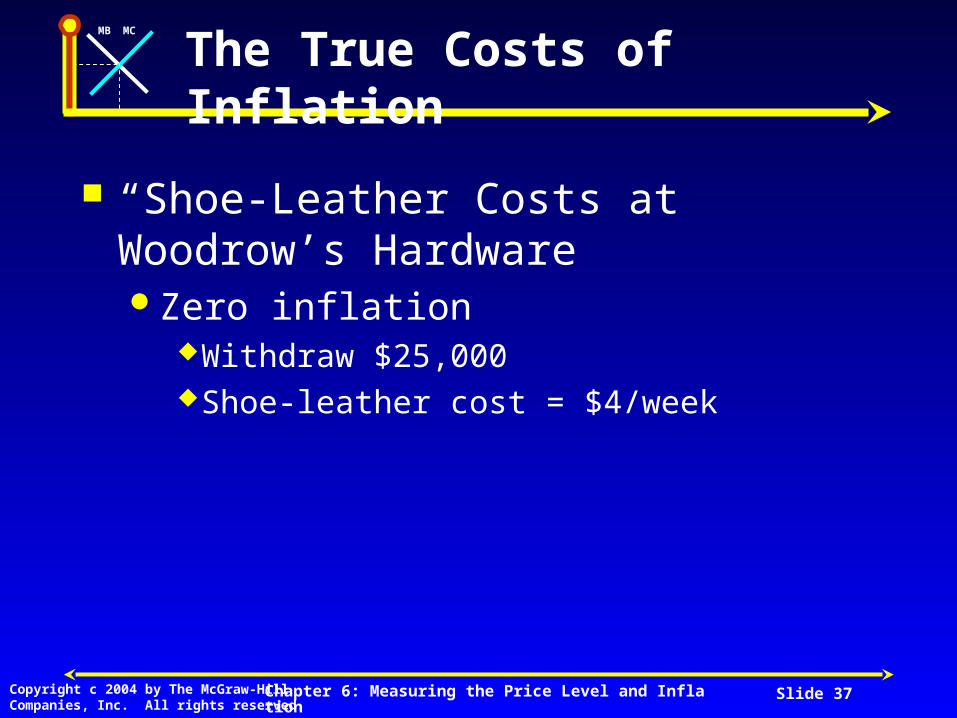
The True Costs of Inflation
“Shoe-Leather” CostsThe use of resources to economize on
holding cash during periods of high inflation

Chapter 6: Measuring the Price Level and Inflation Slide 36
MB MC
Copyright c 2004 by The McGraw-HillCompanies, Inc. All rights reserved.
The True Costs of Inflation
“Shoe-Leather Costs at Woodrow’s HardwareNeed $5,000 cash/dayMay withdraw $25,000 on Monday or
$5,000/dayCost of a withdraw = $4/trip
Chapter 6: Measuring the Price Level and Inflation Slide 37
MB MC
Copyright c 2004 by The McGraw-HillCompanies, Inc. All rights reserved.
The True Costs of Inflation
“Shoe-Leather Costs at Woodrow’s HardwareZero inflation
Withdraw $25,000Shoe-leather cost = $4/week

Chapter 6: Measuring the Price Level and Inflation Slide 38
MB MC
Copyright c 2004 by The McGraw-HillCompanies, Inc. All rights reserved.
The True Costs of Inflation
“Shoe-Leather Costs at Woodrow’s Hardware10% inflation
Withdraws $25,000o Average cash holding/day = $15,000o Cost of holding cash = $15,000 x 10% = $1,500
Chapter 6: Measuring the Price Level and Inflation Slide 39
MB MC
Copyright c 2004 by The McGraw-HillCompanies, Inc. All rights reserved.
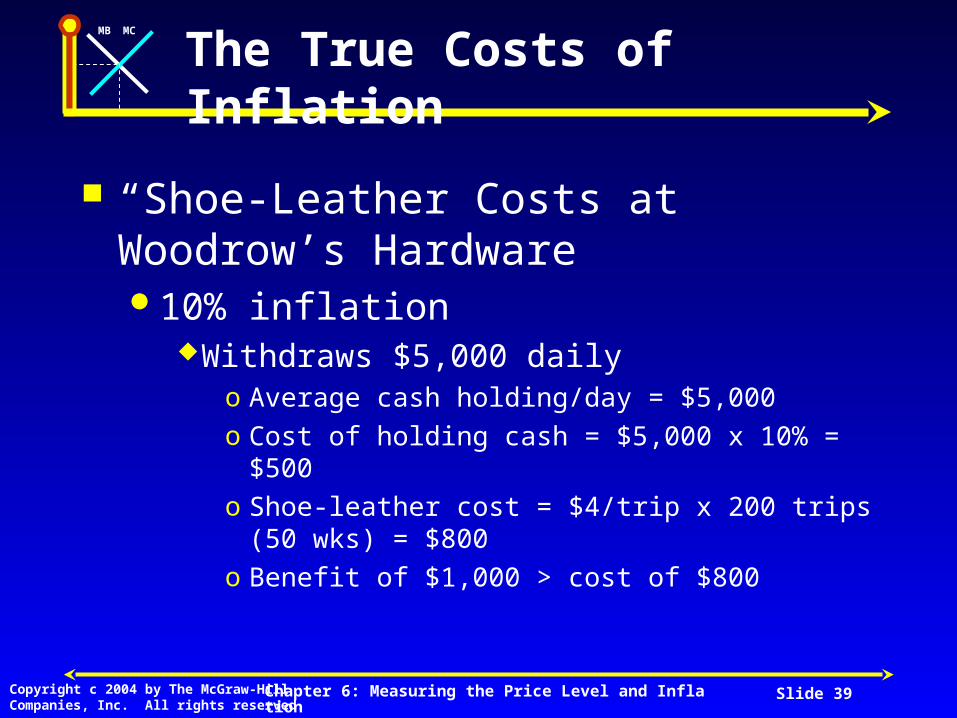
The True Costs of Inflation
“Shoe-Leather Costs at Woodrow’s Hardware10% inflation
Withdraws $5,000 dailyo Average cash holding/day = $5,000o Cost of holding cash = $5,000 x 10% = $500o Shoe-leather cost = $4/trip x 200 trips (50 wks) =
$800o Benefit of $1,000 > cost of $800
Chapter 6: Measuring the Price Level and Inflation Slide 40
MB MC
Copyright c 2004 by The McGraw-HillCompanies, Inc. All rights reserved.
The True Costs of Inflation
“Noise” in the Price SystemInflation obscures the information
transmitted by prices and reduces the efficiency of the market system
Chapter 6: Measuring the Price Level and Inflation Slide 41
MB MC
Copyright c 2004 by The McGraw-HillCompanies, Inc. All rights reserved.
The True Costs of Inflation
Distortions of the Tax SystemInflation, Indexation, and ---
Bracket creepCapital depreciation allowance

Chapter 6: Measuring the Price Level and Inflation Slide 42
MB MC
Copyright c 2004 by The McGraw-HillCompanies, Inc. All rights reserved.
The True Costs of Inflation
ObservationInflation may distort the incentives provided
by the tax system for people to work, save, and invest and reduce economic growth.

Chapter 6: Measuring the Price Level and Inflation Slide 43
MB MC
Copyright c 2004 by The McGraw-HillCompanies, Inc. All rights reserved.
The True Costs of Inflation
Unexpected Redistribution of WealthFrom workers to employers if wages are
not indexed to inflationFrom lenders to borrowers
Chapter 6: Measuring the Price Level and Inflation Slide 44
MB MC
Copyright c 2004 by The McGraw-HillCompanies, Inc. All rights reserved.
The True Costs of Inflation
Interference with Long-Run PlanningRetirement planningInvestment and business strategies
Chapter 6: Measuring the Price Level and Inflation Slide 45
MB MC
Copyright c 2004 by The McGraw-HillCompanies, Inc. All rights reserved.
Hyperinflation
Economic NaturalistHow costly is high inflation?
Chapter 6: Measuring the Price Level and Inflation Slide 46
MB MC
Copyright c 2004 by The McGraw-HillCompanies, Inc. All rights reserved.
Hyperinflation
Economic NaturalistFischer, Sahay, and Vegh examined 133
market economies 1960 - 9645 episodes of high inflation (100% +) in 25
countrieso Real GDP/person fell by an average of 1.6%/yro Real consumption/ person fell by an average of
1.3%/yro Real investment/person fell by an average of 3.3%/yr
Chapter 6: Measuring the Price Level and Inflation Slide 47
MB MC
Copyright c 2004 by The McGraw-HillCompanies, Inc. All rights reserved.
Inflation and Interest Rates
Nominal Interest Rate (market interest rate)The annual percentage increase in the
nominal value of a financial asset
Chapter 6: Measuring the Price Level and Inflation Slide 48
MB MC
Copyright c 2004 by The McGraw-HillCompanies, Inc. All rights reserved.
Inflation and Interest Rates
Real Interest RateThe annual percentage increase in the
purchasing power of a financial assetThe real interest rate on any asset equals
the nominal interest rate on that asset minus the inflation rate
Chapter 6: Measuring the Price Level and Inflation Slide 49
MB MC
Copyright c 2004 by The McGraw-HillCompanies, Inc. All rights reserved.
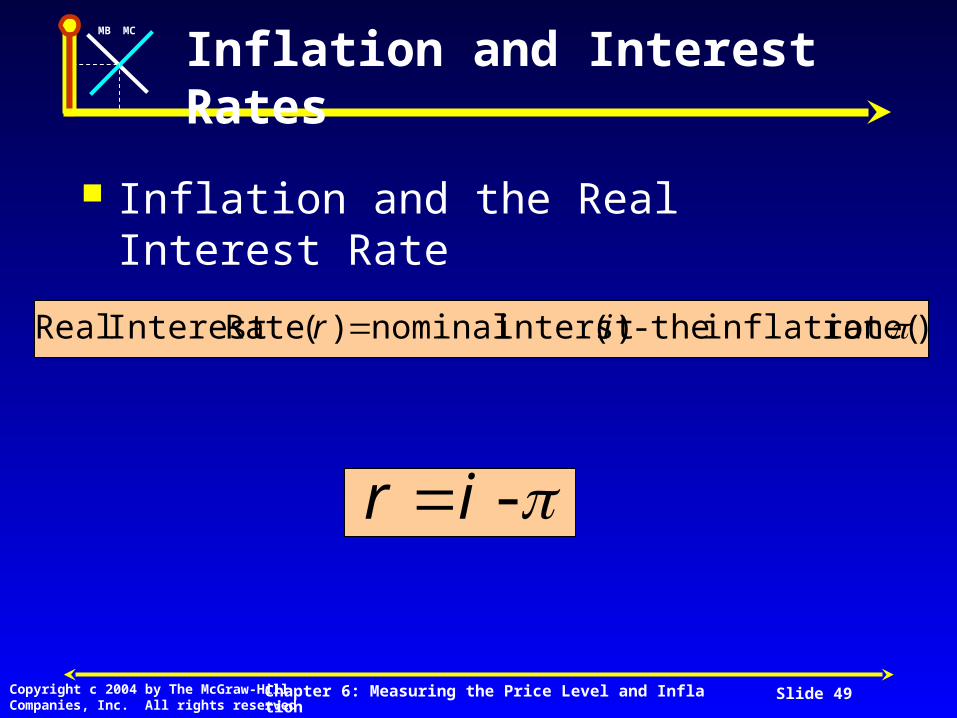
Inflation and Interest Rates
Inflation and the Real Interest Rate
)rate( inflation the - )( interst nominal )( Rate Interest Real ir
- ir

Chapter 6: Measuring the Price Level and Inflation Slide 50
MB MC
Copyright c 2004 by The McGraw-HillCompanies, Inc. All rights reserved.
Inflation and Interest Rates
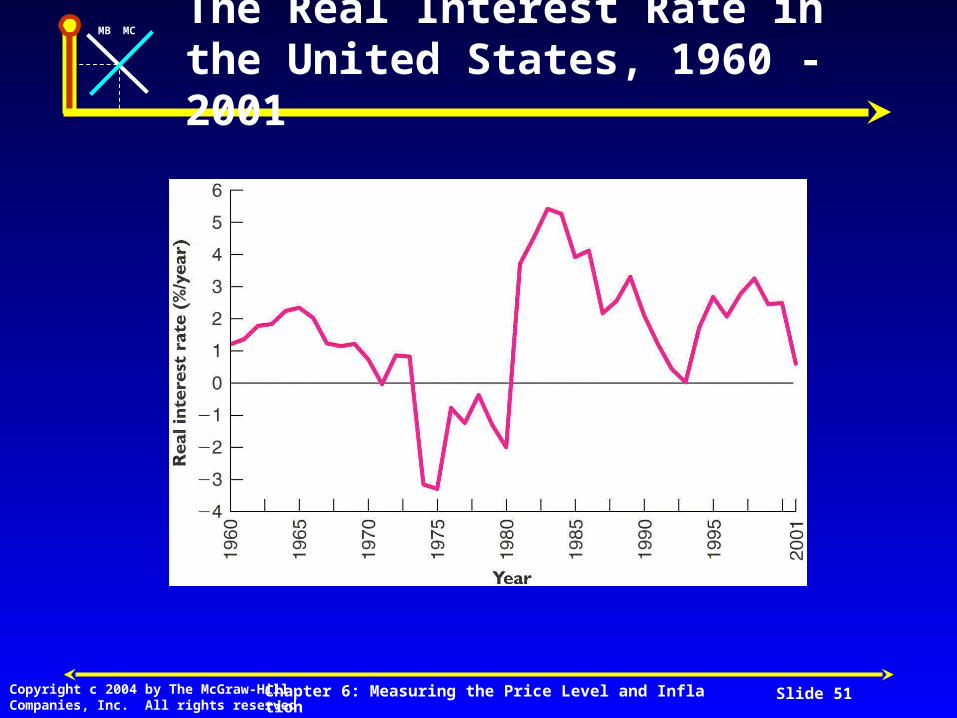
Year Real Interest = Nominal Interest - Inflation
1970 0.80 6.5 5.7
1975 -3.3 5.8 9.1
1980 -2.0 11.5 13.5
1985 3.9 7.5 3.6
1990 2.1 7.5 5.4
1995 2.7 5.5 2.8
2000 2.2 4.7 2.5
Chapter 6: Measuring the Price Level and Inflation Slide 51
MB MC
Copyright c 2004 by The McGraw-HillCompanies, Inc. All rights reserved.
The Real Interest Rate in the United States, 1960 - 2001
Chapter 6: Measuring the Price Level and Inflation Slide 52
MB MC
Copyright c 2004 by The McGraw-HillCompanies, Inc. All rights reserved.
Inflation and Interest Rates
ObservationsUnexpected inflation will benefit borrowers
and hurt lendersExpected inflation may not hurt lenders if
they can adjust the nominal interest rates

Chapter 6: Measuring the Price Level and Inflation Slide 53
MB MC
Copyright c 2004 by The McGraw-HillCompanies, Inc. All rights reserved.
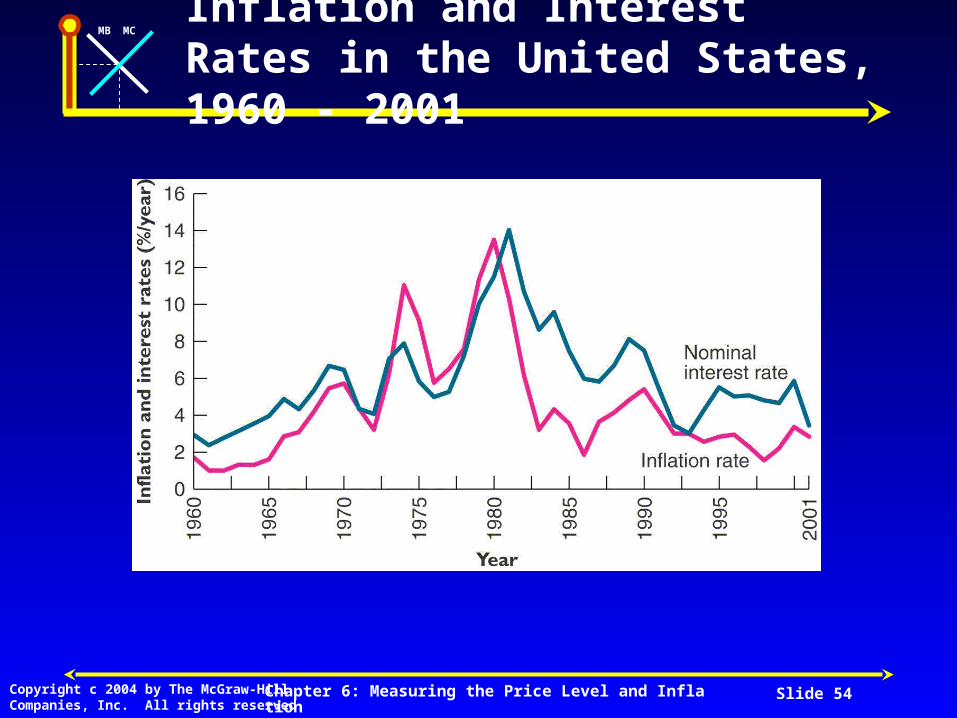
Inflation and Interest Rates
Fisher-EffectThe tendency for nominal interest rates to
be high when inflation is high and low when inflation is low
Chapter 6: Measuring the Price Level and Inflation Slide 54
MB MC
Copyright c 2004 by The McGraw-HillCompanies, Inc. All rights reserved.
Inflation and Interest Rates in the United States, 1960 - 2001
MB MC
End ofChapterEnd of
Chapter