May 2016 - EPOC
76
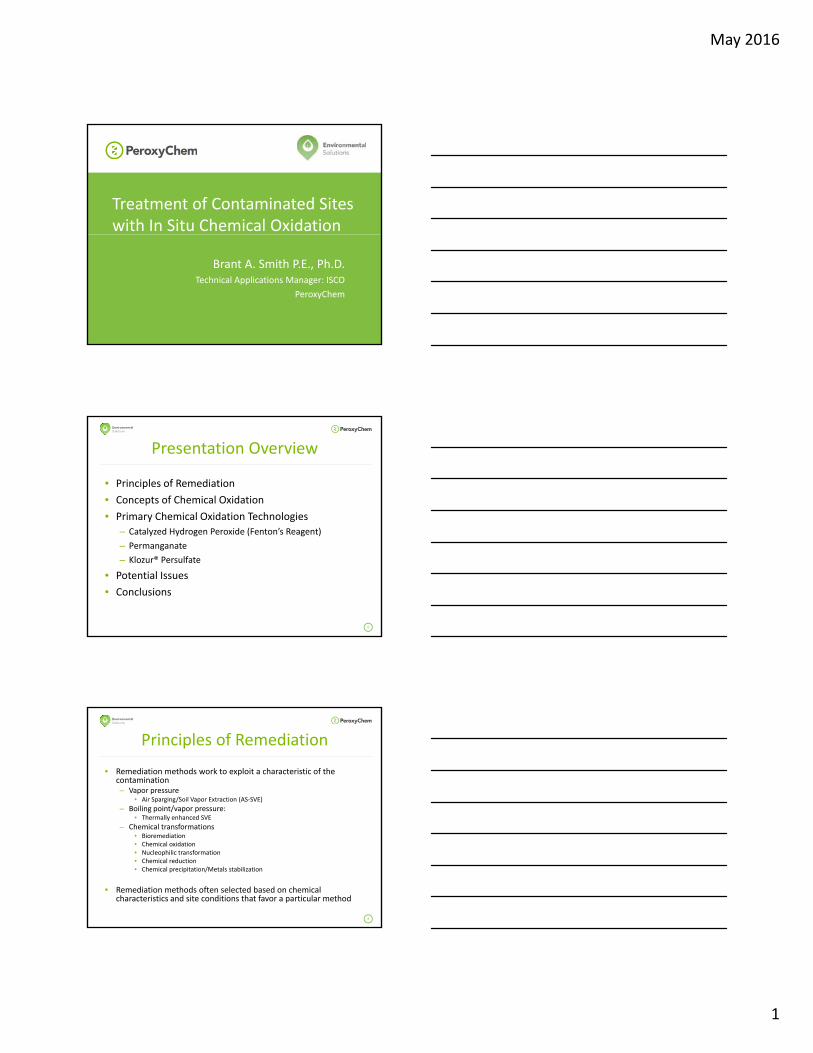
May 2016 1 Treatment of Contaminated Sites with In Situ Chemical Oxidation Brant A. Smith P.E., Ph.D. Technical Applications Manager: ISCO PeroxyChem Presentation Overview • Principles of Remediation • Concepts of Chemical Oxidation • Primary Chemical Oxidation Technologies 2 – Catalyzed Hydrogen Peroxide (Fenton’s Reagent) – Permanganate – Klozur® Persulfate • Potential Issues • Conclusions Principles of Remediation • Remediation methods work to exploit a characteristic of the contamination – Vapor pressure • Air Sparging/Soil Vapor Extraction (AS‐SVE) – Boiling point/vapor pressure: • Thermally enhanced SVE 3 • Thermally enhanced SVE – Chemical transformations • Bioremediation • Chemical oxidation • Nucleophilic transformation • Chemical reduction • Chemical precipitation/Metals stabilization • Remediation methods often selected based on chemical characteristics and site conditions that favor a particular method
Transcript of May 2016 - EPOC
May 2016
1
Treatment of Contaminated Sites with In Situ Chemical Oxidation
Brant A. Smith P.E., Ph.D.Technical Applications Manager: ISCO
PeroxyChem
Presentation Overview
• Principles of Remediation
• Concepts of Chemical Oxidation
• Primary Chemical Oxidation Technologies
2
– Catalyzed Hydrogen Peroxide (Fenton’s Reagent)
– Permanganate
– Klozur® Persulfate
• Potential Issues
• Conclusions
Principles of Remediation
• Remediation methods work to exploit a characteristic of the contamination– Vapor pressure
• Air Sparging/Soil Vapor Extraction (AS‐SVE)
– Boiling point/vapor pressure: • Thermally enhanced SVE
3
• Thermally enhanced SVE
– Chemical transformations• Bioremediation• Chemical oxidation• Nucleophilic transformation• Chemical reduction• Chemical precipitation/Metals stabilization
• Remediation methods often selected based on chemical characteristics and site conditions that favor a particular method

May 2016
2
Reaction Pathways
• Oxidative
– Electrons are taken from contaminants CO2
• Reductive
4
– Electrons are donated to the contaminants CH4
• Nucleophilic
– Substitution reaction (electron neutral)
IN SITU CHEMICAL OXIDATION: OVERVIEW
What is ISCO
• In Situ Chemical Oxidation (ISCO)– Transform/degrade contamination in
place in the subsurface
Massive supply of thermodynamically powerful electron acceptors
6
• Addition of chemicals that take electrons from, or oxidizing, contaminants of concern (COCs)
• Reductive (electron donating) and nucleophilic pathways are also present with certain technologies– Allows for treatment of multiple types of contaminants
– Technology and activation method specific
May 2016
3
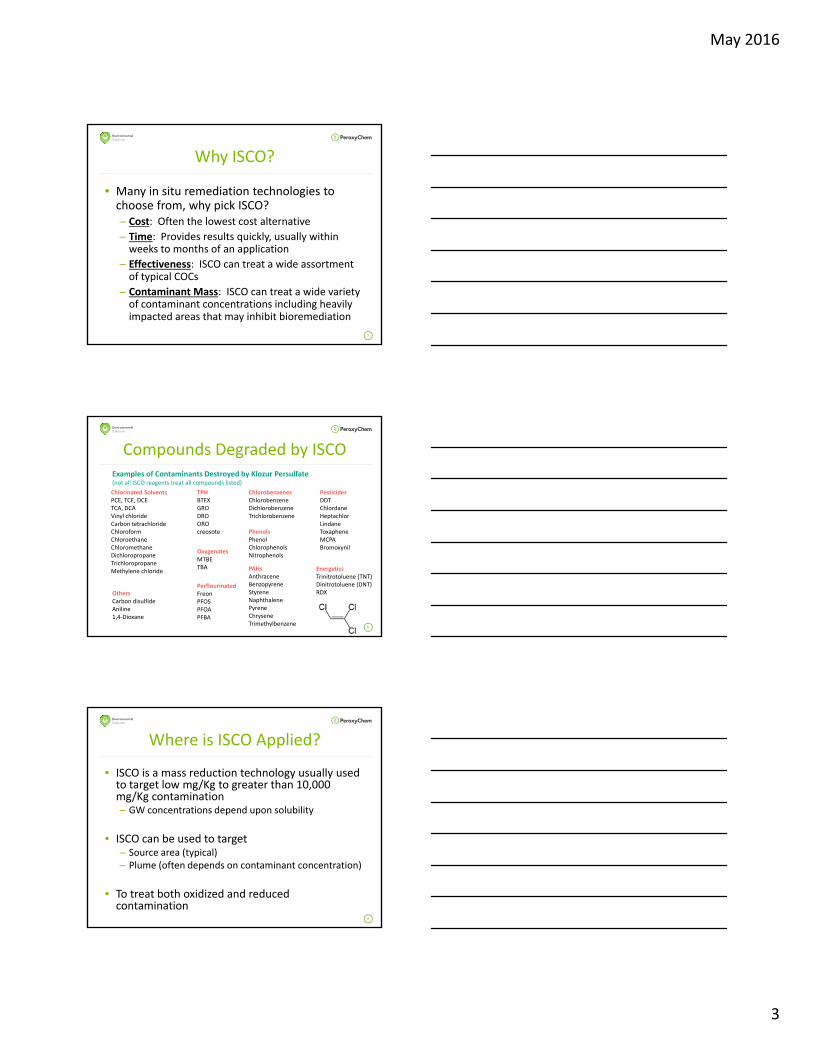
Why ISCO?
• Many in situ remediation technologies to choose from, why pick ISCO?– Cost: Often the lowest cost alternative
Time P id lt i kl ll ithi
7
– Time: Provides results quickly, usually within weeks to months of an application
– Effectiveness: ISCO can treat a wide assortment of typical COCs
– Contaminant Mass: ISCO can treat a wide variety of contaminant concentrations including heavily impacted areas that may inhibit bioremediation
Compounds Degraded by ISCO
Chlorinated SolventsPCE, TCE, DCETCA, DCAVinyl chlorideCarbon tetrachloride
TPHBTEXGRODROORO
ChlorobenzenesChlorobenzeneDichlorobenzeneTrichlorobenzene
PesticidesDDTChlordaneHeptachlorLindane
Examples of Contaminants Destroyed by Klozur Persulfate (not all ISCO reagents treat all compounds listed)
8
ChloroformChloroethaneChloromethaneDichloropropaneTrichloropropaneMethylene chloride
creosote
OxygenatesMTBETBA
PhenolsPhenolChlorophenolsNitrophenols
PerflourinatedFreonPFOSPFOAPFBA
ToxapheneMCPABromoxynil
PAHsAnthraceneBenzopyreneStyreneNaphthalenePyreneChryseneTrimethylbenzene
OthersCarbon disulfideAniline1,4‐Dioxane
EnergeticsTrinitrotoluene (TNT) Dinitrotoluene (DNT)RDX
Where is ISCO Applied?
• ISCO is a mass reduction technology usually used to target low mg/Kg to greater than 10,000 mg/Kg contamination– GW concentrations depend upon solubility
9
• ISCO can be used to target– Source area (typical)– Plume (often depends on contaminant concentration)
• To treat both oxidized and reduced contamination

May 2016
4
Key to Success for Field Applications
• Reactions are known to take place on the laboratory scale
– 100% contact between ISCO and contamination
10
ISCO works by establishing contact between a sufficient mass of activated oxidant with the contaminant mass in the subsurface
ISCO works by establishing contact between a sufficient mass of activated oxidant with the contaminant mass in the subsurface
Field Applications
Sufficient Mass of Oxidant
1. Target demand1. Contaminant type and mass
2. Non‐target demand
Establishing Contact
• Site Geology
• Contaminant distribution
• Reagent distribution
11
3. Uncertainties and variability1. Target Demand
2. Non‐target demand
3. Contaminant distribution
• Remedial goals
• Reagent distribution
• Injection network
• Injection strategy
• Injection volume
• Contact time
• Groundwater velocity
Progression to a Field Application
Typical Path
• Path
– Bench scale tests
– Design Optimization (Pilot
Bench Scale Tests
• Evaluate potential interactions between the site geochemistry and the ISCO process chemistry
12
scale tests)
– Full scale applications
– Achievement of goals or transition to another technology as part of a treatment train approach
ISCO process chemistry
• Objectives include:– Developing design
parameters
– Confirm treatment efficacy
– Satisfy regulatory concerns
• Specific tests will vary for each ISCO technology

May 2016
5
Design Optimization (Pilot Scale Test)
• Target Area– Typically a subset of the full
scale area – For a small area, may be the
first application in the entire area
• Critical Field Parameters– Treatment efficacy– Injection rate– Injection pressure– Distribution of reagents
• Active oxidant
13
area
• Objective– Older Objective: Proof of
concept for new and emerging technologies
– Current Objective: Confirming site specific performance and design parameters
• Active oxidant• Inactive oxidant
– Potential issues
• Monitoring program– Typically more extensive than
full scale– Intended to monitor
treatment efficacy and field parameters
Full Scale Applications
Full Scale Application
• Objective
– Progress toward remedial goals
Expectations
• Is 99 percent reduction a success?
• Mass reduction– Will depend upon
14
• Monitoring Program
– Monitor progress toward remedial goals
– Monitor effect of each ISCO application
• Mass reduction not always represented by groundwater concentrations
• Dosage/ability to contact contamination
• Initial concentrations
• Typically 80 to 99 percent per successful application
• Multiple applications and, potentially, multiple technologies are typically necessary for greater than 1 to 2 order of magnitude reductions
Combined Remedies/Treatment Train
• ISCO can be used as a mass reduction technology and be followed by:– Monitored natural attenuation– In situ bioremediation– In situ biogeochemical remediation
• ISCO used following:Thermal technologies
15
– Thermal technologies– Surfactant/solvent enhanced extraction– Extraction systems (dual phase extraction)
• Treatment train approach works to maximize the strengths of different technologies to reflect the changing site situation– ISCO: Mass reduction (fast acting, large quantities of oxidant in injection
solution) when contact can be established– ISB/ISCR/etc: Persistence
• 6 months to 1 year following ISCO

May 2016
6
Monitoring Programs
• Critical aspect to ISCO design
• Objectives– Progress toward remedial goals– Assessing effectiveness of ISCO
application
• Frequency– Allow time:
• ISCO to react• Groundwater, soil and NAPL re‐
equilibrate• Can have biotic activity following ISCO
– Minimum 2‐3 months post application recommended
16
• Monitoring Phase– Soil and groundwater typical– Phase monitored may be different for
each objective– Progress of ISCO best measured by
total mass reduced (GW mass plus Soil mass)
• Soil– Discrete/grab– Composite
application recommended– Multiple monitoring events
recommended
• Parameters– Contaminant– Residual oxidant– Geochemical parameters
• DO, temperature, conductivity, pH, ORP
– Others, as needed
IN SITU CHEMICAL OXIDATION:TECHNOLOGIES
MGP Site in Illinois
• Contaminant:
– ~17,000 mg/Kg TPH
– ~45,000 g/L Benzene– ~140 g/L Naphthalene
di l l
• Results:
– Less than 2,500 mg/Kg TPH
– Benzene in groundwater reduced by greater than 98 percent
18
• Remedial goals:– TPH to less than 9,000 mg/Kg
– Reduce benzene in groundwater by greater than 90 percent
• Applied 46,200 lbs of AAP to site over 3 applications
– 32 g Klozur per Kg soil
percent
– State of Illinois issue a No Further Action letter
Courtesy of XDD, LLC

May 2016
7
Active Industrial Site
• PCE, 1,1,1‐TCA, and 1,4‐dioxane (DNAPL source)
• AAP does not produce gas during treatment
h
Contaminants
Average Contaminant Concentrations (g/L)
BaselinePost 1st
ApplicationPost 2nd
Application
Total Percent
Reduction
PCE 11,987 4,819 113 99.1
1,1,1‐TCA 8,736 5,698 64 99.3
19
• Treated with two applications totaling 31,000 Kg Klozur®– 25 g Klozur per Kg soil
• Remedial goal of less than 1 mg/L for each contaminant
1,4‐Dioxane 410 1,029 165 59.8
Courtesy of XDD, LLC
Primary ISCO Oxidants
• Hydrogen Peroxide (aka Fenton’s reagent, catalyzed hydrogen peroxide)
• Permanganate
20
Permanganate
• Persulfate (activated)– Alkaline
– Iron
– Heat
– Hydrogen Peroxide
Hydrogen Peroxide (Fenton’s Reagent)
• Hydrogen Peroxide is catalyzed by transition metals to form the hydroxyl radical
Fe2+ + H2O2 Fe3+ + OH. + OH‐
OH + H2O2 HO2 + OH‐ + H+
21
Fe3+ + H2O2 Fe2+ + HO2 + H+
HO2 O2‐ + H+ (pKa 4.8)
Fe3+ + O2‐ Fe2+ + O2
• Forms: – Hydroxyl radical: Powerful oxidant (2.6 V) – Superoxide radical: Reductant (‐0.33 V) and nucleophile– Hydroperoxide: Nucleophile

May 2016
8
Hydrogen Peroxide: Key Characteristics
• Characteristics– Capable of degrading most types of contamination– Relatively inexpensive– Forms oxidants, reductants, and nucleophiles– Decomposes to water and oxygen
22
• Common Issues– Sensitive to subsurface conditions (can decompose in minutes or persist for days)
• If an issue, can impede successful distribution• Stabilization agents
– Gas and heat evolution– Hydroxyl radical can be scavenged by naturally occurring carbonates
Hydrogen Peroxide: Bench Tests
• Acid buffering capacity of soils– Look for presence of carbonates (pKa 6.1)
• Stability (half life) in presence of site soils– Stabilized
23
– Unstabilized– Activated
• Gas and heat evolution• Treatment efficacy• Degradation ratio
– Mass oxidant consumed per mass of contaminant degraded
Permanganate
• Sodium or potassium permanganate
KMnO4 or NaMnO4 MnO4‐
MnO4‐MnO2 (s)
24
4 2 ( )
• Dark purple at >0.5 g/L and pink even at 1 mg/L• Permanganate has a redox potential of 1.7 V• Primarily used for chloroethenes (TCE and PCE)

May 2016
9
Permanganate Characteristics
• Characteristics and Common Issues– Direct oxidative pathway
– Reactive with:• Chlorinated ethenes (TCE, PCE, etc), some PAHs, etc
25
• Little to no reaction with many other compounds (chloromethanes, chloroethanes, benzene, MTBE, etc)
– Kinetically aggressive reactions
– Field solubility:• Potassium permanganate ~30 g/L
• Sodium permanganate >400 g/L (typical application < 200 g/L)
– Very stable, can persist for months to years, if oxidant demand is met
Permanganate Reactivity
100
1000
10,000
100,000
1,000,000
f L
ife,
hr
1 Day
1 Month
1 YearMTBE 1, 4-Dioxane
Toluene
m-XyleneEthylbenzen
Benzene
26
0.000001
0.00001
0.0001
0.001
0.01
0.1
1
10
1 10 100 1000 10,000 100,000
Co
nta
min
ant
Hal
f
KMnO4 Concentration at Contact Point, ppm
1 Day
1 Hour
TCE
PCE
p-Cresol
nzene
1 Min.
1 Sec.
Aldicarb
Dichlorvos2,3-Dichlorophenol
Klozur® Persulfate is:• Based on the sodium persulfate molecule
• A strong oxidant used for the destruction of contaminants in soil and groundwater
Activated Klozur® Persulfate
27
• Aggressive and fast acting chemistry with extended subsurface lifetime (weeks to months) and little to no heat or gas evolution
• Applicable across a broad range of organic contaminants
•Highly soluble in water (significant oxidant mass is smaller volumes)
Field solubility of more than 500 g/L
possible
May 2016
10
Why Activate?
Persulfate Anion
• Relatively stable
• Kinetically slow– Persistence of weeks to
Radicals
• Kinetically aggressive
• Oxidative, reductive and nucleophilic pathways
28
Persistence of weeks to months
– May not be kinetically aggressive with targeted contaminants
• Oxidative pathway – May not react with all
contaminants
p p y– Reacts with wide assortment
of common contaminants of concern:
– Oxidants more powerful than persulfate anion
Radical Formation
• Common activation methods include:– Alkaline activation
• (OH, SO4‐, O2‐)
– Nascent iron iron or iron
OxidantStandard Reduction Potential (V)
Reference
Hydroxyl radical (OH) 2.59 Siegrist et al.
Sulfate radical (SO4‐) 2.43 Siegrist et al.
Ozone 2.07 Siegrist et al.
Persulfate anion 2.01 Siegrist et al.
29
Nascent iron, iron or iron chelate activation
• (SO4‐)
– Heat activation • (Temperature dependent: OH, SO4‐, O2‐)
– Hydrogen peroxide activation
• (OH, SO4‐, O2‐)
Hydrogen Peroxide 1.78 Siegrist et al.
Permanganate 1.68 Siegrist et al.
Chlorine (HOCl) 1.48 CRC (76th Ed)
Oxygen 1.23 CRC (76th Ed)
Oxygen 0.82 Eweis (1998)
Fe (III) reduction 0.77 CRC (76th Ed)
Nitrate reduction 0.36 Eweis (1998)
Sulfate reduction ‐0.22 Eweis (1998)
Superoxide (O2‐) ‐0.33 Siegrist et al.
ZVI ‐0.45 CRC (76th Ed)
Compounds Degraded by Klozur Persulfate
Chlorinated SolventsPCE, TCE, DCETCA, DCAVinyl chlorideCarbon tetrachloride
TPHBTEXGRODROORO
ChlorobenzenesChlorobenzeneDichlorobenzeneTrichlorobenzene
PesticidesDDTChlordaneHeptachlorLindane
Examples of Contaminants Destroyed by Klozur Persulfate
30
ChloroformChloroethaneChloromethaneDichloropropaneTrichloropropaneMethylene chloride
creosote
OxygenatesMTBETBA
PhenolsPhenolChlorophenolsNitrophenols
PerflourinatedFreonPFOSPFOAPFBA
ToxapheneMCPABromoxynil
PAHsAnthraceneBenzopyreneStyreneNaphthalenePyreneChrysenetrimethylbenzene
OthersCarbon disulfideAniline1,4‐Dioxane
EnergeticsTrinitrotoluene (TNT) Dinitrotoluene (DNT)RDX

May 2016
11
Activated Persulfate
• Key Design Characteristics– Dosing persulfate in excess of contaminant and non‐target
demand– Accounting for site uncertainties (safety factor)– Radicals and reaction pathways formed depend upon activation
method
31
method• Depending upon activation method, can react with most common contaminants of concern
– Highly soluble• Field > 500 g/L• Injection concentration of 200 g/L or more
– High stability in the subsurface (weeks to months) if oxidant demand is met
• Slow reaction with water
– Acid formation during decomposition• If needed, can be neutralized (alkaline activated persulfate)
Persulfate: Bench Scale Tests
• Key Bench Scale Tests:
– Base buffering capacity ‐pH > 10.5‐Alkaline activation only
32
– Non target demand
– Treatment efficacy
– Degradation ratio
General Oxidant Niches• Permanganate
– Mostly chlorinated ethenes– Cost effective injection concentrations and number of applications– 10‐30 g/L potassium permanganate– High concentrations of sodium permanganate at small sites
H d id
33
• Hydrogen peroxide– Most contaminants– Suitable soils (persistence/gas evolution)– 4‐10 percent stabilized hydrogen peroxide
• Activated persulfate– Applicable at most sites– Most contaminants and masses– 50‐250 g/L Klozur Persulfate– Activator pulsed or inline injected
At this time, the distribution issues due to the stability of hydrogen peroxide has severely limited its wide scale use.
May 2016
12
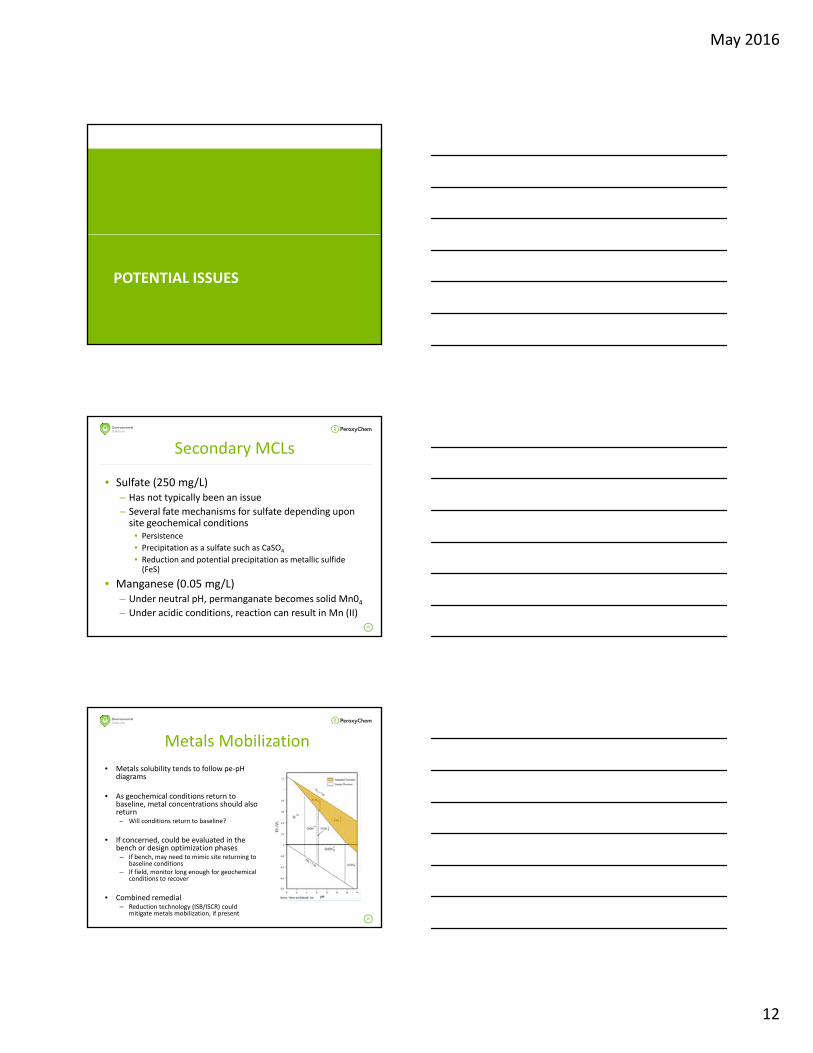
POTENTIAL ISSUES
Secondary MCLs
• Sulfate (250 mg/L)– Has not typically been an issue
– Several fate mechanisms for sulfate depending upon site geochemical conditions
35
site geochemical conditions• Persistence
• Precipitation as a sulfate such as CaSO4
• Reduction and potential precipitation as metallic sulfide (FeS)
• Manganese (0.05 mg/L)– Under neutral pH, permanganate becomes solid Mn04– Under acidic conditions, reaction can result in Mn (II)
Metals Mobilization
• Metals solubility tends to follow pe‐pH diagrams
• As geochemical conditions return to baseline, metal concentrations should also return
36
– Will conditions return to baseline?
• If concerned, could be evaluated in the bench or design optimization phases– If bench, may need to mimic site returning to
baseline conditions– If field, monitor long enough for geochemical
conditions to recover
• Combined remedial– Reduction technology (ISB/ISCR) could
mitigate metals mobilization, if present
May 2016
13
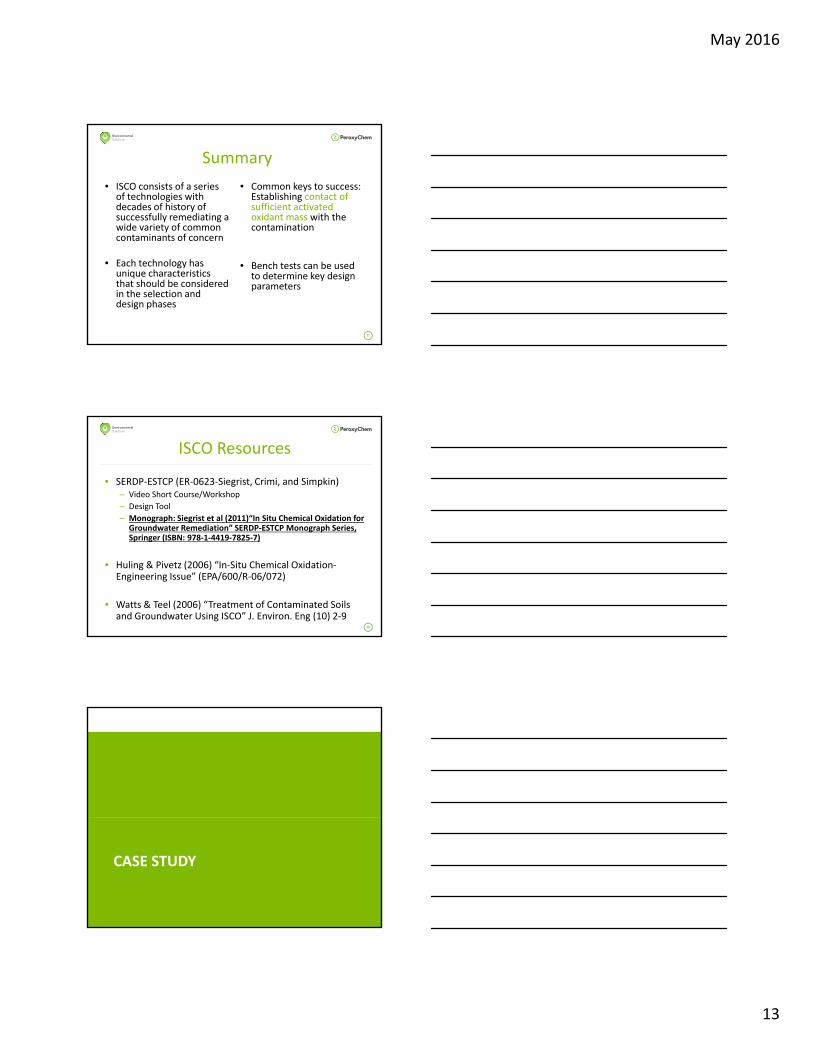
Summary
• ISCO consists of a series of technologies with decades of history of successfully remediating a wide variety of common
i f
• Common keys to success: Establishing contact of sufficient activated oxidant mass with the contamination
37
contaminants of concern
• Each technology has unique characteristics that should be considered in the selection and design phases
• Bench tests can be used to determine key design parameters
ISCO Resources
• SERDP‐ESTCP (ER‐0623‐Siegrist, Crimi, and Simpkin)– Video Short Course/Workshop
– Design Tool
– Monograph: Siegrist et al (2011)“In Situ Chemical Oxidation for G d t R di ti ” SERDP ESTCP M h S i
38
Groundwater Remediation” SERDP‐ESTCP Monograph Series, Springer (ISBN: 978‐1‐4419‐7825‐7)
• Huling & Pivetz (2006) “In‐Situ Chemical Oxidation‐Engineering Issue” (EPA/600/R‐06/072)
• Watts & Teel (2006) “Treatment of Contaminated Soils and Groundwater Using ISCO” J. Environ. Eng (10) 2‐9
CASE STUDY

May 2016
14
Background
• Located in the Chelsea neighborhood of New York City.
• Site uses included lumber yard, metal works facility auto repair
40
metal works facility, auto‐repair facility, coal yard, piano manufacture, livery car service, and gasoline station.
• Leaking underground storage tanks observed at site.
Contractor: XDD, LLCConsultant: Fleming‐Lee Shue
Target Area
• Approximately 6,500 ft2
(185 ft x 35 ft).
l f
41
• Treatment Interval of 9 to 14 ft bgs.
• Sandy and silty‐sandy material.
Contaminants of Concern
• Average Concentration of Petroleum Hydrocarbons:
– 3,000 g/L BTEX
– 140 g/L Naphthalene
42
g/ p
– 1,400 mg/kg GRO +
DRO
• DRO and GRO up to 3,760 and4,180 mg/kg, respectively.
• Variable GRO to DRO distribution indicated possible multiple releases.

May 2016
15
Bench‐Scale Tests
• Evaluated catalyzed hydrogen peroxide (CHP) and alkalineactivated persulfate (AAP).
• CHP eliminated as peroxide decomposed rapidly even withstabilizing reagents, likely limiting subsurface distribution and
43
stabilizing reagents, likely limiting subsurface distribution andresulting in rapid release of gas.
• Alkaline activated persulfate selected for effectiveness andchemical compatibility.– Reduced BTEX by 64‐77%.
– Reduced total TPH by 50%, with 50% percent of persulfate massremaining.
Field Application Design
• Designed based on multiple applications with emphasis onachieving remedial goals in single application.
• Injection wells installed to be accessible upon completion.
• Design called for 100,000 to 180,000 lbs of persulfate.
44
– 72,700 lbs in first application
– 60,300 lbs of 50% sodium hydroxide
– Approximately 35,000 gallons of reagent solution (250 g/Lpersulfate)
• Design incorporated the RemMetrik process utilizing Wavefronttechnology.
Field Application Logistics
• Difficult spatial constraints from construction activities
• Temporarily closed lane of W. 28th St. each day for batching. R d d i ST
.
45
Road was open during injection.
• Over 400 daily construction personnel
• Total access window of 9 days.
WELLFIELD
MIXING & DIST. SKID
CHEMICAL BATCHING & STORAGE
W. 28THS

May 2016
16
Batching
46
Mixing and Distribution Areas
47
Well Field
48

May 2016
17
Field Application
• Occurred May 7 to 17, 2013
• Performed by XDD in cooperation with ZEBRA Environmental and Fl i L Sh
49
Fleming‐Lee Shue.
• 72,372 lbs of alkaline activated Klozur persulfate injected in 35,432 gallons of solution.
• Completed on schedule and within budget, with no impact to construction activities.
Groundwater Results
• Monitoring conducted approximately 5 months after the application in three quarterly events.
• BTEX and naphthalene GW concentrations decreased
50
by 92 to 95%.
Rebound was Not Observed
Soil Results
• Soil sampled approximately 5 months after the application.
• BTEX concentrations reduced by 99.9%.
51
BTEX concentrations reduced by 99.9%.
DRO/GRO Soil Concentrations were
reduced by an Average of 99.2
percent

May 2016
18
Conclusions
• Single application of alkaline activated persulfate effectively treated BTEX, DRO and GRO
Up to 4 000 mg/Kg DRO and GRO
52
– Up to 4,000 mg/Kg DRO and GRO
• No rebound observed after 3 quarterly monitoring events.
• Site closed by NY‐DEC
Questions
53
Brant Smith, P.E., [email protected]
Brant Smith, P.E., [email protected]

May 2016
1
In Situ Chemical Reduction (ISCR)
Fundamentals related to selection, design and distribution of ISCR technologies at contaminated sites
Ravi Srirangam P.E., Ph.D.Ravi Srirangam P.E., Ph.D.
PeroxyChem Environmental Solutions
Design and Application of Insitu Treatment Technologies
CT/MA
May 2016
BASIC PRINCIPLES OF ISCR
2
The beginning of ISCR for soil and groundwater applications
“Rediscovery” of McCarty and Vogel Postulated Abiotic Pathways – “oxidation, reduction, substitution, and dehydrohalogenation reactions occur abiotically or in microbial systems”
Started with an interest in Abiotic MNA
B tler E Ha es K 2000 Kinetics of the transformation of halogenated
3
Butler, E., Hayes, K., 2000. Kinetics of the transformation of halogenated aliphatic compounds by iron sulfide. Environ. Sci. Technol. 34, 422–429.
Lee, W., Batchelor, B., 2002. Abiotic reductive dechlorination of chlorinated ethylenes by iron bearing soil minerals. 1. Pyrite and magnetite. Environ. Sci. Technol. 36, 5147–5154.
Wilson, J. T. (2003). Abiotic reactions may be the most important mechanism in natural attenuation of chlorinated solvents. Presented at the AFCEE Technology Transfer Workshop, Brooks AFB, San Antonio, TX.

May 2016
2
What is ISCR?
• Reduction adds electrons to the contaminant (need an electron donor)…… Oxidation removes electrons from the contaminant (need an electron acceptor)
• ISCR involves transfer of electrons to contaminants from reduced metals (ZVI, ferrous iron) or reduced minerals (magnetite, pyrite etc.)
• ISCR of CVOCs occurs via both abiotic as well as abiotic
4
• ISCR of CVOCs occurs via both abiotic as well as abiotic pathways....because both processes occur simultaneously in the subsurface
• Chlorinated Solvents
PCE, TCE, cis-DCE, 1,1-DCE, VC
1,1, 2,2-TeCA, 1,1,1-TCA
CT, CF
• Pesticides
Toxaphene Chlordane Dieldrin Pentachlorophenol
Examples of Contaminants Destroyed
Contaminants Treated via ISCR
5
Toxaphene, Chlordane, Dieldrin, Pentachlorophenol
• Energetics
TNT, DNT, RDX, HMX, Perchlorate
• Heavy Metals
Examples of Contaminants That Require Organic Amendment to ZVI for Destruction
• Chlorinated Solvents 1,2-DCA DCM, CM
Direct Dechlorination Reactions
Reactions:
Fe0 Fe2+ + 2e-
6
Fe0 Fe2 + 2e
2H2O 2H+ + 2OH-
2H+ + 2e- H2(g)
R-Cl + H+ + 2e- R-H + Cl-

May 2016
3
Role of ZVI and DVI (Fe(II)
• Significantly reduced half-lives of CVOCs in the presence of ZVI
• Requires direct contact with ZVI surface
• Reaction is abiotic reductive dehalogenation; minimizes/eliminates DCE/VC
• ZVI provides a long-term source of DVI to promote indirect chemical reduction of CVOCs (formation of reactive iron and iron sulfide minerals)
• β-elimination is the dominant pathway (~90%); ZVI generates hydrogen so some biotic reductive reactions are supported
7
DCE/VCpp
Typical CVOC Half-lives (Room temperature)
0
1
2
3
PCE TCE cDCE tDCE 11DCE VC CT TCM 111TCA112TCA
Ha
lf-l
ife
(h
rs))
ISCR CONFIGURATION AND CASE STUDIES
8
Common ISCR Implementation Methods
Hydraulic fracturing/injection (120 ft, 37 m)
Pneumatic
9
soil mixing
(40 ft, 12 m)
pneumatic fracturing
(90 ft, 27 m)
NitrogenGas Source
Overburden
Treatment ZoneInjector
Atomized Slurry in Gas Stream
Packer
Pneumatic Injection Module
Ferox InjectionTrailer
Direct injection (30ft,9m)
continuous trenching
(35 ft, 11 m)

May 2016
4
Expansion of Granular Iron Grain
Size Range
• 0.25 to 2 mm (-8 to +50 US mesh) fortrenched PRBs
• 0.07 to 1.7 mm (-12 to +200 US mesh)for hydraulic fracturing
• Pneumatic/hydraulic injection(microscale, D90 of 140 micron)
• mixed into clean soil backfill following excavation of contaminated soils
10
g(0.25 to 2 mm)
• physical mixing of iron and clay into the contaminated zone ( -50 mesh)
• 10 to 70 micron material in conjunction with other biological amendments-Injections
• Nanoscale materials (50-300 nm)
Commercial Facility, Mississauga, ON(February 2008)
• Former dry cleaner• Risk‐assessment to address source and on‐site contamination
• PRB to prevent off‐site migration
• Continuous trencher• Depth of 9 m• 125 m long
11
First ZVI PRB Installation in the Netherlands
Start of trenching
Continuous Backfill of Iron/sand
12
• Continuous trencher (CT) was used to install 120 m long PRB, with 0.3 m trench width (1.0 m to 5.5 m bgs).
• Two 30 m long HDPE wing sections were also installed using the CT.
• The PRB consisted of a granular iron and sand mix with 40% ZVI (v/v).
trenching Iron/sand
Outline of the installed Iron/sand PRB

May 2016
5
Netherlands PRB-February 2007 Results
0
20
40
60
80
Upgradient Downgradient
Con
cent
ratio
n (u
g/L)
Transect 1
Transect 2cDCE
0
10
20
30
40
Upgradient Downgradient
Con
cent
ratio
n (u
g/L)
Transect 1
Transect 2VC
Advantages
• 13 year operating record at oldest commercial facility
• possible benefits due to hydrogen gas, low Eh conditions (microbial activity)
• at most sites, if 5 to 8 years can pass before rejuvenation or
Long Term Performance of Commercial Systems
replacement, then technology is economically attractive
Disadvantages
• Contact -very critical
• Passivation of Iron surfaces
• Increasing implementation costs with Depth
Engineered ISCR?
Simple carbon donors
ZVIComplex carbon donors/ISRM
Engineered ISCR
15
Bacterial inoculation

May 2016
6
Engineered Reductants
Engineered ISCR:
• Amendments that combine chemical reductants (especially ZVI) withmaterials that stimulate microbial activity (organic carbon in variousforms) are available as commercial products. The products includeEHC® and Daramend®(PeroxyChem), ABC® + (Redox Tech, LLC),
16
( y ), ( , ),and emulsified zero-valent iron (EZVI) (National Aeronautics and SpaceAdministration).
• This approach relies on taking advantage of synergies offered by ZVIand organic carbon to further enhance the ISCR mechanism.
EHC® Reagent Composition
EHC is delivered as a dry powder and includes:
Micro-scale zero valent iron powder(standard ~40%)
Controlled-release, food grade, complex carbon (plant fibers) (standard ~60%)
17
Major, minor, and micronutrients
Food grade organic binding agent
Sustainable Solutiono By-product ZVIo Food production by-products
Mechanisms Zone of Influence
Bacteria
VFAsN trients
Direct Chemical Reduction requires contact with ZVI particle
Extended Zone with Biological Reduction and Indirect Iron Effects
Advection and Dispersion
NutrientsFe+2 H2
Diffusion between Solid ISCR seams
H2Fe+2
Fe+2 H2
H2
VFAs
VFAs

May 2016
7
Hypothesized reaction Pathways
Biotic AbioticPCE
TCE
Cis 1,2‐DCE Trans 1,2‐DCE
PCE
TCE
cis1,2‐DCE
Dichloroacetylene
VC
Ethene
Ethane
VC
Ethene
Ethane
Chloroacetylene
Acetylene
Hydrogenolysisβ‐elimination
CO2 – CH4 – H2OCO2 – CH4 – H2O
Hydrogenation
DESIGN AND IMPLEMENTATION OF ENGINEERED ISCR
20
Remediation Strategy
Source Area/Hotspot Treatment
Injection PRB for Plume Control
Plume Treatment
21

May 2016
8
1. What should the strategy be based on the site-specific goals?
• Residual source area treatment / Plume treatment / PRB
2. Which product to use, how much, how frequent ?
• Make up of target contaminants
• Desired reduction in concentration of CVOCs?
• Estimated mass of CVOCs
• Prevailing geochemistry (DO ORP)
Key Design Questions?
22
• Prevailing geochemistry (DO, ORP)
• Pathways required to treat the suite of CVOCs
• Product longevity
• Product distribution under the site-specific geologic/hydrogeologic conditions (depth, geology)
• Demand from CEAs
• Site-Specific Design Factor
3. Are other additives required (buffer, bioaugmentation etc.)?
• Potassium bicarbonate / dolomite
• SDC-9 / KB-1
1. Can the required product be applied in one event or multiple events are required?
• Available pore volume v/s injected volume
2. Application Method
• DPT
Injection Wells
Key Implementation Questions
23
• Injection Wells
• Fracturing
• Soil Blending
3. ROI and number of injection points?
• ROI increases with permeability-less injection points
• ROI increases with high pressure injections
1. Distribution of Slurries (all engineered ISCR products contain ZVI)
• Top Down / Bottom Up for DPT
• Fracturing (pneumatic/hydraulic)
2. Mixing / Pump Requirements
• Good mixing to eliminate clogging
• Positive displacement pumps/ high flow rate
Key Implementation Questions
24
3. Injection Spacing (horizontal/vertical)
• It is not only about how far you can distribute the reagent
4. Verification of Distribution
• Magnetic separation
• Visual inspection of cores

May 2016
9
Methods to Validate ROI
Verification of direct product placement:
Visual observation of fractures in soil cores.
Magnetic separation of ZVI from soil cores.
Monitoring of ground deformation using uplift stakes or tilt meters (usually used during fracturing).
25
Extended zone of influence:
Groundwater Indicator Parameters (TOC, Fe, geochemical parameters)
How Far is Substrate Distributed?
26
Solid ISCR® Design Calculation Steps
1. Calculate quantity of EHC required
• Hydrogen demand from CEAs and CVOCs in the treatment area
• Multiply the hydrogen demand by specific hydrogen capacity of EHC (94 g H2/kg of EHC),
• Multiply the theoretical EHC demand by a site-specific design factor (1 to 10)
• If the calculated demand is less than the default value, use the default value
• Recommended default values are:
• 0.15 to 0.25% by wt of soil for plume treatment
• 0.25 to 1.0% by wt. for source area treatment
8 out of 10 times selected dosage is based
8 out of 10 times selected dosage is based
27
y
• 0.50 to 1.5% by wt. for a PRB
2. Assess if the quantity estimated can be injected
• If required EHC slurry volume is less than 15% of the total porosity in the treatment zone, the quantity can be injected.
• If more than 15%, multiple injection events may be required spaced 6 months apart.
• If slurry volume is less than 10%, increase the volume by diluting the slurry to inject at a minimum 10% of the PV.
gon default values
gon default values

May 2016
10
Liquid ISCR Design Calculation Steps
1. Calculate quantity of substrate required
1. Hydrogen demand from CEAs and CVOCs in the treatment area
• Multiply the hydrogen demand by amount of H2 produced per unit quantity of substrate eg: (0.141 HRC , 0.0145 –Lactate 0.322 -EHC Liquid, 0.359 -soy bean oil
• Multiply the theoretical demand by a site-specific design factor (1 to 10)
• Calculate the required concentration of TOC in pore water. If the calculatedconcentration is less than the default value, use the default value
• Recommended default values are: 8 t f 108 t f 10
28
Recommended default values are:
• 1,000-5,000 mg/L for plume treatment
• 5000-10,000 mg/L for residual source area treatment
• 10,000-15,000 mg/L for source area and PRB
2. Assess if the quantity estimated can be injected
• If required substrate volume after X dilution is greater than 15% but less than 30% of the total porosity in the treatment zone, the quantity can be injected.
• If it is more than 50%, the dilution factor can be reduced to inject a concentrated solution or perform multiple applications.
• If it is less than 15%, increase the volume by diluting the solution or increasing the application rate.
8 out of 10 times selected dosage is based
on default values
8 out of 10 times selected dosage is based
on default values
SOLID-ISCR CASE STUDIES
29
EHC® Case Study – Source Area / Grid Injection
• Site: Former Dry Cleaner, OR
• Contaminants: PCE ~ 22,000 ug/L
TCE ~ 1,700 ug/L
DCE ~ 3,100 ug/L
VC ~ 7 ug/L
30
• Treatment: 10K lbs (4.5 kg) in 5 days32 injection ptsTarget area = 825 ft2 x 20 ft deep Vertical Interval = 10 to 30 ft bgs
Low permeability lithologyLarge seasonality in GW flow
Application rate - 0.6% by wt. to soil
• Material Cost: $1.24/ft3, ~$20,000

May 2016
11
EHC® Case Study Results -Indicator Parameters
0
1
2
3
4
5
6
0 5 10 15 20 25 30 35 40C
onc.
(m
g/L)
Time post EHC injection (months)
Dissolved Oxygen
-300-250-200-150-100-50
050
100150
0 5 10 15 20 25 30 35 40
OR
P (m
V)
Time post EHC injection (months)
ORP
31
NW sampling cluster NE sampling cluster
SW sampling cluster SE sampling cluster
05
10152025303540
0 5 10 15 20 25 30 35 40
Con
c. (
mg/
L)
Time post EHC injection (months)
Sulfate
0
5
10
15
20
25
0 5 10 15 20 25 30 35 40
Con
c. (
mg/
L)
Time post EHC injection (months)
Methane
EHC®
Case Study Results
PCE
TCE0
5,000
10,000
15,000
20,000
25,000
30,000
-18 0 1 5 8 12 14 18 22 24 31 34
Con
c. (
ug/
L)
NW sampling cluster
0
1,000
2,000
3,000
4,000
5,000
6,000
-18 0 1 5 8 12 14 18 22 24 31 34
Con
c. (
ug/
L)
NE sampling cluster
32
c-DCE
VC
0
2,000
4,000
6,000
8,000
1 5 8 12 14 18 22 24 31 34
Con
c. (
ug/
L)
Time post injections (months)
SE sampling cluster
0
2,000
4,000
6,000
8,000
10,000
12,000
1 5 8 12 14 18 22 24 31 34
Con
c. (
ug/
L)
Time post injections (months)
SW sampling cluster
Time post injections (months) Time post injections (months)
Upstate NY Case Study
ISCR pilot and Full scale Injections• Manufacturing site with DCE stall historically• An ISCR (EHC) pilot test was previously
conducted in the CVOC source area in Feb 2011.
• Full scale injections were designed as multiple events spread over 2 years both in the source area and downgradient (PRB) to prevent offsite plume migration
Design parameters:• The injections were conducted around
monitoring wells MW-11, MW-17 and MW-07 in Sep 2011 and Apr 2013
• Bioaugmentation was done using SDC-09 at the end of each injection event
33

May 2016
12
EHC®
Case Study Results
34
EHC®
Case Study Results
35
• Site: Confidential Site, KS
• Contaminant: Carbon Tetrachloride
2600 ft / 800 m plume
• Treatment: 48K lbs (21.7kgs) EHC PRB
• Application PRB installed down-gradient of St t
ISCR PRB- Plume Treatment
36
Strategy: source area
Installed line of injection points 10 ft / 3 m apart
PRB extends width of plume =
270 ft / 90 m long
Installed in 12 days using direct inject
Courtesy of Malcolm Pirnie (Arcadis)
discharges into small creek

May 2016
13
44<1
<1
120067
25<1 <1
19
May 2010
60<1
<1
57062
31<1 <1
21
October 2009
70<1
<1
1400130
29<1 <1
21
April 2009
150<1
<1
620170
49<1 <1
37
October 2008
82<1
<1
1400300
57<1 <1
13
April 2008
98<1
<1
1600170
27<1 <1
14
August 2007
36<1
<1
2700620
33<1 <1
17
February 2007
47<1
<1
770140
100011 <1
140
March 2005
ISCR - PRB
37
1575
16
72<1
5.825
<1
EHC Treatment Zone
Monitoring well andCT concentration (ug/L)
N
Property Line
0 300 600
SCALE IN FEET
1635
21
120<1
1334
<1
EHC Treatment Zone
Monitoring well andCT concentration (ug/L)
N
Property Line
0 300 600
SCALE IN FEET
2117
62
260<1
1589
<1
EHC Treatment Zone
Monitoring well andCT concentration (ug/L)
N
Property Line
0 300 600
SCALE IN FEET
1254
110
490<1
28170
<1
EHC Treatment Zone
Monitoring well andCT concentration (ug/L)
N
Property Line
0 300 600
SCALE IN FEET
1946
380
650<1
25280
<1
EHC Treatment Zone
Monitoring well andCT concentration (ug/L)
N
Property Line
0 300 600
SCALE IN FEET
94140
610
540<1
82190
<1
EHC Treatment Zone
Monitoring well andCT concentration (ug/L)
N
Property Line
0 300 600
SCALE IN FEET
150380
610
410<1
2.485
<1
EHC Treatment Zone
Monitoring well andCT concentration (ug/L)
N
Property Line
0 300 600
SCALE IN FEET
140
49067
280
4606.4
3798
<1
EHC Treatment Zone
Monitoring well andCT concentration (ug/L)
N
Property Line
0 300 600
SCALE IN FEET
LIQUID ISCR CASE STUDIES
38
E-ZVI Case Study
39

May 2016
14
Baseline Concentrations
40
Approach (cont.)
41
Injection design
42

May 2016
15
December 2004 TCEContours
Depth 30-50Feet
April 2008 TCE Depth 30-50Contours Feet
TCE Concentration (ppb)
≥ 10,000 ppb
1,000 ppb
≥ 100 ppb
≥ 10 ppb
Treatment Area
TCE Groundwater Cleanup Target Level is 3.0 ppb
Monitoring Well with Screen Interval
Multi-Chamber Monitoring Well
Case Study #3 – Patrick AFB, Florida RITS Spring 2009: EZVI Treatment of Chlorinated Solvents43
Concord NWS Case Study
Enhanced Reductive Dechlorination Pilot Test:• An Enhanced Reductive Dechlorination (ERD) pilot test
was previously conducted in the TCE source area from 2011 to 2014.
• The ERD pilot test used buffered emulsified vegetable oil substrate which was augmented with dechlorinating microbial consortium (SDC-9™).
ISCR Pilot Study:• The test was conducted in the TCE source area wells
44
• The test was conducted in the TCE source area wells (S29MW01 and S29MW03) not affected by the ERD pilot test.
• The aquifer was first primed for substrate distribution by fracturing the aquifer using the ELS and bioaugmentation solution.
• Following confirmation of fracture development, ZVI suspended in guar was injected into the interval followed immediately by the lactate, ELS solution and bioaugmentation culture.
• Monitoring was then conducted to verify the degradation of TCE.
Analytical Results
5.0
5.5
6.0
6.5
7.0
7.5
8.0
8.5
-100 0 100 200 300 400 500 600
Sta
nd
ard
Un
its
ISCR vs Biotic Only Treatment ComparisonpH
S29MW10 - Biotic Only
S29MW11 - Biotic Only
S29MW01 - ISCR
S29MW03 - ISCR
-600
-500
-400
-300
-200
-100
0
100
200
300
400
-100 0 100 200 300 400 500 600
mV
ISCR vs Biotic Only Treatment ComparisonOxidation-Reduction Potential
S29MW10 - Biotic Only
S29MW11 - Biotic Only
S29MW01 - ISCR
S29MW03 - ISCR
45
Days Days
May 2016
16
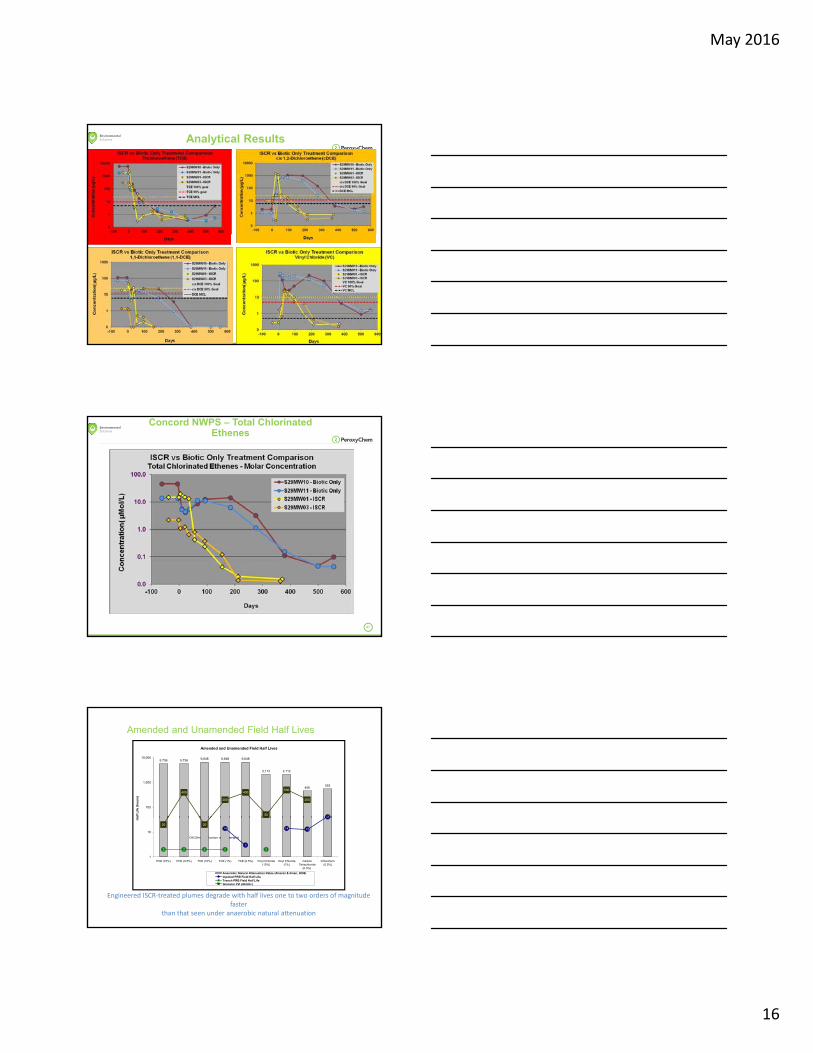
Analytical Results
46
Concord NWPS – Total Chlorinated Ethenes
47
Amended and Unamended Field Half Lives
Amended and Unamended Field Half Lives
5,736 5,736 6,648 6,648 6,648
2,112 2,112
456552
41
400
200
400
50
500
200
100
1,000
10,000
alf
Lif
e (h
ou
rs)
CHC (field application rate by weight)
Engineered ISCR‐treated plumes degrade with half lives one to two orders of magnitude faster
than that seen under anaerobic natural attenuation
14
3
14 13
41
2 2 2 2 2
20 20
1
10
PCE (10%) PCE (0.5%) TCE (10%) TCE (1%) TCE (0.5%) Vinyl Chloride(10%)
Vinyl Chloride(1%)
CarbonTetrachloride
(0.5%)
Chloroform(0.5%)
Ha
Anaerobic Natural Attenuation Rates (Alvarez & Ilman, 2006)Injected PRB Field Half LifeTrench PRB Field Half LifeGranular ZVI (Abiotic)

May 2016
17
Latest Developments
1. Integrated Emulsified Lecithin + ZVI
• Full-scale application at Concord NWS in 2014
2. Ferox Plus by Hepure
• ZVI plus emulsified vegetable oil (SRS)
3. Magnetic Susceptibility Analysis
49
• Allows us to determine the capacity of the aquifer to intrinsically support abiotic ISCR
4. Combined Remedies
• Sequential ISCO/ISCR (Klozur Persulfate /EHC)
• ERH/ISCR (CDMSmith, Hunters Point Naval Shipyard)
Bench, Pilot, and Design Optimization Tests
1. Bench tests typically recommended only for unique combination of CVOCs, CVOCs that have not been tested before, CVOCs concentrations outside the previously tested range or unique geochemical conditions (e.g. high sulfate)
2. Pay close attention to how you scale up from bench test data (i.e. the ratio of water to soil used in the bench is usually skewed compared to what it is in the aquifer)
50
3. Perform pilot test to answer questions around distribution, injectability, and full-scale design
4. Pilot test must be small enough to be cost effective, and add value to the full-scale, at the same time broad enough to collect sufficient data. As a general rule, be prepared to collect a lot more data in the pilot then you will during full-scale application
Lessons Learned
1. Geochemistry is important but it is relatively easy to overcome limiting geochemical conditions
2. It is important to know where the majority of the target contamination resides….specially for source and residual source areas
3. Distribution is the key to success, so engage a qualified injection contractor during the design phase
51
contractor during the design phase
4. Adopt newer site characterization tools to optimize implementation and achieve desired goals
5. Employ recommended injection pumps, mixing equipment and procedures
6. Allow flexibility in the design to address unforeseen conditions in the field

May 2016
18
CHAPTER 10IN SITU CHEMICAL REDUCTION FOR SOURCEREMEDIATIONPaul G. Tratnyek,1 Richard L. Johnson,1 Gregory V. Lowry2 and Richard A. Brown3
B.H. Kueper et al. (eds.), Chlorinated Solvent d
Reference Documents
52
Source Zone Remediation,doi: 10.1007/978‐1‐4614‐6922‐3_10, # Springer Science+Business Media New York 2014
Questions???
Ravi Srirangam, Ph.D.Technical Manager, Environmental SolutionsPeroxyChem, LLCOne Commerce Square2005 Market Street, Suite 3200Philadelphia, PA 19103P: 312.480.5250| E:[email protected]/remediation

May 2016
1
Combined Remedies for In Situ Treatment of Contaminants in Soil & Groundwater
Fayaz Lakhwala Ph DFayaz Lakhwala, Ph.D.
1. PeroxyChem Environmental Solutions 2.
Design and Application of In Situ Treatment Technologies
CT/MA
May 2016
Presentation Outline
Combined Remedies Initiative (CRI) – USEPA and National Groundwater Association (NGWA)
Why CRI?
Principles for CRI
Guidelines
2
Combined Remedies ‐ Spatial/Temporal
Combined Remedies – In Situ
Reagents for Combined Remedies
Case Studies
Discussions
Combined Remedies Initiative (CRI) –USEPA and NGWA
•In 2014, USEPA and National Groundwater Association formed a panel of regulators, academicians, consultants and technology vendors to study the application of combined remedies for soil and groundwater treatment
• 2015 Workshops in Boston, Kansas City and Denver
3
•Combined Remedies Sessions at RemTech and Battelle Bioremediation in 2015
•Workshops in Los Angeles and Seattle planned in 2016
•Special Issue of Groundwater & Monitoring Journal on Combined Remedies in 2016

May 2016
2
Why CRI?
The goal of the CRI is to advance the practice of combined remediation
The last 10‐15 years have seen several significant developments:
A larger remediation tool box
Increased awareness that contamination occurs in different phases ‐ e.g., NAPL, sorbed, dissolved
In different sub‐surface compartments – e.g., vadose, transmissive and
4
storage zones
Under different geochemical conditions at the site
All remediation technologies have strengths and weaknesses, which differ from one technology to another
Employing technologies in suitable combination can enable strengths to be combined and weaknesses overcome
This in turn can increase efficiency, improve performance, and thereby save time, money and resources
Principles for PracticingCombined Remedies
While the use of combinations of technologies has become more prevalent, there seem to be opportunities to improve the state of practice
Realization that for many, perhaps most sites, a combination of technologies is likely to be the most suitable remediation approach
Proactive vs Reactive
Clear identification of remedial objectives and metrics that provide guidelines including technology transition points is essential
5
guidelines, including technology transition points, is essential
The selection of each technology should consider how each stage of remedial effort will affect contaminant and subsurface conditions
Inclusion of contingencies in decision‐documents will allow course corrections as new information is generated
Combined remedies can be applied spatially, temporally, or both
In the case of in situ treatment reagents can be combined / reagents engineered to provide multiple treatment pathways
Goal: Develop guidelines to practice application of Combined Remedies
“Ground rules” for selection
Technical basis for integration
Integration benefits
Challenges of managing integration
6
Challenges of managing integration
Contractual certainty vs. the evolving Conceptual Site Model
Technology transition points — the science, the engineering, and the
contract

May 2016
3
Combined Remedies for In Situ Treatment
• In Situ remediation technologies can be broadly grouped into three categories – physical (extraction/thermal), chemical (ISCO/ISCR) and biological (ISB/MNA)
• Generally speaking, these groups commonly exhibit their greatest efficiency t hi h di d l t i t t ti ti l
Practitioners Principles
7
at high, medium and low contaminant concentrations, respectively
• Their combined usage may therefore similarly follow the physical, chemical, biological sequence as remediation progresses and concentrations are reduced
What, When, Where and How?
8
Combined Remedies - Spatial
Source Area ‐ Unsaturated Zone
•Excavation, ISCO w/soil mixing, Soil Vapor Extraction (SVE) , Bioventing
Source Area ‐ Saturated Zone
•Excavation, soil mixing, Air sparging ‐ Soil Vapor Extraction (AS/SVE), Multi‐phase Extraction (MPE), Dual‐Phase Extraction (DPE), Thermal, ISCO, ISCR, In Situ Bioremediation (ISB), In Situ Solidification/Stabilization (ISS)
Pl A (R id l S Z / Di l d Ph Pl
9
Plume Area (Residual Source Zone/ Dissolved Phase Plume
•Pump and Treat (P&T), AS/SVE, DPE, ISCO, ISCR, ISB, Phytoremediation, Monitored Natural Attenuation (MNA)
Off‐Site Migrating Plume
•P&T, Permeable Reactive Barriers (PRBs), MNA

May 2016
4
Combined Remedies - Spatial
10
Combined Remedies - Spatial
11
Transport in saprolite and bedrock
Max TCE concentration 1,200 mg/L
Very little biodegradation
14.8 acres
Combined Remedies - Spatial
ZVI Injection
KMnO4
Injection
12
ZVI Injection
KMnO4
Injection
110 ft

May 2016
5
Combined Remedies - Spatial
13
Combined Remedies - Spatial
14
Combined Remedies - Spatial
15

May 2016
6
Combined Remedies - Spatial
Primary Injection ( Aug 2013)
7 New borings
29 Injection intervals
21 Saprolite
5 Transition
3 Bedrock
38.3 Tons KMnO4/sand blend
Supplemental Injection (July 2014)
16
Supplemental Injection (July 2014)
10 Injection wells
5 New
5 Existing
48 Injection intervals
33 Saprolite
4 Transition
11 Bedrock
31 Tons KMnO4/sand blend
Scale = 40 ft
Combined Remedies - Spatial
17
15 Monitoring wells:
• 8 are ND
• 4 are >99.9% reduction from July 2014
• 3 are 88.6-99.9% reduction from July 2014
Combined Remedies - Spatial
18

May 2016
7
Combined Remedies - Spatial
3 PRBs (508’, 441’, 219’)
62 Borings
652 Tons ZVI
368 Injection intervals
157 Saprolite
106 T iti
19
106 Transition zone
105 Bedrock
Combined Remedies - Spatial
20
Combined Remedies - Spatial
21

May 2016
8
Combined Remedies - Spatial
22
Combined Remedies – Temporal
ISCO can be used as a mass reduction technology followed by: In situ bioremediation In situ biogeochemical remediation In situ chemical reduction Monitored natural attenuation
23
ISCO can be used following: Thermal treatment Surfactant/solvent enhanced extraction Extraction systems (dual phase extraction)
ISCR can be used as a mass reduction technology followed by: In situ bioremediation In situ biogeochemical remediation Monitored natural attenuation
In Situ Combined Remedies: Transition Points
Asymptotic trend in contaminant concentration
Reach order of magnitude (OOMs) reduction in contaminant mass or contaminant concentration
Shift in geochemical conditions to support the next step in the
24
g pp ptreatment train
Treatment of partial suite of contaminants is achieved…… the rest has to be treated by an alternative method

May 2016
9
In Situ Combined Remedies: Products that Promote Multiple Treatment Pathways
Klozur‐CR ®
Oxidation, aerobic degradation and anaerobic degradation
Applicable for mixed CVOCs and TPH contamination
EHC ®, DARAMEND ®, EHC® Liquid, Ferox Plus ™, EZVI
Ch i l d ti d bi bi d d ti f CVOC
25
Chemical reduction and anaerobic biodegradation of CVOCs
EHC®Metals, MetaFix ®
Chemical reduction and anaerobic biodegradation of CVOCs and Metals
BOS 100 ® , BOS 200 ®, PlumeStop ®
Aerobic and anaerobic bioremediation with adsorption
Chemical reduction with adsorption
gw flow
Injection Zone:
•Chemical oxidation (2‐3 months):source mass removal
• Extended elevated dissolved O2 for up to a year supports aerobic bioremediation
Klozur® CR Coupling ISCO with Bioremediation
Klozur CR Composition:
• 50% Klozur persulfate
• 50% PermeOx Plus
MechanismsContaminant plume
26
source polishing
Down gradient effects:
• dissolved O2 aerobic bio
• sulfate + dissolved organic fragments anaerobic oxidation
59‐01‐EIT‐DL
Conceptual Timeline
Persulfatechemical oxidation
Oxygen releaseaerobic bioremediation
Residual sulfateanaerobic oxidation
Sulfate Enhanced Biodegradation
27

May 2016
10
Effect of Klozur-CR on Contaminant Oxidation, Sulfide Production and Cinnabar (HgS) Precipitation.
Klozur-CR study conducted by Western Michigan University
Three different doses of Klozur®CR (persulfate activated with calcium peroxide) were added to slurry reactors containing sediment from the Kalamazoo River Superfund site contaminated with PAHs, PCBs, and mercury (in methylated and inorganic form)
28
The three test reactors and a control reactor were maintained for a period of 20 weeks
The purpose of these studies was to investigate the affect of Klozur-CR on indigenous sulfate-reducing bacteria (SRB) and chemical oxidation of PAHs, PCBs, and methylmercury (MeHg),
And on the ability of SRB to produce sulfide and precipitate cinnabar (HgS) after persulfate oxidation
Effect of Klozur-CR on Contaminant Oxidation, Sulfide Production and Cinnabar (HgS) Precipitation.
29
Effect of Klozur-CR on Contaminant Oxidation, Sulfide Production and Cinnabar (HgS) Precipitation.
30

May 2016
11
Effect of Klozur-CR on Contaminant Oxidation, Sulfide Production and Cinnabar (HgS) Precipitation.
31
Effect of Klozur-CR on Contaminant Oxidation, Sulfide Production and Cinnabar (HgS) Precipitation.
32
Effect of Klozur-CR on Contaminant Oxidation, Sulfide Production and Cinnabar (HgS) Precipitation.
Conclusions
Klozur‐CR was effective at chemical oxidation of the contaminants in the sediments tested, removing 91% of PCBs and 88% of PAHs at the highest dose tested (20 g/kg sediment). All doses removed over 99% of the MeHg in the sediments, and after 20 weeks
The results from the measurements of most probable number (MPN) and the relative abundance (RA) of oligonucleotide probes of SRB in the sediments clearly h h l l kill d i hibi d b ddi i f l ®
33
show that SRB were not completely killed or inhibited by addition of Klozur®CR
In fact, after an initial decrease in MPN, the lowest dose of Klozur®CR resulted in a higher MPN of SRB relative to the control
Within weeks after the exhaustion of the persulfate, sulfide was produced by the activity of the SRB. This resulted in precipitation of significant amounts of cinnabar (HgS)

May 2016
12
Case Study – Combined ISCO/ISCR
Optimization of In Situ Chemical Oxidation and Enhanced In Situ Bioremediation to Treat a Dilute Chlorinated Solvent Plume
Stephen Rosansky and Ramona Darlington (Battelle, Columbus, Ohio, USA)Heather Rectanus and Deepti Nair (Battelle, San Diego, California, USA)Brant Smith (XDD, Stratham, New Hampshire, USA)
34
Lora Battaglia (Navy BRAC PMO, San Diego, California, USA)
A‐71, in: H.V. Rectanus and R. Sirabian (Chairs), Bioremediation and Sustainable Environmental Technologies—2011.International Symposium on Bioremediation and Sustainable Environmental Technologies (Reno, NV; June 27–30, 2011).ISBN 978‐0‐9819730‐4‐3, Battelle Memorial Institute, Columbus, OH. www.battelle.org/biosymp
35
36

May 2016
13
37
38
39

May 2016
14
40
41
42

May 2016
15
43
44
Biogeochemical Formation of Reactive Iron Sulfide Mineralsat Hickam AFB, Pearl Harbor HI
• Unconsolidated calcium carbonate aquifer• Ambient aerobic groundwater• Very high sulfate concentrations (up to 3,000 mg/L)• Very high concentrations of chlorinated ethenes
(PCE,TCE, DCE,VC) (up to 550 mg/L TCE)• Efficient dechlorinating microbial culture present• EVO pilot test established reducing conditions but result was incomplete dechlorination, accumulation f DCE d VC d littl th ti
45
of DCE and VC, and very little ethene generation.
Daniel Leigh for AFCEE, 2011
• Change to ISCR treatment with organic substrate (lactate) and ferrous iron
• Examination of mineral precipitates one year after application of treatment
• Electron microprobe analyses of the precipitates (elemental characterization of newly‐formed minerals after 1 year)

May 2016
16
FeS present as fine (ca. 3 - 5 µm) coatingIs this important?
46Daniel Leigh P.G. CH.G. for AFCEE, 2011
Estimate: each 1.0 L of groundwater with sulfate at 3,000 mg/L reduced to 3.0 µm thick FeSprecipitates will yield about 1.2 ft2 of very reactive surface – YES, it is important!
How long will reactive minerals last? Influence of pH on Fe+2 release from FeS
47Hayes et al., 2009. SERDP ER-1375
Upflow columns packed with FeS coated sand. Effluent Fe+2 between 1 µg/L and 5 µg/L indicates that thin layers of FeS will last for 16 years under the pH 5.5 condition and 15 cm/day GW velocity. About 2% Fe released over 60 PV.
Evaluation of In Situ Chemical Reduction to Treat Chlorinated Ethenes in High
Sulfate Aquifers
48
Contaminated Site Management: Sustainable
Remediation and Management of Soil, Sediment and Water 2014
Daniel Leigh, Daniel E. Johnson and Keith L. Etchells

May 2016
17
High Sulfate Aquifer
• Large built structures prevent access to plume ( 500’ wide mall, street, garage) and make remediation infrastructure expensive
• Low seepage velocity challenging for passive treatment and active both. PRB longevity considerations in design
• Elevated PCE >2000 μg/L
Site Conditions/Constraints
49
• Aerobic Aquifer (DO ~5.0 mg/L)• Sulfate up to 3,000 mg/L• Previous bio only pilot tests unsuccessful• Incomplete degradation of PCE• Potential sulfide inhibition• Skeptical regulators: enhanced reductive dechlorination not
viewed feasible or applicable based on different technology
Objective
Determine if In Situ Chemical Reduction (ISCR) is capable of Treating PCE in aerobic, high sulfate aquifer
Determine if of soluble ferrous iron in EHC®‐Liquid can enhances precipitation of iron sulfide.
50
Does removal of sulfate/sulfide result in dechlorination of PCE?
Approach: Conduct bench test to evaluate two ISCR products
EHC®
EHC®Liquid + Soluble Fe2+
EHC-Liquid: Reaction Chemistry
Like EHC, EHC-L supports degradation of organic constituents by enhancing:
anaerobic bioremediation processes abiotic reduction reactions
Iron reducing microbes will continuously regenerate ferrous minerals and a cycle is
As bacteria feed on the soluble carbon, they consume dissolved oxygen and other electron acceptors, thereby reducing the redox potential in groundwater.
51
The soluble carbon provides molecular hydrogen (H2) for biologically mediatedenhanced reductive dechlorination (ERD)
Fe+2 Fe+3
Bacterial extraction of electrons from carbon restores Ferric (Fe+3) to Ferrous (Fe+2)
e‐
ISCR reactions of Fe+2
with contaminants andformation of Fe+3
PCE Ethene
Ferrous iron may also control dissolved phase heavymetals by promoting formation of insoluble forms (e.g.,arsenopyrite from arsenic).
established.
The soluble ferrous iron (Fe2+) combines with sulfide (S‐) togenerate reactive iron sulfide (FeS) species in situ

May 2016
18
Microcosm Setup
Sulfate – 1,800 mg/L Spiked to 2,300 mg/L
PCE – 170 μg/L Spiked to 1,800 μg/L
SDC‐9TM Dhc ~ 1X10⁸ cells/L
Sediment and groundwater samples collected from source area wells
Bench Test Conducted at PeroxyChem’s laboratory Mississauga, ON
52
EHC‐Liquid 10 g/L + additional 14 g/L soluble iron
EHC – 10 g/L
Precipitation of Sulfide
Day 6
EHC‐LEHCControl
Day 34
EHC‐LEHCControlEHCEHC‐L
53
Day 60
EHC EHC‐LControl
Day 124
EHC‐LEHCControl
Day 182
EHC EHC‐LControl
Precipitation of Sulfide
54

May 2016
19
Analytical Results
5.0
5.5
6.0
6.5
7.0
7.5
8.0
8.5
9.0
0 50 100 150 200
pH (Units)
pH
Control
EHC
EHC‐L +Fe2+
‐600
‐400
‐200
0
200
400
600
0 50 100 150 200
MilliVolts
ORP
Control
EHC
EHC‐L +Fe2+
55
0
500
1,000
1,500
2,000
2,500
3,000
0 50 100 150 200
Concentraation )mg/L)
Days
Sulfate
Control
EHC
EHC‐L +Fe2+
0 50 100 150 200Days
0 50 100 150 200Days
0
1
2
3
4
5
6
7
8
0 50 100 150 200
Concentration (mg/L)
Days
Nitrate
Control
EHC
EHC‐L +Fe2+
VOC Analytical Results
0
5
10
15
20
25
30
35
0
200
400
600
800
1,000
1,200
1,400
1,600
1,800
2,000
0 100 200
Concentration ethne, ethane,
acetylene (μg/L)
Concentration PCE, TCE, DCE VC
(μg/L)
EHC ‐Mass Concentration
0
2
4
6
8
10
12
0 50 100 150 200
Concentration PCE, TCE, DCE VC
(μMol/L)
EHC ‐Molar Concentration
56
0
0.1
0.2
0.3
0.4
0.5
0.6
0.7
0.8
0
200
400
600
800
1,000
1,200
1,400
1,600
1,800
2,000
0 50 100 150 200
Concentration ethne, ethan
e,
acetylene (μg/L)
Concentration PCE, TCE, DCE VC
(μg/L)
Days
EHC Liquid + Fe2+ ‐Mass Concentration
0
2
4
6
8
10
12
0 50 100 150 200
Concentration PCE, TCE, DCE VC
(μMol/L)
Days
EHC Liquid + Fe2+ ‐Molar Concentration
0 100 200
Days Days
FeS Precipitation and Summary
FeS does not fill pore space
0.56 cm3 Mackinawite (FeS, 4.9 g/cm3) ~0.05% of volume of pore space
0.38 cm3 Pyrite (FeS2, 4.8 to 5.0 g/cm3) ~ 0.04% of volume of pore space
Reduction of 1 Liter of 3,000 mg/L of sulfate and precipitation as ferrous sulfide produces:
Significant reductions in hydraulic conductivity would not be expected from FeSprecipitation
57
precipitation
Addition of EHC and EHC‐Liquid will reduce sulfate to sulfide
Sulfide precipitates as ferrous sulfide
Removal of sulfate and sulfide allows for complete reductive dechlorination of PCE
FeS promotes biogeochemical degradation of chlorinated ethenes
ISCR is a highly effective process for treating chlorinated ethenes in high sulfate aquifers
May 2016
20
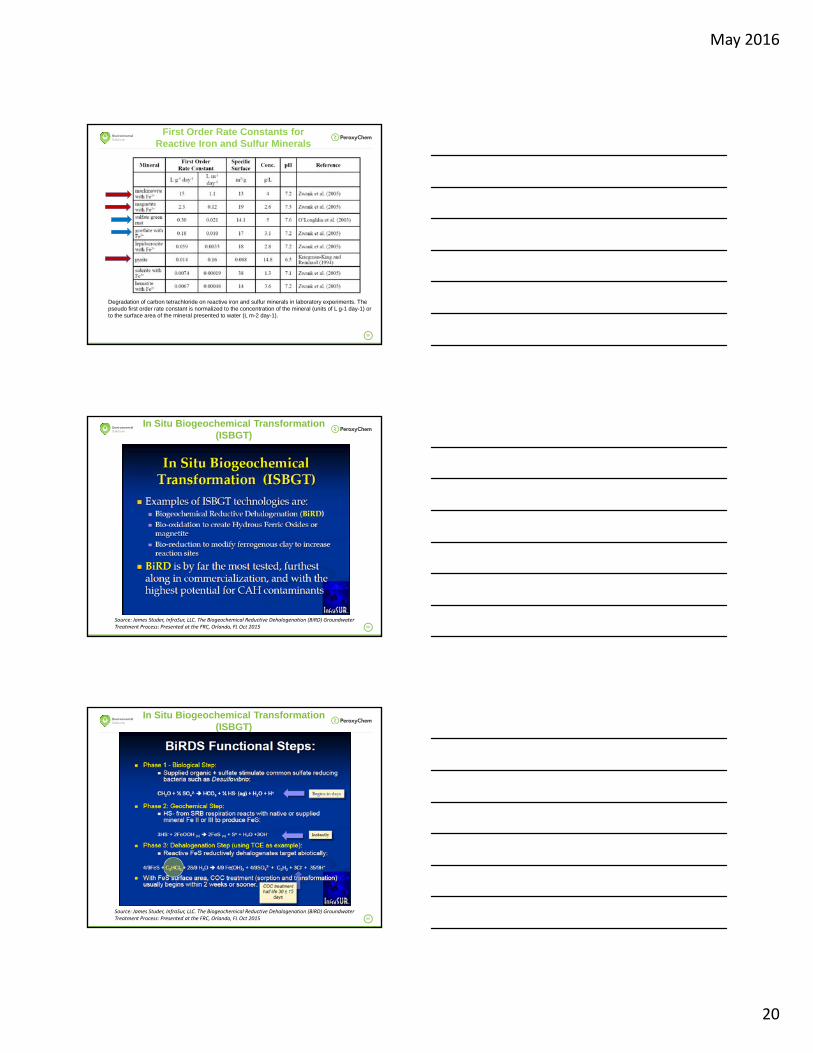
First Order Rate Constants for Reactive Iron and Sulfur Minerals
58
Degradation of carbon tetrachloride on reactive iron and sulfur minerals in laboratory experiments. The pseudo first order rate constant is normalized to the concentration of the mineral (units of L g-1 day-1) or to the surface area of the mineral presented to water (L m-2 day-1).
In Situ Biogeochemical Transformation (ISBGT)
59
Source: James Studer, InfraSur, LLC. The Biogeochemical Reductive Dehalogenation (BiRD) Groundwater Treatment Process: Presented at the FRC, Orlando, FL Oct 2015
In Situ Biogeochemical Transformation (ISBGT)
60
Source: James Studer, InfraSur, LLC. The Biogeochemical Reductive Dehalogenation (BiRD) Groundwater Treatment Process: Presented at the FRC, Orlando, FL Oct 2015

May 2016
21
In Situ Biogeochemical Transformation (ISBGT)
61
Source: James Studer, InfraSur, LLC. The Biogeochemical Reductive Dehalogenation (BiRD) Groundwater Treatment Process: Presented at the FRC, Orlando, FL Oct 2015
In Situ Biogeochemical Transformation (ISBGT)
62
Source: James Studer, InfraSur, LLC. The Biogeochemical Reductive Dehalogenation (BiRD) Groundwater Treatment Process: Presented at the FRC, Orlando, FL Oct 2015
Oxygen O2 + 4H+ + 4e- 2H2O (Eh0 = +820)
Nitrate 2NO3- + 12H+ +10e- N2(g) + 6H2O (Eh
0 = +740)
Released
During ElectronTran
sfer
Manganese (IV) MnO2(s) + HCO3 +3H + + 2e ‐ MnCO3 (s) + 2H20
(Eh0 = +520)
d i l ( h0)
500
Aerobic
Anaerobic
1000
Arsenic (V) H3AsO4 + 2H+ +2e‐ H3AsO3 + H2O (Eh
0 = +559)
Chromium (VI ) Cr2O72- + 14H+ + 6e- 2Cr3++7H2O (Eh0 = +1330)
Anaerobic
ClO4− + 4H2O + 8e
− → Cl− + 8OH− (Eh0560)Perchlorate
Eh range for cholorinated ethene degradation
Range for EffectiveChlorinated Ethene
Degradation(chlororespiration)
↓Methanogenesis CO2 + 8H
+ + 8e‐ CH4 + 2H2O (Eh0 = ‐240)
Sulfate SO42‐ + 9H+ + 8e‐ HS‐ + 4H2O (Eh
0 = ‐220)
Iron FeOOH(s) +HCO3‐ + 2H+ e‐ FeCO3 + 2H2O (Eh
0 = ‐50)
Decreasing Amount of En
ergy R Redox Potential (Eh0)in Millivolts @ pH = 7
and T = 250C0
-250
0
PCE TCE
TCE DCE
DCE VC
VC Ethene

May 2016
22
H2 demand for select electron acceptors
Electron Acceptor Electron equivalents per mole
Oxygen 4
Nitrate 4
Sulfate 8
Carbon dioxide 8
64
Manganese (IV) 2
Ferric iron (III) 1
PCE ‐ tetrachloroethene 8
TCE – trichloroethene 6
DCE – dichloroethene 4
VC – vinyl chloride 2
Most CE mass may be attached to aquifer matrix
MetaFix® Reagents
MetaFix® is a new family of reagents designed to treat heavy metals in soil and groundwater using chemical reduction, precipitation, and adsorption.
Reagents do not rely on biological sulfate reduction or carbon metabolism so their performance is not inhibited by high toxicity (e.g., alkalinity, acidity, salts, high COI concentrations)
65
Composed of ZVI, iron sulfides, iron oxides, alkaline earth carbonates, and activated carbon
Treatment results in conversion of aqueous heavy metals to low solubility mineral precipitates with broad pH stability
Can also treat cVOCS via abiotic pathways
Unique made-to-order formulations for all commonly found metallic contaminants and site conditions
Composition of MetaFix® Reagents
ZVI: reductant, source of Fe+2
Iron Sulfides: source of sulfide and Fe+2, catalyst, provide both cationic and anionic adsorption surfaces, can make aqueous iron more reactive
Iron Oxides: provide both cationic and anionic surfaces, adatoms of ferrous iron are very reactive
66
CaCO3: pH balance and source of carbonate
Activated Carbon: strong adsorbent for organically-bound metals including arsenic, mercury, and nickel
Supplementary reagents: ion exchange, pH modification when needed, inclusion based on results of bench-scale optimization work
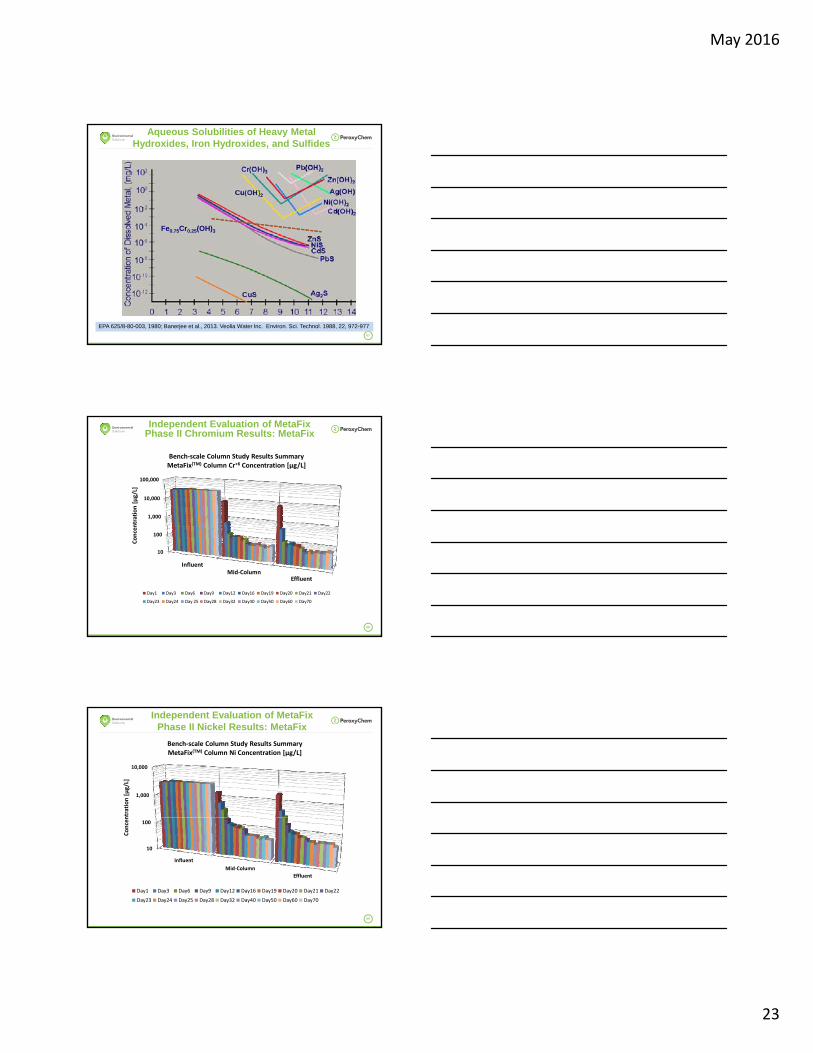
May 2016
23
Fe0.75Cr0.25(OH)3
Aqueous Solubilities of Heavy Metal Hydroxides, Iron Hydroxides, and Sulfides
67
EPA 625/8-80-003, 1980; Banerjee et al., 2013. Veolia Water Inc. Environ. Sci. Technol. 1988, 22, 972-977
Independent Evaluation of MetaFix Phase II Chromium Results: MetaFix
1,000
10,000
100,000
ntration [µg/L]
Bench‐scale Column Study Results SummaryMetaFix(TM) Column Cr+6 Concentration [µg/L]
68
10
100
InfluentMid‐Column
Effluent
Concen
Day1 Day3 Day6 Day9 Day12 Day16 Day19 Day20 Day21 Day22
Day23 Day24 Day 25 Day28 Day32 Day40 Day50 Day60 Day70
Independent Evaluation of MetaFixPhase II Nickel Results: MetaFix
1,000
10,000
ntration [µg/L]
Bench‐scale Column Study Results SummaryMetaFix(TM) Column Ni Concentration [µg/L]
69
10
100
Influent
Mid‐Column
Effluent
Concen
Day1 Day3 Day6 Day9 Day12 Day16 Day19 Day20 Day21 Day22
Day23 Day24 Day25 Day28 Day32 Day40 Day50 Day60 Day70

May 2016
24
Treatment of Mixed Metal/cVOC Plumes
Table 1. Influence of control and treatment on heavy metal concentrations.
Biotic Control
70Confidential Client, Independent Laboratory
MetaFix® I‐6
Mixed Metal/cVOC Plumes
Table 1. Influence of control and treatment on VOC concentrations in microcosms.
Biotic Control
71Confidential Client, Independent Laboratory
MetaFix® I‐6
Where do we go from here on CRI ?
•Identification of Best Management Practices (BMPs) – e.g., insights into opportunities for coupling technologies and indicia regarding transition points
•Identification of barriers ‐ informational, institutional, etc. ‐ to the use of combinations of technologies
Areas of possible contributions to the state of practice include:
72
•Identification and support of research for improved understanding of technology suitability and exploitation of synergies
•Publication of useful case study and research paper information and dissemination via appropriate multi‐media mechanisms

May 2016
25
Fayaz Lakhwala, Ph.D.Technology Applications Manager|Environmental SolutionsPeroxyChem, LLCOne Commerce Square2005 Market Street, Suite 3200Philadelphia, PA 19103P: 908.230.9567| E:[email protected]/remediation
Questions ?
p y

May 2016
1
High Resolution Remediation
Eliot CooperDirector of [email protected]
303‐669‐7443
1
303‐669‐7443
Design and Application of In Situ Treatment TechnologiesCT/MAMay 2016
Success is enough of chemistry cost effectivelydelivered in contact with contaminants for a longenoughperiod of time for effective destruction.
There is a Methodology For Success
2
“Contaminant Mass” => Chemistry matters
“Contact” => HRSC matters
– ID of lithology vs. contaminant mass vs. K < 1” resolution
What Really Matters?
resolution
“Delivered” Lithology Matters
– Fracturing and Injection
“Long Enough Period Time” => Residence Time Matters
– Seepage Velocity (K and gradient)
3
May 2016
2
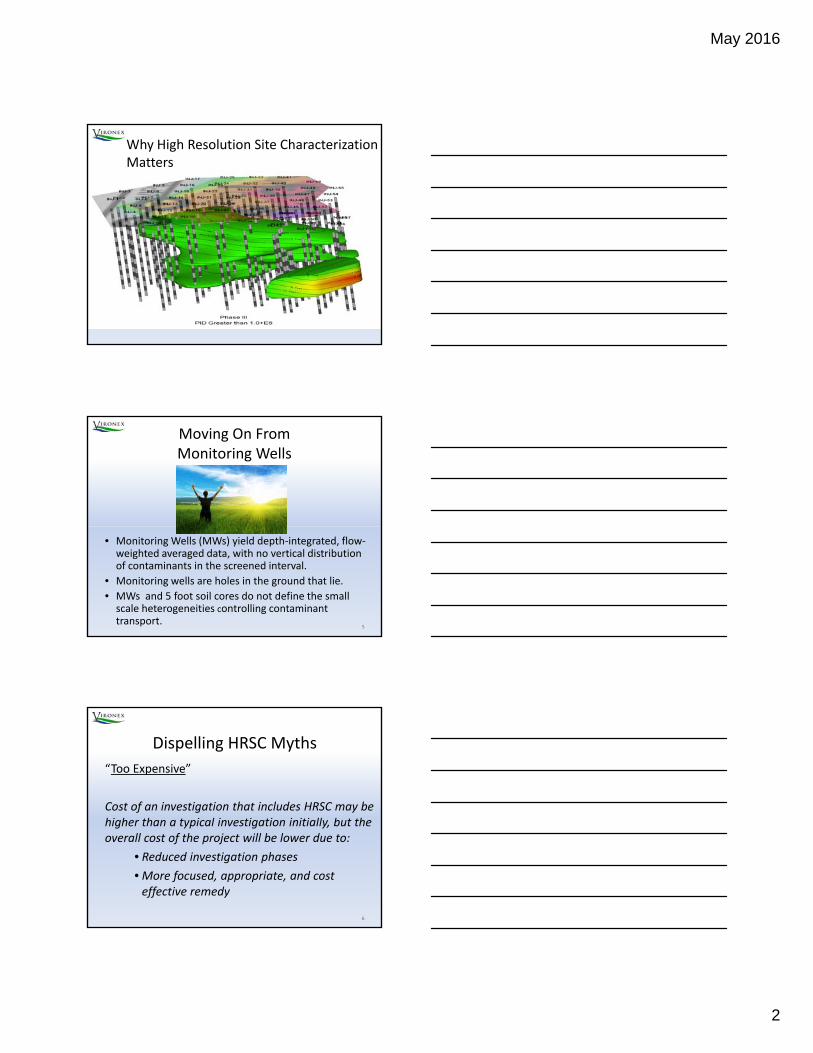
Why High Resolution Site Characterization Matters
Moving On FromMonitoring Wells
• Monitoring Wells (MWs) yield depth‐integrated, flow‐weighted averaged data, with no vertical distribution of contaminants in the screened interval.
• Monitoring wells are holes in the ground that lie.
• MWs and 5 foot soil cores do not define the small scale heterogeneities controlling contaminant transport.
5
“Too Expensive”
Cost of an investigation that includes HRSC may be hi h h i l i i i i i i ll b h
Dispelling HRSC Myths
higher than a typical investigation initially, but the overall cost of the project will be lower due to:
• Reduced investigation phases
• More focused, appropriate, and cost effective remedy
6
May 2016
3
“Only for the most complex sites”
All sites can benefit from HRSC; the complexity
Dispelling HRSC Myths
of most sites is not known until many mobilizations have occurred using traditional
site characterization technologies
7
Remedies based on a flawed CSM may not perform as expected, increasing the time it takes to achieve remedial action objectives, and the
Risks of Faulty CSMs
j ,overall cost. Until the CSM reflects reality, investigation and cleanup will be costly.
8
HRSC Tools ‐ General
• Advanced with direct push technology
• Rugged equipment down‐hole and sensitive equipment above ground
• Provides vertically dense data in strip log format
• Results are in real time to support dynamic work planning
• Data is mobile ‐ email
9
May 2016
4
High Resolution Characterization Technology Continually ImprovingProblem Solution
Inability of MIP to map VOC mass to K in same push
MiHPT
Inability to speciate PCE/TCE from DCE/VC with MIP
XSD/ECD
Need lower MIP detection limits for plume
Low Level MIP
DNAPL, LNAPL foul trunk lines Heated Trunk Line
Accurately collecting confirmation gw samples based on K
HPT Groundwater Sampler
Inability to see SVOCs NAPL with MIP
UVOST
10
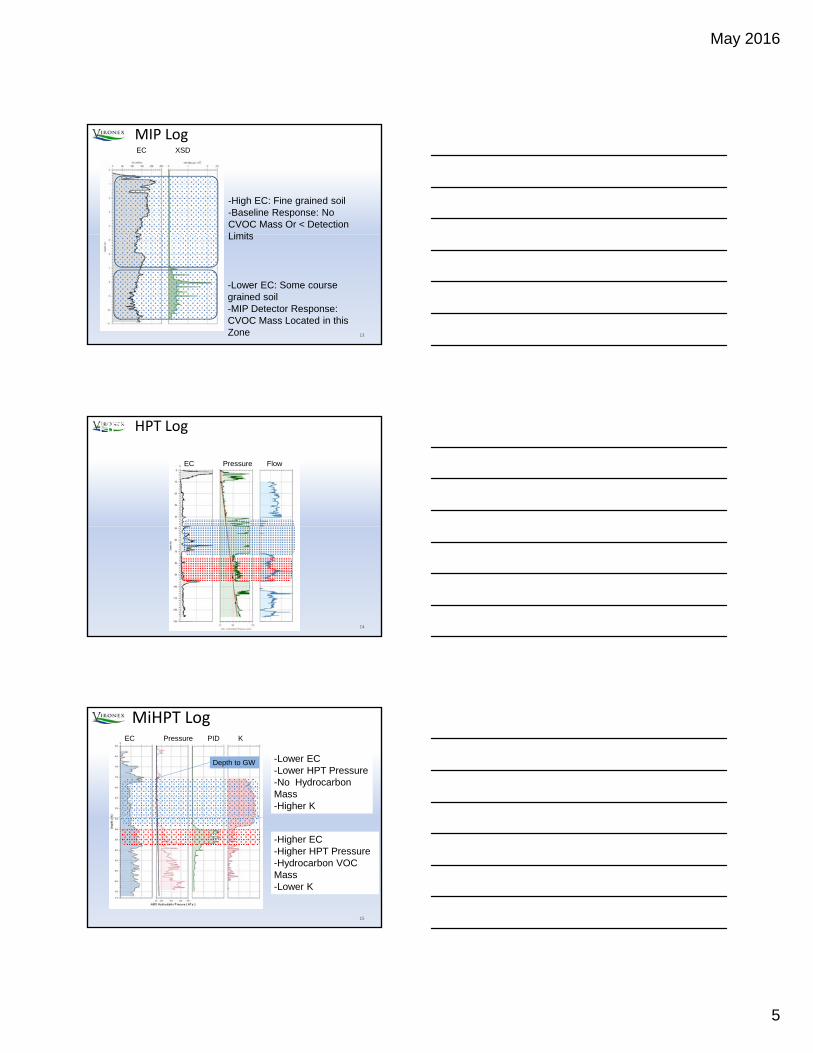
MiHPT System
11
MiHPT –Membrane Interface Hydraulic Profiling Tool
• Providing the Whole Picture
– Lithology: Electrical Conductivity (EC)(EC)
– VOC Mass: Membrane Interface Probe (MIP)
– Hydraulic Conductivity: Hydraulic Profiling Tool (HPT)
• 3 Tools – One Boring
12
May 2016
5
MIP Log
-High EC: Fine grained soil-Baseline Response: No CVOC Mass Or < Detection Limits
EC mS/m XSD 1 x 10⁵
MV
EC XSD
13
Limits
-Lower EC: Some course grained soil-MIP Detector Response: CVOC Mass Located in this Zone
HPT Log EC HPT Pressure
K HPT Log
EC Pressure Flow
14
MiHPT Log
-Lower EC-Lower HPT Pressure-No Hydrocarbon Mass-Higher K
EC HPT Pressure
KPID
Depth to GW
EC Pressure PID K
15
-Higher EC-Higher HPT Pressure-Hydrocarbon VOC Mass-Lower K

May 2016
6
Dissipation Test
HydraulicConductivity
16
3D Imaged Source Area – PID > 1 x 10⁶ microvolts
Evolution of HRSC

May 2016
7
Search and Destroy® Alive and Well
EC 0-150 ms/m PID 0-6 107 uV EC 100 – 1600 ms/m PID 0.1 – 2.5 106 uV
MiHPT Performance Monitoring
• NC Former retail gas station• Original design based on MW and
limited soil data• HRSC (MIP) and pilot testing
performed in same mobilization (4 days onsite)
HRSC Optimization Case Study
– SOD (0.5 g/kg) and buffering samples collected
– Injection tooling selected and distribution verified (using EC)
• Two full scale rounds of caustic ASP completed to date– 10‐15% SP, 75% mobile pore volume
20
HRSC Source ID
MW‐18
MW‐5
MW‐8
Former USTs
Approximate Well Screen
(10-20 ft)
21

May 2016
8
Targeted Injection Plan
22
Project Summary
23
Delivery – Why Lithology Matters

May 2016
9
Lithology Specific Delivery Approaches
Scenario Tooling Screen Lengths
HomogeneousSands/Gravels
Wells or DPT 5 to 30 feet
HeterogeneousSands, Silts and
Top‐DownDPT
1 Foot
Clays
Silts and Clays Top Down ‐DPT
Fracturing
Sands Over Clays Bottom‐UpDPT
Fracturing
Clays Over Sand Top –Down DPT
Fracturing
Bedrock Wells, Open Bore Holes w Packers
5 to ?? Feet
DPT Tooling Retractable
26
DPT Tooling 1.5 – 2.25” Fixed Open
27
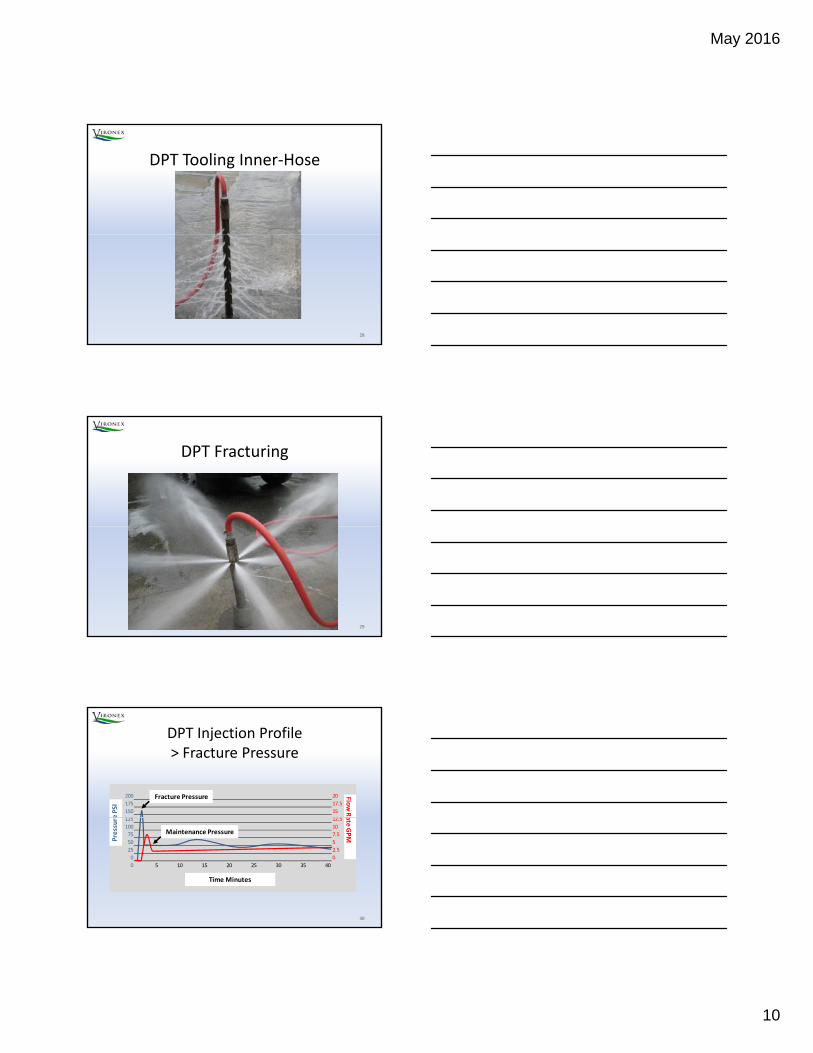
May 2016
10
DPT Tooling Inner‐Hose
28
DPT Fracturing
29
DPT Injection Profile> Fracture Pressure
200 20
175 17.5
150 15
125 12 5
Flow Rae
PSI
Fracture Pressure
30
125 12.5
100 10
75 7.5
50 5
25 2.5
0 0
0 5 10 15 20 25 30 35 40
ate GPM P
ressure
Maintenance Pressure
Time Minutes

May 2016
11
DPT Rule Of Thumb
PImax = (DTI * 0.5PSI) + DTPc
DPT Injection < Fracture Pressure
DTI = Depth To Target Interval
DPTC = DPT Compaction Factor
DPTC= 0 to 75 PSI per soil type
31
DPT Injection Profile< Fracture Pressure
200 20
175 17.5
150 15
125 12 5
Flow Rae PSI
DPT Compaction Pressure
32
125 12.5
100 10
75 7.5
50 5
25 2.5
0 0
0 5 10 15 20 25 30 35 40
ate GPM P
ressure
Time Minutes
DPT Compaction Pressure
Compacted Zone Degrading
HRIT – Do You Need To Fracture
• Real‐Time High Resolution Injection Data:
– Electrical Conductivity
– Flow
– Up‐Hole Pressure
– Down‐Hole Pressure
33

May 2016
12
0123456789
14:10:53
11:21:42
11:23:21
11:25:03
11:26:43
11:28:24
11:30:04
11:31:42
11:33:25
11:35:06
11:36:45
11:38:25
Flow (GPM)2
0
10
20
30
40
50
60
14:10:53
11:21:42
11:23:21
11:25:03
11:26:43
11:28:24
11:30:04
11:31:42
11:33:25
11:35:06
11:36:45
11:38:25
Pressure Switch Above Ground (PSI)
0
5
10
15
20
25
14:10:53
11:21:42
11:23:21
11:25:03
11:26:43
11:28:24
11:30:04
11:31:42
11:33:25
11:35:06
11:36:45
11:38:25
Down_Hole Pressure
HRIT DPT – Target Interval Fracture AnalysisEstimated Vs Actual Down Hole Data
34
0
1
2
3
4
5
6
7
8
9
0
10
20
30
40
50
60
14:10:53
11:21:42
11:23:21
11:25:03
11:26:43
11:28:24
11:30:04
11:31:42
11:33:25
11:35:06
11:36:45
11:38:25
Down_Hole Pressure Pressure Switch Above Ground (PSI) Flow (GPM)2
FLOW
(GPM)
PRESSU
RE (PSi)
Why Residence Time Matters
Contaminant mass distribution is based Water-Soil Equilibrium Partition theory….the ability of organic carbon in soil to absorb contamination.
35
Advection / Dispersion ROI
Additional ROI from Advection
/ Dispersion (Feet)
0.5 foot/day
Time Frame To Achieve
Advection / Dispersion ROI
(Days)
ROIInjectable Pore Volume ROI
% of Injectable Volume
Pore Volume ROI
Reagent
Per Location + =
Vironex ROI CalculationsAssuming Darcy Flow High Seepage Velocity
8 feet 16 Days 11.5 feet20% 3.5 feet1675 gals
11.5 feet = 3.5 feet + 8 feet @ 16 days
23 ft
15’
Reagent Persistence > Kinetics ROI

May 2016
13
Advection / Dispersion ROI
Additional ROI from Advection
/ Dispersion (Feet)
1 foot/month
Time Frame To Achieve
Advection / Dispersion ROI
(Days)
ROIInjectable Pore Volume ROI
% of Injectable Volume
Pore Volume ROI
Reagent
Per Location + =
Vironex ROI CalculationsAssuming Darcy Flow Low Seepage Velocity
8 feet 8 months 11.5 feet20% 3.5 feet1675 gals
11.5 feet = 3.5 feet + 8 feet @ 240 days
23’
15’
Reagent Persistence > Kinetics + ROI
ROI Design Considerations
ROI = Radius Of InfluenceROIT = Time To Achieve Radius Of InfluencePVI = % Pore Volume To Be InjectedGWSV = GW Seepage VelocityDGWSV = Distribution By GW Seepage VelocityT Ti R t Ki ti ll A ti
DesignRequirement
ROIT > Tk ROIT < RT
ROIT = TKROIT = RT
COCsUntreated
COCsUntreated
Chemistry ROIT > Tk ROIT < RTTK = Time Reagent Kinetically ActiveRT = Time To destruct Contaminant
PVI = ROI – DGWSV
ROIT = ROI‐PVI / GWSV
e s y O T k O T T
ISCO, Bio, ISCR
> Persistence > Persistence
Delivery ROIT > Tk ROIT < RT
Liquid Vs Solid
Inject Vs Fracture
Inject Vs Fracture
Grid Vs Barrier Vs Recirculation
Inject Vs Fracture
Inject Vs Fracture
Typical Spacing
High Seepage Velocity Impact on Spacing
10’ ROI @ 30% pore Volume
Advection Driven
Tighter spacing between points and larger spacing between rows.
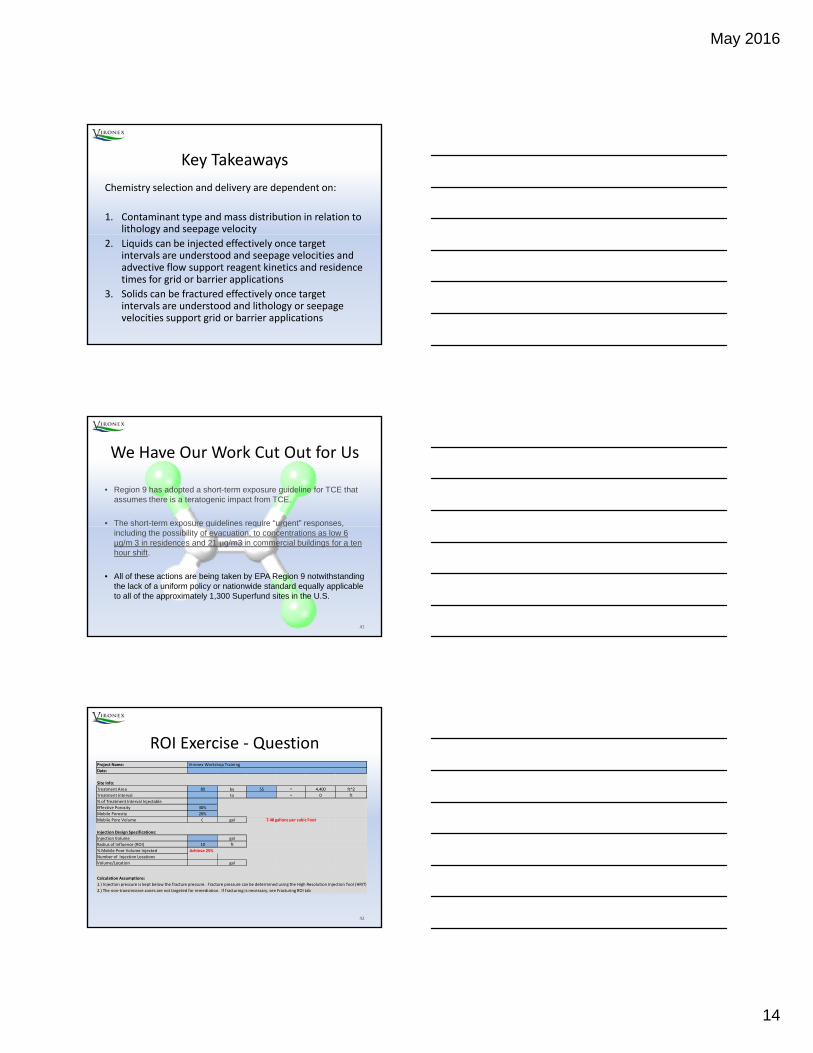
May 2016
14
Key Takeaways
Chemistry selection and delivery are dependent on:
1. Contaminant type and mass distribution in relation to lithology and seepage velocity
2. Liquids can be injected effectively once target intervals are understood and seepage velocities and advective flow support reagent kinetics and residence times for grid or barrier applications
3. Solids can be fractured effectively once target intervals are understood and lithology or seepage velocities support grid or barrier applications
We Have Our Work Cut Out for Us
• Region 9 has adopted a short-term exposure guideline for TCE that assumes there is a teratogenic impact from TCE.
• The short-term exposure guidelines require “urgent” responses,
41
p g q g p ,including the possibility of evacuation, to concentrations as low 6 µg/m 3 in residences and 21 µg/m3 in commercial buildings for a ten hour shift.
• All of these actions are being taken by EPA Region 9 notwithstanding the lack of a uniform policy or nationwide standard equally applicable to all of the approximately 1,300 Superfund sites in the U.S.
ROI Exercise ‐ QuestionProject Name:
Date:
Site Info:
Treatment Area 80 by 55 = 4,400 ft^2
Treatment Interval to = 0 ft
% of Treatment Interval Injectable
Effective Porosity 30%
Mobile Porosity 20%
Vironex Workshop Training
Mobile Pore Volume 0 gal 7.48 gallons per cubic Foot
Injection Design Specifications:
Injection Volume gal
Radius of Influence (ROI) 10 ft
% Mobile Pore Volume Injected Achieve 25%
Number of Injection Locations
Volume/Location gal
Calculation Assumptions:
1.) Injection pressure is kept below the fracture pressure. Fracture pressure can be determined using the High Resolution Injection Tool (HRIT)
2.) The non‐transmissive zones are not targeted for remediation. If fracturing is necessary, see Fracturing ROI tab
42
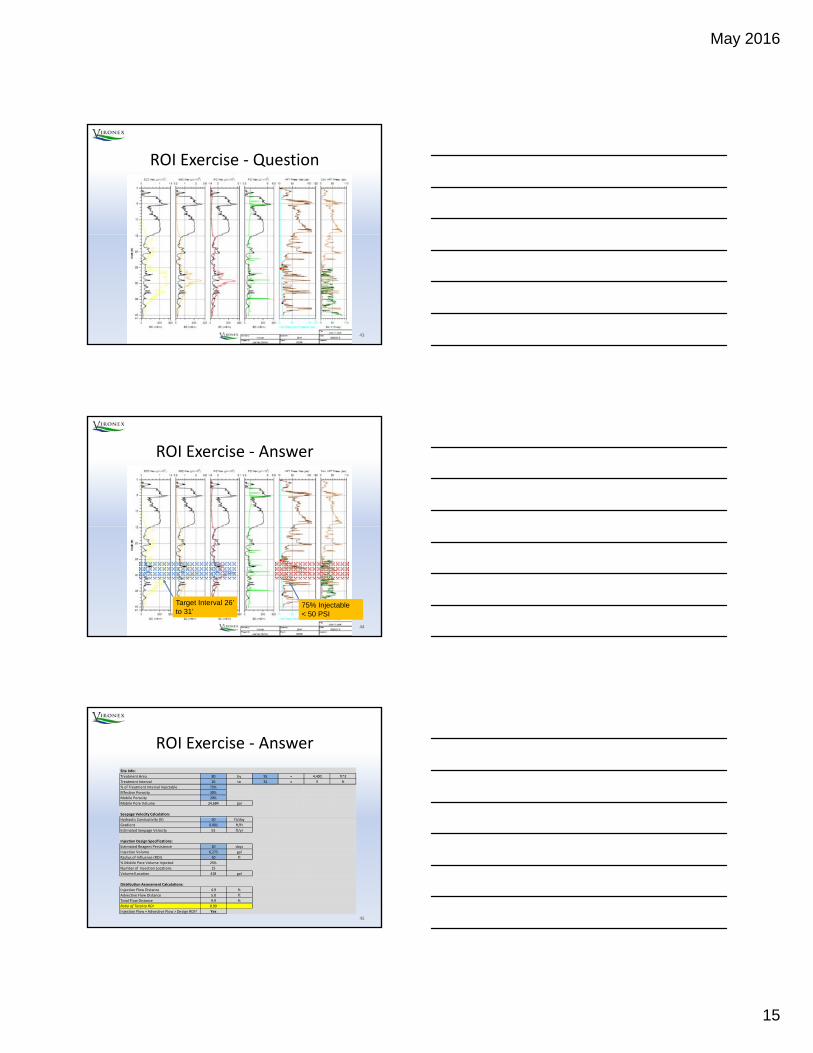
May 2016
15
ROI Exercise ‐ Question
43
ROI Exercise ‐ Answer
Target Interval 26’ to 31’
75% Injectable< 50 PSI
44
ROI Exercise ‐ Answer
Site Info:
Treatment Area 80 by 55 = 4,400 ft^2
Treatment Interval 26 to 31 = 5 ft
% of Treatment Interval Injectable 75%
Effective Porosity 30%
Mobile Porosity 20%
Mobile Pore Volume 24,684 gal
Seepage Velocity Calculation:
Hydraulic Conductivity (K) 50 ft/day
Gradient 0.001 ft/ft
Estimated Seepage Velocity 61 ft/yr
Injection Design Specifications:
Estimated Reagent Persistence 30 days
Injection Volume 6,275 gal
Radius of Influence (ROI) 10 ft
% Mobile Pore Volume Injected 25%
Number of Injection Locations 15
Volume/Location 418 gal
Distribution Assessment Calculations:
Injection Flow Distance 4.9 ft
Advective Flow Distance 5.0 ft
Total Flow Distance 9.9 ft
Ratio of Total to ROI 0.99
Injection Flow + Advective Flow > Design ROI? Yes
45