IEEE p802.3bn EPoC
23
IEEE p802.3bn EPoC Channel Model Ad Hoc committee Informative Channel Models
Transcript of IEEE p802.3bn EPoC

IEEE p802.3bn EPoC Channel Model Ad Hoc committee
Informative Channel Models

Agenda
Topology illustrations
Parameter Tables
3/13/2013 Slide 2
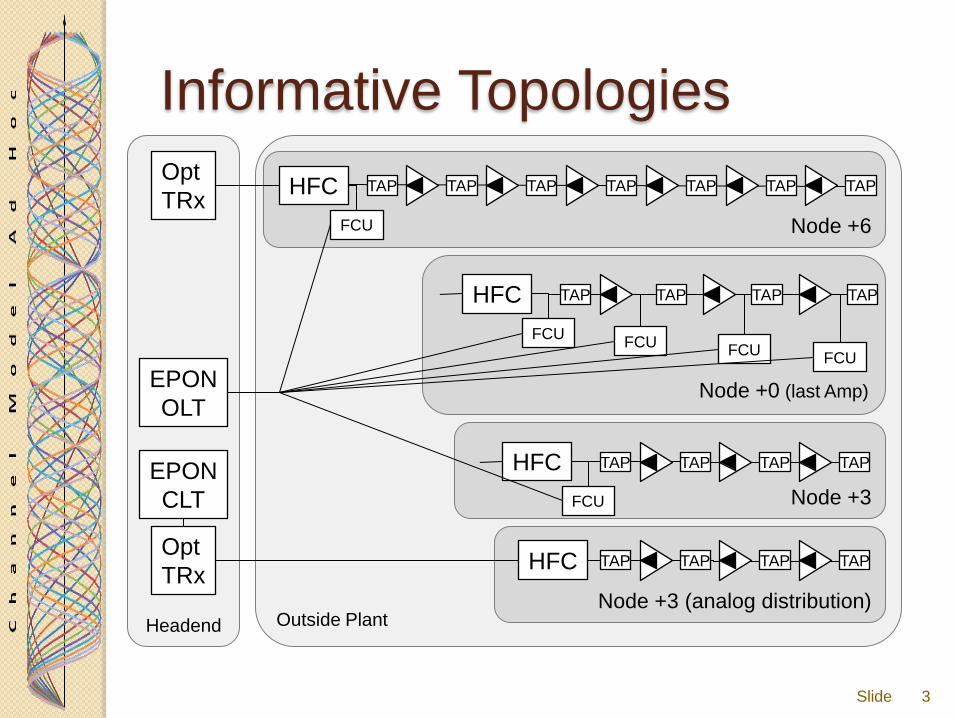
Outside Plant Headend
Informative Topologies
3/13/2013
Slide 3
EPON
OLT
Opt
TRx Node +6 FCU
HFC TAP TAP TAP TAP TAP TAP TAP
Node +3 FCU
TAP HFC TAP TAP TAP
Node +0 (last Amp)
FCU
HFC TAP
FCU FCU
FCU
TAP TAP TAP
Node +3 (analog distribution)
TAP HFC TAP TAP TAP Opt
TRx
EPON
CLT

Drop / Subscriber Premise
3/13/2013 Slide 4
TAP EPoC
CNU X
not specified
Demark
Not Preferred (EPoC Node located in unspecified premise wiring)
RG-6 (+)
Y0 dB ~150 Ft. (45.7 M) max
2-W
ay
N-W
ay

Drop / Subscriber Premise
3/13/2013 Slide 5
TAP
2-W
ay EPoC
Node X
Demark
Better (2-Way splitter integrated with Demark)
RG-6 (+)
Y0 dB ~150 Ft. (45.7 M) max
RG-6
Y3 dB ~xx Ft. (y M) max
N-W
ay
not specified

Drop / Subscriber Premise
3/13/2013 Slide 6
TAP
2-W
ay
N-W
ay
X
not specified
What we dream of … All IP (Demark Gateway with isolated home network)
RG-6 (+) ≤150 Ft. (45.7 M) max
MSO
Managed
User
Managed
EPoC
PHY
Bridge
other
PHY
Demark
EPoC
HGW

Exemplary Parameter Table A (1 of 5)
Node+6 Downstream
7 Slide
System Description
HFC D/S Spectrum 1.0 GHz
Cascade Depth N+6
Channel Loading 48 Analog + 75 Digital
Optical Architecture Linear Optics 1310 nm, nominal link length EPoC Transport
Home Architecture Up to max drop length & 4-way splitter

Exemplary Parameter Table A (2 of 5)
Node+6 Downstream
8 Slide
# Parameters Typical1 Limit Notes/Dependency
Spectrum 1 Frequency range 54 MHz - 1 GHz
2 OFDM Bandwidth 192 MHz
RF Level 3 OFDM Power at CPE Input (dBmV)15 dBmV, 100 ft,
2-way
10 dBmV,
150 ft, 4-way Notes 2-4
6 MHz BW -2 -14
24 MHz BW 4 -8
96 MHz BW 10 -2
192 MHz BW 14 2 Note 5
SNR 4 SCN Ratio (Signal to Composite Noise Ratio) 43 40 Note 6
Variation over 6 MHz BW (dB) N/A N/A Reference Basis 6 MHz
Variation over 24 MHz BW (dB) 1.5 3.5
Variation over 96 MHz BW (dB) 2.5 4.5
Variation over 192 MHz BW (dB) 3.0 5.0

Exemplary Parameter Table A (3 of 5)
Node+6 Downstream
9 Slide
# Parameters Typical1 Limit Notes/Dependency
Interference 5 CTB Interference (20 kHz BW) Note 7-8
Narrowband # of interfered subcarriers @ 30-35 dBc 0% 1%
35-40 1% 0%
40-45 0% 0%
>45 0% 0%
6 CSO Interference (20 kHz BW) Note 9
# of interfered subcarriers @ 30-35 dBc 0% 2%
35-40 0% 0%
40-45 2% 0%
45-50 0% 0%
>50 0% 0%
7 LTE Interference
D/S Bandwidth (MHz) 10 40
Level, dBc (PSD) -30 -30
U/S Bandwidth (MHz) 10 10
Level, dBc (PSD) -40 -5
8 Additive Interference (other) Additional bands TBD
Range of dBc -41 -29 CL 1997 Report
Percentage of effected subcarriers 1 1
Wideband 9 Burst Interference Note 10
Bandwidth (MHz) 30 TBD
Level, dBc (PSD) -20 -5
Duration (usec) 16 25
Period (Hz) Infrequent 10
10 Impulse (white) Noise Laser Clipping
Level, dBc (PSD) -25 -25 Note 11
Duration (nsec) 0.5 0.5
Period (kHz) 10 10

Exemplary Parameter Table A (4 of 5)
Node+6 Downstream
10 Slide
# Parameters Typical1 Limit Notes/Dependency
Freq Response
Amplitude 11 Amplitude Slope Note 12
dB/MHz 0.01 0.02
12 Amplitude Variation
(dB pk-pk/6 MHz) 1.5 6
(dB pk-pk/24 MHz) 3.5 8
(dB pk-pk/192 MHz) 6 11 (dB pk-pk/Total DS BW) 10 15
Phase 13 Group Delay Variation, nsec
Over 24 MHz
Mid Band 50 100
Band Edge (24 MHz) 290 340Over 192 MHz
Mid Band 400 800
Band Edge (24 MHz) 640 1040
Echo 14 Echo Profile, dBc 99% SCTE-40 Note 13-14
.5 usec -20 -10
1 usec -25 -15
1.5 usec -30 -20
2 usec -35
3 usec -40
4.5 usec -45 -30
5 usec -50
Spurious Modulation 15 AM/Carrier hum modulation 3% 5%

Exemplary Parameter Table A (5 of 5)
Notes
1 If not defined otherwise, assume typically behaving link but where the behavior is the worst (freq, location)
2 Frequency dependence of coax for broadband calculations: Loss B (dB) = Loss A (dB) x SQRT(B/A)
3 Reference virtual port level for 6 MHz signal at 1 GHz; 15 dBmV Tap port level, 100 ft drop, 2-way splitter
4 (Max Freq - OFDM BW) spectrum range used for drop loss
5 Small drop slope effect on calculation
6 SCN includes HFC geography impact (location in cascade depth)
7 50 kHz Subchannel Reference, Live Video, fully contained within subchannel
Subcarriers with Interference (50 kHz subcarriers): Every 70 subcarriers, a cluster of three interfers: I 0 , I0 + 25 kHz, I0 - 25 kHz
8 Typ = CTB/CSO Worst Case Freq; Good CTB/CSO in low-distortion band, Analog contiguous at low end of band
NCTA measurement method (avg); Error rate simulation should account for PAR and peak durations
9 Worst spectrum regions for CTB and CSO are not the same
10 D/S Burst Characterization in process; BW based on percentage of errored carriers in 8-Channel wide DOCSIS CM
Duration based on large scale CM sweep of UCER with known interleaver settings; Levels per ReDesign channel model
11 Laser Clipping PSD captured in SCN for out-of-band EPoC Signals
12 Typical tilt, first tap, not equalized, 50 ft drop assumed (Minimum drop impact)
13 Echo mask range for a Single Dominant echo - Does not imply an assumptions about multiple echoes.
14 Meas@700-800 MHz, representive of 99% of modems
Node+6 Downstream
11 Slide

Exemplary Parameter Table B (1 of 4)
Node+3 digital distribution Downstream
(Notes not repeated)
12 Slide
System Description
HFC D/S Spectrum 1.0 GHz
Cascade Depth N+3
Channel Loading All Digital
Optical Architecture Linear Optics 1310 nm, EPoC RF Coupled after Node
Home Architecture Up to max drop length & 4-way splitter

Exemplary Parameter Table B (2 of 4)
Node+3 digital distribution Downstream
13 Slide
# Parameters Typical1 Limit Notes/Dependency
Spectrum 1 Frequency range 54 MHz - 1 GHz
2 OFDM Bandwidth 192 MHz
RF Level 3 OFDM Power at CPE Input (dBmV)15 dBmV, 100 ft,
2-way
10 dBmV,
150 ft, 4- Notes 2-4
6 MHz BW -2 -14
24 MHz BW 4 -8
96 MHz BW 10 -2
192 MHz BW 14 2 Note 5
SNR 4 SCN Ratio (Signal to Composite Noise Ratio) 45 41 Note 6
Variation over 6 MHz BW (dB) N/A N/A Reference Basis 6 MHz
Variation over 24 MHz BW (dB) 1.5 3.5
Variation over 96 MHz BW (dB) 2.5 4.5
Variation over 192 MHz BW (dB) 3.0 5.0

Exemplary Parameter Table B (3 of 4)
Node+3 digital distribution Downstream
14 Slide
# Parameters Typical1 Limit Notes/Dependency
Interference 5 CTB Interference (20 kHz BW) N/A N/A Note 7-8
Narrowband # of interfered subcarriers @ 30-35 dBc
6 CSO Interference (20 kHz BW) N/A N/A Note 9
# of interfered subcarriers @ 30-35 dBc
7 LTE Interference
D/S Bandwidth (MHz) 10 40
Level, dBc (PSD) -30 -30
U/S Bandwidth (MHz) 10 10
Level, dBc (PSD) -40 -5
8 Additive Interference (other) Additional bands TBD
Range of dBc -41 -29 CL 1997 Report
Percentage of effected subcarriers 1 1
Wideband 9 Burst Interference Note 10
Bandwidth (MHz) 30 TBD
Level, dBc (PSD) -20 -5
Duration (usec) 16 25
Period (Hz) Infrequent 10
10 Impulse (white) Noise
Level, dBc (PSD) N/A N/A Note 11
Duration (nsec) N/A N/A
Period (kHz) N/A N/A

Exemplary Parameter Table B (4 of 4)
Node+3 digital distribution Downstream
15 Slide
# Parameters Typical1 Limit Notes/Dependency
Freq Response
Amplitude 11 Amplitude Slope Note 12
dB/MHz 0.01 0.02
12 Amplitude Variation
(dB pk-pk/6 MHz) 1.5 6
(dB pk-pk/24 MHz) 3.5 8
(dB pk-pk/192 MHz) 6 11 (dB pk-pk/Total DS BW) 10 15
Phase 13 Group Delay Variation, nsec
Over 24 MHz
Mid Band 50 100
Band Edge (24 MHz) 290 340Over 192 MHz
Mid Band 400 800
Band Edge (24 MHz) 640 1040
Echo 14 Echo Profile, dBc 99% SCTE-40 Note 13-14
.5 usec -20 -10
1 usec -25 -15
1.5 usec -30 -20
2 usec -35
3 usec -40
4.5 usec -45 -30
5 usec -50
Spurious Modulation 15 AM/Carrier hum modulation 3% 5%
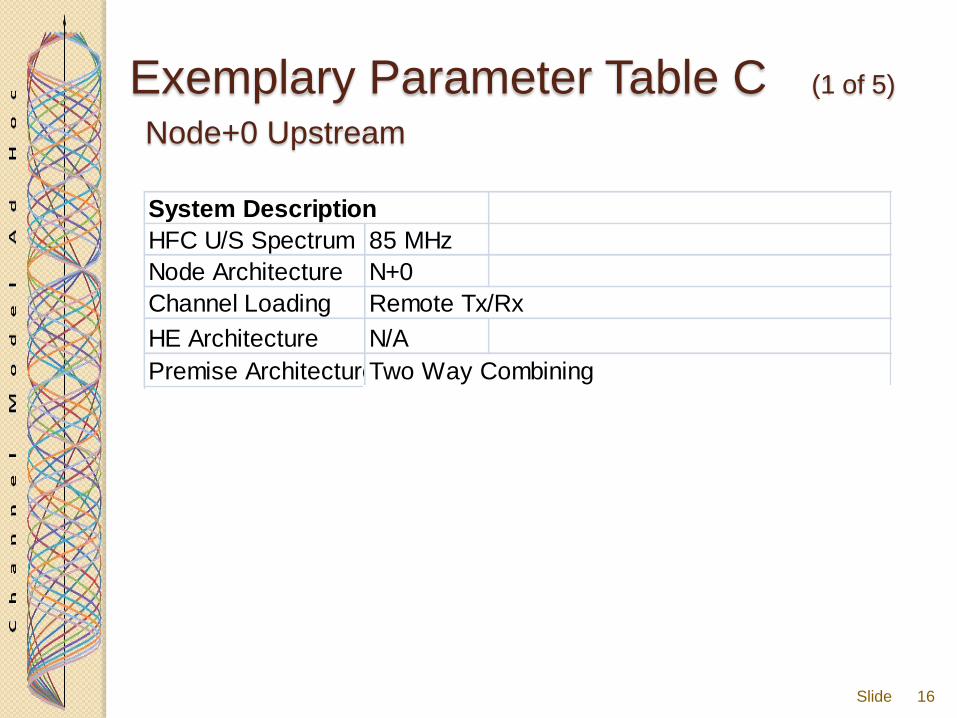
Exemplary Parameter Table C (1 of 5)
Node+0 Upstream
16 Slide
System Description
HFC U/S Spectrum 85 MHz
Node Architecture N+0
Channel Loading Remote Tx/Rx
HE Architecture N/A
Premise ArchitectureTwo Way Combining

Node+0 Upstream
17 Slide
Exemplary Parameter Table C (2 of 5)
# Parameters Typical1 Limit Notes/Dependencies
Spectrum 1 OFDM Bandwidth 48
2 Frequency range 37-85 MHz
Path Loss 3 Path Loss 44 50 Max loss to first active
Variation Freq, 6.4 MHz BW 1 1 Note 1Variation Freq, 24 MHz BW 2.5 2
Variation Freq, 80 MHz BW 5 5
Added Noise 4 Input Noise PSD N/A N/A

Node+0 Upstream
18 Slide
Exemplary Parameter Table C (3 of 5)
# Parameters Typical1 Limit Notes/Dependencies
Interference 5 FM Band Interference N/A N/A Overload concern only
Narrowband Bandwidth Out of Band Out of Band
Level, dBc (PSD) -40 TBD Note 2
6 Common Path Distortion
dBc N/A -32 50 kHz subcarriers
% effected subcarriers N/A 3%
7 Other Known Bands TBD New Upstream
dBc -50 -10 Note 3
Wideband % effected subcarriers 1% 0.5% 50 kHz subcarriers
8 Burst Interference Note 4
Bandwidth (MHz) TBD TBDNon-white
characteristics (Note 5)
Level, dBc (PSD) 0 -10
Duration (usec) 1 10
Period (Hz)1000 1000
9 Impulse (white) Noise N/A N/A
Level, dBc (PSD)
Duration (nsec)
Period (kHz)

Node+0 Upstream
19 Slide
Exemplary Parameter Table C (4 of 5)
# Parameters Typical1 Limit Notes/Dependencies
Freq Response
Amplitude 10 Amplitude Slope N/A N/A
Captured in Path Loss
Range
11 Amplitude Variation
SCTE Definition, Echo
not included
(dB pk-pk/24 MHz) 1 2.5
(dB pk-pk/48 MHz) 1.5 4.0
Phase 12
Group Delay Variation
(ns/MHz)
Over 24 MHz 12 85
Over 48 MHz 82 100
Echo 13 Delay Spread Profile, dBc Note 6-7
.5 usec -15 -10
1 usec -20 -20
1.5 usec -25 -30
2 usec -30 -302.5 usec -35 -30
3 usec -40 -30
4 usec
Spurious Modulation 14 AM/Carrier hum modulation 5% 7%
20
Node+0 Upstream
Slide
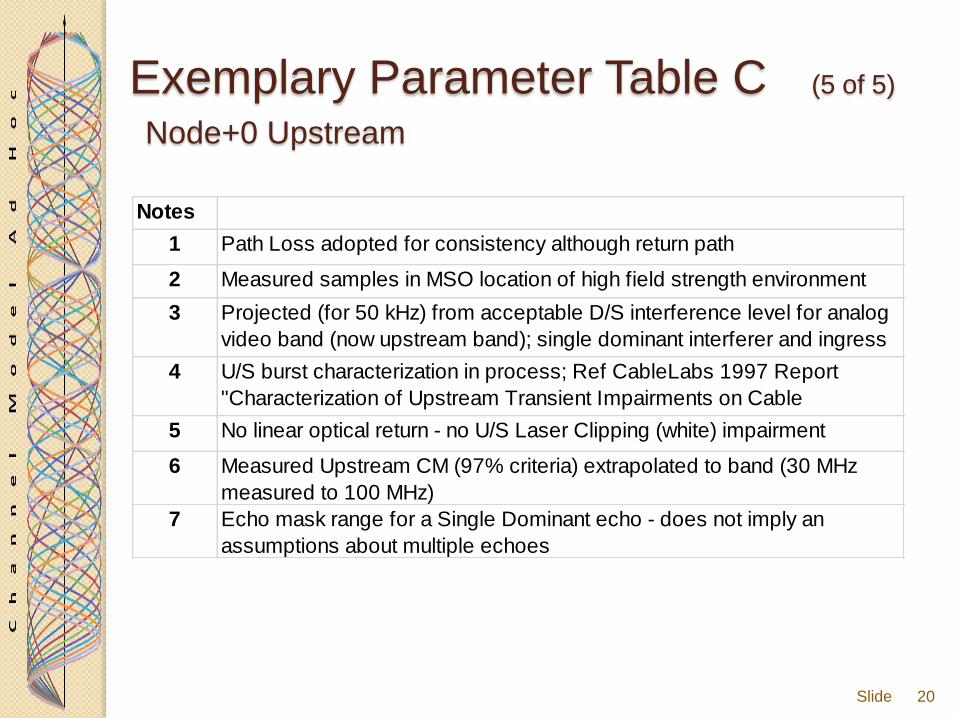
Exemplary Parameter Table C (5 of 5)
Notes
1 Path Loss adopted for consistency although return path
2 Measured samples in MSO location of high field strength environment
3 Projected (for 50 kHz) from acceptable D/S interference level for analog
video band (now upstream band); single dominant interferer and ingress
point4 U/S burst characterization in process; Ref CableLabs 1997 Report
"Characterization of Upstream Transient Impairments on Cable
Television Systems"5 No linear optical return - no U/S Laser Clipping (white) impairment
6 Measured Upstream CM (97% criteria) extrapolated to band (30 MHz
measured to 100 MHz)
7 Echo mask range for a Single Dominant echo - does not imply an
assumptions about multiple echoes
THANK YOU
3/13/2013 Slide 21

Baseline Channel Topology
Node +3 (digital
EPON distribution)
3/13/2013 Slide 22
Topology parameters needed:
1. Optical reach of HFC networks
2. Optical reach of EPON networks per 802.3
3. All digital channel loading assumed
4. Amplifier spacing; typical and max. ex: typical ≤ 800 ft. maximum ≤ 1500 ft.
5. Feeder cable types; ??
6. Drop Cable types & reach
• RG 6, ≤ 150 ft. (45.7 M)
EPON
OLT
FCU
FCU
HFC Opt
TRx TAP TAP
FCU
FCU
TAP TAP

Drop / Subscriber Premise
3/13/2013 Slide 23
TAP
2-W
ay
N-W
ay
EPoC
CNU
RG-6 (+)
Y0 dB ~150 Ft. (45.7 M) max
RG-6
Y2 dB < 6 Ft. (y M) max
not specified
RG-59?
X
Demark
Baseline