mathematical connections at school - Mathematik und ihre Didaktik
12
MATHEMATICAL CONNECTIONS AT SCHOOL Understanding and facilitating connections in mathematics Swetlana NORDHEIMER Humboldt-Universität zu Berlin, Institut für Mathematik, Rudower Chaussee 25, 12489 Berlin, Germany [email protected] ABSTRACT For nearly 20 years the National Council of Teachers of Mathematics (1989, 2000) has recommended that teachers enable pupils to recognise and to use connections among mathematical ideas. This state- ment is consistent with developments in mathematical education globally. Combinations of epistemo- logical and sociological approaches like those of Heintz to describe connections in mathematics as a science, provide useful tools for examining ways in which teachers support the making of connections, for instance between school mathematics and everyday life of pupils or between different fields of mathematics: geometry, algebra and stochastics. In order to deepen the understanding of connections in the school environment the author starts with presenting some modern approaches to mathematics as a science. The author then goes on to draw conclusions for enabling connections in the mathematical classroom by constructing problem-nets as a special learning environment. On the basis of diverse examples of application at school the transfer to the practice of mathematical education is established. 1 Connections in mathematics as a science Educational standards all over the world (for example NSC in South Africa, NTSM in USA, diverse curricula in Germany) recommend that teachers enable pupils to recog- nise and to make connections among mathematical ideas. Therefore the main question of this paper is: How can teachers support the discovery of connections between dif- ferent fields of mathematics: geometry, algebra and stochastics? To understand the nature of mathematical connections it could be helpful to look at connections in mathematics as a science. Therefore, the author will first look at how the work of mathematicians from different fields is often necessary in order to produce new re- sults. Then, the author will give an example from a learning environment which will illustrate how interdependence of epistemic and sociological aspects of mathematical connections can be taken into account when teaching mathematics. In recent studies epistemological aspects of mathematics are seen in their interde- pendence with sociological aspects (Heintz 2000, Prediger 2002). According to that, interconnections in mathematics refer not only to mathematical objects and scientific topics but also to the cooperation among mathematicians. Thereby high theoretical coherence as epistemic component and wide spread of social consensus is recognised as a characteristic quality of mathematics. Partly seriously and partly joking, mathematicians use the Erdős number to describe social structure of the mathematics. Paul Erdős has written over 1400 papers with over 500 co-authors. His productivity inspired the concept of the Erdős number. Jerry Grossman (see “The Erdős Number Project” 2009) and his colleges define Erdős number in the following way: “In graph-theoretic terms, the mathematics research collaboration graph C has all mathematicians as its vertices; the vertex p is Paul
Transcript of mathematical connections at school - Mathematik und ihre Didaktik

MATHEMATICAL CONNECTIONS AT SCHOOL
Understanding and facilitating connections in mathematics
Swetlana NORDHEIMER
Humboldt-Universität zu Berlin, Institut für Mathematik,
Rudower Chaussee 25,
12489 Berlin, Germany
ABSTRACT
For nearly 20 years the National Council of Teachers of Mathematics (1989, 2000) has recommended
that teachers enable pupils to recognise and to use connections among mathematical ideas. This state-
ment is consistent with developments in mathematical education globally. Combinations of epistemo-
logical and sociological approaches like those of Heintz to describe connections in mathematics as a
science, provide useful tools for examining ways in which teachers support the making of connections,
for instance between school mathematics and everyday life of pupils or between different fields of
mathematics: geometry, algebra and stochastics.
In order to deepen the understanding of connections in the school environment the author starts with
presenting some modern approaches to mathematics as a science. The author then goes on to draw
conclusions for enabling connections in the mathematical classroom by constructing problem-nets as a
special learning environment. On the basis of diverse examples of application at school the transfer to
the practice of mathematical education is established.
1 Connections in mathematics as a science
Educational standards all over the world (for example NSC in South Africa, NTSM in
USA, diverse curricula in Germany) recommend that teachers enable pupils to recog-
nise and to make connections among mathematical ideas. Therefore the main question
of this paper is: How can teachers support the discovery of connections between dif-
ferent fields of mathematics: geometry, algebra and stochastics? To understand the
nature of mathematical connections it could be helpful to look at connections in
mathematics as a science. Therefore, the author will first look at how the work of
mathematicians from different fields is often necessary in order to produce new re-
sults. Then, the author will give an example from a learning environment which will
illustrate how interdependence of epistemic and sociological aspects of mathematical
connections can be taken into account when teaching mathematics.
In recent studies epistemological aspects of mathematics are seen in their interde-
pendence with sociological aspects (Heintz 2000, Prediger 2002). According to that,
interconnections in mathematics refer not only to mathematical objects and scientific
topics but also to the cooperation among mathematicians. Thereby high theoretical
coherence as epistemic component and wide spread of social consensus is recognised
as a characteristic quality of mathematics.
Partly seriously and partly joking, mathematicians use the Erdős number to describe
social structure of the mathematics. Paul Erdős has written over 1400 papers with
over 500 co-authors. His productivity inspired the concept of the Erdős number. Jerry
Grossman (see “The Erdős Number Project” 2009) and his colleges define Erdős
number in the following way: “In graph-theoretic terms, the mathematics research
collaboration graph C has all mathematicians as its vertices; the vertex p is Paul

Erdős. There is an edge between vertices u and v if u and v have published at least one
mathematics article together. We will usually adopt the most liberal interpretation
here, and allow any number of other co-authors to be involved; for example, a six-
author paper is responsible for 15 edges in this graph, one for each pair of authors.
Other approaches would include using only two-author papers (we do consider this as
well), or dealing with hypergraphs or multigraphs or multihypergraphs. The Erdős
number of v, then, is the distance (length, in edges, of the shortest path) in C from v to
p. The set of all mathematicians with a finite Erdős number is called the Erdős com-
ponent of C. It has been conjectured that the Erdős component contains almost all
present-day publishing mathematicians (and has a not very large diameter), but per-
haps not some famous names from the past, such as Gauss. Clearly, any two people
with a finite Erdős number can be connected by a string of co-authorships, of length at
most the sum of their Erdős numbers (see http://www.oakland.edu/enp/readme/).”
Based on information in the database of the American Mathematical Society‟s
Mathematical Reviews, an automatic collaborations distance calculator was created
to determine Erdős numbers. Referring to that, e.g. Andrew Wiles has Erdős number
3. Furthermore, the automatic distance calculator can help to find the distance be-
tween two different mathematicians in accordance to their co-authorships. Even if
Grossman sees Erdős numbers just as a silly game, which have nothing to do with a
mathematician's status or the quality of his work, such games illustrate the importance
of cooperation on a social level and shows how intensely mathematicians are working
with each other. However, it does not provide more detailed information about the
content or topics of their communication (Hischer 2010).
These are represented in the variety of mathematical publications listed for example in
Zentralblatt MATH (Z-MATH). This is an online Database, which contains about 2.9
million entries drawn from about 3500 journals and 1100 serials starting from 1868
and even earlier to the present. To categorise items in the mathematical science litera-
ture, Z-MATH uses the Mathematics Subject Classification (MSC). The MSC is a
hierarchical scheme with three levels of structure. At the top level there are 64
mathematical disciplines. Examples for such disciplines are Number theory (11-XX),
Algebraic geometry (14-XX), Probability theory and stochastic processes (60-XX). As
a tree structure MSC itself is not networked. The network qualities of Z-MATH come
from the papers itself. Consequently, every paper is related to chosen disciplines and
connects them by these means. Since every paper was written by one or more authors
it connects people too. In this sense, we can see mathematical papers as representa-
tions of mathematical connections at the epistemic and social level at the same time.
Furthermore, Z-MATH makes it possible to observe the development of mathematical
inquiries from outside across time. An example for this idea is given below (see Fig-
ure 1). This entry from Z-MATH shows a paper that connects two mathematicians
and three mathematical disciplines.
Zbl 0823.11030 Taylor, Richard; Wiles, Andrew Ring-theoretic properties of certain Hecke algebras. (English) Ann. Math. (2) 141, No. 3, 553-572 (1995). ISSN 0003-486X Classification : 11G05 Elliptic curves over global fields 11F11 Modular forms, one variable 11D41 Higher degree Diophantine equations 13C40 Linkage, complete intersections and determinantal ideals 14M10 Complete intersections 14H52 Elliptic curves
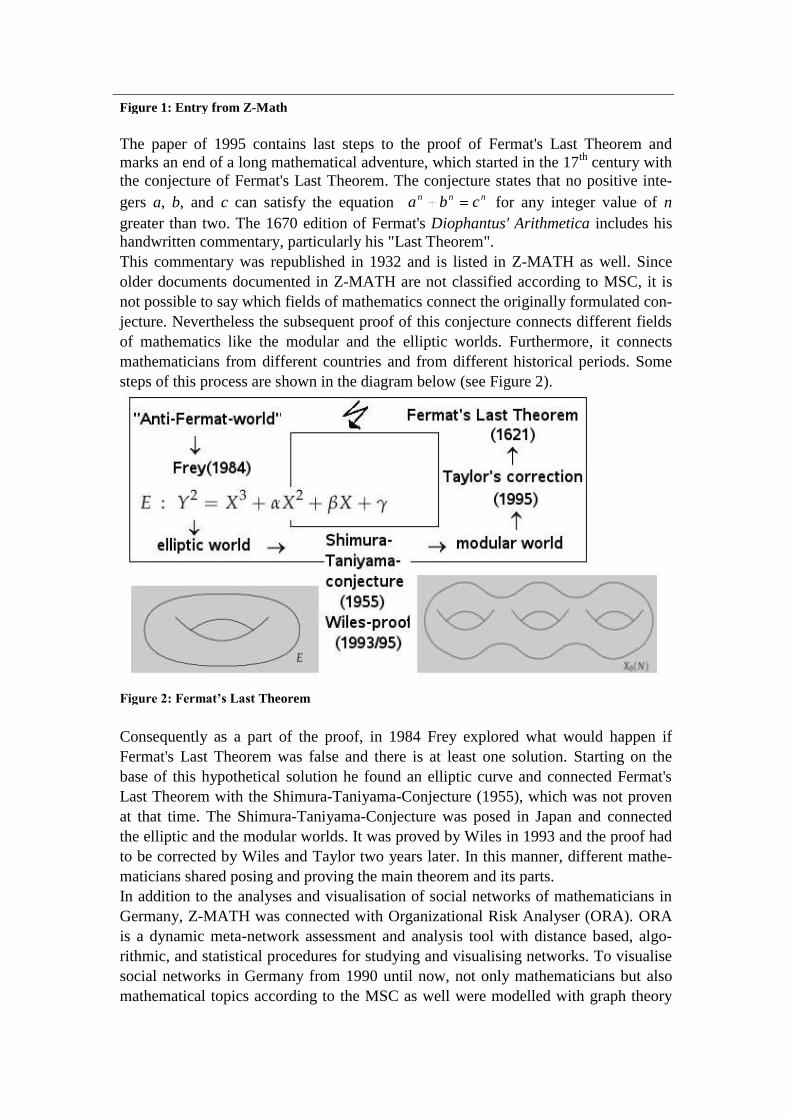
Figure 1: Entry from Z-Math
The paper of 1995 contains last steps to the proof of Fermat's Last Theorem and
marks an end of a long mathematical adventure, which started in the 17th
century with
the conjecture of Fermat's Last Theorem. The conjecture states that no positive inte-
gers a, b, and c can satisfy the equation nnn cba for any integer value of n
greater than two. The 1670 edition of Fermat's Diophantus' Arithmetica includes his
handwritten commentary, particularly his "Last Theorem".
This commentary was republished in 1932 and is listed in Z-MATH as well. Since
older documents documented in Z-MATH are not classified according to MSC, it is
not possible to say which fields of mathematics connect the originally formulated con-
jecture. Nevertheless the subsequent proof of this conjecture connects different fields
of mathematics like the modular and the elliptic worlds. Furthermore, it connects
mathematicians from different countries and from different historical periods. Some
steps of this process are shown in the diagram below (see Figure 2).
Figure 2: Fermat’s Last Theorem
Consequently as a part of the proof, in 1984 Frey explored what would happen if
Fermat's Last Theorem was false and there is at least one solution. Starting on the
base of this hypothetical solution he found an elliptic curve and connected Fermat's
Last Theorem with the Shimura-Taniyama-Conjecture (1955), which was not proven
at that time. The Shimura-Taniyama-Conjecture was posed in Japan and connected
the elliptic and the modular worlds. It was proved by Wiles in 1993 and the proof had
to be corrected by Wiles and Taylor two years later. In this manner, different mathe-
maticians shared posing and proving the main theorem and its parts.
In addition to the analyses and visualisation of social networks of mathematicians in
Germany, Z-MATH was connected with Organizational Risk Analyser (ORA). ORA
is a dynamic meta-network assessment and analysis tool with distance based, algo-
rithmic, and statistical procedures for studying and visualising networks. To visualise
social networks in Germany from 1990 until now, not only mathematicians but also
mathematical topics according to the MSC as well were modelled with graph theory

like vertices and publications as edges between these vertices (see Figure 3). In order
not to expand the document length unnecessarily, only the titles of selected MSC-
disciplines are listed in here. Nevertheless, Figure 3 helps us to imagine mathematical
interconnections not only as connections of scientific topics, but as connections within
the scientific community of mathematicians too.
Figure 3: Mathematical connections in Germany (1990-2010)
What can we learn from this about the nature of mathematical connections for teach-
ing mathematics? Firstly, it shows those disciplines which show more connections to
other fields like numerical analysis and computer science. If mathematicians cannot
find classical solutions for the problems posed in their own discipline, they cooperate
with their colleagues who are studying e.g. Numerical Methods or dealing with Com-
puter Science. Secondly, even the titles of the disciplines like Algebraic Geometry
reveal to school teachers, that many connections should be possible between algebra
and geometry. Thirdly we see, that connecting the fairly recent discipline of probabil-
ity theory with other disciplines can challenge not only pupils but experienced
mathematicians as well. In addition to all of this, we see that segmenting mathematics
as a scientific field in disciplines and topics is very important in order to classify
mathematical objects on an epistemological level. This conclusion facilitates the seg-
menting of school mathematics in fields like geometry, algebra and stochastics as a
premise for making and understanding connections. Hence, segmenting teaching ma-
terial and the student's mathematical knowledge into categories as in the usual way in
curricula, schoolbooks and teacher preparations should be maintained. In addition to
segmenting school mathematics it is important to create situations where students can
combine their knowledge from different segments of school mathematics. This is al-
ready being done when teachers deal with connections among geometrical and alge-
braic aspects for example, by using functions to describe geometrical concepts or cal-
culating areas. Nevertheless, incorporating stochastics would be the most innovative
step forward.
That is the reason why problems, which refer to different mathematical fields, should
be given to the students. They should recognise and establish connections among
mathematical ideas. Problems like those could be presented to the students for exam-
ple at the end of the school year. It is with thanks to the cooperation of mathemati-
cians that mathematical connections eventually emerge. Students, therefore, should be
encouraged to cooperate by working on such problems. Segmenting school mathemat-
ics on one hand, and creating learning environments (where it is possible to weaken
the borders between these segments) on the other are two interdependent factors of
making connections at school.
2 Making connections with PYTHAGORAS-TREE
To review different “segments” of school-mathematics students could be divided into
five or six small groups for solving problems together and sharing their solutions with
the whole group. As the history of Fermat's Last Theorem teaches us, it is necessary to
find mathematical problems or contexts, which would connect different segments of
school mathematics (algebra, geometry and stochastics) on the one hand, and moti-
vate students to cooperate, on the other hand. An example for a mathematical context,
which could fulfil the above described pedagogical hopes, will be given in the next
chapter. Figure 4 shows a diagram which illustrates how students of 9th and 10th
grade at a grammar school in Berlin worked on the given problems in the context of
the Pythagoras-tree.
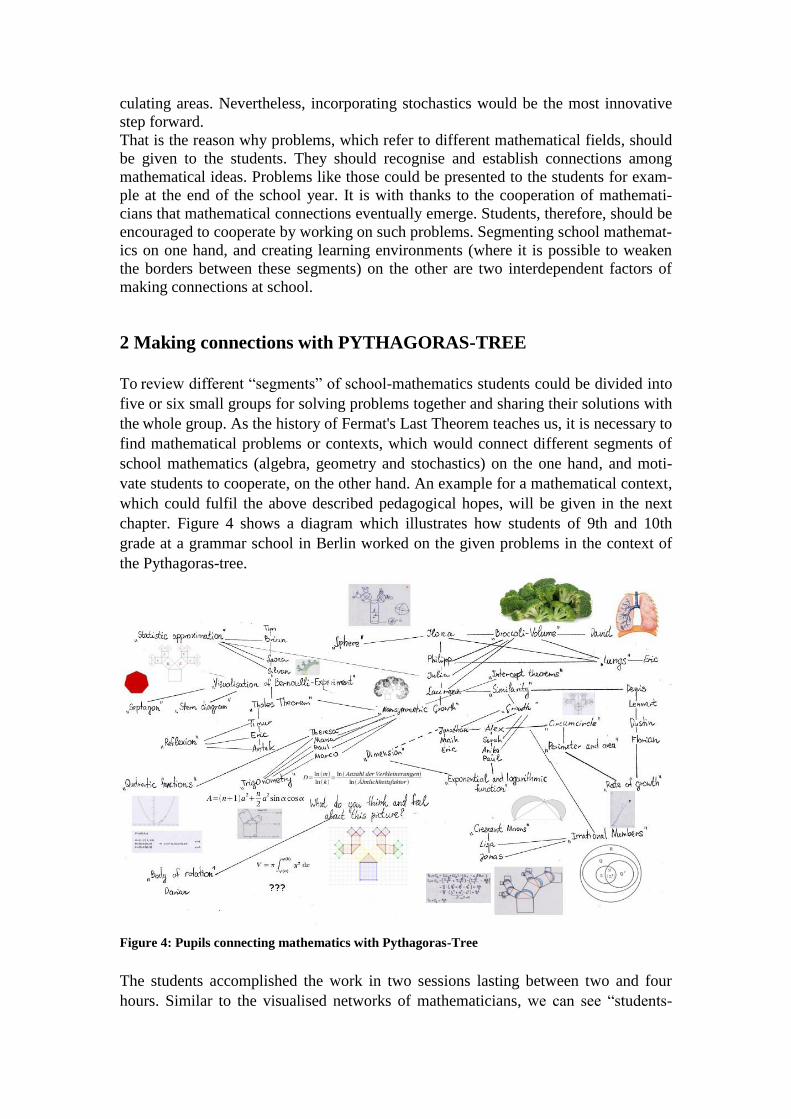
Figure 4: Pupils connecting mathematics with Pythagoras-Tree
The students accomplished the work in two sessions lasting between two and four
hours. Similar to the visualised networks of mathematicians, we can see “students-
networks” around the Pythagoras-Tree. We can also see the names of students as
“mathematicians”, mathematical topics and titles of the problems illustrated with
some pictures.
To give an idea of how the context of Pythagoras-Tree could be used in the mathe-
matical classroom in order to enable students to recognise connections by cooperat-
ing, a learning environment, which was tested at school, will be described in the fol-
lowing. The learning environment included a short text with general information on
the Pythagoras-Tree and initial problems, which are related to major topics of school
mathematics.
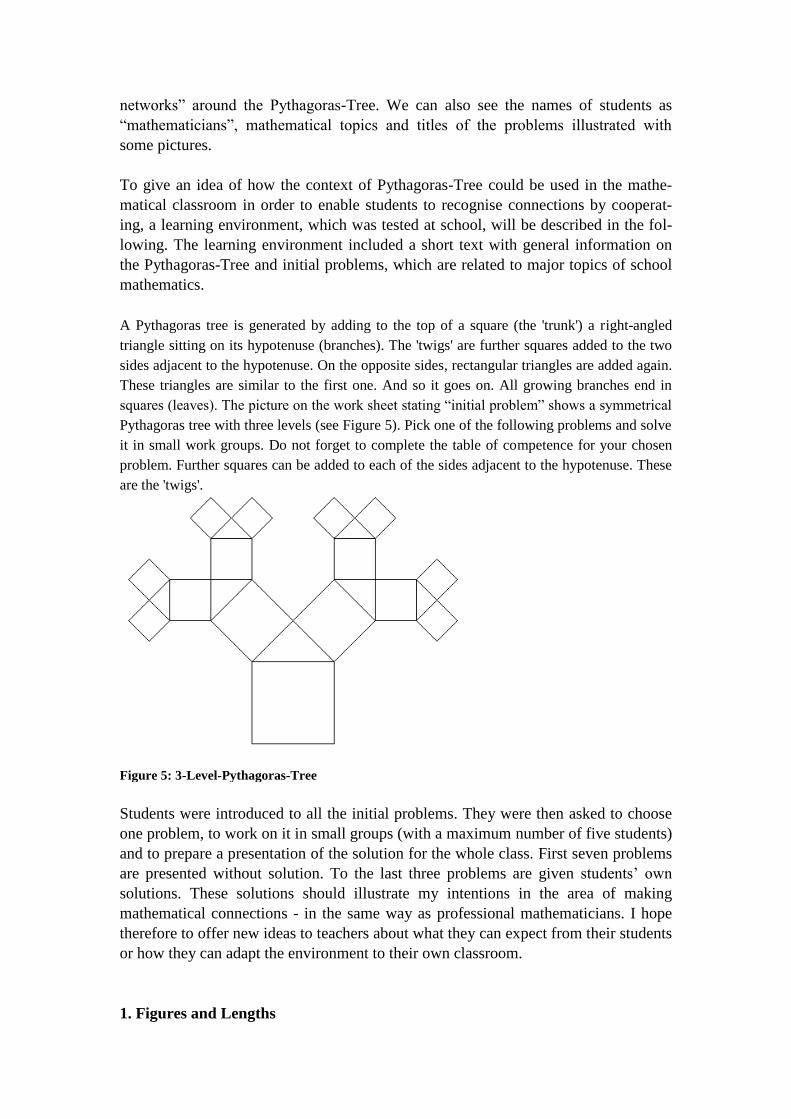
A Pythagoras tree is generated by adding to the top of a square (the 'trunk') a right-angled
triangle sitting on its hypotenuse (branches). The 'twigs' are further squares added to the two
sides adjacent to the hypotenuse. On the opposite sides, rectangular triangles are added again.
These triangles are similar to the first one. And so it goes on. All growing branches end in
squares (leaves). The picture on the work sheet stating “initial problem” shows a symmetrical
Pythagoras tree with three levels (see Figure 5). Pick one of the following problems and solve
it in small work groups. Do not forget to complete the table of competence for your chosen
problem. Further squares can be added to each of the sides adjacent to the hypotenuse. These
are the 'twigs'.
Figure 5: 3-Level-Pythagoras-Tree
Students were introduced to all the initial problems. They were then asked to choose
one problem, to work on it in small groups (with a maximum number of five students)
and to prepare a presentation of the solution for the whole class. First seven problems
are presented without solution. To the last three problems are given students‟ own
solutions. These solutions should illustrate my intentions in the area of making
mathematical connections - in the same way as professional mathematicians. I hope
therefore to offer new ideas to teachers about what they can expect from their students
or how they can adapt the environment to their own classroom.
1. Figures and Lengths

Explore whether rational numbers are sufficient for the description of the possible
side length. How do these lengths relate? Give reasons for your guess.
2. Dependencies
Look at the picture. Which functions describe the dependence of the
area/perimeter on its trunk width? Use all possible ways of presenting a function.
3. Similarity
Which similar shapes do you recognise in the picture? Why are those figures similar?
Give the parameters of similarity. It is said that Pythagoras trees have a similar ap-
pearance to broccoli. What do you think?
4. Estimate
Ask your classmates and teacher to estimate the area of the drawn figure. Find the
mode, median, mean and the span of your sample. Present your results in a boxplot.
Work out the area by using the width „a‟ of the trunk (use your ruler to measure it).
Compare the estimate with the calculated value. What do you see?
5. Continuation
The symmetrical Pythagoras tree can be expanded with no limitations. Which func-
tion would you use to describe the relationship between the area of the leaf and the
number of levels? Find a function to describe this equation and draw a graph. Find the
inverse function. Starting at the trunk, how many levels of a symmetrical Pythagoras
tree do you have to add, in order to end up with a leaf size (area) of 1/128 of the area
of the trunk? Find the number of levels of a Pythagoras tree which possesses more
than one million leaves.
6. General formula for calculating the area
Find the formula for calculating the area of non-symmetrical Pythagoras trees. Satisfy
yourself that this formula is correct. Note: „a‟ is the width of the trunk, „n‟ the number
of levels and „α‟ stands for the base angle.
Additionally: Find the correct formulae for the Pythagoras trees with base angles of
30°, 45° and 60°. Is there anything particular here? How would you explain this?
7. General formula for calculating the circumference
How could you calculate the perimeter of non-symmetrical Pythagoras trees, when the
width of the trunk, the number of levels, and one base angle of the biggest possible
triangle are given? Find a general formula.
Solutions of selected problems
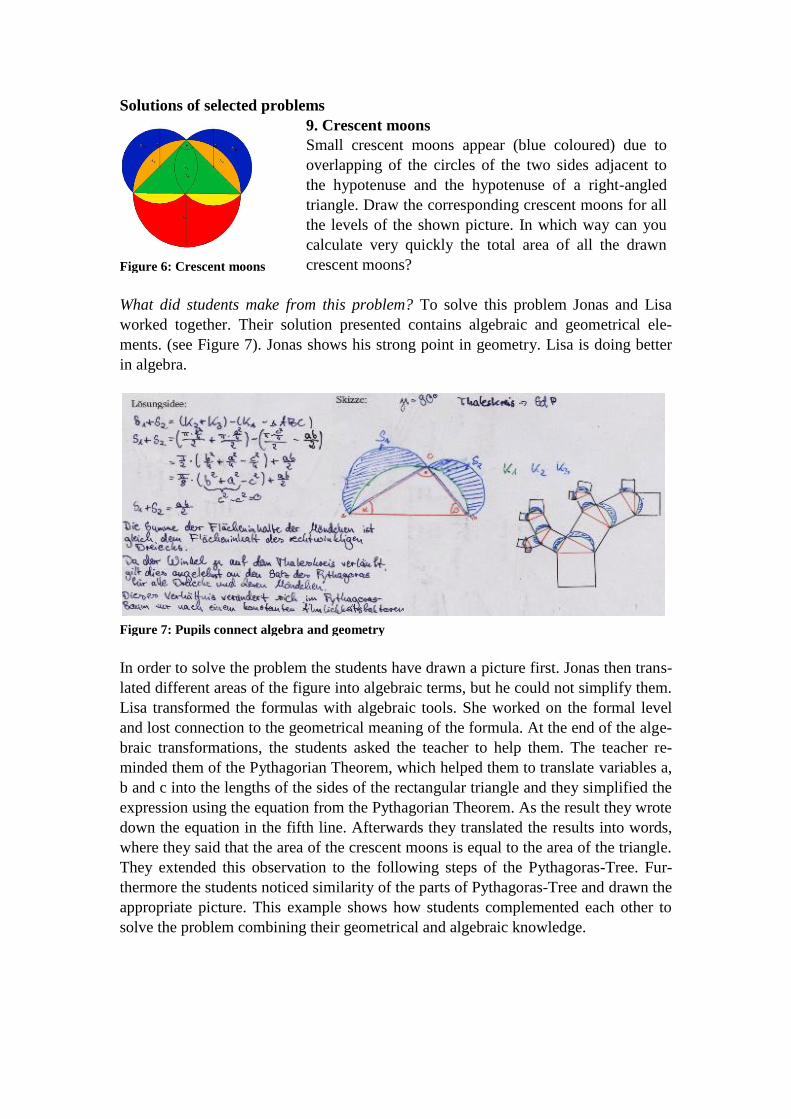
Figure 6: Crescent moons
9. Crescent moons
Small crescent moons appear (blue coloured) due to
overlapping of the circles of the two sides adjacent to
the hypotenuse and the hypotenuse of a right-angled
triangle. Draw the corresponding crescent moons for all
the levels of the shown picture. In which way can you
calculate very quickly the total area of all the drawn
crescent moons?
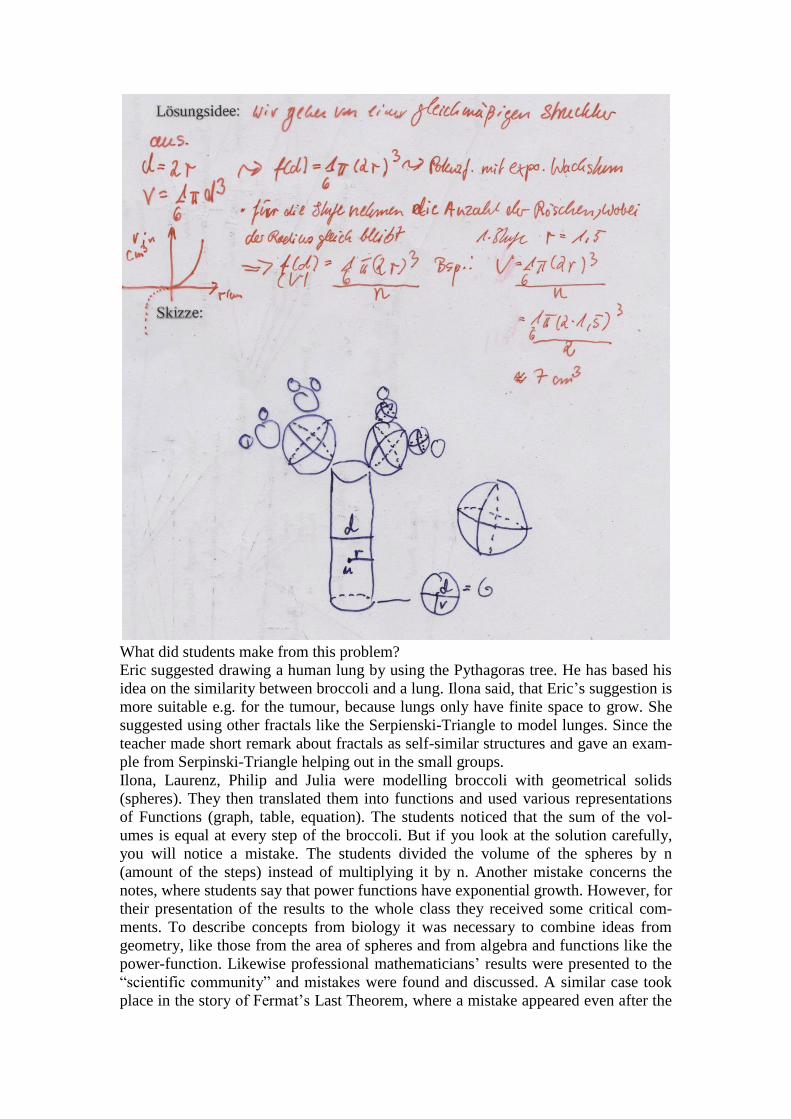
What did students make from this problem? To solve this problem Jonas and Lisa
worked together. Their solution presented contains algebraic and geometrical ele-
ments. (see Figure 7). Jonas shows his strong point in geometry. Lisa is doing better
in algebra.
Figure 7: Pupils connect algebra and geometry
In order to solve the problem the students have drawn a picture first. Jonas then trans-
lated different areas of the figure into algebraic terms, but he could not simplify them.
Lisa transformed the formulas with algebraic tools. She worked on the formal level
and lost connection to the geometrical meaning of the formula. At the end of the alge-
braic transformations, the students asked the teacher to help them. The teacher re-
minded them of the Pythagorian Theorem, which helped them to translate variables a,
b and c into the lengths of the sides of the rectangular triangle and they simplified the
expression using the equation from the Pythagorian Theorem. As the result they wrote
down the equation in the fifth line. Afterwards they translated the results into words,
where they said that the area of the crescent moons is equal to the area of the triangle.
They extended this observation to the following steps of the Pythagoras-Tree. Fur-
thermore the students noticed similarity of the parts of Pythagoras-Tree and drawn the
appropriate picture. This example shows how students complemented each other to
solve the problem combining their geometrical and algebraic knowledge.

Figure 8: Bernoulli-Experiment
10. Multiplication rules
Possible outcomes of a Bernoulli-
Experiment can be visualised with
the Pythagoras tree, very similar to
the probability tree diagram. The
Pythagoras tree has to be read from
the bottom to the top in order to
follow the time line. As at the start
of a Pythagoras tree, there is a
square available for the visualisa-
tion of an experiment at a higher
level.
On each level, the area of each of the newly generated squares will be half that of the
original square. The total of the square area stays the same on each level. The drawing
shows a threefold toss of a coin presented in a Pythagoras tree. What are the benefits
and disadvantages of this way of visualisation in comparison to using a tree diagram?
What did students make from this problem?
After they had discussed the problem above, Eric, Antek and Timur were engaged in
solving the following question: We throw a dice four times in a row and want to know
how often the number six comes up. However, we are unable to show this experiment
in a symmetrical Pythagoras tree. What would a Pythagoras tree look like according
to this experiment? Using Thales' Theorem they have replaced the isosceles right-
angled triangle with a non-isosceles right-angled triangle. This has resulted in the
generation of two squares in level two with a ratio of 1:5. Is this model transferable to
other Bernoulli-Experiments? Find further examples.
Figure 9: Heptagon
Results of Eric, Antek and Timur were pre-
sented to Leona, Silvan, Tim and Brian. To
find a representation for the experiment with
the dice they tried to find an analogy to the
triangle in the coin-experiment. They sug-
gested a construction from heptagon to visu-
alise the dice-experiment. By producing hep-
tagons with GeoGebra they found very
quickly, that it was not an appropriate model.
The conjecture students produced was proven
false.
Leona, Silvan, Tim and Brian constructed according to suggestions from Eric,
Antek and Timur, a nonsymmetrical Pythagoras-Tree to visualise the dice-
experiment (see Figure 9). As an advantage of this model in comparison to the
well known tree-diagrams in stochastics Leo said: „You can see that the probabil-
ity to throw the number six, four times in a row, is very small. In this picture it is
almost a point, but it is not a point. As a result the Pythagoras-Tree is not very
useful, if you have many more steps.“ Students then made their generalisation and
concluded that the Pythagoras-Tree is very suitable to visualise the Bernoulli-

experiments, since it has two branches and the Bernoulli-Experiment has two pos-
sibilities: “success“ and “failure“. However, this generalisation is valid only for
experiments with few steps. We can see that the students connected important
ideas of geometry and stochastics. They used equality of the areas of figures to
visualise equality of probabilities in every step of the Bernoulli-experiment. Stu-
dents shared their ideas, produced and tested their own conjectures and studied
the statements of other students. Starting with the given problem, students some-
how cooperated like professional mathematicians to connect different “worlds” of
school mathematics.
Figure 9:Visualisation of dice-experiment
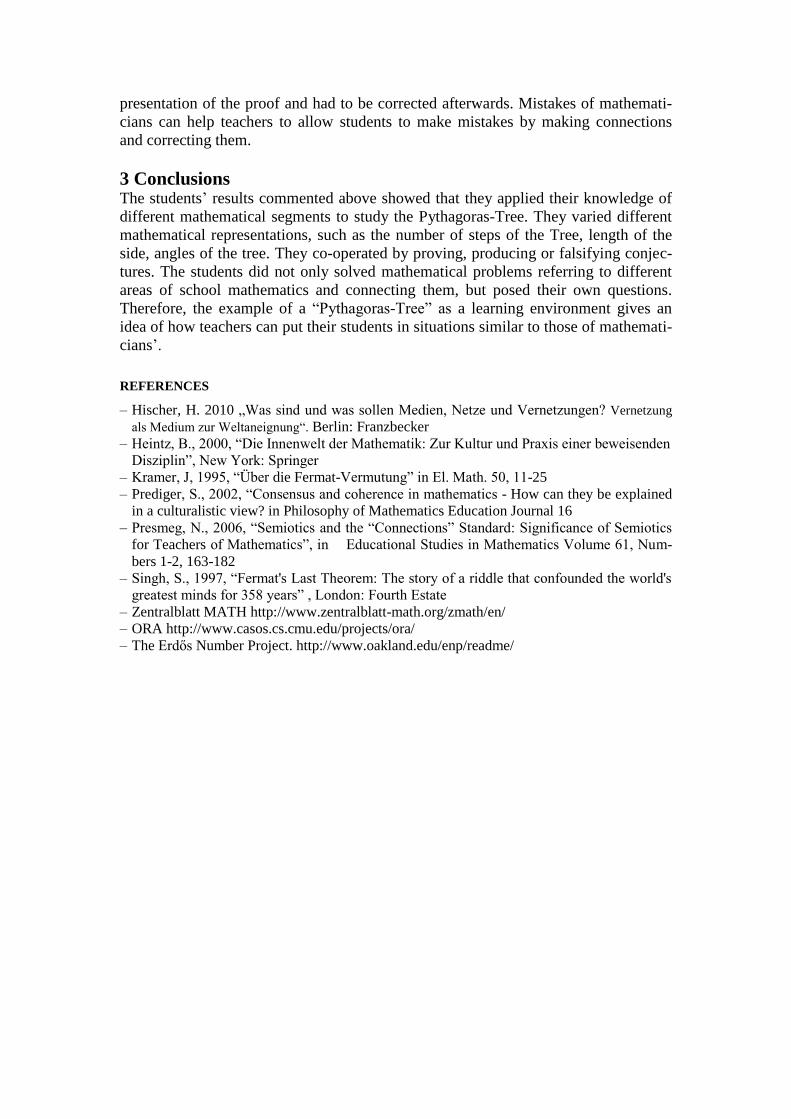
Broccoli
People say that Pythagoras trees look similar to broccoli. Draw a broccoli using
known geometrical shapes. Find a possible function, which describes the volume
of a broccoli in terms of the diameter of its trunk.
What did students make from this problem?
Eric suggested drawing a human lung by using the Pythagoras tree. He has based his
idea on the similarity between broccoli and a lung. Ilona said, that Eric‟s suggestion is
more suitable e.g. for the tumour, because lungs only have finite space to grow. She
suggested using other fractals like the Serpienski-Triangle to model lunges. Since the
teacher made short remark about fractals as self-similar structures and gave an exam-
ple from Serpinski-Triangle helping out in the small groups.
Ilona, Laurenz, Philip and Julia were modelling broccoli with geometrical solids
(spheres). They then translated them into functions and used various representations
of Functions (graph, table, equation). The students noticed that the sum of the vol-
umes is equal at every step of the broccoli. But if you look at the solution carefully,
you will notice a mistake. The students divided the volume of the spheres by n
(amount of the steps) instead of multiplying it by n. Another mistake concerns the
notes, where students say that power functions have exponential growth. However, for
their presentation of the results to the whole class they received some critical com-
ments. To describe concepts from biology it was necessary to combine ideas from
geometry, like those from the area of spheres and from algebra and functions like the
power-function. Likewise professional mathematicians‟ results were presented to the
“scientific community” and mistakes were found and discussed. A similar case took
place in the story of Fermat‟s Last Theorem, where a mistake appeared even after the
presentation of the proof and had to be corrected afterwards. Mistakes of mathemati-
cians can help teachers to allow students to make mistakes by making connections
and correcting them.
3 Conclusions The students‟ results commented above showed that they applied their knowledge of
different mathematical segments to study the Pythagoras-Tree. They varied different
mathematical representations, such as the number of steps of the Tree, length of the
side, angles of the tree. They co-operated by proving, producing or falsifying conjec-
tures. The students did not only solved mathematical problems referring to different
areas of school mathematics and connecting them, but posed their own questions.
Therefore, the example of a “Pythagoras-Tree” as a learning environment gives an
idea of how teachers can put their students in situations similar to those of mathemati-
cians‟.
REFERENCES
– Hischer, H. 2010 „Was sind und was sollen Medien, Netze und Vernetzungen? Vernetzung
als Medium zur Weltaneignung“. Berlin: Franzbecker
– Heintz, B., 2000, “Die Innenwelt der Mathematik: Zur Kultur und Praxis einer beweisenden
Disziplin”, New York: Springer
– Kramer, J, 1995, “Über die Fermat-Vermutung” in El. Math. 50, 11-25
– Prediger, S., 2002, “Consensus and coherence in mathematics - How can they be explained
in a culturalistic view? in Philosophy of Mathematics Education Journal 16
– Presmeg, N., 2006, “Semiotics and the “Connections” Standard: Significance of Semiotics
for Teachers of Mathematics”, in Educational Studies in Mathematics Volume 61, Num-
bers 1-2, 163-182
– Singh, S., 1997, “Fermat's Last Theorem: The story of a riddle that confounded the world's
greatest minds for 358 years” , London: Fourth Estate
– Zentralblatt MATH http://www.zentralblatt-math.org/zmath/en/
– ORA http://www.casos.cs.cmu.edu/projects/ora/
– The Erdős Number Project. http://www.oakland.edu/enp/readme/