Master Economics Offer: A Principled but Pragmatic Response to the Crisis Presentation by Jim...
51
Master Economics Offer: A Principled but Pragmatic Response to the Crisis Presentation by Jim Stanford, CAW Economist [email protected] To CAW-Ford Master Bargaining Committee – April 2008
-
Upload
alexander-bond -
Category
Documents
-
view
215 -
download
1
Transcript of Master Economics Offer: A Principled but Pragmatic Response to the Crisis Presentation by Jim...

Master Economics Offer:
A Principled but Pragmatic
Response to the Crisis
Presentation by Jim Stanford, CAW Economist
To CAW-Ford Master Bargaining Committee – April 2008

The Loonie’s Destructive FlightGlobal commodity and oil price boom, combined with record pace
of foreign takeovers, has overvalued the Canadian currency.
$0.60
$0.70
$0.80
$0.90
$1.00
$1.10
1980 1990 2000 2008
Can
ad
ian
Do
llar
(in
$U
.S.)
30-yr avg
PPP
Up 60% in 6 years

Canada's Collapsing Auto Trade
-$10
-$5
$0
$5
$10
$15
$20
1999 2000 2001 2002 2003 2004 2005 2006 2007
Auto
mot
ive
Trad
e Ba
lanc
e ($
bil)
Source: CAW Research from Industry Canada Strategis. fcst
+$15b
-$7b

World Oil Prices

The Times
N.Y.C. APPROVES RULES ON LIMO
FUEL EFFICIENCY
April 17 2008
The New York City Taxi and Limousine
Commission (TLC) today voted to approve
a regulation requiring that, beginning
January 1, 2009, all new limos must be
capable of city mileage rating of 25 miles
per gallon (mpg). One year later, January
1, 2010, they must meet 30 mpg.

U.S. Construction Downturn
0
100
200
300
400
500
600
700
800
2001 2002 2003 2004 2005 2006 2007 2008
$B
illi
on
(A
nn
ua
l R
ate
)
.

Wall Street JournalANALYST FEARS LIQUIDITY AT BIG THREE
April 9 2008
Wall Street analysts are questioning whether
General Motors Corp. and Ford Motor Co. can
survive a sustained sales slump without a
cash infusion. If the SAAR were to fall to 14.5
million units, GM would have enough cash to
survive two years, says Himanshu Patel, an
analyst at JP Morgan.

UAW Developments
1. VEBA fund to shift legacy costs to UAW-run trust. Retiree health benefits eliminated for new hires. Eliminates $18-20 per hour in labour cost.
2. Two-tier wages and benefits for new “non-core” hires. Total all-in cost for new hires = $26 (versus $60 for current actives).
3. But don’t forget: UAW deal had increases in a number of areas (bonuses, pensions, etc.).
• And non-core share capped at 20%
4. Strike at American Axle: 9 weeks and counting, GM not too concerned

Challenges in Retiree Funding
• Growing ratio of retirees to actives– Ford: 0.7 in 2005, 1.1 in 2008
• Makes cost per hour of retiree-related programs very high– Retiree health benefits: $10 per hour (accounting), $4
per hour (cash), almost doubling every contract– PCOLA: each year = $1 per hour
• Our bond of solidarity with retirees won’t be broken – but we need to find ways to pay for it
• Be very careful about cost control

Nasty MathCost/Hour = Cost/Retiree * No. of Retirees
Active Hours Worked
Cost per Retiree: Rising (8% per year?)
No. of Retirees: Up 1/3 in this contract
Hours Worked: Falling with each downsizing
Result: Cost per hour doubles in 3 yrs
- now worth $10/hr (FAS), $4/hr (cash)

FAS Costing Methods
• Forces companies to recognize, report, and deduct from profits the full ultimate cost of every delayed benefit they agree to
• Makes the cost of future benefits extremely high• Has sparked intense resistance from head office
on: PCOLA, retiree health, $25K retirement allowance, car insurance, others
• On the other hand, some times we can use these rules to our benefit through careful benefit design– eg. 2005 caps saved over $400 million

Example: Long-Term Care
Current Cash Cost
To Ford (2007):
$8.5 million
Ford’s Reported
Liability:
Over $700 million

Employers on the Offensive
The Globe &
GM:“STATUS QUO” MUST CHANGE
April 14 2008
General Motors says its Canadian labour
costs $30 per hour more than workers in
non-union auto plants in the U.S., and says
this gap must close in 2008 contract talks
with the CAW.
The Globe &
GM:“STATUS QUO” MUST CHANGE
April 14 2008
General Motors says its Canadian labour
costs $30 per hour more than workers in
non-union auto plants in the U.S., and says
this gap must close in 2008 contract talks
with the CAW.

Big Three Shopping List
• Implement two-tier wages• Eliminate COLA• Eliminate PCOLA• Eliminate retiree benefits for new hires• Eliminate existing retiree benefits for existing
retirees (long-term care)• Eliminate SPA program• Slash trades employment and hours• Cut back relief time• More, more, more…
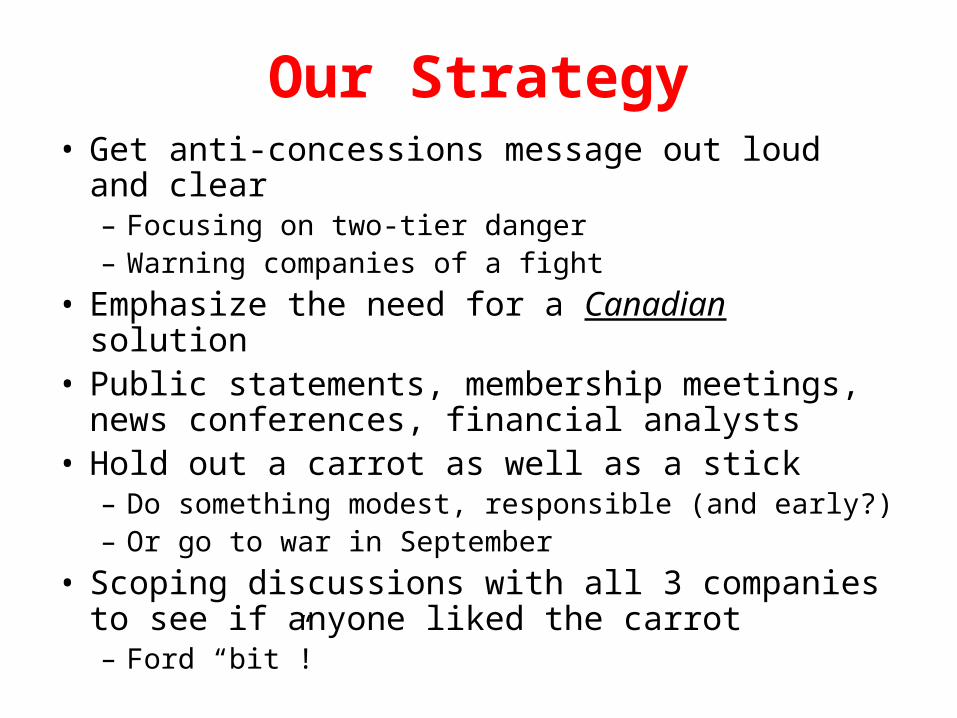
Our Strategy• Get anti-concessions message out loud and
clear– Focusing on two-tier danger– Warning companies of a fight
• Emphasize the need for a Canadian solution• Public statements, membership meetings, news
conferences, financial analysts• Hold out a carrot as well as a stick
– Do something modest, responsible (and early?)– Or go to war in September
• Scoping discussions with all 3 companies to see if anyone liked the carrot– Ford “bit”!

A Principled, Pragmatic,Nimble Union
• CAW has strong no-concessions policy• But CAW has proven it can work creatively to
protect competitiveness within the framework of our principles– Air Canada restructuring (2004)– 2005 Big Three contract– Local plant operating & “shelf” agreements– Auto parts restructuring
• Strong membership support continues• Transparency, democracy help facilitate change

A Superior Productivity Record
ProductivityMeasure
Canada U.S.Canada’s
Edge
Harbour Report(hours per vehicle, 2006)
21.0 22.9 9.2%
Vehicles assembled per assembly worker per year
(2007)54.4 48.2 12.8%
Value-added per auto worker per year ($US, 2006)
$128,500 $91,600 40.2%
Source: CAW Research based on Harbour & Associates; Statistics Canada; Industry Canada; Ward’s Automotive; U.S. Bureau of Labor Statistics; and U.S. Bureau of Economic Analysis. Harbour data includes Big Three facilities only. Value-added data converted at PPP exchange rate, and refers to broad auto industry (including assembly, parts, and truck & bus bodies); U.S. value-added data on the assembly sector alone is unavailable.
Strong capital spending since the early 1990s, allocation of high-volume modelsto Canadian plants, a high-quality workforce, and a commitment to productivityby the union have all contributed to consistently superior productivity results.

Strong Operating Profits
-4.0%
-3.0%
-2.0%
-1.0%
0.0%
1.0%
2.0%
3.0%
4.0%
5.0%
6.0%
2001 2002 2003 2004 2005 2006 2007
Op
era
tin
g m
arg
in (
% s
ale
s)
Canada U.S.
Assembly and parts. CAW Research from Statistics Canada, U.S. Census Bureau. US 2007 data 3Q

Canada’s Automotive Success
12%
13%
14%
15%
16%
17%
18%
19%
20%
1985 1990 1995 2000 2005 2007
Can
ad
a's
Sh
are
(B
ig 3
NA
Pro
d.)
Trend
Thanks to superior productivity and quality, and competitive costs, Canada’sshare of total North American production by the Big 3 continues to grow.

Exchange Rates & Relative Costs
$20.15
$25.29
$29.25 $29.25
$32.50
$0
$5
$10
$15
$20
$25
$30
$35
At 62 At 78 At 90 At Par US
Do
llars
per
Ho
ur
Canada U.S.Industry-wide average hourly wage, auto assembly.
The rapid escalation of the $Canadian has converted our once-largecost advantage into a slight cost disadvantage.
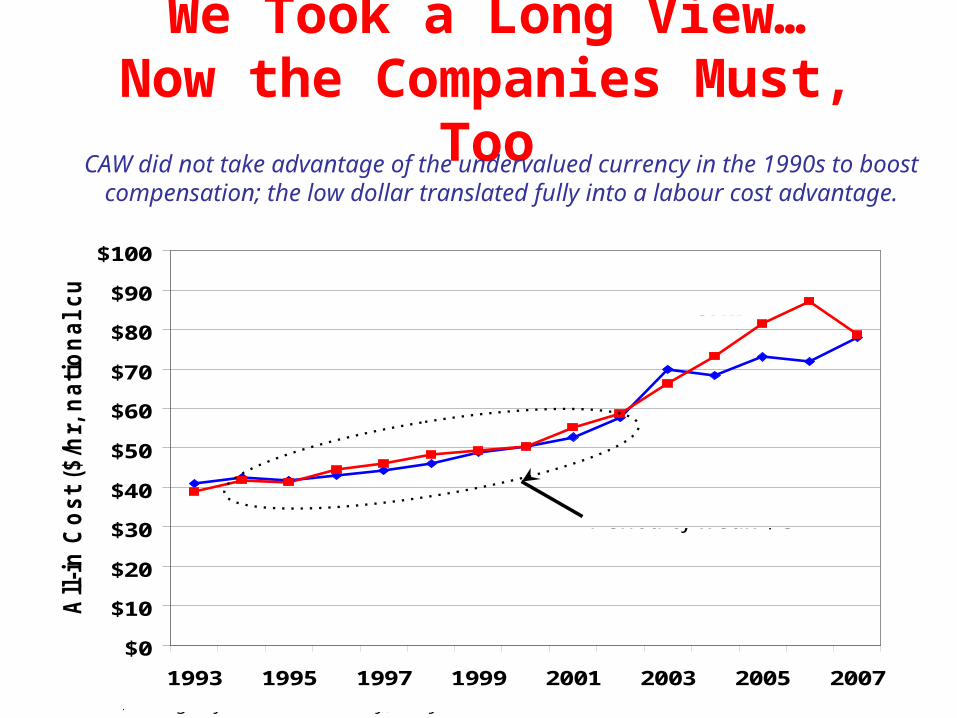
We Took a Long View…Now the Companies Must, Too
$0
$10
$20
$30
$40
$50
$60
$70
$80
$90
$100
1993 1995 1997 1999 2001 2003 2005 2007
All-i
n C
ost
($/h
r, n
ati
on
al cu
rren
cy)
CAW
UAW
Period of weak $C
Average of GM and Ford only; Chrysler US data not available.
CAW did not take advantage of the undervalued currency in the 1990s to boostcompensation; the low dollar translated fully into a labour cost advantage.

Already Showing Restraint
3.1%
6.6%
9.2%
0.7%
4.4%
0%
1%
2%
3%
4%
5%
6%
7%
8%
9%
10%
1993-6 1996-9 1999-02 2002-05 2005-07
Co
mp
ou
nd
gro
wth
, all-i
n c
ost
per
hr.
(%
/yr)
.
3-company average.
The CAW’s 2005 Big 3 contract has already dramatically slowed the growth ofaverage all-in labour costs, thanks to small wage increases and health-care savings.

Staying in the Ballpark?
0
10
20
30
40
50
60
70
80
90
CAW UAW Transplt
$ p
er A
ctiv
e H
ou
r W
ork
ed
Retiree benefits gone

Staying in the Ballpark?
0
10
20
30
40
50
60
70
80
90
CAW UAW Transplt
$ p
er A
ctiv
e H
ou
r W
ork
ed
10% 60%

Bottom Line on Relative Costs• Canadian active hourly costs are 10% higher
than UAW today ($67 vs 60)• UAW agreement will mostly freeze active hourly
costs• Canada has a 10%+ productivity advantage that
offsets higher costs– So unit costs are compatible
• If we can hold the line on our active hourly costs, we keep ourselves in the ballpark for new investment opportunities
• If dollar comes back down (below 90), we recreate a labour cost advantage

CAW Labour Cost Breakdown, 2007
Base Wages $34Wage Premiums (OT, Shift, AWS) $5Paid Time Off (Vac’n, Hol, SPA) $9Active Fringe:
Current Health (PAYGO) $2.50Current Service Retiree Health (FAS) $2Current Service Pension $5Other $4.50
Sub-total Active Fringe $14 Statutory (EI, CPP, WCB, EHT) $5Legacy/Retiree (mostly Retiree Health FAS) $10
TOTAL ALL-IN PER HOUR $77
All-in labour costs per active hour worked, 3-company average.

CAW Strategy for 2008
• Union firmly rejects concessions & two-tier wages• Union recognizes change in Canadian cost
competitiveness• Union places value on future investments• More restraint (as in 2005 contract) is in the cards• Openness to considering cost-saving alternatives
for key contract components– Retiree health benefits

Master Economics Offer• Protects union’s principles
– No two-tier– Protect retiree pensions & benefits
• Protects total compensation– Total compensation (and hence hourly cost)
does not fall– Portions are rebundled
• Cost savings are tailored to particular areas to generate large FAS savings for company
• Retains relative cost position in Canada

The “Momentum” of our Contract
• Problem: “doing nothing” adds 2-3% per year to our costs– COLA, PCOLA– Health benefits– Other
• Challenge: fine-tune the make-up of the package to restrain total costs

Wages and COLA
• No changes in base wages• Preserve existing formula and quarterly structure• Freeze COLA for next 5 hits
– June 2008 hit– First 4 hits of new contract
• $1.31 (of $1.36) folded in September 2008• COLA kicks back in at normal value for 4th
quarter of 2009 (Dec. 2009)• Wages will grow $1+ over life of agreement• Including roll-up costs, adds $1.40 per hour cost

One Year COLA Freeze
$0.00
$0.20
$0.40
$0.60
$0.80
$1.00
$1.20
$1.40
$1.60
$1.80
S ON D J F MA M J J A S O N D J F M AM J J A S O N D J F M A M J J A
Val
ue
of
CO
LA
Normal COLA 1-year freeze
Savings
2008 2009 2010 2011

Pension Summary
• 1 year freeze in benefit rates and PCOLA for actives and retirees.
• Increases in Basic benefit and 30 n’out Special Allowance in 2nd and 3rd year.
• Reinstate PCOLA in 2nd and 3rd years of the agreement.

Pensions – Current Retirees
• For current retirees/surviving spouses and those who retire prior to October 1 2008• PCOLA is suspended for the first year of the
new agreement.• PCOLA increases will be provided effective
October 1, 2009 and October 1, 2010

Pensions for Actives and those retiring on or after October 1 2008• The Basic Benefit Rate and Special
Allowance amounts will be increased, effective Oct.1 2009 and Oct.1 2010, by an amount equal to PCOLA.

Pension Examples – Basic Benefit
Current Oct 1/08 Oct 1/09 Oct 1/10
Current Retiree (retired Oct. 2007)
$68 $68 $69($68 + $1 PCOLA*)
$70($69 + $1 PCOLA)
Active member (retires Oct. 1/08)
$68 $69($68 + $1 PCOLA)
$70($69 + $1 PCOLA)
Active member (retires Oct. 1/09)
$69 $70($69 + $1 PCOLA)
Active member (retires Oct. 1/10)* PCOLA amount is an estimate only
$70

Pension Examples – 30 & out
Current Oct 1/08 Oct 1/09 Oct 1/10
Current Retiree (retired Oct. 2007)
$3,515 per month
$3,515 $3,565($3515 + $50 PCOLA*)
$3,615($3565 + $50 PCOLA)
Active member (retires Oct. 1/08)
$3,515 $3,565($3515 + $50 PCOLA)
$3,615($3565 + $50 PCOLA)
Active member (retires Oct. 1/09)
$3565 $3,615($3565 + $50 PCOLA)
Active member (retires Oct. 1/10)* PCOLA amount is an estimate only
$3,615

Pensions (cont’d)
• New Guarantee Options: – The option for a 5, 10 or 15 year pension
guarantee will be provided effective October 1, 2009, (single life only; pension will be actuarially equivalent).

Insurances
• Optional Dependent Life: 3 Open Enrollments will be offered in January each of 2009, 2010 and 2011.
• Survivor Income Benefit Insurance (SIBI) improvements will apply to current as well as future recipients, as follows:• $25 – effective October 1, 2008• $25 – effective October 1, 2009• $50 – effective October 1, 2010
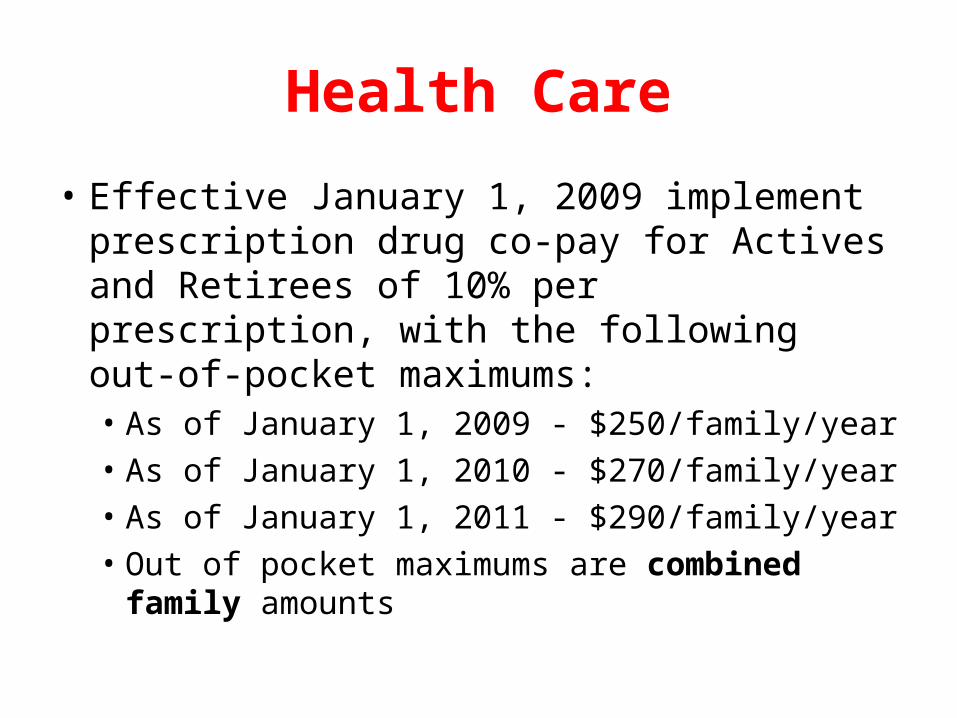
Health Care
• Effective January 1, 2009 implement prescription drug co-pay for Actives and Retirees of 10% per prescription, with the following out-of-pocket maximums:• As of January 1, 2009 - $250/family/year• As of January 1, 2010 - $270/family/year• As of January 1, 2011 - $290/family/year• Out of pocket maximums are combined
family amounts

Drug Co-pay Examples
• Average cost per active script is $60.
• First script, requires $6.00 co-pay.
• If second script is $75 co-pay will be $7.50
• Once the annual maximum (2009) of $250 is reached, from all family member co-pays, no further payments are required.

Drug Co-pay Examples (cont’d)
• For retirees over 65, the co-pay is still 10%, but for Ontario Drug Benefit (ODB) prescriptions, the co-pay could be as low as 20¢ (if retiree is subject to ODB co-pay of $2.00)
• Remember:– 1967 co-pay 35¢ = almost $3 today– Drug spending in Canada up over 500% since
1985– UAW 10% co-pay has cap as high as $2000

Health Care (cont’d)
• Effective January 1, 2009, cap Long Term Care coverage at $1,543.95 per month for new entrants, (grandfather existing residents). This applies to Active and Retired employees.
• Huge FAS saving for Ford (hundreds of millions of dollars)

Health Care Improvements
Effective October 1, 2008 the following benefits will be improved for Active and Retired employees:
• Eye exams amount increased by $20 (to $85)• Vision Care benefit increased by $20 in each
category• Chiropractor annual maximum increased by $15
(to $465)• Psychologist annual maximum increased by $25
(to $675)

Income Security
• Restructuring Allowances: – Increased from $70,000 to $75,000 for
production and $90,000 for trades, plus a $35,000 car voucher for both
• Eliminate $25,000 retirement allowance– Carried a huge FAS cost
• Renew Income Security Fund as agreed per active employee effective September 17, 2008. (Approximately $220 million)

New Hire Grow-In
• New-hires are made “whole” within 3 years– Wages (start at 70%)– COLA not added to wages until after 3 years– SUB: accrue credits beginning in second
year, but no benefits until after 3 years– Time-off: no SPA until after 3 years, reduced
vacation (80 and 88)
• Will apply to new hires from ratification

Vacation
• Remove mandatory vacation• Reduce vacation entitlement by 40 hours at all
seniority levels (3 years and up)• Special $3500 compensation paid in Jan. 2009• 20-year person still receives:
– 200 hours vacation– 80 hours SPA– Long weekends– Holidays
• CAW still far ahead of UAW, transplants
Other Economic Features• $2200 productivity & quality bonus
• Eliminate AWS wage premium– 3-shift workers will receive 8 hours pay for 8
hours in plant
• Extend life of St. Thomas facility to at least end of contract– Company had planned to close it in 2010
• Letter of exploration re new funding method for retiree health

Other Economic Features
• Renew special payment (vacation bonus)• $2,600 automotive discount program for
active and retired employees:– Previously program provided for $2,000
discount on vehicle price and $1,000 insurance rebate. Rebate was taxable and after tax amount is about $600.
– New total amount of $2,600 discount will leave employees in same position
– Program expanded to retirees

Other Economic Features
• Renew Appendix 'U' as reflected in the 2005 Collective Agreement: Various Funds
• Renew funding for National Training as agreed per active employee effective September 17, 2008 (approximately $25 million)

Improvements:• Wage gains (COLA)• Pension gains (driven
by PCOLA, existing and future)
• Restructuring benefit• Health caps & SIBI• Car allowance
(retirees)• St. Thomas pledge
On Balance, A Step Forward
Savings:• COLA/PCOLA
deferrals• Health savings• $25 K retirement• New hire grow-in• 40 hours vacation• AWS premium
Savings offset much of the improvements;Overall compensation protected

Summary
• Defeated two-tier strategy
• No wage cuts
• Defended retiree health benefits
• Defended SPA system (over 1000 jobs)
• Maintain and improve overall compensation
• Extend life of St. Thomas plant, opportunity to fight for a new product
• Principled but pragmatic

![CAW Manual [eBook]](https://static.fdocuments.us/doc/165x107/577d23151a28ab4e1e98eff6/caw-manual-ebook.jpg)