Market Value and Patent Citations: A First Look · Market Value and Patent Citations: A First Look...
61
Market Value and Patent Citations: A First Look Bronwyn H. Hall UC Berkeley, Nu±eld College Oxford, NBER, and IFS Adam Ja®e Brandeis University and NBER Manuel Trajtenberg Tel Aviv University and NBER May 2000 Abstract As patent data become more available in machine-readable form, an increasing number of researchers have begun to use measures based on patents and their citations as indicators of technological output and information °ow. This paper explores the economic meaning of these citation-based patent measures using the ¯nancial market valuation of the ¯rms that own the patents. Using a new and comprehensive dataset containing over 4800 U. S. Manufacturing ¯rms and their patenting activity for the past 30 years, we explore the contributions of R&D spending, patents, and citation-weighted patents to measures of Tobin's Q for the ¯rms. We ¯nd that citation-weighted patent stocks are more highly correlated with market value than patent stocks themselves and that this fact is due mainly to the high valuation placed on ¯rms that hold very highly cited patents.
-
Upload
truongthien -
Category
Documents
-
view
221 -
download
0
Transcript of Market Value and Patent Citations: A First Look · Market Value and Patent Citations: A First Look...
Market Value and Patent Citations: A First Look
Bronwyn H. HallUC Berkeley, Nu±eld College Oxford, NBER, and IFS
Adam Ja®eBrandeis University and NBER
Manuel TrajtenbergTel Aviv University and NBER
May 2000
Abstract
As patent data become more available in machine-readable form, an increasing number ofresearchers have begun to use measures based on patents and their citations as indicators oftechnological output and information °ow. This paper explores the economic meaning of thesecitation-based patent measures using the ¯nancial market valuation of the ¯rms that own thepatents. Using a new and comprehensive dataset containing over 4800 U. S. Manufacturing¯rms and their patenting activity for the past 30 years, we explore the contributions of R&Dspending, patents, and citation-weighted patents to measures of Tobin's Q for the ¯rms. We¯nd that citation-weighted patent stocks are more highly correlated with market value thanpatent stocks themselves and that this fact is due mainly to the high valuation placed on ¯rmsthat hold very highly cited patents.
Acknowledgements
This is a revision of a paper prepared for the Conference in Commemoration of Zvi Griliches' 20Years as Director of the NBER Program on Productivity and Technological Progress, Cambridge,Massachusetts, March 5 and 6, 1999. As should be clear from the discussion in Section 2, thispaper represents but one further step in the research agenda sketched in Zvi's 1979 Bell Journalpaper, reported on in the 1984 NBER volume Zvi edited, and continued by Zvi, his students andassociates in the ensuing decade. Earlier versions of this paper were presented at the Conferenceon Intangibles and Capital Markets, New York University, May 15-16, 1998 and the Conference onthe Economics of Science and Technology, University of Urbino, Italy, June 5-6, 1998. We havebene¯ted from comments at these conferences and by seminar participants at Keele University,the University of Paris I, the University of Reading, the University of Manchester, and UniversityCollege London. The data construction e®ort described in this paper was partially supported bythe National Science Foundation, via grants SBR-9413099 and SBR-9320973. We are extremelygrateful to Meg Fernando of REI, Case Western Reserve University for excellent assistance inmatching the patenting data to Compustat. Responsibility for anything anyone doesn't like aboutthe paper lies with the authors.
Correspondence: [email protected]. Department of Economics, UC Berkeley, Berkeley,CA 94720-3880Keywords: market value, patent citations, bibliometrics, innovation.JEL Classi¯cation: O31, O38
2
Market Value and Patent Citations: A First Look
Bronwyn H. Hall, Adam B. Ja®e, and Manuel Trajtenberg
May 2000
1. Introduction
Micro-level data on patents that include detailed technology ¯eld, citations to other patents, number
of claims, geographical location, and a variety of other information are increasingly available in
machine-readable form. For economists in the ¯eld of technical change and innovation, these data
have enormous potential: in addition to providing rich technological, geographic and institutional
detail, patent data are publicly available for all kinds of research institutions (¯rms, universities,
other non-pro¯ts, and government labs) in virtually every country. At a general level, economists
have used patents and/or patents weighted by subsequent citations to measure the inventive output
of organizations or geographic units; they have used citation intensity or measures related to the
nature of citations that an entities patents receive to measure the importance or impact of that
entity's inventions; and they have used aggregate °ows of citations to proxy for °ows of knowledge
to investigate knowledge spillovers across organizational, technological and geographic boundaries.
With a few exceptions discussed below, this work has relied on maintained hypotheses that
patents are a proxy for inventive output, and patent citations are a proxy for knowledge °ows or
knowledge impacts. In this kind of work, these maintained hypotheses cannot really be tested,
though they may be supported by results that are consistent with strong priors about the nature of
the innovation process, and which are internally consistent. In this paper, we seek to strengthen
the foundation for the use of patent and patent citation data, by exploring the extent to which
¯rms' stock market value is correlated with their stocks of patents and patent citations. Our
maintained assumption is that stock market investors hold rational expectations about the extent
to which the present value of a ¯rm's future pro¯ts varies with its stock of knowledge. Hence
evidence that patent-related measures are correlated with market values represents evidence that
1
they are proxies for the private economic value of the ¯rm's knowledge stock. Previous work
looking at the relationship between patents and market value suggested that the extremely skewed
nature of the value distribution of individual patents makes ¯rm patent totals very noisy as an
indicator of the value of ¯rms' knowledge. In this paper, we explore the extent to which this
problem can be mitigated by using citation-weighted patent counts, in the context of a larger and
more comprehensive dataset than has been used before.
We begin the paper with a discussion of the meaning of patent citations and a brief survey of
prior uses of these data for economic analysis. Then we review what is known about the relationship
between patent counts and a ¯rm's value in the ¯nancial markets. The next sections of the paper
present our data, which is the product of a large-scale matching e®ort at the NBER and Case
Western Reserve University, and the relatively simple "hedonic" model for market valuation that
we use. The primary contribution of this paper, estimates of the market value equation that
include patent citations, is contained in Section 6; the conclusions contain an extensive discussion
of further work and re¯nements to be implemented in a revision of this paper. Appendices describe
the construction of the data, and discuss the important issue of adjusting patent citation data for
the truncation inherent in the fact that we cannot observe the entire citation life of patents, with
the extent of this truncation increasing for more recent patents.
2. Prior Research using Micro-level Patent Data1
A patent, as a matter of de¯nition, is a temporary legal monopoly granted to inventors for the
commercial use of an invention. In principle, in order to receive this right, the invention must
be nontrivial, in the sense that it must not be obvious to a skilled practitioner of the relevant
technology, and it must be useful, meaning that it has potential commercial value. If the patent
is granted, an extensive public document is created which contains detailed information about the
invention, the inventor(s), the organization to which the inventor assigns the patent property right
(usually an employer), and the technological antecedents of the invention.2 These antecedents,
1For more comprehensive literature reviews, see Griliches (1990) and Lanjouw and Schankerman (1999).2See Appendix B for an example of the front page of such a document, in the form in which it appears on
the publicly accessible website of the United States Patent O±ce (http://www.uspto.gov). Note that no publicinformation is currently available for patent applications that are still pending, or for patent applications that aredenied by the patent o±ce.
2
identi¯ed as references or citations, include previous patents and other published material that
identify or describe aspects of the relevant technology that were previously publicly known. The
citations identify "prior art," the practice of which is necessarily excluded from the property right
granted by the patent. Thus, together with the language of the patent claims{which describe
exactly what the patented invention does that has never been done before{the citations help to
delimit the property right that the patent represents. As will be discussed further below, the cited
patents can be identi¯ed by the inventor herself, by a search conducted by the inventor's patent
attorney, or by the patent examiner who reviews the application for the patent o±ce.3
The use of patent data in the economic analysis of technological change has a fairly long, if
somewhat unsatisfactory history, which stretches back to the pathbreaking analyses of Schmookler
(1966) and Scherer (1965). The availability of information from the U.S. patent o±ce in machine-
readable form in the late 1970s spurred greater interest in econometric analyses using these data;
much of the resulting early work is reported in Griliches (1984).4 In the late 1980s, patent citation
information began to be available in computerized form, which led to a second wave of econometric
research, utilizing the citation information to increase the information content of the patent data
themselves, as well as to investigate an additional set of questions related to the °ow of knowledge
across time, space and organizational boundaries.5
2.1. Patent Citations
Viewed optimistically, patent citations can be seen as providing direct observations of technological
impact and knowledge spillovers, in that one technological innovation explicitly identi¯es several
3As can be seen in the patent in Appendix B., patents can make citations both to earlier patents and to non-patentpublications. The non-patent citations appear in plain text form, and hence are di±cult to manipulate electronically.Research that utilizes the non-patent references includes Trajtenberg, Henderson and Ja®e (1997) and Narin et al(1997).
4See also Pakes (1986) and Griliches, Hall and Pakes (1987). Also in the late 1970s Mark Schankerman and ArielPakes pioneered the use of renewal data from the European patent o±ce to estimate the value distribution of patents.(Pakes and Schankerman 1984, Schankerman and Pakes 1986). (Renewal of U.S. patents was not required beforethe mid-1980s.)
5It is perhaps interesting to chart the e®ect of computerization on research via the authors' experience with theacquisition of patent data. In the early 1980s, Trajtenberg collected citations information for hundreds of CT-scanner patents by hand from paper patent documents. In 1989, we paid $10,000 to a private data ¯rm for citationinformation on about 10,000 patents. In the mid-1990s, we began construction of a database with citations to about2.5 million patents, using an NSF grant of about $100,000. Today, citations to over 3 million U.S. patents areavailable free from numerous websites, and a CD-ROM is available from the authors with comprehensive informationon all patents granted between 1964 and 1996, and all citations made between 1976 and 1996.
3
others as constituting the technological state-of-the-art on which it builds. Unfortunately, this
optimistic view is somewhat clouded by the reality that there is substantial "noise" in the patent
citations data. The nature and extent of such noise depends, to some extent, on the purpose to
which the patent data are put. Some authors have used these data to explore questions involving
spatial spillovers (e.g., Ja®e, Trajtenberg, and Henderson 1993), knowledge °ows among ¯rms
in a research consortium (e.g., Ham 1998), and spillovers from public research (e.g., Ja®e and
Trajtenberg 1996; Ja®e and Lerner 1999). In using citations as evidence of spillovers, or at least
knowledge °ows, from cited inventors to citing inventors, it is clearly a problem that many of the
citations are added by the inventor's patent attorney or the patent examiner, and may represent
inventions that were wholly unknown to the citing inventor. On the other hand, in using citations
received by a patent as an indication of that patent's importance, impact or even economic value,
the citations that are identi¯ed by parties other than the citing inventor may well convey valuable
information about the size of the technological "footprint" of the cited patent. That is, if a patent
stakes out a territory in technology space that is later frequently deemed to abut areas that are
patented in the future, this suggests that the cited patent is important, whoever it is that decides
that the citation is necessary.
A recent survey of inventors sheds some qualitative light on these issues (Ja®e, Trajtenberg
and Fogarty, 2000). Approximately 160 patentees answered questions about their inventions, the
relationship of their inventions to patents that were cited by their patents, and the relationship
to "placebo" patents that were technologically similar to the cited patents but which were not
cited. The cited and placebo patents were not distinguished in the survey questionnaire, although
it is possible that the surveyed inventors knew or looked up which patents they actually cited.
The results con¯rm that citations are a noisy measure of knowledge °ow, but also suggest that
they do have substantial information content. Overall, as many as half of all citations did not
seem to correspond to any kind of knowledge °ow; indeed, in a substantial fraction of cases the
inventors judged that the two patents were not even very closely related to each other.6 At the
same time, the answers revealed statistically and quantitatively signi¯cant di®erences between the
6The results also con¯rmed that the addition of citations by parties other than the inventor is a major explanationfor citations that do not correspond to knowledge °ow. About 40% of respondees indicated that they ¯rst learnedof the cited invention during the patent application process.
4
cited patents and the placebos with respect to whether the citing inventor felt that she had learned
from the cited patent, when she learned about it, how she learned about, and what she learned
from it. Qualitatively, it appears that something like one-half of citations correspond to some kind
of impact of the cited invention on the citing inventor, and something like one-quarter correspond
to fairly rich knowledge °ow, fairly signi¯cant impact, or both.
There are also a small number of studies that "validate" the use of citations data to mea-
sure economic impact, by showing that citations are correlated with non-patent-based measures of
value.7 Trajtenberg (1990) collected patents related to a class of medical instruments (computer-
ized tomography, or "CAT" scanners), and related the °ow of patents over time to the estimated
social surplus attributed to scanner inventions. When simple patent counts are used, there is es-
sentially no correlation with estimated surplus, but when citation-weighted patent counts are used,
the correlations between welfare improvements and patenting are extremely high, on the order of
0.5 and above. This suggests that citations are a measure of patent "quality" as indicated by the
generation of social welfare. Interesting recent work by Lanjouw and Schankerman (1997, 1999)
also uses citations, together with other attributes of the patent (number of claims and number of
di®erent countries in which an invention is patented) as a proxy for patent quality. They ¯nd that
a patent "quality" measure based on these multiple indicators has signi¯cant power in predicting
which patents will be renewed, and which will be litigated. They infer from this that these quality
measures are signi¯cantly associated with the private value of patents. With respect to univer-
sity patents, Shane (1999a, 1999b) ¯nds that more highly cited M.I.T. patents are more likely to
be successfully licensed, and also more likely to form the basis of starting a new ¯rm. Sampat
(1998) and Ziedonis (1998) explore the relationship between citations and licensing revenues from
university patents. Harho® et al (1999) surveyed the German patentholders of 962 U. S. invention
patents that were also ¯led in Germany, asking them to estimate at what price they would have
been willing to sell the patent right in 1980, about three years after the date at which the German
patent was ¯led. They ¯nd both that more valuable patents are more likely to be renewed to full
term and that the estimated value is correlated with subsequent citations to that patent. The most
7We are not aware of any studies that validate (by reference to non-patent data) the use of citations to traceknowledge °ows. Since it is hard to ¯nd other measures or proxies for knowledge °ows, this kind of validation isinherently di±cult.
5
highly cited patents are very valuable, "with a single U.S. citation implying on average more than
$1 million of economic value" (Harho®, et al 1999).
2.2. Market Value and Patents
Until recently, research that uses patents in the market value equation (in addition to or in place of
R&D) has been somewhat limited, primarily because of the di±culty of constructing ¯rm datasets
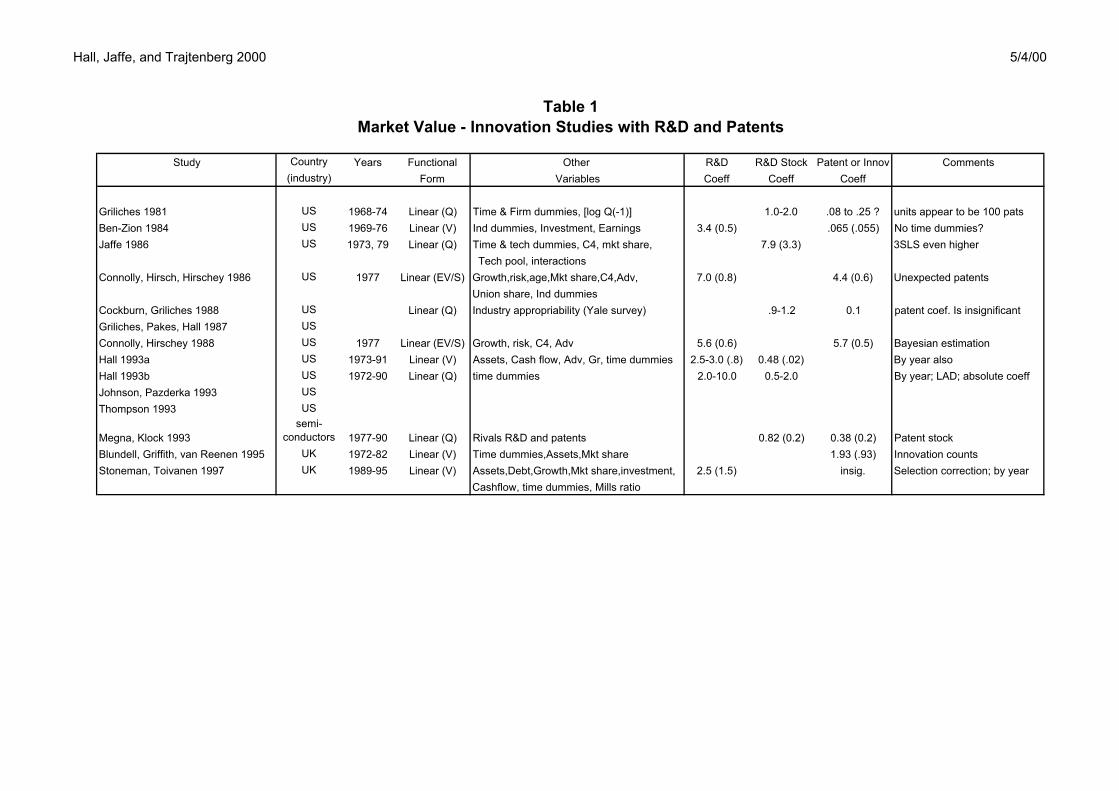
that contain patent data. Most of the work shown in Table 1 and described here has been done by
Griliches and his coworkers using the database constructed at the NBER that contained data on
patents only through 1981. This dataset did not include information on the citations related to the
patents. The other papers in the table use a cross section constructed by Connolly et al. for 1997
of Fortune 500 companies, and datasets involving UK data, one of which uses innovation counts
rather than patents.
[Table 1 about here]
When patents are included in a market value equation, they typically do not have as much
explanatory power as R&D measures, but they do appear to add information above and beyond
that obtained from R&D, as one would expect if they measure the "success" of an R&D program.
Griliches, Hall, and Pakes (1987) show that one reason patents may not exhibit very much corre-
lation with dollar-denominated measures like R&D or market value is that they are an extremely
noisy measure of the underlying economic value of the innovations with which they are associated.
This is because the distribution of the value of patented innovations is known to be extremely skew,
i.e., a few patents are very valuable, and many are worth almost nothing. Scherer (1965) was one of
the ¯rst to make this point, and it has recently been explored further by Scherer and his co-authors
(Scherer 1998; Harho®, et al 1999). Therefore the number of patents held by a ¯rm is a poor proxy
for the sum of the value of those patents and we should not expect the correlation to be high. If
the number of citations received by a patent is indicative of its value, then weighting patent counts
by citation intensity should mitigate the skewness problem and increase the information content of
the patents. As will be shown below, the distribution of citations is also quite skewed, suggesting
perhaps that it can mirror the value distribution.
6
Shane (1993) regresses Tobin's Q for 11 semiconductor ¯rms between 1977 and 1990 on measures
of R&D stock, patent stock, and patent stock weighted by citations and ¯nds that the weighted
measure has more predictive power than the unweighted measure, entering signi¯cantly even when
R&D stock is included in the regression; that is, there is independent information about the success
of R&D in the weighted patent count measure. Weighted patent counts are also more highly
correlated with the R&D input measure than simple patent counts; this implies that ex ante more
e®ort was put into the patents that ultimately yielded more citations. An implication of this ¯nding
is that the citations may be measuring something that is not just the luck of the draw; the ¯rms
may have known what they were shooting at. Austin (1993a, 1993b) ¯nds that citation-weighted
counts enter positively but not signi¯cantly (due to small sample size) in an event study of patent
grants in the biotechnology industry. This means they add a small amount of information beyond
the simple fact of a patent having granted. Many of the important Austin patents were applied
for after 1987, which makes this study subject to serious truncation bias (discussed below). In
addition, it uses the 3-day CAR (cumulative abnormal return) at the time of the patent grant as
the indicator of economic value; this is an underestimate of the actual value of the patent because
there is substantial informational leakage before . In fact, the work surveyed in Griliches, Pakes,
and Hall (1987) typically ¯nds that patent counts by application date are more tightly linked to
market value than counts by granting date.
The present research project was inspired partly by the tantalizing results in these earlier small-
scale studies that citation-weighted patent counts might prove a better measure of the economic
value of innovative output than simple patent counts. Rather than working with a single product
or market segment, we have assembled data on the entire manufacturing sector and the patenting
and citing behavior of the ¯rms within it, taking advantage of the computerized databases now
available from the United States Patent O±ce. The remainder of the paper discusses our dataset
construction and some preliminary results.
3. Data
Because of the way in which data on patents are collected at the United States Patent O±ce,
matching the patents owned by a ¯rm to ¯rm data is not a trivial task. Firms patent under a
7
variety of names (their own and those of their subsidiaries) and the Patent O±ce does not keep
a unique identi¯er for the same patenting entity from year to year. To construct our dataset, a
large name-matching e®ort was undertaken that matched the names of patenting organizations to
the names of the approximately 6000 manufacturing ¯rms on the Compustat ¯les available to us
and to about 30,000 of their subsidiaries (obtained from the Who Owns Whom directory). As
described in Appendix A, the majority of the large patenting organizations have been matched
to our data, or we have established why they will not match (because they are foreign or non-
manufacturing corporations). However, budget constraints mean that our matching is primarily a
snapshot exercise conducted using 1989 ownership patterns; we have limited evidence using patents
in the semiconductor industry that this leads to some undercounting of patents for some ¯rms.8
Thus the precise results here should be viewed with some caution: they are unlikely to change
drastically, but they may be a®ected by a slight undercount of the ¯rms' patents.
The ¯rm data to which we have matched patenting information is drawn from the Compustat
¯le. The full sample consists of over 6000 publicly traded manufacturing ¯rms with data between
1957 and 1995. After restricting the sample to 1965-1995, dropping duplicate observations and
partially-owned subsidiaries, and cleaning on our key variables, we have about 4800 ¯rms in an
unbalanced panel (approximately 1700 per year). The variables are described in somewhat more
detail in the appendix and the construction of R&D capital and Tobin's q is described fully in Hall
(1990). For the purposes of this paper, we constructed patent and citation-weighted patent stocks
using the same declining balance formula that we used for R&D, with a depreciation rate of ¯fteen
percent. Our patent data goes back to 1964, and the ¯rst year for which we used a patent stock
variable in the pooled regressions was 1975, so the e®ect of the missing initial condition should be
small for the patent variable. However, we only know about citations made by patents beginning
in 1976.
Figure 1 shows the fraction of ¯rms in our sample in a given year who reported R&D expendi-
tures to the SEC, the fraction that year who applied for a patent that was ultimately granted, and
the fraction who have a nonzero stock of patents in that year.9 The increase in R&D reporting
8See Hall and Ham (1999).9The stock of patents is de¯ned using a declining balance formula and a depreciation rate of 15 percent, by analogy
to the stock of R&D spending:
8
between 1969 and 1972 is due to the imposition of FASB rule no. 2, which mandated the public
reporting of "material" R&D expenditures. The fall in the later years in the number of ¯rms with
patent applications is due to the fact that we only know about patent applications when they are
granted, and our grant data end in 1996. The fact the share of ¯rms with patent applications and
with R&D spending is approximately the same is only a coincidence: although there is substantial
overlap, these samples are not nested. 19 percent of the ¯rms have R&D stocks and no patents
while 13 percent have patent stocks but no R&D.
[Figure 1 about here]
We want to construct a citation-weighted stock of patents held by the ¯rm, as a proxy for
its stock of knowledge. This requires that we have a measure of the citation intensity for each
patent that is comparable across patents with di®erent grant years. The di±culty is that, for
each patent, we only observe a portion of the period of time over which it can be cited, and the
length of this observed interval varies depending on where the patent's grant date falls within our
data. For patents granted towards the end our data period, we only observe the ¯rst few years
of citations. Hence, a 1993 patent that has gotten 10 citations by 1996 (the end of our data) is
likely to be a higher citation-intensity patent than one that was granted in 1985 and received 11
citations within our data period. To make matters worse, although our basic patent information
begins in 1964, with respect to citations we only have data on the citations made by patents
beginning in 1976. Hence for patents granted before 1976, we have truncation at the other end of
the patent's life{a patent granted in 1964 that has 10 citations between 1976 and 1996 is probably
more citation-intensive than one granted in 1976 that has 11 citations over that same period.
Our solution to this problem is to estimate from the data the shape of the citation-lag distri-
bution, i.e. the fraction of lifetime (de¯ned as the 30 years after the grant date) citations that
are received in each year after patent grant. We assume that this distribution is stationary and
independent of overall citation intensity. Given this distribution, we can estimate the total (20-
year lifetime) citations for any patent for which we observe a portion of the citation life, simply by
PSt = 0:85PSt¡1 + Pt (3.1)
9
dividing the observed citations by the fraction of the population distribution that lies in the interval
for which citations were observed. For patents where we observe the "meat" of the distribution
(roughly years 3-10 after grant), this should give an accurate estimate of lifetime citations. For
other patents, particularly where we observe only the ¯rst few years of patent life, this will give a
very noisy estimate of lifetime citations. Many patents receive no citations in their ¯rst few years,
leading to a prediction of zero lifetime citations despite the fact that some patents with no citations
in the ¯rst few years are eventually cited.10
The details of the estimation of the citation lag distribution and the derived adjustment to
citation intensity are described in Appendix D. Figure 2 shows the ratio of total citations to total
patents for the ¯rms with patents in our data, both uncorrected and corrected for truncation. The
raw numbers decline beginning in about 1983, because citations are frequently made more than
10 years after the original patent is issued, and these later citations are unobserved for patents at
the end of the data period. The truncation-corrected citation intensity is °at after about 1988
and then begins to rise again. Recall that we date the patents by year of application so that a
patent applied for in 1988 was most likely granted between 1989 and 1991 and hence e®ectively
had only 4-6 years to be cited. In addition, the citing patents were also less and less likely to have
been observed as we reach 1995 and 1996. Because of the increasing imprecision in measuring cites
per patent as we approach the end of our sample period, our pooled regressions focus ¯rst on the
1976-1992 period, and then on the subset of years between 1979 and 1988.
[Figure 2 about here]
Figure 3 shows the total citation and patenting rates per real R&D spending for our sample.
The patent counts are adjusted for the application-grant lag and the citation counts are shown
both corrected and uncorrected. Although the earlier years (1975-1985) show a steady decline in
patenting and citation weighted patenting per R&D dollar, one can clearly see the recent increase
10Another issue is that the number of citations made by each patent has been rising over time, suggesting a kindof "citation in°ation" that renders each citation less signi¯cant in later years. It is hard to know, however, to whatextent this increased intensity is an arti¯cial artifact of patent o±ce practices, and the extent to which it mightrepresent true secular changes in patent impact. In this paper we choose not to make any correction or de°ationfor the secular changes in citation rates, with the cost that our extrapolation attempts become somewhat inaccuratelater in the sample. For further discussion of this point, see Appendix D. For an attempt to econometrically separatesuch e®ects, see Caballero and Ja®e, 1993.
10
in patenting rate beginning in 1986-87 that has been remarked upon by other authors (Kortum
and Lerner 1998, Hall and Ham 1999). However, the yield begins to decline in about 1993, two
years before the end of our sample, mostly because real R&D increases during that period. The
corrected patent citation yield also begins to increase in 1986-87 but does not decline quite as much
as the patent yield, re°ecting an increase in citations per patent in the early to mid-nineties.
[Figure 3 about here]
Figure 4 provides some evidence on the skewness of the distribution of citations per patent. In
this ¯gure we plot a distribution of the number of citations received by each of the approximately
one million patents that we have assigned to manufacturing corporations. Fully one quarter of
the patents have no citations, 150,000 have only one, 125,000 have two, and 4 patents have more
than 200 citations. Fitting a Pareto distribution to this curve yields a parameter of 1.8, which
implies that the distribution has a mean but no variance. However, a Kolmogorov-Smirnov or
other distributional test would easily reject that the data are actually Pareto.
The most cited patents since 1976 are a patent for Crystalline silicoaluminophosphates held
by Union Carbide Corporation (227 citations through 1995) and a patent for a Transfer imaging
system held by Mead Corporation (195 citations through 1995).11 In Appendix B, we show detailed
information for the ¯rst of these patents obtained from the USPTO website. It is apparent from
the list of citations that the patent is important because the compound it describes is used as a
catalyst in many processes. This single example suggests already that a high citation rate may be
correlated with the value of a patent right, because such a product is useful both directly (via sales
to other users) and in licensing and cross-licensing.12
[Figure 4 about here]
11These two patents are the third and ¯fth most cited overall. The other 3 in the top 5 were taken out before 1976,so they are not contained in the online database provided by the U.S. Patent O±ce (http://patents.uspto.gov).
12See Somaya and Teece (1999) for an interesting discussion of the IP value creation choice between production orlicensing.
11
4. Equation Speci¯cation and Estimation Results
4.1. The Market Value Equation
We use a speci¯cation of the ¯rm-level market-value function that is predominant in the literature:
an additively separable linear speci¯cation, as was used by Griliches (1981) and his various co-
workers. The advantage of this speci¯cation is that it assumes that the marginal shadow value of
the assets is equalized across ¯rms. The model is given by
Vit = qt(Ait + °tKit)¾t (4.1)
where Ait denotes the ordinary physical assets of ¯rm i at time t and Kit denotes the ¯rm's
knowledge assets. Both variables are in nominal terms.
Taking logarithms of both sides of equation 4.1, we obtain
logVit = log qt + ¾t logAit + ¾t log(1 + °tKit=Ait) (4.2)
In most of the previous work using this equation, the last term is approximated by °tKit=Ait, in
spite of the fact that the approximation can be relatively inaccurate forK=A ratios of the magnitude
that are now common (above 15 percent). In this formulation, °t measures the shadow value of
knowledge assets relative to the tangible assets of the ¯rm and ¾t°t measures their absolute value.
The coe±cient of logA is unity under constant returns to scale or linear homogeneity of the
value function. If constant returns to scale holds (as it does approximately in the cross section), the
log of ordinary assets can be moved to the left hand side of the equation and the model estimated
with the conventional Tobin's q as the dependent variable, as we do here. The intercept of the
model can be interpreted as an estimate of the logarithmic average of Tobin's q for manufacturing
corporations during the relevant period. Thus our estimating equation becomes the following:
logVit=Ait = logQit = log qt + log(1 + °tKit=Ait) + ±tD(Kit = 0) (4.3)
where the last term is included to control for the overall level of Q when either R&D or patents
are missing. Theory does not give much guidance for the speci¯cation of intangible capital stocks
12
and it is not clear how we should specify an equation for K that incorporates patents and citation-
weighted patents as measures of intangible assets in addition to R&D stocks. There are at least two
possible approaches. In our ¯rst approach, we simply assume that R&D stocks, patent stocks or
citation stocks are all just di®erent measures of the same thing, and compare their performance in
a logQ equation like equation 4.3, one at a time. This is the simplest way to validate our measures
and compare their performance, but it implies that each stock (R&D, patent, or citation) is just
another indicator of the same underlying concept, the knowledge assets of the ¯rm. In our second
approach to the problem, we ask what incremental value patents add in the presence of R&D stocks,
and similarly for citations in the presence of patent stocks.
4.2. Citation-weighted patent stocks
The central problem we face in estimation is how to model the stock of intangible assets that is
associated with the patents owned by a particular ¯rm. We know that ¯rms apply for patents for
a variety of reasons: to secure exclusive production marketing rights to an invention/innovation,
to obtain a currency that can be used in trading for the technology of other ¯rms, to serve as
a benchmark for the productivity of their research sta®, and so forth. We also know that ¯rms
in di®erent technology areas have substantially di®erent propensities to patent. For the valuation
function, we want a measure of the "book" value of the knowledge capital owned by the ¯rm. That
is, ideally we would like to know the cost in current prices of reproducing the knowledge this ¯rm
has of how to make new products today and how to undertake future innovation.
When we use past R&D expenditure to proxy for the book value of knowledge capital, we are
implicitly assuming that a dollar is a dollar, i.e., that each dollar spent on research generates the
same amount of knowledge capital. The reason one might want to use patents as a proxy for
knowledge capital is because a patent could represent the "success" of an R&D program. That is,
some of the R&D undertaken by the ¯rm produces "dry holes" and although the knowledge gained
by doing that research may have some value, such R&D should not be weighted equally with
successful innovation-producing R&D in our measure of knowledge capital. Our problem is that to
the extent that patents are used as engineer productivity measures and as a currency for technology
licensing exchanges, some of the patents held by a ¯rm may represent the same kind of "dry hole,"
13

in the sense that they document technological avenues that turn out not to be productive. More
generally, it is clear from the work cited earlier that the private value distribution of the patent
right is extremely skewed, making simple counts a noisy measure of value.
The idea of using subsequent citations to a patent as a measure of the patent's value rests on
the argument that valuable technological knowledge within the ¯rm tends to generate patents that
future researchers build on (and therefore cite) when doing their own innovation. The example we
gave earlier, the highly cited patent for Crystalline silicoaluminophosphates applied for by Union
Carbide in 1984 (and subsequently granted), suggested that this could be the case. From the
abstract and the citing patents it is clear that this class of chemicals has widespread use as a
catalyst in chemical reactions, which doubtless creates value for the holder of the patent.
Appendix C presents the details of the construction of our citation-weighted patent stocks.
Because citations can happen at any time after a patent is applied for,13 a natural question is
whether we should use citation weights based on all the citations to patents applied for this year
and earlier, or whether we should use only citations that have already occurred. That is, do the
citations proxy for an innovation value that is known at the time the patent is applied for, or do
they proxy for the future value of the innovation, for which the current market value of the ¯rm is
only an unbiased forecast? We attempt to explore this question by dividing our stocks into past
and future. First, we construct the "total" citation stock for a given ¯rm as of a given date, based
on the number of citations made through 1996 to patents held by the ¯rm as of the given date
(depreciated). Then, we construct the "future" stock, as the di®erence between the total citation
stock as of the date, and the stock based only on citations that were actually observed by the given
date. The latter variable represents the future citations that will eventually be made to patents
already held by the ¯rm.
4.3. Basic Results
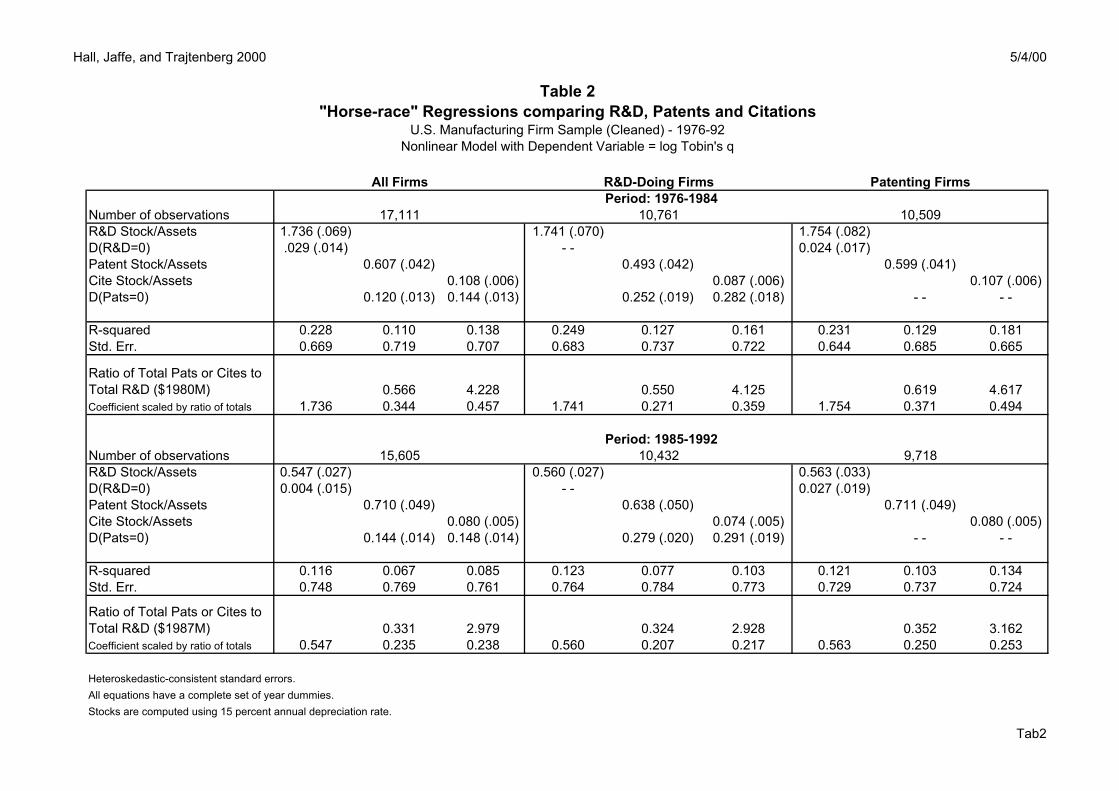
In Table 2, we show the results from running a "horse race" between R&D stocks, simple patent
stocks, and citation-weighted patent stocks on data pooled across two subperiods (1976-1984 and
13There is at least one citation in our sample that is over 50 years old, to a patent that was applied for in 1921and granted in 1992! Such very long grant lags usually are the result of the "continuation" process allowed by thepatent rules, under which an inventor can ¯le a modi¯ed patent application that retains the application date of theoriginal.
14
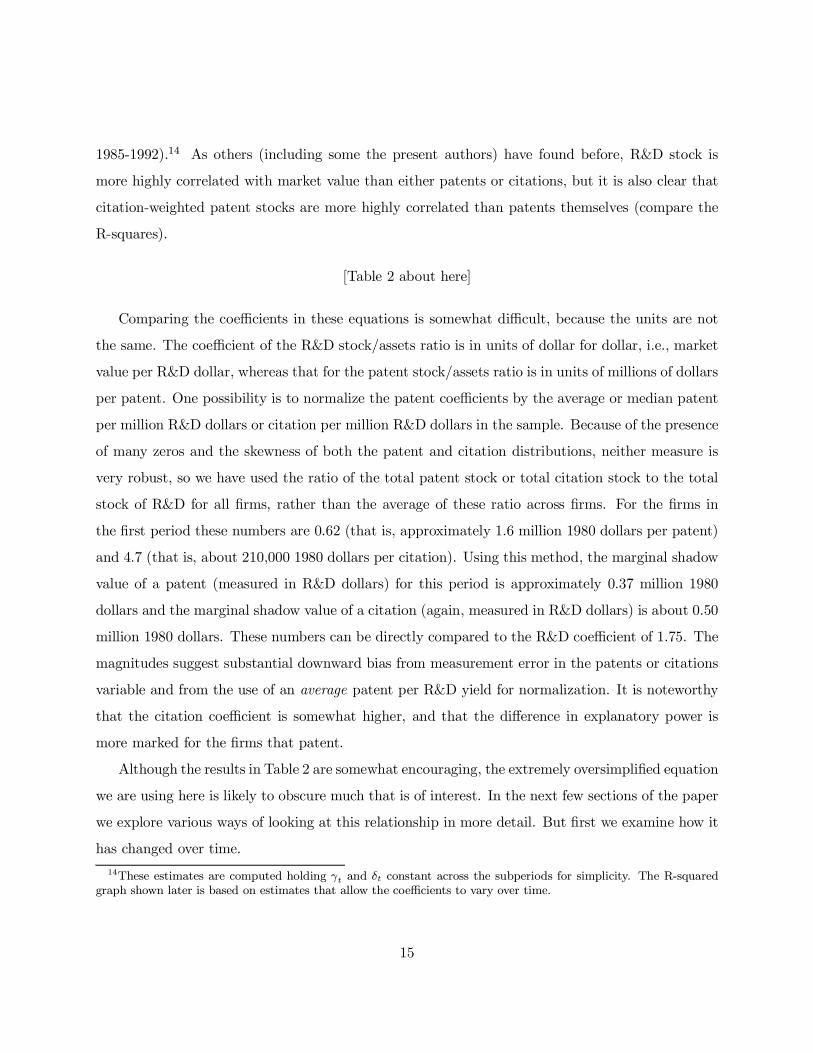
1985-1992).14 As others (including some the present authors) have found before, R&D stock is
more highly correlated with market value than either patents or citations, but it is also clear that
citation-weighted patent stocks are more highly correlated than patents themselves (compare the
R-squares).
[Table 2 about here]
Comparing the coe±cients in these equations is somewhat di±cult, because the units are not
the same. The coe±cient of the R&D stock/assets ratio is in units of dollar for dollar, i.e., market
value per R&D dollar, whereas that for the patent stock/assets ratio is in units of millions of dollars
per patent. One possibility is to normalize the patent coe±cients by the average or median patent
per million R&D dollars or citation per million R&D dollars in the sample. Because of the presence
of many zeros and the skewness of both the patent and citation distributions, neither measure is
very robust, so we have used the ratio of the total patent stock or total citation stock to the total
stock of R&D for all ¯rms, rather than the average of these ratio across ¯rms. For the ¯rms in
the ¯rst period these numbers are 0.62 (that is, approximately 1.6 million 1980 dollars per patent)
and 4.7 (that is, about 210,000 1980 dollars per citation). Using this method, the marginal shadow
value of a patent (measured in R&D dollars) for this period is approximately 0.37 million 1980
dollars and the marginal shadow value of a citation (again, measured in R&D dollars) is about 0.50
million 1980 dollars. These numbers can be directly compared to the R&D coe±cient of 1.75. The
magnitudes suggest substantial downward bias from measurement error in the patents or citations
variable and from the use of an average patent per R&D yield for normalization. It is noteworthy
that the citation coe±cient is somewhat higher, and that the di®erence in explanatory power is
more marked for the ¯rms that patent.
Although the results in Table 2 are somewhat encouraging, the extremely oversimpli¯ed equation
we are using here is likely to obscure much that is of interest. In the next few sections of the paper
we explore various ways of looking at this relationship in more detail. But ¯rst we examine how it
has changed over time.
14These estimates are computed holding °t and ±t constant across the subperiods for simplicity. The R-squaredgraph shown later is based on estimates that allow the coe±cients to vary over time.
15
Figures 5a and 5b show the R-squared from the same simple Tobin's q regression on R&D stock,
patent stocks, and citation-weighted patent stocks, estimated year-by-year between 1973 and 1993.
Figure 5a shows the result for the R&D-performing ¯rms and Figure 5b for the patenting ¯rms.
While neither patents nor citation-weighted patents have as great an explanatory power for the
market to book ratio as R&D during the earlier years, by 1984-1986 the citation-weighted patents
are doing about as well as R&D, especially when we focus on patenting ¯rms, though this is partly
because the explanatory power of R&D has declined.15
It is noteworthy that the date at which the explanatory power of citation-weighted patents
converges to that of R&D in Figure 5b coincides roughly with a number of events that led to an
increase in patenting activity during the mid-eighties, such as the Kodak-Polaroid decision. One
interpretation is that patenting and citation behavior changed around this time because of changing
litigation conditions. This might be explored further by looking more closely at which ¯rms are
making and receiving the citations. That is, does fear of litigation lead ¯rms to cite others' patents
more carefully in order to fence o® their own technology?
[Figures 5a and 5b about here]
Because of the inaccuracy of our citation measures post-1990 and because the shadow value of
our measures seems to change over time, in the remainder of this section of the paper we focus on
one ten-year period in the middle of our sample where the data are the most complete, and where
the valuation coe±cients do not change dramatically in Figures 5a and 5b, the 1979-1988 period.
4.4. Explorations(1): Do citations add information?
A second, more informative way to look at the valuation problem is to hypothesize that although
patents are clearly correlated with R&D activity at the ¯rm level, they measure something that
is distinct from R&D, either "success" in innovative activity, or perhaps success in appropriating
the returns to such activity. This suggests that we should include the yield of patents or citations
per R&D dollar as a separate variable in the equation. When interpreting the coe±cient, it is
important to note that R&D is a nominal quantity while patents are "real," so part of what we
15See Hall (1993a,b) for year-by-year measures of the market value of R&D investments.
16
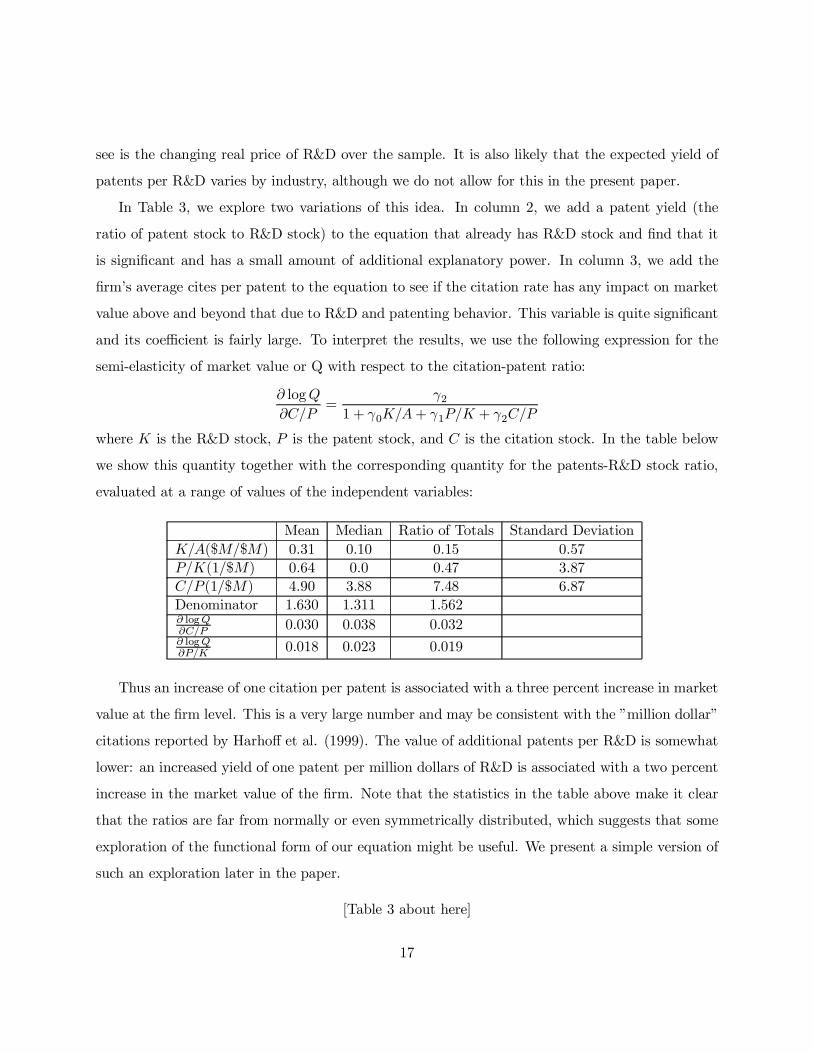
see is the changing real price of R&D over the sample. It is also likely that the expected yield of
patents per R&D varies by industry, although we do not allow for this in the present paper.
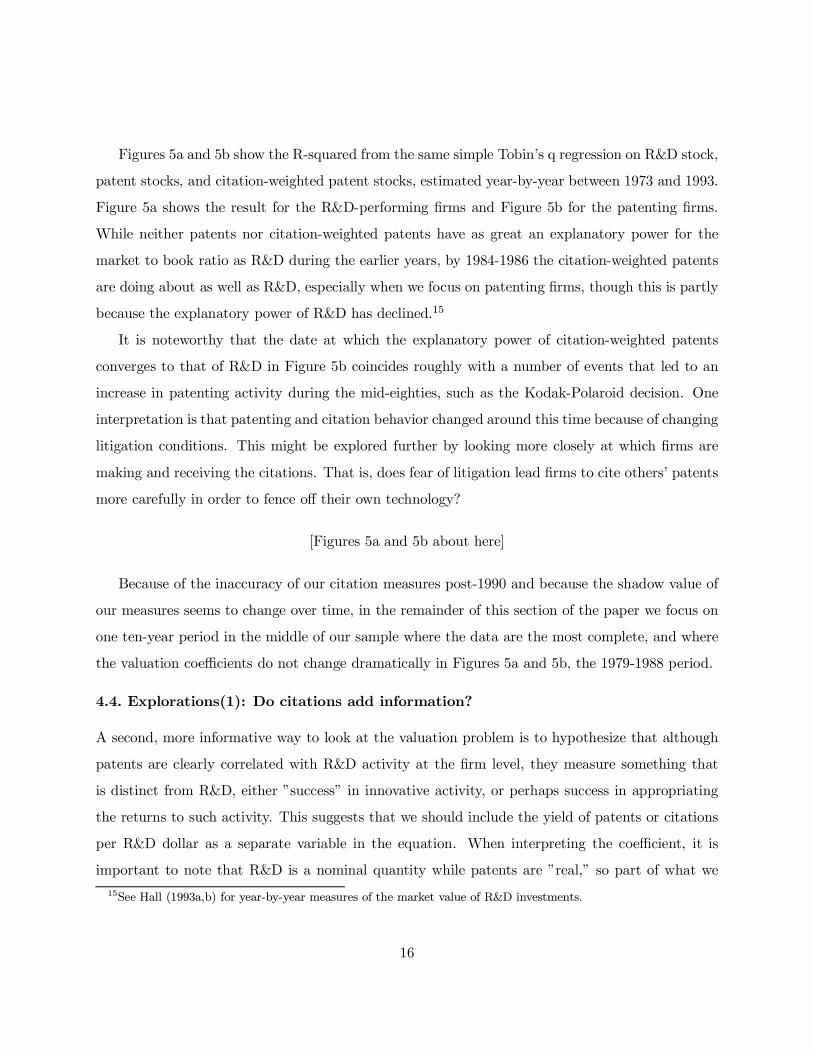
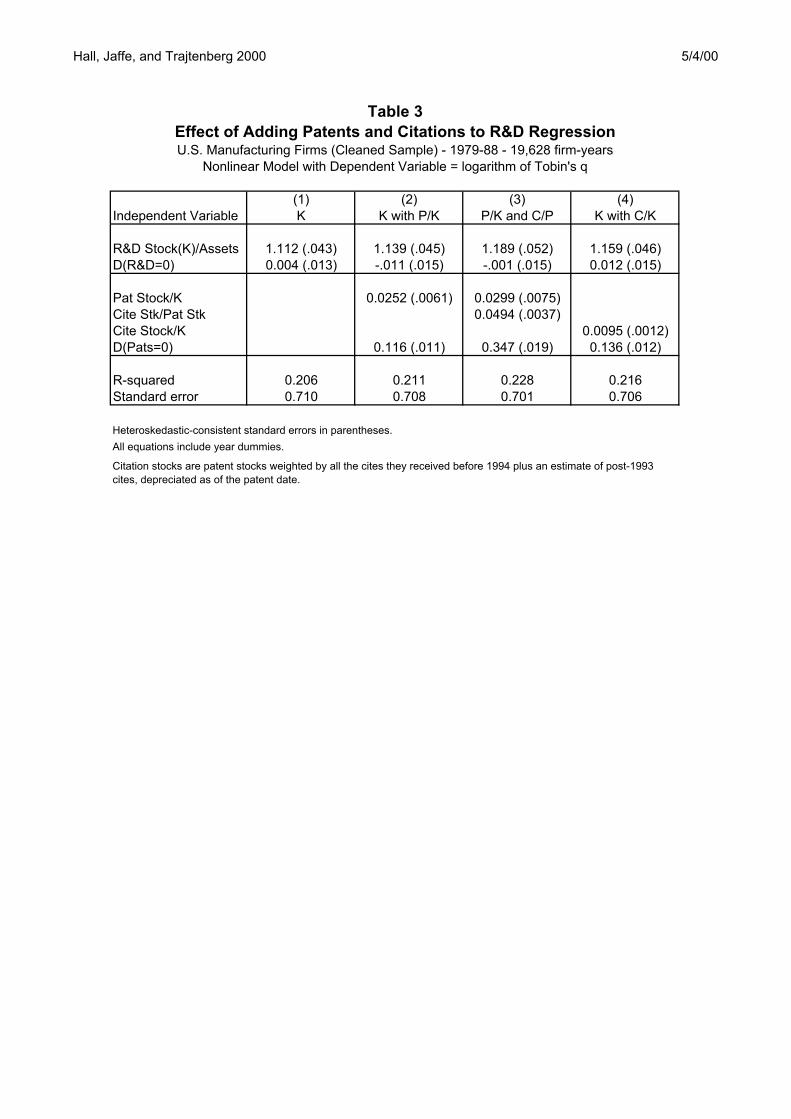
In Table 3, we explore two variations of this idea. In column 2, we add a patent yield (the
ratio of patent stock to R&D stock) to the equation that already has R&D stock and ¯nd that it
is signi¯cant and has a small amount of additional explanatory power. In column 3, we add the
¯rm's average cites per patent to the equation to see if the citation rate has any impact on market
value above and beyond that due to R&D and patenting behavior. This variable is quite signi¯cant
and its coe±cient is fairly large. To interpret the results, we use the following expression for the
semi-elasticity of market value or Q with respect to the citation-patent ratio:
@ logQ
@C=P=
°21 + °0K=A+ °1P=K + °2C=P
where K is the R&D stock, P is the patent stock, and C is the citation stock. In the table below
we show this quantity together with the corresponding quantity for the patents-R&D stock ratio,
evaluated at a range of values of the independent variables:
Mean Median Ratio of Totals Standard Deviation
K=A($M=$M) 0.31 0.10 0.15 0.57
P=K(1=$M) 0.64 0.0 0.47 3.87
C=P (1=$M) 4.90 3.88 7.48 6.87
Denominator 1.630 1.311 1.562@ logQ@C=P 0.030 0.038 0.032@ logQ@P=K 0.018 0.023 0.019
Thus an increase of one citation per patent is associated with a three percent increase in market
value at the ¯rm level. This is a very large number and may be consistent with the "million dollar"
citations reported by Harho® et al. (1999). The value of additional patents per R&D is somewhat
lower: an increased yield of one patent per million dollars of R&D is associated with a two percent
increase in the market value of the ¯rm. Note that the statistics in the table above make it clear
that the ratios are far from normally or even symmetrically distributed, which suggests that some
exploration of the functional form of our equation might be useful. We present a simple version of
such an exploration later in the paper.
[Table 3 about here]
17
4.5. Explorations(2): When do citations add information?
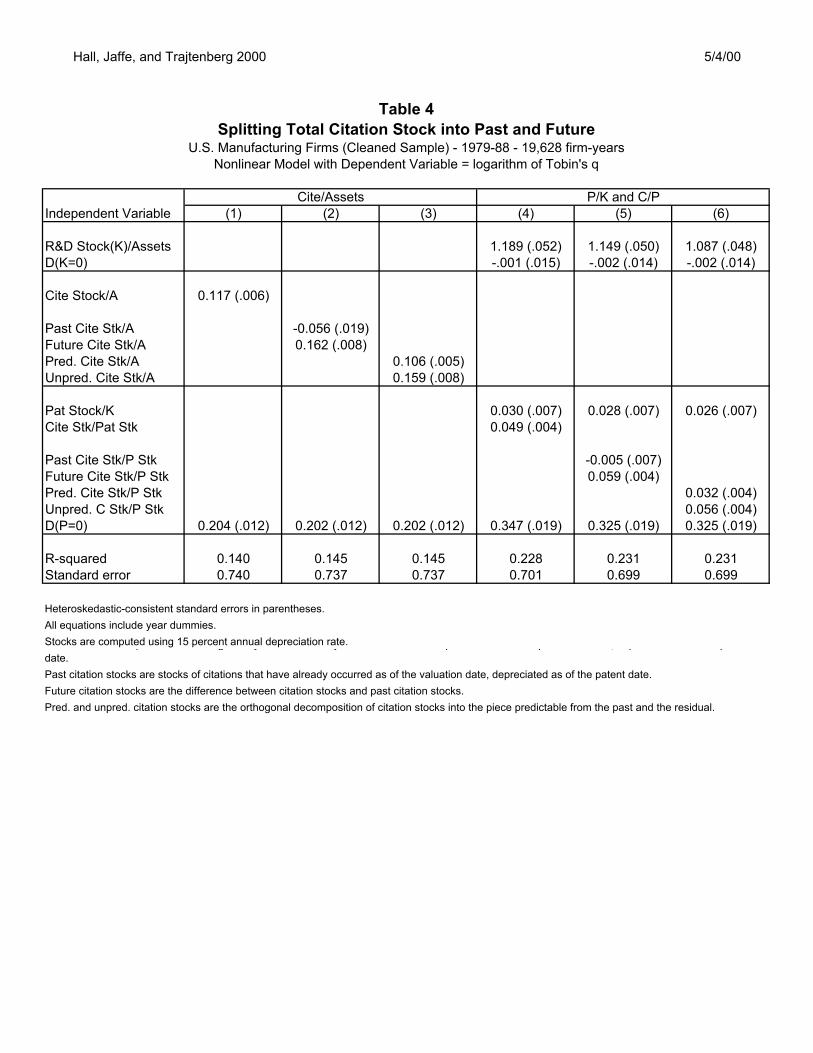
Table 4 shows the results of an investigation into whether there is a di®erence between the market
valuation of past and future citations. The answer is a resounding yes (see columns 2 and 5 of Table
4). Whether we include the citation stock alone (column 2) or use the full model with R&D and
patents (column 5), the coe±cient of a stock based only on future citations is equal to or greater
than the coe±cient of the stock based on all citations, and the coe±cient of the past citation stock
is negative and marginally signi¯cant or insigni¯cant. The apparent implication is that future
citations are more correlated than past citations with the expected pro¯tability of the patent right.
Because the two stocks, past and future, are highly correlated measures of the same underlying
quantity, this ¯nding does not necessarily imply that citations are worthless for forecasting the
value of the knowledge assets associated with patents or the expected pro¯t stream from those
assets. The past citation stock of a ¯rm could be an excellent forecast of the future citations that
are expected for its patent portfolio, even though it is not quite as good as knowing the future
citations when predicting the ¯rm's market value. To explore this idea, we decomposed the total
citation stock into the part predicted by the past citation stock and the part that is not predicted:16
KC(t) = E[KC(t)jKPPC(t)] +KC(t)¡ E[KC(t)jKPPC(t)]
= cKC(t) + eKc(t)
where KC(t) denotes the total citation weighted patent stock at time t and KPPC(t) denotes
the patent stock weighted by the citations received as of time t (see Appendix C for details on
construction of these variables). The results of including the citation-assets and citation-patent
ratios partitioned in this way are shown in columns 3 and 6 of Table 4. In all cases, the coe±cient
of the unexpected portion of the total citation stock is approximately the same as the coe±cient
of the future citation stock in the preceding column. The coe±cient of the predictable portion of
the total citation stock is approximately 40 percent lower, although still quite signi¯cant. Thus,
although future citations are a more powerful indicator of the market value of the patent portfolio
held by these ¯rms, past citations clearly also help in forecasting future returns.
Figures 6 and 7 show the coe±cients that result when both past and future citation-weighted
16We also included a full set of time dummies in the conditioning set.
18
patent stocks or predictable and unpredictable citation-weighted stocks are included in the same
Tobin's q equation year-by-year for the 1973-1993 period. In Figure 6, we see that the future
citation-weighted patent stock is clearly preferred over the past and that the latter has a coe±cient
that is zero or negative. When we separate the citation stock via the orthogonal decomposition
of predictable based on the past versus unpredictable, we ¯nd that both enter, but that the un-
predictable portion has a higher shadow value in the equation and that the predictable portion
behaves more or less like the total stock (Figure 7).17
[Figure 6 about here]
[Figure 7 about here]
4.6. Explorations(3): How do citations add information?
Our working hypothesis is that citations are an indicator of the (private) value of the associated
patent right, and are therefore correlated with the market value of the ¯rm because investors value
the ¯rm's stock of knowledge. For this reason, it is of interest to explore the question of the precise
shape of the citation valuation distribution: does the fact that a ¯rm's patents yield fewer citations
than average mean that its R&D has been unproductive? How does the valuation change for ¯rms
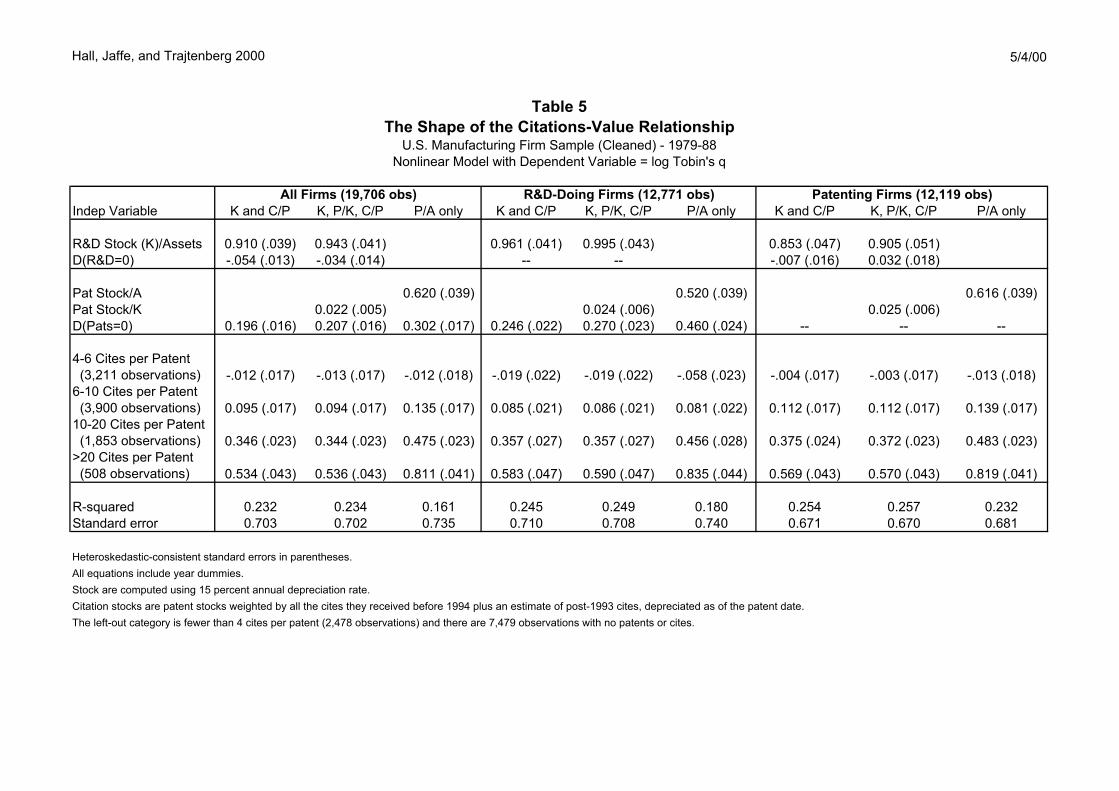
with patents that have very high citation yields of the sort we saw in Figure 4? Table 5 explores
these questions. We broke the average citation stock per patent stock variable up into 5 groups:
less than 4, 4-6 (the median for ¯rms with patents), 6-10, 10-20, and more than 20 (see Table 5
for details). The groups are unequal partly because we were interested in the tail behavior. We
then included dummy variables for four of the ¯ve groups in the valuation regression (the left-out
category was 0-4 citations per patent).
[Table 4 about here]
The results are quite striking. For ¯rms with less than the median number of citations per
patent (6), it makes no di®erence how far below the median they fall; ¯rms with 4-6 citations per
patent have no higher value than ¯rms with less than 4 (the left-out category). However, ¯rms
17Interpretation here is a bit dicey. These coe±cients ought to be normalized in some way to put them on acommon ground.
19
that average more than the median number of citations per patent have a very signi¯cant increase
in market value, and one that appears to be approximately linear. The most dramatic e®ect is for
the 508 observations (184 ¯rms) with a stock of more than 20 cites per patent: the market value
of these ¯rms is 54-58 percent higher than would be expected given their R&D capital and their
patent stock.
Further investigation of these 184 ¯rms revealed the following: they are concentrated in comput-
ing, o±ce equipment, semiconductor, and electronics (259 observations on 82 ¯rms), pharmaceuti-
cals and medical instruments (149 observations on 52 ¯rms), and to a lesser extent, in textiles and
apparel (28 observations on 7 ¯rms), and machinery (32 observations on 13 ¯rms). They include
both quite small (so they have a very few highly cited patents) and medium to large ¯rms (such
as Intel, Compaq Computer, Tandem Computer, Alza Corp, and Signal Companies). It appears
that the larger ¯rms are primarily in the electronics sector, broadly de¯ned, while those in the
pharmaceutical sector that average a high citation rate are more likely to be smaller biotechnology
¯rms. It should be kept in mind that we are focusing here on a period that spans the period during
which profound changes in patenting strategy took place in some industries after the creation of
the Circuit Court of Appeals and the well-known Kodak-Polaroid decision of 1986 - see Hall and
Ham 1999 inter alia, for discussion of this point).
5. Conclusion and Suggestions for Further Research
This paper is a "¯rst look" at these data. We ¯nd that augmenting ¯rms' patent counts with
citation intensity information produces a proxy for the ¯rms' knowledge stocks that is considerably
more value-relevant than the simple patent count itself. It remains true that, for most of the time
period, patent-related measures cannot win a "horserace" with R&D as an explanator of market
value. But this should not surprise us. As emphasized by Sam Kortum in his comments on this
paper, even if citations are a reasonably informative signal of success, this does not mean they
will be more correlated with value than R&D, because optimizing ¯rms will increase their R&D
in response to success. The citation stock is also associated with signi¯cant incremental market
value after controlling for ¯rms' R&D. Indeed, ¯rms with very highly cited patents (more than
20 cites per patent), the estimates imply almost implausibly large market value di®erences, on the
20
order of a 50% increase in value, relative to ¯rm with the same R&D and patent stocks but with
the median citation intensity
The main truly new result is that market value is correlated, to a signi¯cant extent, with the
portion of eventual citations that cannot be predicted based on past citations. This suggests
that the market "already knows" much about the quality of inventions, which will ultimately be
con¯rmed by the arrival of future citations that are "unexpected" in the sense of unpredictable
based only on past citation information. This result clearly requires further exploration. First,
it would be useful to explore the use of a functional form or normalization that would allow the
relative value of past and future citations to be compared more directly, rather than just asking
which adds more to the R-squared. In addition, one could ask how many years' worth of citations
does one have to see to know most of what citations will eventually reveal. Is 10 years enough?
What fraction of what you "know" (in the sense of correlation with market value) by knowing
the lifetime citations do you "know" after 5 years? Also, one could explore whether this result
is driven by the tail of the distribution, which we know is associated with much of the value. In
other words, to what extent is it possible to predict that a patent will ultimately get >20 citations
based only on the ¯rst few years' patents? Is it this di±culty of predicting the really big winners
that makes the unpredictable portion of the citations total so important?
Other variations on the results include more exploration of the shape of the citations-value
relationship. Has the importance of highly cited patents changed over time with changes in the
patent regime? As noted, the ¯rm-years with a citation intensity above 20 include both small
and large ¯rms. It would be useful to sort out whether these are di®erent from each other, and
also the extent to which the results relating to an average citation intensity of more than 20 are
themselves driven by a few patents in the extreme tail. Here again, it would be useful to explore
other functional forms.
In addition to these variations on the themes already struck, there are other aspects of citation
behavior that ought to be value-relevant. These include:
² Self citations. Approximately one-quarter of citations received by corporate patents comefrom other patents assigned to the same company. Such "self citations may represent con-
struction of patent thickets or other behaviors that are less value-relevant than citations from
21
outsiders. On the other hand, a self-citation may represent evidence that the ¯rm is success-
fully appropriating downstream impacts that would otherwise represent spillovers stemming
from the patent. This would imply that self-citations are more valuable than citations from
others. We could have two counts of citations, and allow for di®erent coe±cients on self ver-
sus other citations in the market value equation. Preliminary investigation suggests that the
self-citation e®ect is small and positive: if the "self" share of citations is higher, the market
value is higher, other things equal.
² Generality. Trajtenberg, Ja®e, and Henderson have proposed a measure of "generality,"
de¯ned as (1 minus) the Her¯ndahl Index of concentration of citations over patent classes.
The idea is that citations that are spread over a larger number of technological ¯elds are
more "general", and vice versa. In terms of impacting the market value of ¯rms, though, one
could hypothesize the following: for ¯rms that concentrate in narrow ¯elds of activity, more
generality is bad, since the ¯rm will not be able to appropriate the spillovers to other ¯elds.
For conglomerates, the opposite may be true. Thus, we could compute the average generality
of patents for ¯rm j in year t, and interact this variable with a dummy for whether or not
the ¯rm is a conglomerate. This may be tricky; see the strategy literature on diversi¯cation
that occurs in order to exploit an innovation resource base (Silverman 1997). We may need
to normalize generality as well, since the measure depends on the number of citations. This
suggests both conceptual di±culty in separating the e®ects of citation intensity and generality,
and also a complex truncation problem in the generality measure itself.
6. Bibliography
Albert, M. B., D. Avery, F. Narin, and P. McAllister. 1991. "Direct Validation of Citation Counts
as Indicators of Industrially Important Patents," Research Policy 20: 251-259.
Austin, David. 1994. "Patent Citations and Appropriability," Washington, DC: Resources for
the Future Discussion paper No. 94-12 (February).
Austin, David. 1993a. "An Event Study Approach to Measuring Innovative Output: The Case
of Biotechnology," American Economic Review 83 (May): 253-258.
. 1993b. Ph. D. thesis, Department of Economics, University of California at Berkeley.
22
Blundell, Richard, Rachel Gri±th, and John van Reenen. 1995. "Market Share, Market Value,
and Innovation in a Panel of British Manufacturing Firms." London: University College London
Discussion Paper 95/19 (October).
Caballero, Ricardo, and Adam Ja®e. 1993. "Standing on the Shoulders of Giants: An Empirical
Assessment of Knowledge Spillovers and Creative Destruction in a Model of Economic Growth,"
in O. Blanchard and S. Fischer, eds, NBER Macroeconomics Annual, 1993.
Chakrabarti, Alok K., Israel Dror, and Nopphdol Eukabase. 1993. "Interorganization Transfer
of Management - An Analysis of Patent Citations for a Defense Firm," IEEE Transactions on
Engineering Management (February 1993): 91-94.
Chaney, Paul K., Timothy M. Devinney, and Russell S. Winer. 1991. "The Impact of New
Product Introductions on the Market Value of Firms," Journal of Business 64(4): 573-610.
Cockburn, Iain, and Zvi Griliches. 1988. "Industry E®ects and Appropriability Measures in the
Stock Market's Valuation of R&D and Patents," American Economic Review 78 (May): 419-23.
Cohen, Wesley M., Richard R. Nelson, and John Walsh. 1996. "A First Look at the Results
of the Carnegie-Mellon Survey of Industrial R&D in the United States. Pittsburgh, PA: Carnegie-
Mellon University. Photocopied.
Connolly, Robert A., and Mark Hirschey. 1988. "Market Value and Patents: A Bayesian
Approach," Economics Letters 27(1): 83-87.
Connolly, Robert A., Barry T. Hirsch, and Mark Hirschey. 1986. "Union Rent Seeking, Intan-
gible Capital, and Market Value of the Firm," Review of Economics and Statistics 68(4): 567-77.
Economist, The. 1993. "Patents: Hidden Agenda," The Economist (20 November): 100-101.
Fisher, Franklin M., and John J. McGowan. 1983. "On the Misuse of Accounting Rates of
Return to Infer Monopoly Pro¯ts," American Economic Review 73 (2): 82-97.
Griliches, Zvi. 1961. "Hedonic Prices for Automobiles: An Econometric Analysis of Quality
Change," reprinted in Griliches, Zvi (ed.), Price Indexes and Quality Change: Studies in New
Methods of Measurement. Cambridge, Mass.: Harvard University Press, 55-87.
. 1981. "Market Value, R&D, and Patents," Economic Letters 7: 183-187.
(editor). 1984. R&D, Patents and Productivity, University of Chicago Press.
. 1990. "Patents Statistics as Economic Indicators," Journal of Economic Literature
23
92: 630-653.
Griliches, Zvi, Bronwyn H. Hall, and Ariel Pakes. 1991. "R&D, Patents, and Market Value
Revisited: Is There a Second (Technological Opportunity) Factor?" Economics of Innovation and
New Technology 1: 183-202.
Griliches, Zvi, Ariel Pakes, and Bronwyn H. Hall. 1987. "The Value of Patents as Indicators
of Inventive Activity," in Dasgupta, Partha, and Paul Stoneman (eds.), Economic Policy and
Technological Performance. Cambridge, England: Cambridge University Press, 97-124.
Hall, Bronwyn H. 1990. "The Manufacturing Sector Master File: 1959-1987," Cambridge,
Mass.: NBER Working Paper No. 3366 (May).
. 1993a. "The Stock Market Valuation of R&D Investment during the 1980s,"
American Economic Review 83: 259-264.
. 1993b. "Industrial Research during the 1980s: Did the Rate of Return Fall?"
Brookings Papers on Economic Activity Micro (2): 289-344.
Hall, Bronwyn H., and Rose Marie Ham. 1999. "The Patent Paradox Revisited: Determinants
of Patenting in the U.S. Semiconductor Industry, 1980-94," UC Berkeley and NBER: Photocopied.
Hall, Bronwyn H., and Daehwan Kim. 1997. "Valuing Intangible Assets: The Stock Market
Value of R&D Revisited." UC Berkeley, Nu±eld College, Harvard University, and NBER: work in
progress.
Harho®, Dietmar, Francis Narin, F.M. Scherer, and Katrin Vopel. 1999. "Citation Frequency
and the Value of Patented Inventions," The Review of Economics and Statistics, 81, 3, 511-515,
August.
Hayashi, Fumio, and Tonru Inoue. 1991. "The Relation between Firm Growth and q with
Multiple Capital Goods: Theory and Evidence from Panel Data on Japanese Firms," Econometrica
59 (3): 731-753.
Hirschey, Mark, Vernon J. Richardson, and Susan Scholz. 1998. "Value Relevance of Non¯nan-
cial Information: The Case of Patent Data," University of Kansas School of Business: Photocopied.
Ja®e, Adam. 1986. "Technological Opportunity and Spillovers of R&D: Evidence from Firms'
Patents, Pro¯ts, and Market Value," American Economic Review 76: 984-1001.
Ja®e, Adam, Michael Fogarty and Bruce Banks. 1998. "Evidence from Patents and Patent
24
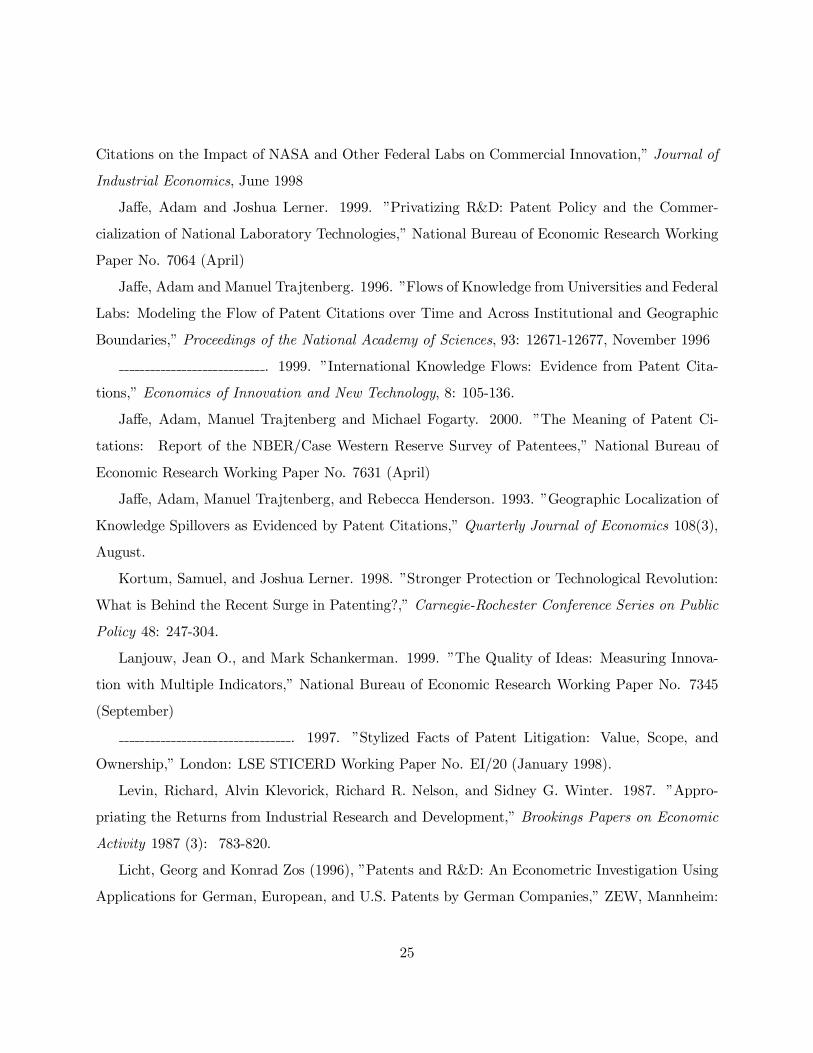
Citations on the Impact of NASA and Other Federal Labs on Commercial Innovation," Journal of
Industrial Economics, June 1998
Ja®e, Adam and Joshua Lerner. 1999. "Privatizing R&D: Patent Policy and the Commer-
cialization of National Laboratory Technologies," National Bureau of Economic Research Working
Paper No. 7064 (April)
Ja®e, Adam and Manuel Trajtenberg. 1996. "Flows of Knowledge from Universities and Federal
Labs: Modeling the Flow of Patent Citations over Time and Across Institutional and Geographic
Boundaries," Proceedings of the National Academy of Sciences, 93: 12671-12677, November 1996
. 1999. "International Knowledge Flows: Evidence from Patent Cita-
tions," Economics of Innovation and New Technology, 8: 105-136.
Ja®e, Adam, Manuel Trajtenberg and Michael Fogarty. 2000. "The Meaning of Patent Ci-
tations: Report of the NBER/Case Western Reserve Survey of Patentees," National Bureau of
Economic Research Working Paper No. 7631 (April)
Ja®e, Adam, Manuel Trajtenberg, and Rebecca Henderson. 1993. "Geographic Localization of
Knowledge Spillovers as Evidenced by Patent Citations," Quarterly Journal of Economics 108(3),
August.
Kortum, Samuel, and Joshua Lerner. 1998. "Stronger Protection or Technological Revolution:
What is Behind the Recent Surge in Patenting?," Carnegie-Rochester Conference Series on Public
Policy 48: 247-304.
Lanjouw, Jean O., and Mark Schankerman. 1999. "The Quality of Ideas: Measuring Innova-
tion with Multiple Indicators," National Bureau of Economic Research Working Paper No. 7345
(September)
. 1997. "Stylized Facts of Patent Litigation: Value, Scope, and
Ownership," London: LSE STICERD Working Paper No. EI/20 (January 1998).
Levin, Richard, Alvin Klevorick, Richard R. Nelson, and Sidney G. Winter. 1987. "Appro-
priating the Returns from Industrial Research and Development," Brookings Papers on Economic
Activity 1987 (3): 783-820.
Licht, Georg and Konrad Zos (1996), "Patents and R&D: An Econometric Investigation Using
Applications for German, European, and U.S. Patents by German Companies," ZEW, Mannheim:
25
Photocopied.
Megna, Pamela, and Mark Klock. 1993. "The Impact of Intangible Capital on Tobin's Q in
the Semiconductor Industry," American Economic Review 83: 265-269.
Narin, Francis, Kimberly S. Hamilton and Dominic Olivastro. 1997. "The Increasing Linkage
between U.S. Technology and Public Science," Research Policy, 26, 3, 317-330
Pakes, Ariel. 1985. "On Patents, R&D, and the Stock Market Rate of Return," Journal of
Political Economy 93: 390-409.
Pakes, Ariel. 1986. "Patents as Options: Some Estimates of the Value of Holding European
Patent Stocks," Econometrica 54: 755-784.
Pakes, Ariel, and Mark Schankerman. 1984. "The Rate of Obsolescence of Patents, Research
Gestation Lags, and the Private Rate of Return to Research Resources," in Griliches, Zvi (ed.),
R&D, Patents, and Productivity, Chicago: University of Chicago Press.
Sampat, Bhaven N. 1998. "Cite-Seeing: Patent Citations and Economic Value," New York:
Columbia University. Photocopied.
Schankerman, Mark. 1998. "How Valuable is Patent Protection? Estimates by Technology
Field," Rand Journal of Economics 29: 77-107.
Schankerman, Mark, and Ariel Pakes. 1986. "Estimates of the Value of Patent Rights in
European Countries during the Post-1950 Period," Economic Journal 97: 1-25.
Scherer, F. M. 1998. "The Size Distribution of Pro¯ts from Innovation," Annales d'Economie
et de Statistique 49/50: 495-516.
Scherer, F. M. 1965. "Firm Size, Market Structure, Opportunity, and the Output of Patented
Innovations," American Economic Review 55: 1097-1123.
Scherer, F. M., Dietmar Harho®, and Joerg Kukies. 1998. "Uncertainty and the Size Distribu-
tion of Rewards from Technological Innovation," University of Mannheim. Photocopied.
Schmookler, Jacob. 1966. Invention and Economic Growth, Cambridge, Mass.: Harvard Uni-
versity Press.
Shane, Hilary. 1993. "Patent Citations as an Indicator of the Value of Intangible Assets in the
Semiconductor Industry." Philadelphia, PA: The Wharton School. Photocopied (November).
Shane, Scott. 1999a. "Selling University Technology," mimeo
26
Shane, Scott. 1999b. "Technological Opportunities and New Firm Creation," mimeo
Trajtenberg, Manuel. 1989. "The Welfare Analysis of Product Innovations, with an Application
to Computed Tomography Scanners," Journal of Political Economy 97 (2): 445-479.
. 1990. "A Penny for Your Quotes: Patent Citations and the Value of Innovations,"
Rand Journal of Economics 21 (1): 172-187.
Trajtenberg, Manuel, Rebecca Henderson, and Adam Ja®e. 1997. "University versus Corporate
Patents: A Window on the Basicness of Invention," Economics of Innovation and New Technology
5: 19-50.
Waugh, Frederick V. 1928. "Quality Factors In°uencing Vegetable Prices," Journal of Farm
Economics 10(2): 185-196.
Wildasin, David. 1984. "The q Theory of Investment with Many Capital Goods," American
Economic Review 74 (1): 203-210.
27
Hall, Jaffe, and Trajtenberg 2000 5/4/00
Study Country Years Functional Other R&D R&D Stock Patent or Innov Comments(industry) Form Variables Coeff Coeff Coeff
Griliches 1981 US 1968-74 Linear (Q) Time & Firm dummies, [log Q(-1)] 1.0-2.0 .08 to .25 ? units appear to be 100 patsBen-Zion 1984 US 1969-76 Linear (V) Ind dummies, Investment, Earnings 3.4 (0.5) .065 (.055) No time dummies?Jaffe 1986 US 1973, 79 Linear (Q) Time & tech dummies, C4, mkt share, 7.9 (3.3) 3SLS even higher
Tech pool, interactionsConnolly, Hirsch, Hirschey 1986 US 1977 Linear (EV/S) Growth,risk,age,Mkt share,C4,Adv, 7.0 (0.8) 4.4 (0.6) Unexpected patents
Union share, Ind dummiesCockburn, Griliches 1988 US Linear (Q) Industry appropriability (Yale survey) .9-1.2 0.1 patent coef. Is insignificantGriliches, Pakes, Hall 1987 USConnolly, Hirschey 1988 US 1977 Linear (EV/S) Growth, risk, C4, Adv 5.6 (0.6) 5.7 (0.5) Bayesian estimationHall 1993a US 1973-91 Linear (V) Assets, Cash flow, Adv, Gr, time dummies 2.5-3.0 (.8) 0.48 (.02) By year alsoHall 1993b US 1972-90 Linear (Q) time dummies 2.0-10.0 0.5-2.0 By year; LAD; absolute coeffJohnson, Pazderka 1993 USThompson 1993 US
Megna, Klock 1993semi-
conductors 1977-90 Linear (Q) Rivals R&D and patents 0.82 (0.2) 0.38 (0.2) Patent stockBlundell, Griffith, van Reenen 1995 UK 1972-82 Linear (V) Time dummies,Assets,Mkt share 1.93 (.93) Innovation countsStoneman, Toivanen 1997 UK 1989-95 Linear (V) Assets,Debt,Growth,Mkt share,investment, 2.5 (1.5) insig. Selection correction; by year
Cashflow, time dummies, Mills ratio
Table 1Market Value - Innovation Studies with R&D and Patents
Hall, Jaffe, and Trajtenberg 2000 5/4/00
Number of observationsR&D Stock/Assets 1.736 (.069) 1.741 (.070) 1.754 (.082)D(R&D=0) .029 (.014) - - 0.024 (.017) Patent Stock/Assets 0.607 (.042) 0.493 (.042) 0.599 (.041)Cite Stock/Assets 0.108 (.006) 0.087 (.006) 0.107 (.006)D(Pats=0) 0.120 (.013) 0.144 (.013) 0.252 (.019) 0.282 (.018) - - - -
R-squared 0.228 0.110 0.138 0.249 0.127 0.161 0.231 0.129 0.181Std. Err. 0.669 0.719 0.707 0.683 0.737 0.722 0.644 0.685 0.665
Ratio of Total Pats or Cites to Total R&D ($1980M) 0.566 4.228 0.550 4.125 0.619 4.617Coefficient scaled by ratio of totals 1.736 0.344 0.457 1.741 0.271 0.359 1.754 0.371 0.494
Number of observationsR&D Stock/Assets 0.547 (.027) 0.560 (.027) 0.563 (.033)D(R&D=0) 0.004 (.015) - - 0.027 (.019) Patent Stock/Assets 0.710 (.049) 0.638 (.050) 0.711 (.049)Cite Stock/Assets 0.080 (.005) 0.074 (.005) 0.080 (.005)D(Pats=0) 0.144 (.014) 0.148 (.014) 0.279 (.020) 0.291 (.019) - - - -
R-squared 0.116 0.067 0.085 0.123 0.077 0.103 0.121 0.103 0.134Std. Err. 0.748 0.769 0.761 0.764 0.784 0.773 0.729 0.737 0.724
Ratio of Total Pats or Cites to Total R&D ($1987M) 0.331 2.979 0.324 2.928 0.352 3.162Coefficient scaled by ratio of totals 0.547 0.235 0.238 0.560 0.207 0.217 0.563 0.250 0.253
Heteroskedastic-consistent standard errors.All equations have a complete set of year dummies.Stocks are computed using 15 percent annual depreciation rate.
Patenting Firms
Table 2
U.S. Manufacturing Firm Sample (Cleaned) - 1976-92Nonlinear Model with Dependent Variable = log Tobin's q
All Firms R&D-Doing Firms
"Horse-race" Regressions comparing R&D, Patents and Citations
15,605 10,432 9,718
Period: 1976-1984
Period: 1985-1992
17,111 10,761 10,509
Tab2
Hall, Jaffe, and Trajtenberg 2000 5/4/00
(1) (2) (3) (4)Independent Variable K K with P/K P/K and C/P K with C/K
R&D Stock(K)/Assets 1.112 (.043) 1.139 (.045) 1.189 (.052) 1.159 (.046)D(R&D=0) 0.004 (.013) -.011 (.015) -.001 (.015) 0.012 (.015)
Pat Stock/K 0.0252 (.0061) 0.0299 (.0075)Cite Stk/Pat Stk 0.0494 (.0037)Cite Stock/K 0.0095 (.0012)D(Pats=0) 0.116 (.011) 0.347 (.019) 0.136 (.012)
R-squared 0.206 0.211 0.228 0.216Standard error 0.710 0.708 0.701 0.706
Heteroskedastic-consistent standard errors in parentheses.All equations include year dummies.
Citation stocks are patent stocks weighted by all the cites they received before 1994 plus an estimate of post-1993 cites, depreciated as of the patent date.
Table 3
U.S. Manufacturing Firms (Cleaned Sample) - 1979-88 - 19,628 firm-yearsNonlinear Model with Dependent Variable = logarithm of Tobin's q
Effect of Adding Patents and Citations to R&D Regression
Hall, Jaffe, and Trajtenberg 2000 5/4/00
Independent Variable (1) (2) (3) (4) (5) (6)
R&D Stock(K)/Assets 1.189 (.052) 1.149 (.050) 1.087 (.048)D(K=0) -.001 (.015) -.002 (.014) -.002 (.014)
Cite Stock/A 0.117 (.006)
Past Cite Stk/A -0.056 (.019) Future Cite Stk/A 0.162 (.008)Pred. Cite Stk/A 0.106 (.005)Unpred. Cite Stk/A 0.159 (.008)
Pat Stock/K 0.030 (.007) 0.028 (.007) 0.026 (.007)Cite Stk/Pat Stk 0.049 (.004)
Past Cite Stk/P Stk -0.005 (.007) Future Cite Stk/P Stk 0.059 (.004)Pred. Cite Stk/P Stk 0.032 (.004)Unpred. C Stk/P Stk 0.056 (.004)D(P=0) 0.204 (.012) 0.202 (.012) 0.202 (.012) 0.347 (.019) 0.325 (.019) 0.325 (.019)
R-squared 0.140 0.145 0.145 0.228 0.231 0.231Standard error 0.740 0.737 0.737 0.701 0.699 0.699
Heteroskedastic-consistent standard errors in parentheses.All equations include year dummies.Stocks are computed using 15 percent annual depreciation rate.
Past citation stocks are stocks of citations that have already occurred as of the valuation date, depreciated as of the patent date. Future citation stocks are the difference between citation stocks and past citation stocks.Pred. and unpred. citation stocks are the orthogonal decomposition of citation stocks into the piece predictable from the past and the residual.
p g y y p p , p pdate.
Cite/Assets P/K and C/P
Table 4
U.S. Manufacturing Firms (Cleaned Sample) - 1979-88 - 19,628 firm-yearsNonlinear Model with Dependent Variable = logarithm of Tobin's q
Splitting Total Citation Stock into Past and Future
Hall, Jaffe, and Trajtenberg 2000 5/4/00
Indep Variable K and C/P K, P/K, C/P P/A only K and C/P K, P/K, C/P P/A only K and C/P K, P/K, C/P P/A only
R&D Stock (K)/Assets 0.910 (.039) 0.943 (.041) 0.961 (.041) 0.995 (.043) 0.853 (.047) 0.905 (.051) D(R&D=0) -.054 (.013) -.034 (.014) -- -- -.007 (.016) 0.032 (.018)
Pat Stock/A 0.620 (.039) 0.520 (.039) 0.616 (.039)Pat Stock/K 0.022 (.005) 0.024 (.006) 0.025 (.006)D(Pats=0) 0.196 (.016) 0.207 (.016) 0.302 (.017) 0.246 (.022) 0.270 (.023) 0.460 (.024) -- -- --
4-6 Cites per Patent (3,211 observations) -.012 (.017) -.013 (.017) -.012 (.018) -.019 (.022) -.019 (.022) -.058 (.023) -.004 (.017) -.003 (.017) -.013 (.018)6-10 Cites per Patent (3,900 observations) 0.095 (.017) 0.094 (.017) 0.135 (.017) 0.085 (.021) 0.086 (.021) 0.081 (.022) 0.112 (.017) 0.112 (.017) 0.139 (.017)10-20 Cites per Patent (1,853 observations) 0.346 (.023) 0.344 (.023) 0.475 (.023) 0.357 (.027) 0.357 (.027) 0.456 (.028) 0.375 (.024) 0.372 (.023) 0.483 (.023)>20 Cites per Patent (508 observations) 0.534 (.043) 0.536 (.043) 0.811 (.041) 0.583 (.047) 0.590 (.047) 0.835 (.044) 0.569 (.043) 0.570 (.043) 0.819 (.041)
R-squared 0.232 0.234 0.161 0.245 0.249 0.180 0.254 0.257 0.232Standard error 0.703 0.702 0.735 0.710 0.708 0.740 0.671 0.670 0.681
Heteroskedastic-consistent standard errors in parentheses.All equations include year dummies.Stock are computed using 15 percent annual depreciation rate.
The left-out category is fewer than 4 cites per patent (2,478 observations) and there are 7,479 observations with no patents or cites.Citation stocks are patent stocks weighted by all the cites they received before 1994 plus an estimate of post-1993 cites, depreciated as of the patent date.
Patenting Firms (12,119 obs)
Table 5
U.S. Manufacturing Firm Sample (Cleaned) - 1979-88Nonlinear Model with Dependent Variable = log Tobin's q
R&D-Doing Firms (12,771 obs)All Firms (19,706 obs)
The Shape of the Citations-Value Relationship
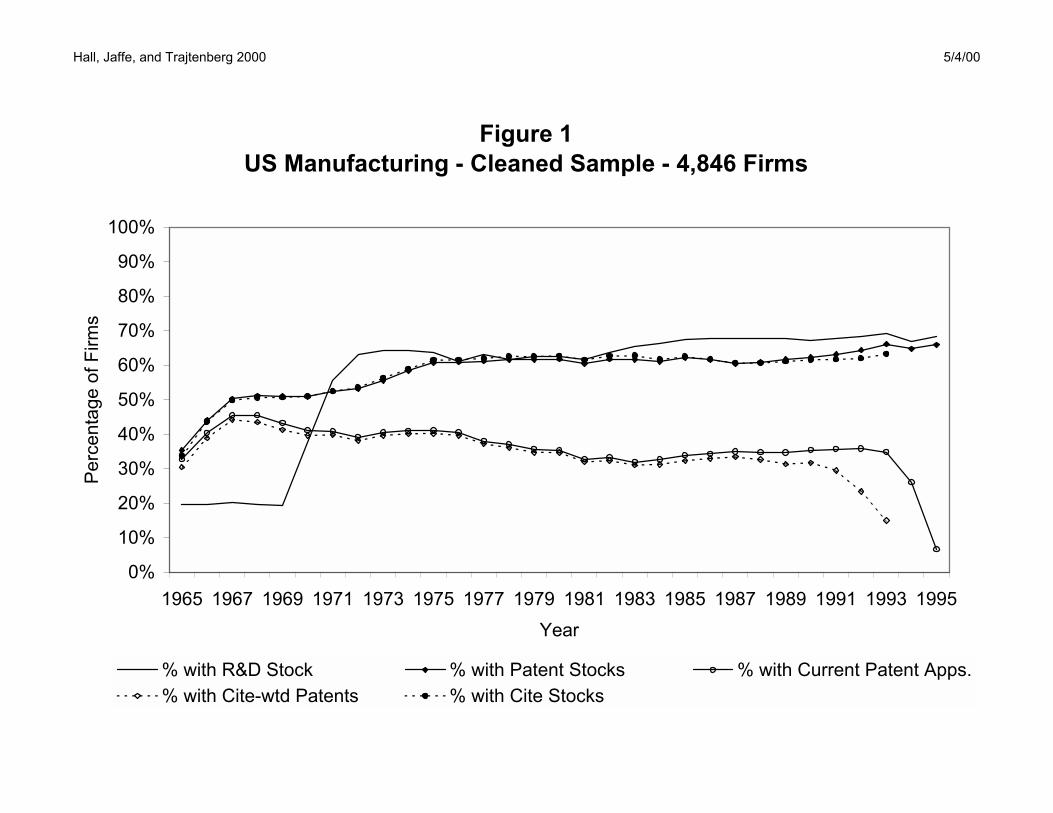
Hall, Jaffe, and Trajtenberg 2000 5/4/00
Figure 1US Manufacturing - Cleaned Sample - 4,846 Firms
0%
10%
20%
30%
40%
50%
60%
70%
80%
90%
100%
1965 1967 1969 1971 1973 1975 1977 1979 1981 1983 1985 1987 1989 1991 1993 1995Year
Perc
enta
ge o
f Firm
s
% with R&D Stock % with Patent Stocks % with Current Patent Apps.% with Cite-wtd Patents % with Cite Stocks
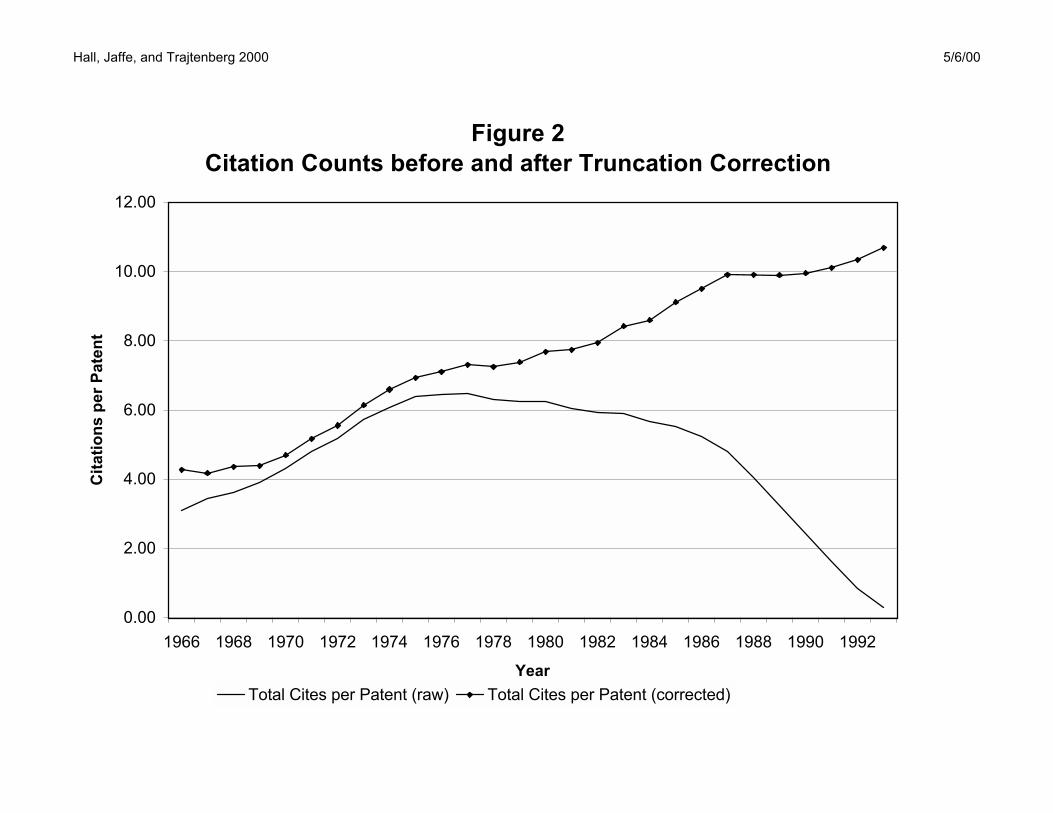
Hall, Jaffe, and Trajtenberg 2000 5/6/00
Figure 2Citation Counts before and after Truncation Correction
0.00
2.00
4.00
6.00
8.00
10.00
12.00
1966 1968 1970 1972 1974 1976 1978 1980 1982 1984 1986 1988 1990 1992
Year
Cita
tions
per
Pat
ent
Total Cites per Patent (raw) Total Cites per Patent (corrected)
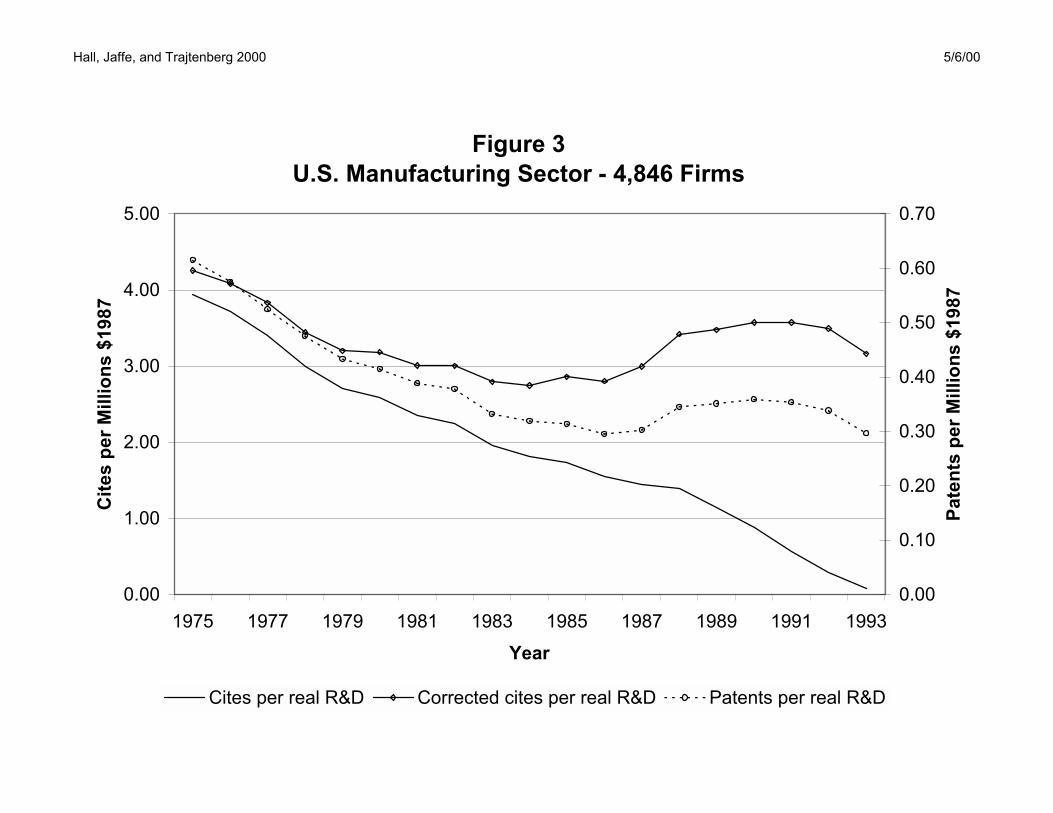
Hall, Jaffe, and Trajtenberg 2000 5/6/00
Figure 3U.S. Manufacturing Sector - 4,846 Firms
0.00
1.00
2.00
3.00
4.00
5.00
1975 1977 1979 1981 1983 1985 1987 1989 1991 1993Year
Cite
s pe
r Mill
ions
$19
87
0.00
0.10
0.20
0.30
0.40
0.50
0.60
0.70
Pate
nts
per M
illio
ns $
1987
Cites per real R&D Corrected cites per real R&D Patents per real R&D
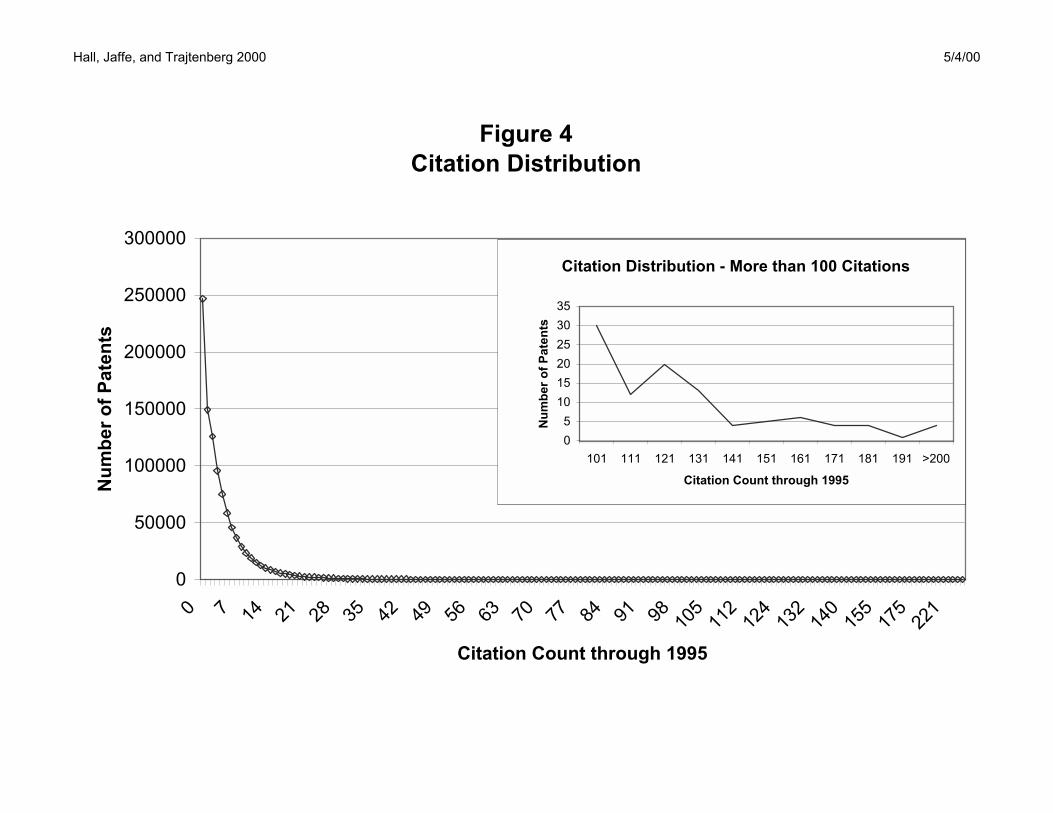
Hall, Jaffe, and Trajtenberg 2000 5/4/00
Figure 4Citation Distribution
0
50000
100000
150000
200000
250000
300000
0 7 14 21 28 35 42 49 56 63 70 77 84 91 98 105
112
124
132
140
155
175
221
Citation Count through 1995
Num
ber o
f Pat
ents
Citation Distribution - More than 100 Citations
05
101520253035
101 111 121 131 141 151 161 171 181 191 >200
Citation Count through 1995
Num
ber o
f Pat
ents
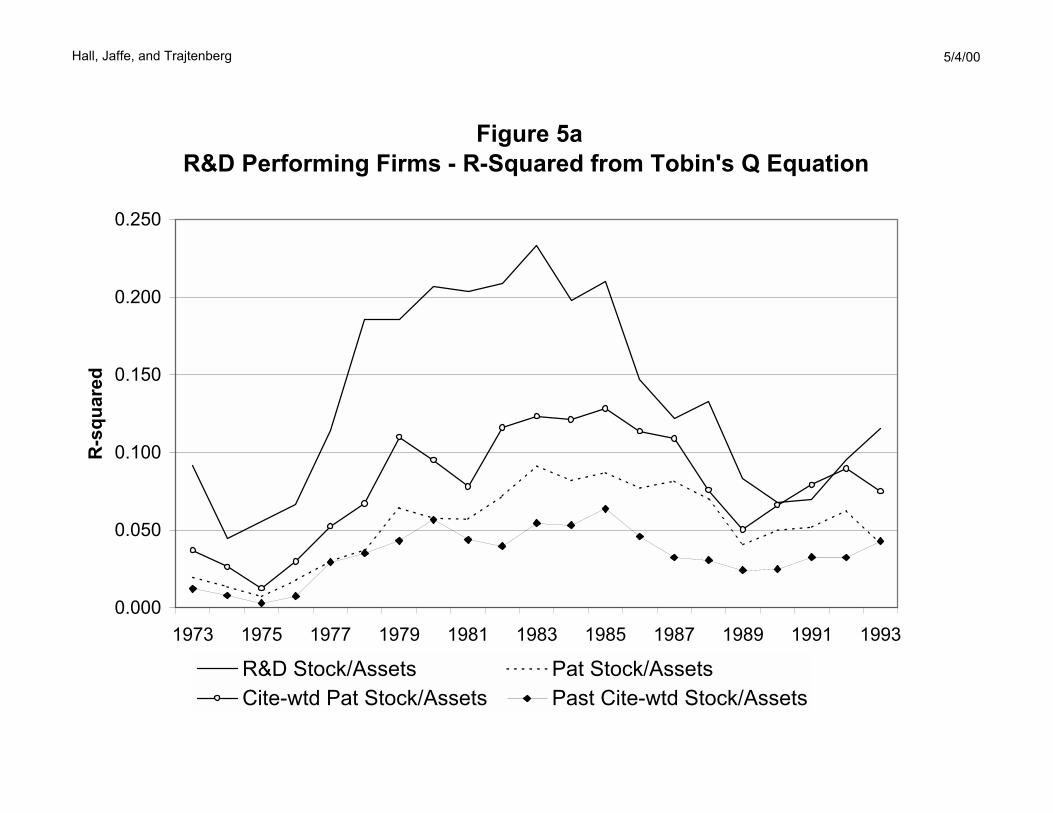
Hall, Jaffe, and Trajtenberg 5/4/00
Figure 5aR&D Performing Firms - R-Squared from Tobin's Q Equation
0.000
0.050
0.100
0.150
0.200
0.250
1973 1975 1977 1979 1981 1983 1985 1987 1989 1991 1993Year
R-s
quar
ed
R&D Stock/Assets Pat Stock/AssetsCite-wtd Pat Stock/Assets Past Cite-wtd Stock/Assets
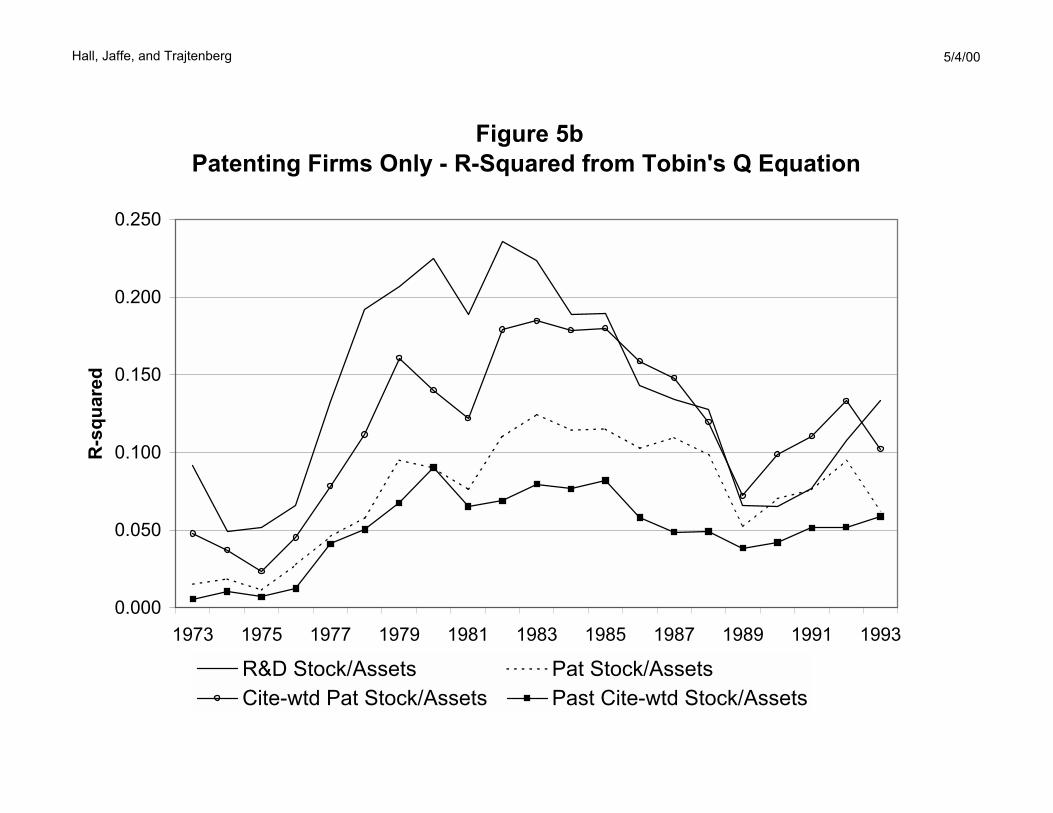
Hall, Jaffe, and Trajtenberg 5/4/00
Figure 5bPatenting Firms Only - R-Squared from Tobin's Q Equation
0.000
0.050
0.100
0.150
0.200
0.250
1973 1975 1977 1979 1981 1983 1985 1987 1989 1991 1993Year
R-s
quar
ed
R&D Stock/Assets Pat Stock/AssetsCite-wtd Pat Stock/Assets Past Cite-wtd Stock/Assets
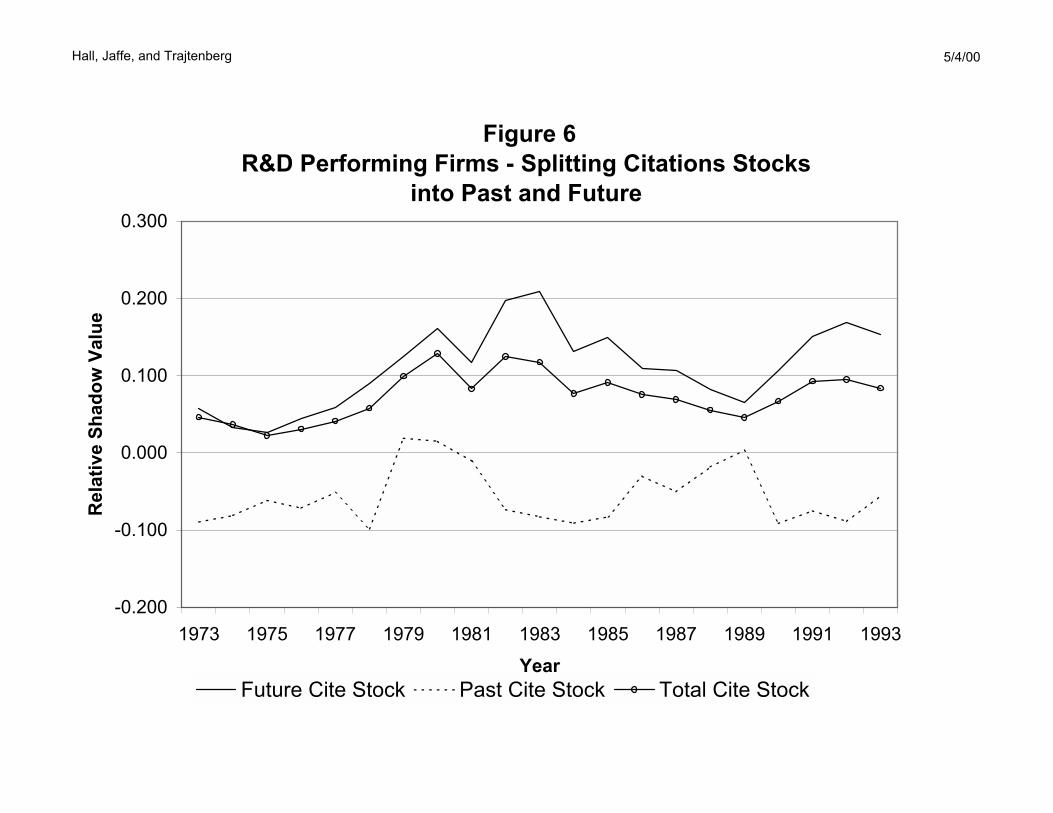
Hall, Jaffe, and Trajtenberg 5/4/00
Figure 6R&D Performing Firms - Splitting Citations Stocks
into Past and Future
-0.200
-0.100
0.000
0.100
0.200
0.300
1973 1975 1977 1979 1981 1983 1985 1987 1989 1991 1993Year
Rel
ativ
e Sh
adow
Val
ue
Future Cite Stock Past Cite Stock Total Cite Stock
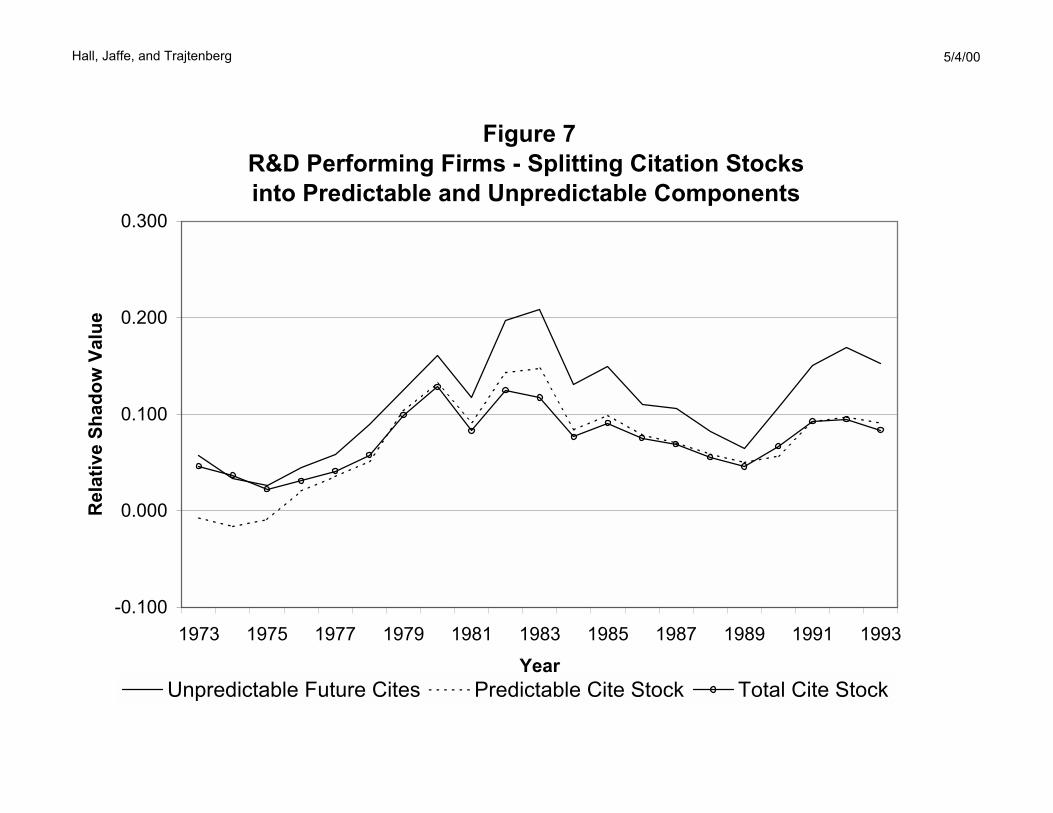
Hall, Jaffe, and Trajtenberg 5/4/00
Figure 7R&D Performing Firms - Splitting Citation Stocksinto Predictable and Unpredictable Components
-0.100
0.000
0.100
0.200
0.300
1973 1975 1977 1979 1981 1983 1985 1987 1989 1991 1993Year
Rel
ativ
e Sh
adow
Val
ue
Unpredictable Future Cites Predictable Cite Stock Total Cite Stock
7. Appendix A: Data Description
The data we use are drawn from the Compustat ¯les and from ¯les produced by the United States
Patent O±ce. We have included all the ¯rms in the manufacturing sector (SIC 2000-3999) between
1976 and 1995 in a large unbalanced panel (approximately 4800 ¯rms). The ¯rms are all publicly
traded on the New York, American, and regional stock exchanges, or traded Over-the-Counter on
NASDAQ. For details on data construction, see the documentation in Hall (1990), although we
have drawn a new sample from a larger dataset than the ¯le described in that document.
The main Compustat variables that we use are the market value of the ¯rm at the close of the
year, the book value of the physical assets, and the book value of the R&D investment. The market
value is de¯ned as the sum of the value of the common stock, the value of the preferred stock (the
preferred dividends capitalized at the preferred dividend rate for medium risk companies given by
Moody's), the value of the long-term debt adjusted for in°ation, and the value of short-term debt
net of assets. The book value is the sum of the net plant and equipment (adjusted for in°ation), the
inventory (adjusted for in°ation), and the investments in unconsolidated subsidiaries, intangibles,
and others (all adjusted for in°ation). Note that these intangibles are normally the good will and
excess of market over book from acquisitions, and do not include the R&D investment of the current
¯rm, although they may include some value for the results of R&D by ¯rms that have been acquired
by the current ¯rm. The R&D capital stock is constructed using a declining balance formula and
the past history of R&D spending with a 15 percent depreciation rate.
The patents data have been cleaned and aggregated to the patent assignee level at the Regional
Economics Institute, Case Western Reserve University. We have matched the patent assignee
names with the names of the Compustat ¯rms and the names of their subsidiaries in the Who
Owns Whom Directory of Corporate A±liations as of 1989 in order to assign patents to each ¯rm.
In order to ensure that we picked up all important subsidiaries, we also tried to positively identify
the unmatched patenting organizations that had more than 50 patents during the period to ensure
that we had not missed any subsidiaries. A spot check of ¯rms in the semiconductor industry, which
is an industry with lots of new entry during the period, suggests that our total patent numbers are
fairly accurate for the period 1975-1995, but that they are an undercount in the case of some ¯rms
28
(averaging about 5-15% under).18
18See Hall and Ham Ziedonis (1999).
29
8. Appendix B: Highly Cited Patents
30
Citations to Patent on Previous Page
31
9. Appendix C: Citation-weighted patent stocks
De¯ne
C(t; s) = number of cites received at time s to patents applied for at time t (9.1)
and
C(t) =TXs=t
C(t; s) = total number of cites to patents applied for at time t (9.2)
Note that in our case T = 1995, so the measure of the total number of cites is truncated for all
patents, and badly truncated for patents post 1985 or so.
Assume a single depreciation rate for the "private value" of a patent, ±: Then the simplest
citation-weighted patent stock treats each patent as if it is worth the number of citations it ever
receives and sums these citations over all the patents applied for in a given year to obtain a measure
for the increment to the stock of knowledge at time t equal to C(t): Using the standard declining
balance formula, the stock of knowledge itself is de¯ned by the following equation:
KC(t) = (1¡ ±)KC(t¡ 1) +C(t) (9.3)
= C(t; t) + (1¡ ±)C(t¡ 1; t¡ 1) + (1¡ ±)2C(t¡ 2; t¡ 2) + :::C(t; t+ 1) + (1¡ ±)C(t¡ 1; t) + (1¡ ±)2C(t¡ 2; t¡ 1) + :::::C(t; t+ 2) + (1¡ ±)C(t¡ 1; t+ 1) + (1¡ ±)2C(t¡ 2; t) + :::::+::::::
Note that in the above equation, the knowledge associated with a patent is assumed to be created
at the time the patent is applied for, and future citations are depreciated as though they occurred
at that time. Note also that when we put this stock into a valuation equation, we are implicitly
assuming that the market knows the "true" value of the innovation, which is only revealed later to
us via the citations.
An alternative possibility is to use citation weights that depend only on citations to the patents
that have already occurred, and to depreciate the citations as of the date when they occur, rather
than the date of the original patent application:
32
KPC(t) = (1¡ ±)KPC(t¡ 1) +C(t; t) + C(t¡ 1; t) + C(t¡ 2; t) + :::: (9.4)
= C(t; t) + (1¡ ±)C(t¡ 1; t¡ 1) + (1¡ ±)2C(t¡ 2; t¡ 2) + :::C(t¡ 1; t) + (1¡ ±)C(t¡ 2; t¡ 1) + (1¡ ±)2C(t¡ 3; t¡ 2) + :::::C(t¡ 2; t) + (1¡ ±)C(t¡ 3; t¡ 1) + (1¡ ±)2C(t¡ 4; t¡ 2) + :::::+::::::
Comparing equations (9.3) and (9.4) we can see that they di®er not only because one is forward-
looking (it counts citations at time t that will not be made until later than t), but also because the
pattern of depreciation is di®erent. This suggests an alternative to equation (9.4), shown below,
that uses only past citations, but depreciates them as of the patent date rather than at the citation
date:
KPPC(t) = (1¡ ±)KPPC(t) +t¡1Xs=0
(1¡ ±)sC(t¡ s; t) (9.5)
= C(t; t) + (1¡ ±)C(t¡ 1; t¡ 1) + (1¡ ±)2C(t¡ 2; t¡ 2) + :::+(1¡ ±)C(t¡ 1; t) + (1¡ ±)2C(t¡ 2; t¡ 1) + :::::+(1¡ ±)2C(t¡ 2; t) + :::::+::::::
That is, the innovation is assumed to be valuable when it is made, but we don't learn about it
until the citations happen. In the previous equation (9.4), the assumption is that the innovation
becomes more valuable each time a citation is made. The advantage of the formulation in (9.5) is
that it is nested within (9.3):
KC(t) = KPPC(t) +C(t; t+ 1) +C(t; t+ 2) + (1¡ ±)C(t¡ 1; t+ 1)+C(t; t+ 3) + (1¡ ±)C(t¡ 1; t+ 2) + (1¡ ±)2C(t¡ 2; t+ 1) + :::::
= KPPC(t) +TXs=1
s¡1Xj=0
(1¡ ±)jC(t¡ j; t+ s¡ j)
= KPPC(t) +KFPC(t) (9.6)
33
Thus this formulation will allow us to separate the total citation weighted stock of patents at time t
into two components, one that contains only citation information prior to t, and one which contains
only citation information at t+1 and later. However, it remains unclear whether we have chosen
an appropriate depreciation structure.
10. Appendix D: Truncation Bias
We face at least two types of truncation bias in our measures: bias in our patent measures due
to the fact that we have patent data only for granting years between 1967 and 1996 and bias in
our citation measures because there is a long citation lag and therefore we will not have observed
many citations for patents granted during the later part of our sample. The ¯rst bias is fairly
straightforward and easy to correct for because the application grant lag is fairly stable and has
a median of only about two years. The second is both more complex and of substantive interest,
since it is unclear whether our forecast of future citations should agree with that of the market.
Therefore we may wish to investigate the relationship between current citation stock and future
realized citations in somewhat more detail.
In this section of the paper we outline the steps we take to correct for the ¯rst type of bias (due
to the application-grant lag). Then we describe the measures of citation stocks that we construct
for use in our regressions.
10.1. Patent truncation
Figure D.1 shows the average distribution of the lag between application and grant for all U.S.
patents issued during the past four decades. The distributions are quite similar across decades,
although there does seem to be a net reduction in the lag between the 1960s and the later periods.19
Except for the 1960s, 95 percent of patent applications that are eventually granted will be granted
by year 3, and 99 percent by year 5. Our measure of patents in a year is the number applied for
that are ultimately granted, so our goal is to adjust the granted-application count at both ends of
our sample. The fact that the median lag is short means that in making our adjustment we cannot
go back before an application data of 1964 (because we only have grants made in 1967 and later)
19The data for the 1990s are based only on the ¯rst half of the period and therefore longer issue lags will betruncated, implying that the apparent shortening of the issue lag may be an artifact.
34
and that we will not be able to adjust the patent counts beyond 1993 (because we only see about
half the patents applied for in 1994 due to the grant lags). We describe these adjustments in more
detail below.
[Figure D.1 about here]
At the beginning of the sample (1967) we observe some of the patents applied for in 1964-1966,
but not the ones that were granted so quickly that their grant date is before 1967. This suggests
that we might be able to correct our application counts for 1964-1966 (that is, ¯ll in for lags 0 to
3) using weights drawn from the distribution for the 1960s. At the end of the sample, the opposite
happens: there are patents applied for between about 1991 and 1996 that are still pending; some
of them will be granted eventually, meaning that our counts of successful patent applications for
those years are too small. Again, we can scale up the numbers we do have using the grant-lag
distribution. Therefore we will compute the following two adjustments to our patent counts:
ePt =PtPM
s=67¡t ws64 < t < 67 (10.1)
ePt =PtP94¡ts=0 ws
91 < t < 94
where Pt is the number of patent applications at time t,M is the maximum issue lag (assumed to be
equal to about 10), and the weights ws are weights constructed from the average lag distributions
shown in Figure D.1. In Table D.1 we show the weighting factors we will use (the inverse of the
expressions in equations (10.1)). Note the edge e®ects, which imply that the 1996 data will not be
usable, and that the 1964 and 1995 data will have more variance due to estimation error.20
[Table D.1 about here]
20For this reason, we make no attempt to use data later than 1993 in the body of the paper (although we do usethat data to construct stocks of future citations). The 1964 data is used only to the extent that it enters into thestocks of patents and citations that we construct. The ¯rst stock in our regressions is dated around 1973, so themeasurement error e®ect should be quite small (recall that the counts are being depreciated by 15 percent per year).
35
10.2. Citation truncation
As discussed in the text, we seek citation-based measures of patent quality that are comparable
across patents. The number of citations that we observe for any given patent may depend on many
things. These include:
1. Technological ¯eld;
2. Grant date or "vintage" of the patent;
3. The total number of years for which we have data on the patent's citations.
The ¯rst two factors may well contain arti¯cial in°uences due to variations in patent and citation
practice across technologies and across time. For example, the number of citations made by each
patent rose over much of this period, possibly due to changes in the ease of identifying prior art
due to computer technology. Arguably, this "citation in°ation" means that a typical citation given
in the 1990s is less signi¯cant than the typical citation given in the 1970s. Similarly, there may be
variations in norms of citation behavior that make a typical citation in a particular technological
¯eld more or less signi¯cant than the average. In the absence, however, of some external information
about these artifactual variations, the only way one could deal with them would be to "take out"
time and technology e®ects, by subtracting from the observed citation counts mean ¯eld and time
e®ects. The problem with such an approach is that there is likely to be variation over time and
across ¯elds in the true importance of the typical patent. Taking out these e®ects would drastically
reduce the variance in the data, probably throwing out a good part of the baby with the bathwater.
Therefore in this paper we choose not to make any correction for technology ¯eld or secular citation
trends.2122
We do, however, adjust for truncation due to the number of years of citations we actually
observe, by ¯tting a model of the citation lag distribution introduced by Caballero and Ja®e (1993)
21One might believe that secular trends associated with the year of the citing patent are associated with changesin citation practice, and hence artifactual, while secular trends associated with the cited year represent movements inthe true average importance of new inventions. Separating the two, while simultaneously estimating the citation-lagdistribution, requires strong functional form assumptions. See Caballero and Ja®e, 1993.22To the extent that the variation across time and ¯elds is artifactual, it represents measurement error in the
citation variables that reduces their explanatory power and biases their coe±cients. One could construct the citationstocks with and without purging citations of ¯eld and time e®ects; comparing the results might yield some insight asto the fraction of ¯eld and time variance that is real and the fraction that is artifactual.
36
and developed by Ja®e and Trajtenberg (1996). This model allows the average level of citing activity
to vary across ¯elds and times (either because of real or artifactual forces), and thereby estimates
a citation lag distribution that is purged of these variations.23
A patent can be cited at any time after it is issued. Although the majority of citations happen
in the ¯rst 10 years of a patent's life, there is a long tail of citations that can occur into the in¯nite
future.24 Figure D.2 shows the number of citations received at each lag for patents in our sample
applied for at di®erent dates between 1965 and 1993. Because our citation data only go from 1976
until 1996, our citations are truncated at both ends: for patents applied for in 1965, we have only
the citations at lag 10 and later, whereas for patents issued in 1993, our citations are abruptly
truncated at lag 3. Thus we need to adjust for both these truncation biases.
[Figure D.2 about here]
In addition, as Ja®e, Trajtenberg, and Henderson (1993) have shown, citations vary considerably
by technological ¯elds. To adjust for this fact, we have grouped the 436 3-digit patent classes in
our data into 6 major technological ¯elds: drugs and medical, chemical exc. drugs, electrical and
electronics, computers and communication, mechanical, and all other.25 Our estimated citation
model will include these e®ects, in order to prevent our estimate of the citation-lag distribution
from being distorted by the combination of di®erences in citation practices across ¯elds and changes
in the ¯eld mix of patents over time.
We de¯ne our dependent variable to be the following:
Ct;j;s = Pr(cite at lag sjpatent applied for at t in ¯eld j) (10.2)
23The unbalanced nature of the patent data makes it important to control for ¯eld and time e®ects. For example,the only observations that we have on the longest lags are produced by citations made in years at the end of the dataperiod. If the citation-lag distribution were estimated without controling for the secular rise in citation rates, theestimated tail of the lag distribution would be too thick, because we only observe long lags from high-citation years.24Because we date patents by date of application, and grant lags are somewhat variable, we occasionally observe
citations with negative citation lags, i.e. the citing patent has an application date before the cited patent. Forexample, there is one patent in our dataset (#4,291,005, belonging to Calgon Corporation) that was issued in 1992,but had originally been applied for in 1921 and then continued. This patent cited another patent that had beenissued in 1979, 13 years before Calgon's patent actually issued, but 58 years after the citing patent (Calgon's) hadbeen applied for. Such anomalies are rare, and we have chosen to set the cite lag to zero in these cases.25This classi¯cation was performed by Gal Steinberg and Manuel Trajtenberg (Tel Aviv University) and is available
from the present authors on request.
37
=#cites at lag s to patents applied for at t in ¯eld j
#patents applied for at t in ¯eld j
where j is the one digit ¯eld of the patent, t is the year in which the patent was applied for, and
s is equal to t¶¡ t, where t¶is the application year of the citing patent. A problem one confronts
when trying to model the citation lag distribution is the fact that we cannot allow both the citing
and cited year e®ects to change freely over time, because some years (notably those post-1996) are
never observed, so their e®ects will not be identi¯ed. We use a slightly more °exible version of the
model of Ja®e and Trajtenberg (1996) to solve this problem. Our model of the citation probability
is then the following:
Ct;j;s = ¯0®¿ (t)°t+s¯j exp(¡¯1¯Sj s)(1¡ exp(¡¯2¯Dj s) (10.3)
where ¿(t) maps the years into ¯ve-year cohorts (see the table of results for details). As in Ja®e-
Trajtenberg, this model constrains the citation-lag distribution to have the same shape for patents
of any year, but allows the shape and level of the distribution to be di®erent for each ¯eld and it
allows the overall level to vary by 5-year patenting interval and by citation year. The only di®erence
from their model is that in our most general version we have allowed both the di®usion process
(the ¯2¯Dj term) and the obsolescence process (the ¯1¯
Sj term) to vary by technology ¯eld, whereas
they held the di®usion constant across ¯eld due to di±culties with identi¯cation.
Model (10.3) was ¯t to citation data aggregated by ¯eld (6 ¯elds), application year (1963-1993),
and citation year (1976-1994), yielding 2616 observations, each of which is the ratio of citations
made with lag s to patents in ¯eld j applied for in the application year t. The results are shown in
Table D.2. There are three sets of columns, the ¯rst for a model where di®usion and obsolescence
e®ects do not vary across ¯eld (¯Sj = 18j = 1; ::; 5 and ¯Dj = 18j = 1; ::; 5), the second for a modelwhere di®usion is the same for all technology ¯elds (¯Dj = 18j = 1; ::; 5), and the third for a modelwhere both di®usion and obsolescence are allowed to vary over technology ¯eld. Although allowing
di®usion to vary over technology ¯elds produces only a marginal improvement in the R-squared, it
is clear from the coe±cient estimates that there are substantial di®erences among ¯elds.
[Table D.2 about here]
38
The J-T model allows for both cited and citing year e®ects. Although the cited year e®ects do
not vary much over the sample, the citing year e®ects show a substantial growth rate, consistent
with the "citation in°ation" mentioned earlier, plus the increase in the rate of patenting, which
generates more citations made each year. Figure D.3 shows the estimated citation lag distribution
purged of the fact that the probability of citation is increasing over time for all patents, and that
patents in a given cohort may be cited more or less, based on the complete model in the last
column of Table D.2. The vertical axis is the relative citation probability; the area under each of
the curves is the estimated relative overall citation intensity for a given ¯eld; the left-right position
of the curve indicates the "speed" of citation in a given ¯eld. The most cited patents are those in
computers and communications, followed by drug and medical patents. The average citation lag is
notably longer for drugs and medical, and the di®usion rate substantially slower for patents in the
"other" category. The modal lag ranges from 2.6 years for mechanical to 5.3 years for other.
[Figure D.3 about here]
We will use the results for the ¯rst model (shown on Figure D.3 as column 1 estimates) to
estimate the unobserved citation probabilities, since we do not want to purge the data of ¯eld
e®ects. We are missing citations made before 1976 to patents issued between 1963 and 1975, and
citations made after 1996 for patents issued between 1963 and 1995 (that is, we are missing one
year (1996) for patents issued in 1965, two years (1996, 1997) for patents issued in 1966, and 30
years (1997-2026) for patents issued in 1996. Our model allows us to predict the number of these
missing citations. De¯ne the ¯tted lag distribution in the following way:
Ds = exp(¡¯1s)(1¡ exp(¡¯2s) s = 0; ::; 30
Then the predicted number of citations at lag s for a patent issued at time t, when we do not
observe citations beyond lag S=T-t is the following:
Ct;s = Ds
PSj=0 Ct;jPSj=0Dj
For example, the predicted number of citations in the year 2000 to a patent issued in 1993 is the
following (when we observe citations only through 1996):
39
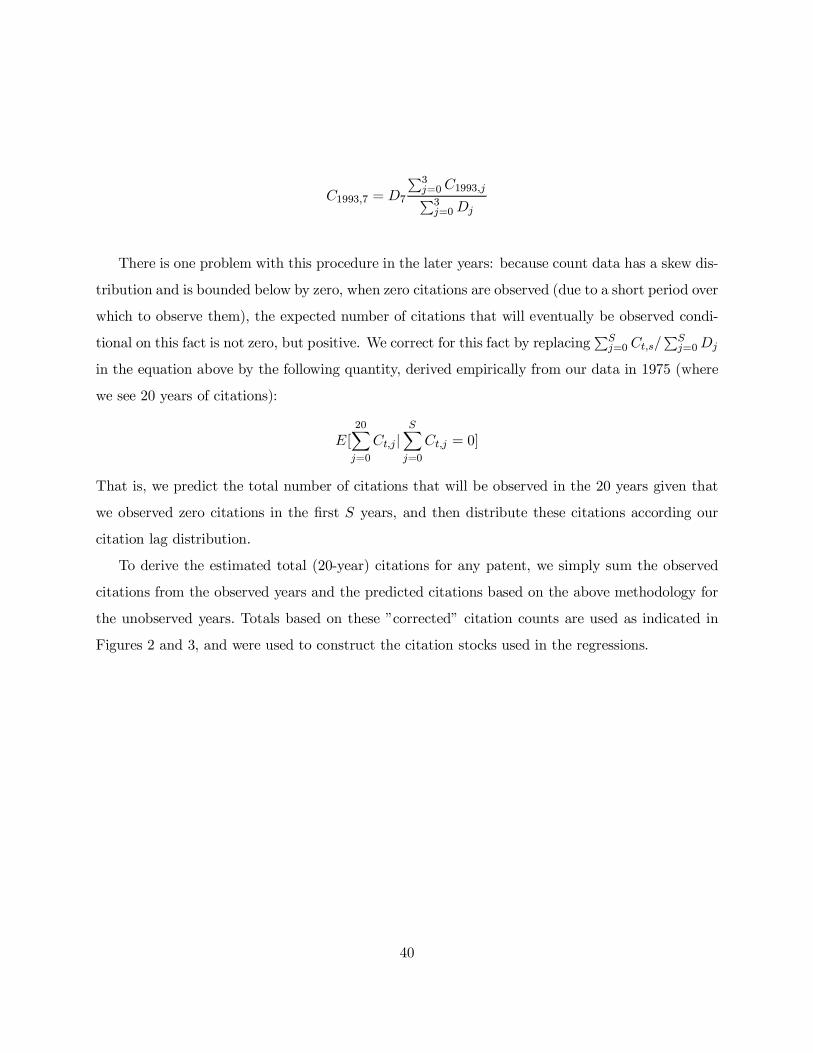
C1993;7 = D7
P3j=0C1993;jP3j=0Dj
There is one problem with this procedure in the later years: because count data has a skew dis-
tribution and is bounded below by zero, when zero citations are observed (due to a short period over
which to observe them), the expected number of citations that will eventually be observed condi-
tional on this fact is not zero, but positive. We correct for this fact by replacingPSj=0 Ct;s=
PSj=0Dj
in the equation above by the following quantity, derived empirically from our data in 1975 (where
we see 20 years of citations):
E[20Xj=0
Ct;jjSXj=0
Ct;j = 0]
That is, we predict the total number of citations that will be observed in the 20 years given that
we observed zero citations in the ¯rst S years, and then distribute these citations according our
citation lag distribution.
To derive the estimated total (20-year) citations for any patent, we simply sum the observed
citations from the observed years and the predicted citations based on the above methodology for
the unobserved years. Totals based on these "corrected" citation counts are used as indicated in
Figures 2 and 3, and were used to construct the citation stocks used in the regressions.
40
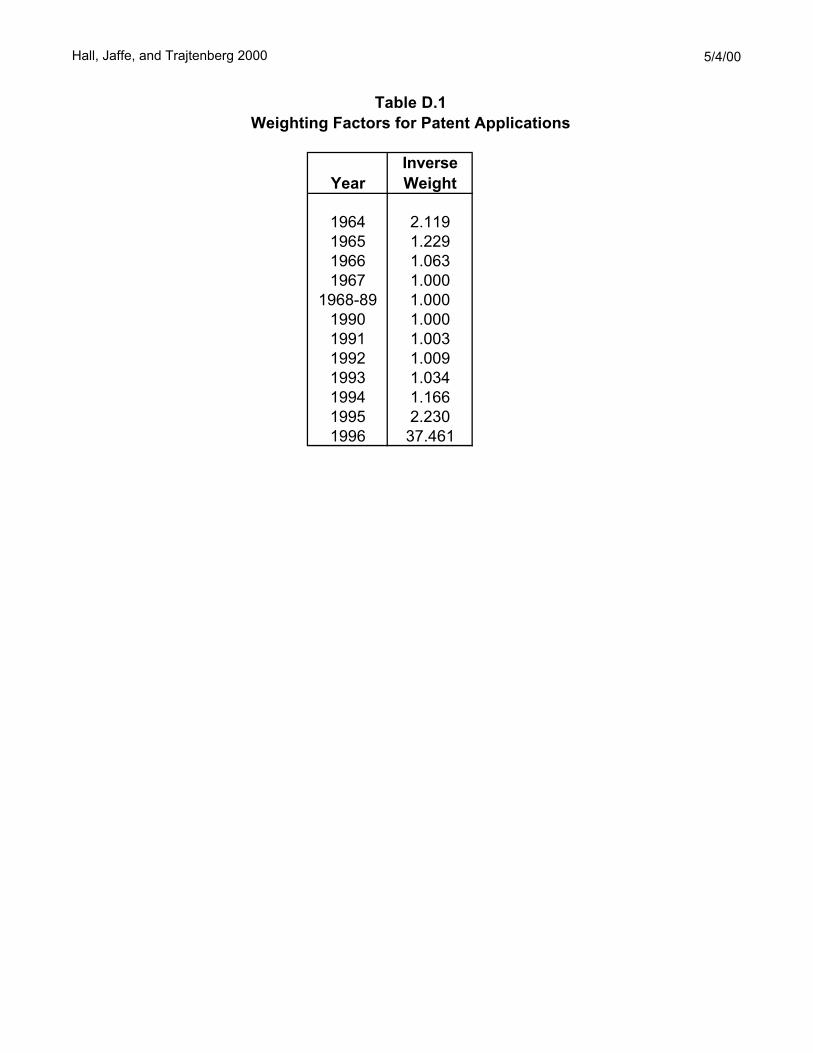
Hall, Jaffe, and Trajtenberg 2000 5/4/00
InverseYear Weight
1964 2.1191965 1.2291966 1.0631967 1.000
1968-89 1.0001990 1.0001991 1.0031992 1.0091993 1.0341994 1.1661995 2.2301996 37.461
Table D.1Weighting Factors for Patent Applications
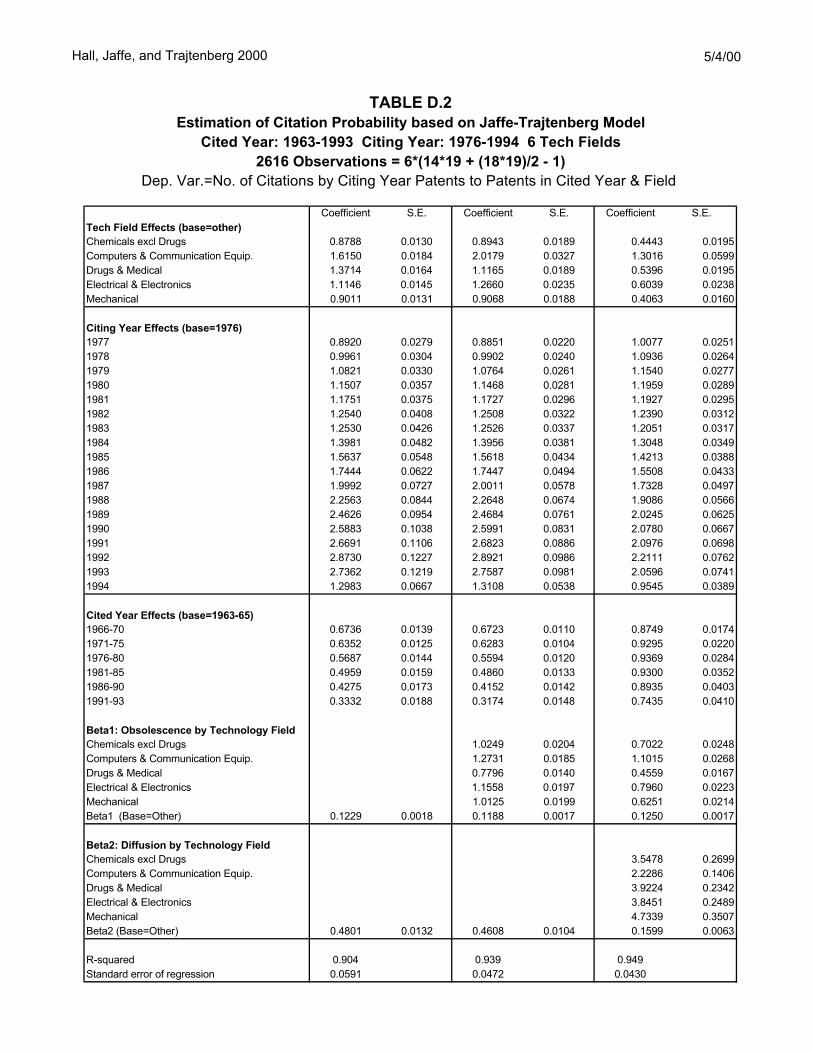
Hall, Jaffe, and Trajtenberg 2000 5/4/00
Coefficient S.E. Coefficient S.E. Coefficient S.E.Tech Field Effects (base=other)Chemicals excl Drugs 0.8788 0.0130 0.8943 0.0189 0.4443 0.0195Computers & Communication Equip. 1.6150 0.0184 2.0179 0.0327 1.3016 0.0599Drugs & Medical 1.3714 0.0164 1.1165 0.0189 0.5396 0.0195Electrical & Electronics 1.1146 0.0145 1.2660 0.0235 0.6039 0.0238Mechanical 0.9011 0.0131 0.9068 0.0188 0.4063 0.0160
Citing Year Effects (base=1976)1977 0.8920 0.0279 0.8851 0.0220 1.0077 0.02511978 0.9961 0.0304 0.9902 0.0240 1.0936 0.02641979 1.0821 0.0330 1.0764 0.0261 1.1540 0.02771980 1.1507 0.0357 1.1468 0.0281 1.1959 0.02891981 1.1751 0.0375 1.1727 0.0296 1.1927 0.02951982 1.2540 0.0408 1.2508 0.0322 1.2390 0.03121983 1.2530 0.0426 1.2526 0.0337 1.2051 0.03171984 1.3981 0.0482 1.3956 0.0381 1.3048 0.03491985 1.5637 0.0548 1.5618 0.0434 1.4213 0.03881986 1.7444 0.0622 1.7447 0.0494 1.5508 0.04331987 1.9992 0.0727 2.0011 0.0578 1.7328 0.04971988 2.2563 0.0844 2.2648 0.0674 1.9086 0.05661989 2.4626 0.0954 2.4684 0.0761 2.0245 0.06251990 2.5883 0.1038 2.5991 0.0831 2.0780 0.06671991 2.6691 0.1106 2.6823 0.0886 2.0976 0.06981992 2.8730 0.1227 2.8921 0.0986 2.2111 0.07621993 2.7362 0.1219 2.7587 0.0981 2.0596 0.07411994 1.2983 0.0667 1.3108 0.0538 0.9545 0.0389
Cited Year Effects (base=1963-65)1966-70 0.6736 0.0139 0.6723 0.0110 0.8749 0.01741971-75 0.6352 0.0125 0.6283 0.0104 0.9295 0.02201976-80 0.5687 0.0144 0.5594 0.0120 0.9369 0.02841981-85 0.4959 0.0159 0.4860 0.0133 0.9300 0.03521986-90 0.4275 0.0173 0.4152 0.0142 0.8935 0.04031991-93 0.3332 0.0188 0.3174 0.0148 0.7435 0.0410
Beta1: Obsolescence by Technology FieldChemicals excl Drugs 1.0249 0.0204 0.7022 0.0248Computers & Communication Equip. 1.2731 0.0185 1.1015 0.0268Drugs & Medical 0.7796 0.0140 0.4559 0.0167Electrical & Electronics 1.1558 0.0197 0.7960 0.0223Mechanical 1.0125 0.0199 0.6251 0.0214Beta1 (Base=Other) 0.1229 0.0018 0.1188 0.0017 0.1250 0.0017
Beta2: Diffusion by Technology Field Chemicals excl Drugs 3.5478 0.2699Computers & Communication Equip. 2.2286 0.1406Drugs & Medical 3.9224 0.2342Electrical & Electronics 3.8451 0.2489Mechanical 4.7339 0.3507Beta2 (Base=Other) 0.4801 0.0132 0.4608 0.0104 0.1599 0.0063
R-squared 0.904 0.939 0.949Standard error of regression 0.0591 0.0472 0.0430
Dep. Var.=No. of Citations by Citing Year Patents to Patents in Cited Year & Field
TABLE D.2Estimation of Citation Probability based on Jaffe-Trajtenberg Model
Cited Year: 1963-1993 Citing Year: 1976-1994 6 Tech Fields2616 Observations = 6*(14*19 + (18*19)/2 - 1)
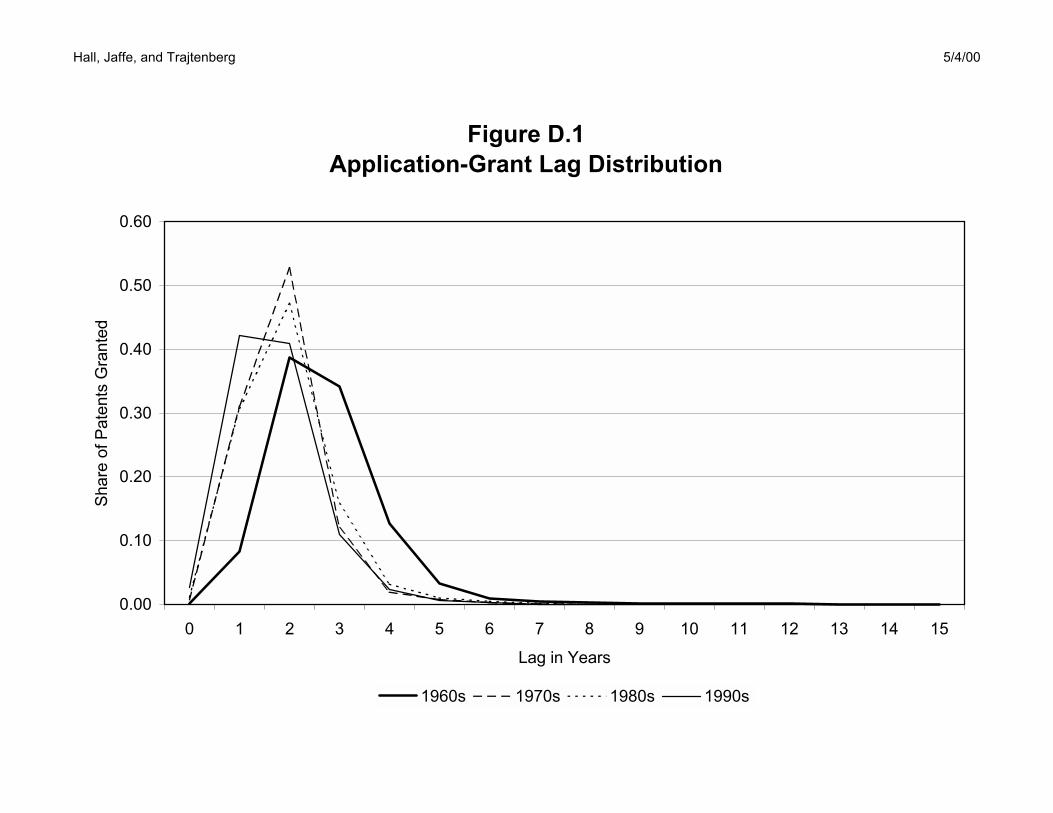
Hall, Jaffe, and Trajtenberg 5/4/00
Figure D.1Application-Grant Lag Distribution
0.00
0.10
0.20
0.30
0.40
0.50
0.60
0 1 2 3 4 5 6 7 8 9 10 11 12 13 14 15
Lag in Years
Shar
e of
Pat
ents
Gra
nted
1960s 1970s 1980s 1990s
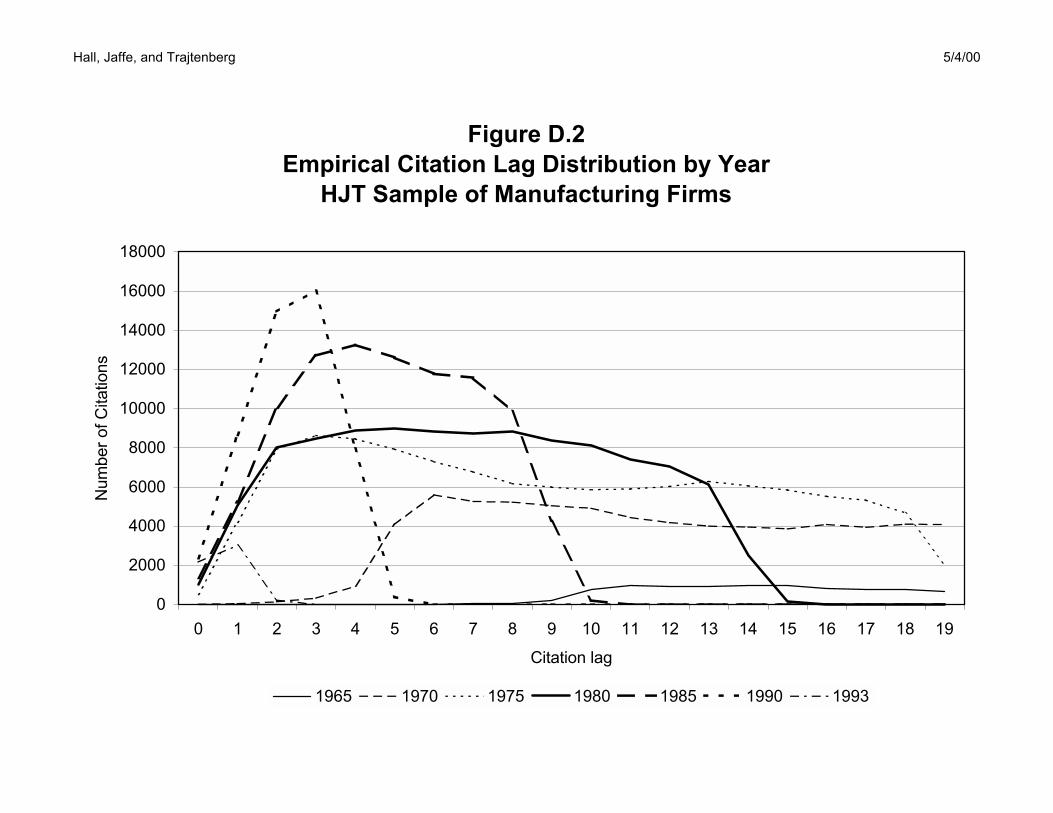
Hall, Jaffe, and Trajtenberg 5/4/00
Figure D.2Empirical Citation Lag Distribution by Year
HJT Sample of Manufacturing Firms
0
2000
4000
6000
8000
10000
12000
14000
16000
18000
0 1 2 3 4 5 6 7 8 9 10 11 12 13 14 15 16 17 18 19
Citation lag
Num
ber o
f Cita
tions
1965 1970 1975 1980 1985 1990 1993
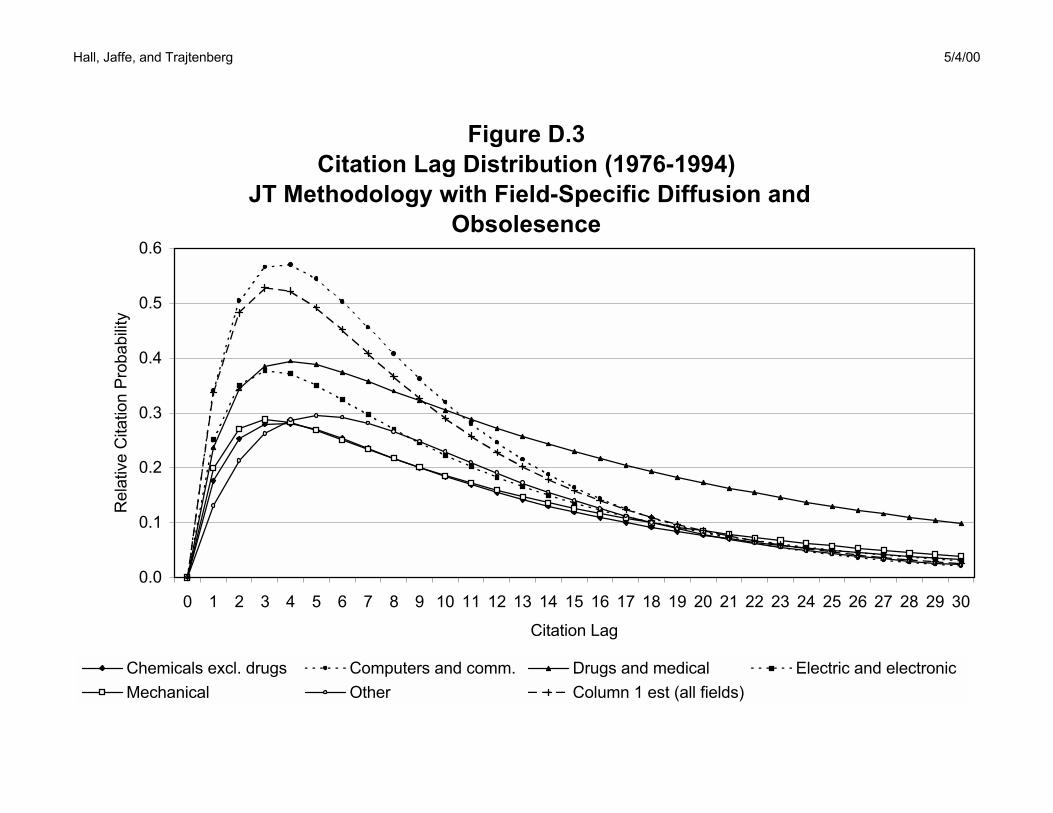
Hall, Jaffe, and Trajtenberg 5/4/00
Figure D.3Citation Lag Distribution (1976-1994)
JT Methodology with Field-Specific Diffusion and Obsolesence
0.0
0.1
0.2
0.3
0.4
0.5
0.6
0 1 2 3 4 5 6 7 8 9 10 11 12 13 14 15 16 17 18 19 20 21 22 23 24 25 26 27 28 29 30
Citation Lag
Rel
ativ
e C
itatio
n Pr
obab
ility
Chemicals excl. drugs Computers and comm. Drugs and medical Electric and electronicMechanical Other Column 1 est (all fields)
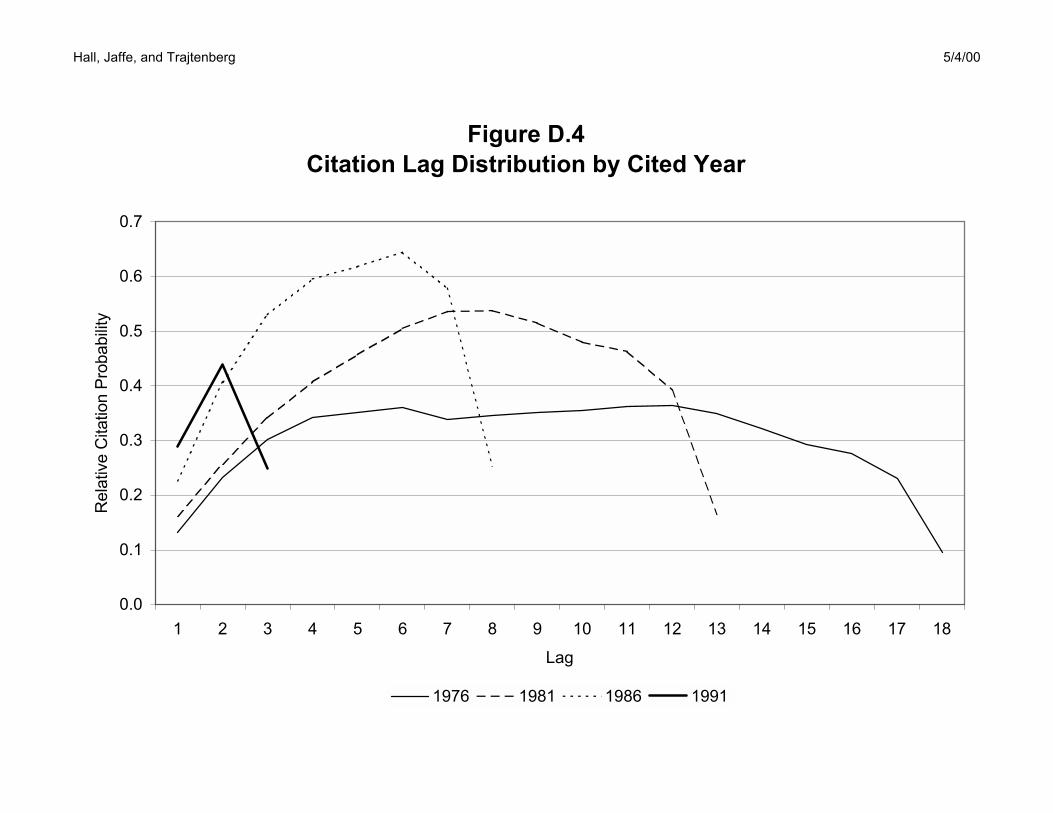
Hall, Jaffe, and Trajtenberg 5/4/00
Figure D.4Citation Lag Distribution by Cited Year
0.0
0.1
0.2
0.3
0.4
0.5
0.6
0.7
1 2 3 4 5 6 7 8 9 10 11 12 13 14 15 16 17 18
Lag
Rel
ativ
e C
itatio
n Pr
obab
ility
1976 1981 1986 1991