NBER WORKING PAPER SERIES PATENT CITATIONS AND INTERNATIONAL KNOWLEDGE FLOW… · ·...
40
NBER WORKING PAPER SERIES PATENT CITATIONS AND INTERNATIONAL KNOWLEDGE FLOW: THE CASES OF KOREA AND TAIWAN Albert G. Z. Hu Adam B. Jaffe Working Paper 8528 http://www.nber.org/papers/w8528 NATIONAL BUREAU OF ECONOMIC RESEARCH 1050 Massachusetts Avenue Cambridge, MA 02138 October 2001 The views expressed herein are those of the authors and not necessarily those of the National Bureau of Economic Research. © 2001 by Albert G.Z. Hu and Adam B. Jaffe. All rights reserved. Short sections of text, not to exceed two paragraphs, may be quoted without explicit permission provided that full credit, including © notice, is given to the source.
Transcript of NBER WORKING PAPER SERIES PATENT CITATIONS AND INTERNATIONAL KNOWLEDGE FLOW… · ·...
NBER WORKING PAPER SERIES
PATENT CITATIONS AND INTERNATIONAL KNOWLEDGE FLOW:THE CASES OF KOREA AND TAIWAN
Albert G. Z. HuAdam B. Jaffe
Working Paper 8528http://www.nber.org/papers/w8528
NATIONAL BUREAU OF ECONOMIC RESEARCH1050 Massachusetts Avenue
Cambridge, MA 02138October 2001
The views expressed herein are those of the authors and not necessarily those of the National Bureau ofEconomic Research.
© 2001 by Albert G.Z. Hu and Adam B. Jaffe. All rights reserved. Short sections of text, not to exceed twoparagraphs, may be quoted without explicit permission provided that full credit, including © notice, is givento the source.

Patent Citations and International Knowledge Flow:The Cases of Korea and TaiwanAlbert G.Z. Hu and Adam B. JaffeNBER Working Paper No. 8528October 2001JEL No. O3
ABSTRACT
This paper examines patterns of knowledge diffusion from US and Japan to Korea and Taiwan
using patent citations as an indicator of knowledge flow. We estimate a knowledge diffusion model using
a data set of all patents granted in the U.S. to inventors residing in these four countries. Explicitly
modeling the roles of technology proximity and knowledge decay and knowledge diffusion over time,
we have found that knowledge diffusion from US and Japan to Korea and Taiwan exhibits quite different
patterns. It is much more likely for Korean patents to cite Japanese patents than US patents, whereas
Taiwanese inventors tend to learn evenly from both US and Japanese inventors. The frequency of a
Korean patent citing a Japanese patent is almost twice that of the frequency of a Taiwanese patent citing
a Japanese patent. We also find that a patent is much more likely to cite a patent from its own
technological field than from another field.
Albert G.Z. Hu Adam B. JaffeDepartment of Economics Department of Economics, MS 021National University of Singapore Brandeis University10 Kent Ridge Crescent Waltham, MA 02554-9110Singapore 119260 and [email protected] [email protected]
I. Introduction Korea and Taiwan are two of the newly industrializing economies that have achieved
tremendous technological progress and economic growth. Both have graduated from
imitation to innovation within a single generation, by building their indigenous
technological capabilities and moving up the technology ladder. Technology diffusion
from U.S., Japan, and other OECD economies has played an important part in the two
economies’ transition from labor-intensive manufacturing to technology- and human-
capital-intensive manufacturing. The mechanisms of this diffusion process are not well
understood. Partly, it takes the form of technology transfer embodied in imported goods
or brought about through foreign direct investment by multinational firms. But
technology diffusion can also occur via "knowledge spillovers," whereby developing
world researchers and inventors benefit from their knowledge of research programs and
research outcomes in more advanced economies. In this paper, we investigate the pattern
of knowledge spillovers from U.S. and Japan to Korea and Taiwan, using patents citation
data as a proxy for knowledge flows.
There is a growing literature on international technology diffusion. Most of these
studies focus on technology diffusion embodied in traded goods. Coe and Helpman
(1995) examined R&D spillovers among OECD countries. They constructed a foreign
R&D stock using the import shares of a country’s trading partners and found a strong link
between domestic total factor productivity and foreign R&D stock, which they
interpreted as evidence of international R&D spillover. Wolfgang Keller (2001) explores
the extent to which R&D in one G-7 country spills over to productivity growth in other
G-7 countries. He finds that geographical proximity is important, and that much of the
variation in the magnitude of bilateral spillovers can be explained by patterns of trade,
investment and language. Coe, Helpman, and Haffmaister (1997) examined north-south
R&D spillover. They found that total factor productivity in developing countries is
significantly boosted by the R&D stock of industrial countries, which they computed as
the import-share-weighted sum of the R&D expenditures of a developing country’s
trading partners in the north. They interpreted this as evidence of north-south R&D
spillover.
2
Jaffe and Trajtenberg (1999) examined patterns of patent citation among the U.S.,
U.K., France, Germany and Japan, as an indicator of international flows of knowledge.
They found significant evidence of geographic localization that fades slowly as
knowledge diffuses over time. They also found interesting country differences, with
Japan being highly localized, but more focused on recent developments, and spillovers
from the U.S. to the U.K. being the most intense bilateral flow, suggesting a possible role
for language and/or cultural connections.
We use patent citations as an indicator of knowledge flow from technologically
advanced to developing economies. We extract from the NBER Patent Citations Data
File (Hall, Jaffe and Trajtenberg, 2001) all patents taken out in the U.S. by Korea,
Taiwan, Japan and the U.S. from 1963 to 19991. We explore first the simple statistics of
these data regarding the rate and technological composition of invention in Korea and
Taiwan over time. Both of these countries have seen a dramatic acceleration in their
patenting over time, with Taiwan in particular now among the lower end of “first world”
countries in terms of patents per capita.
We then present simple statistics regarding the frequency with which each of
these cite patents originating in the U.S. and in Japan. We use these data to try to answer
two questions. First, how does north-south knowledge diffusion differ among the country
pairs in our sample? Second, what underlying factors contribute to the patterns of
diffusion that we observe? We start with simple comparisons of overall citation rates,
and then proceed to examine these rates after controlling for a number of factors likely to
affect observed citation rates over time.
Given the non-rival and non-excludable nature of knowledge use, we assume that
there is an international stock of knowledge, upon which every economy can draw to
facilitate its own technological innovation. The OECD economies create most of this
stock, whereas the developing economies are able to tap into this stock constrained by the
availability of the channels of knowledge diffusion and their abilities to absorb and adapt
new knowledge. An implication of situating our study in this context is that we should
observe similar patterns of knowledge flow from the north to two similar economies in
3
the south. Any disparity in knowledge diffusion should be accounted for by economy
specific characteristics in the south.
The rest of the paper is organized as follows: Section 2 describes the data used in
this paper. We present some stylized patterns of knowledge diffusion using patent
citation as a proxy. Institutional background for technological change in Korea and
Taiwan is presented in Section 3. We discuss several stylized patterns of patent citation
between U.S., Japan, Korea, and Taiwan in Section 4. Section 5 describes the knowledge
diffusion model. We discuss how the empirical results from estimating the diffusion
model can account for the stylized patterns we observe in Section 6. Section 7 concludes.
II. The Data The data set used in this study consists of all utility patents granted by the U.S. Patent and
Trademark Office (U.S.PTO) to inventors residing in Korea, Japan, Taiwan, and the U.S.
from 1977 to 1999. The data are from the NBER Patent Citations Database (Hall, Jaffe
and Trajtenberg, 2001)2 The data elements that we utilize are:
• The country of residence of the primary inventor
• The dates of application and grant for the patent
• The U.S.PTO Patent Classification
• The identity of previous patents contained in the citations or “references made” in each patent.
When a patent is granted by the U.S.PTO, it is assigned to one of over 400 Patent Classes
according to its technological area. We use these “3-digit” patent classes for some of our
analyses. For other purposes, it is desirable to have a more aggregated technological
classification. The U.S.PTO classification system does not have a hierarchical structure,
so there is no way within the U.S.PTO system to aggregate patent classes. Adam Jaffe
and Manuel Trajtenberg have grouped the patent classes into six major technological
categories: Chemical; Computers and Communications; Drugs and Medical; Electrical
and Electronic; Mechanical; and All Other.
1 In utilizing patents taken out in the U.S., we focus on inventions for products intended (at least in part) for world trade, and for process inventions whose outputs are exported (at least in part). For the remainder of the paper, we use the shorthand “patents” to refer to “patents granted in the U.S.” 2 The patent database begins in 1963, but the citations information does not begin until 1975, and the number of patents from inventors in Korea and Taiwan are very small before the mid-1970s. For these reasons, our analysis focuses on 1977-1999.
4
Patent citations serve an important legal function, since they delimit the scope of
the property rights awarded by the patent. Thus, if patent B cites patent A, it implies that
patent A represents a piece of previously existing knowledge upon which patent B builds,
and over which B cannot have a claim. The applicant has a legal duty to disclose any
knowledge of the “prior art,” but the decision regarding which patents to cite ultimately
rests with the patent examiner, who is supposed to be an expert in the area and hence to
be able to identify relevant prior art that the applicant misses or conceals. We assume
that the frequency with which a given country’s inventors cite the patents of another
country is a proxy for the intensity of knowledge flow from the cited country to the citing
country. For further discussion of the limitations of using citations data for this purpose,
see Jaffe and Trajtenberg (1999) and Hall, Jaffe and Trajtenberg (2001). Jaffe,
Trajtenberg and Fogarty (2000) present survey evidence regarding the extent to which
citations reflect actual knowledge flows between inventors. They find that citations are a
noisy indicator of knowledge flow, in the sense that knowledge flow is much more likely
to have occurred where a citation is made, but many citations also occur in the absence of
any knowledge flow.
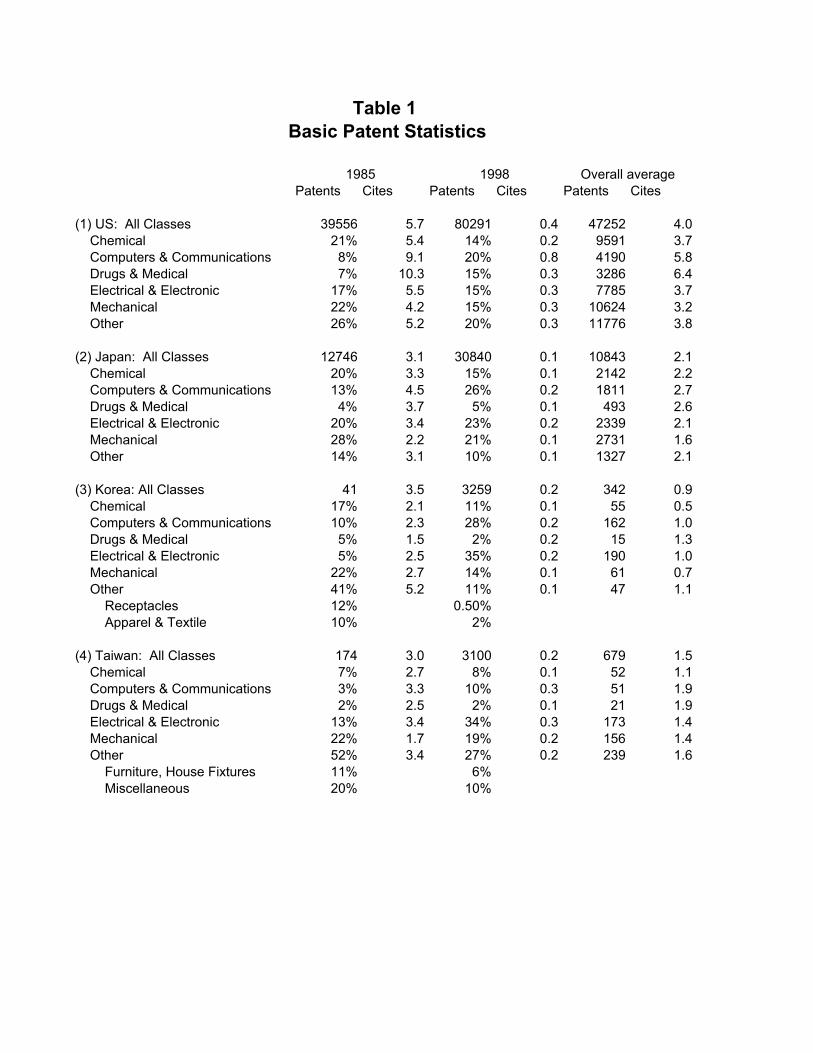
[Insert Table 1 here]
Table 1 presents statistics of patent counts and citation counts of U.S., Japan,
Korea, and Taiwan. Table 1 shows the aggregate number of patents, the distribution of
patents over these six categories, and the average number of citations each received for
the 6 technological categories in each of the 4 countries. In columns (1) to (4), we report
these statistics for 1985 and 1998. The sample averages of the statistics are reported in
the last two columns. The year 1985 was chosen because this was the year when Korea
and Taiwan began to have a balanced portfolio of patents.
The first thing to note about Table 1 is that although the absolute numbers of
patents are still only fractions of those of the U.S. and Japan, Korea and Taiwan are
catching up very rapidly. In 1985, for example, Taiwan was granted 174 patents, or 0.4
percent of the U.S. total and 1.4 percent of the Japanese total. Thirteen years later,
Taiwanese inventors claimed 3100 patents, a seventeen-fold increase and equivalent to 4
percent and 10 percent of the U.S. and Japanese totals respectively. During the same

5
period, Korea managed to increase its patent count from 41 to 3259, an almost eighty fold
increase.
Secondly, Table 1 suggests that even with the much larger number of patents they
are now receiving, the patent portfolios of Taiwan and Korea are specialized in terms of
technological field. The U.S. and Japan innovate in many technological areas, due to their
size and comprehensive technological capabilities. On the other hand, the distributions of
Korean and Taiwanese patents are more concentrated in certain areas and have changed
considerably over the years. In 1998, 35 percent of Korean patents and 34 percent of
Taiwanese patents belong to the electrical and electronic category. The same fraction is
15 percent and 21 percent for the U.S. and Japan respectively. Indeed the two categories
of electrical and electronic and computers and communications together account for 63
percent of all Korean patents granted in the U.S. in 19983
As a more systematic measure of the concentration of patenting in these countries
across technological fields, we calculate the Herfindahl index of patent concentration
across the approximately 400 three-digit patent classes, for each of the four economies.
As shown by Hall, Jaffe and Trajtenberg (2001), the HHI measure is biased upward when
the number of patents on which it is based is small. Essentially, if there is a modest
“true” probability of a random patent being in one of many classes, the true concentration
may be low; if very few patents are actually observed they can only be in a few classes
and the measured concentration will be high. Assuming the unobserved distribution
across classes is multinomial, and the observed draws from that distribution are
independent, Hall, Jaffe and Trajtenberg show that an unbiased measure of the true
concentration is given by:
1ˆ1
N HHIHN
⋅ −=−
where H is the bias-adjusted Herfindahl measure, N is the number of patents, and HHI is
the traditional Herfindahl, calculated as the sum of squared shares across patent classes.
3 For Korea and especially Taiwan, unlike the U.S. and Japan, the “other” category captures an extremely large fraction of patents. In Table 1, we report the two largest sectors within the other category. For Korea these are receptacles and apparel and textile. In the Taiwanese case, the “miscellaneous” group accounts for
6
As N grows large, H converges to the traditional measure, but for small N the adjustment
can be quite large. For example, if there are 8 patents spread evenly across 4 classes, the
HHI is .25, but H is about .14. If there were only 4 patents spread across 4 classes, the
HHI would still be .25, but H is actually zero.
Figure 1 presents the bias-adjusted Herfindahl across patent classes over time for
each country.4 It shows the technological concentration of Taiwan as similar to that of
Japan up until the mid-1990s, after which there is evidence of a significant upward trend.
This is at least partly associated with the increasing focus on electronics patents that is
visible in Table 1. The technological concentration of Korea varies much more from year
to year, but appears to be rising over time. In the 1980s, it was comparable to that of
Japan, but by the mid-1990s was about twice as high. As discussed below in connection
with Figure 3, rising technological concentration in the 1990s in Korea was accompanied
by a similar rise in concentration across patent assignees. Large Chaebols associated
with Samsung, Hyundai and Goldstar made major investments in penetrating specific
high-tech industries, and this seems to be reflected in the concentration of patenting in
these entities and the sectors they targeted.
[Insert Figure 1 here]
The trends in overall technological concentration for Korea and Taiwan mask to
some extent significant shifts that have occurred with respect to which areas are most
important. The share of electrical and electronic patents in total Korean patents increased
from 5 percent in 1985 to 35 percent in 1998, whereas the share of All Other patents
declined from 41 percent to 11 percent during the same period. The fraction of electrical
and electronic patents increased from 13 percent to 34 percent for Taiwan, with the
decline again occurring in the All Other category. Besides the size difference between the
northern and the southern economies, and the fact that Korea and Taiwan have been fast
developing, we suspect the uneven patent portfolios of Korea and Taiwan may also have
to do with the industry policy of the two economies, which is characterized by targeting,
as much as 20% of the patents Taiwan received in 1985 and 10% in 1998. The second largest group in the other category for Taiwan is furniture and house fixtures. 4 The unadjusted HHI is much higher for Korea, and to a lesser extent Japan, in the early years when their patent totals were relatively low.
7
or preferential policies to promote certain industries (Amsden, 1989; Dollar and Sokoloff,
1994).
Lastly, we compare the technological significance of the four economies’ patents
using the average number of citations a patent receives as an indicator of the patent’s
quality. Given the strong evidence of the geographical localization of patent citation
(Jaffe, Trajtenberg, and Henderson, 1993), the average cites we report in Table 1 are
based on citations made by U.S. patents only. In looking at citations from the U.S. to
patents of Japan, Korea and Taiwan, the phenomenon of geographical localization is held
constant, permitting comparisons of citation rates for these 3 recipient countries. The
overall average cites suggest that Japanese patents are technologically more significant
than Korean and Taiwanese patents. However, this overall average comparison may
conceal the probable increasing significance of the latter. Although the average of 3.54
cites a 1985 Korean patent receives is largely driven by patents in the other categories,
Korean and Taiwanese patents receive at least as many citations as Japanese patents in
mechanical and electrical and electronic categories respectively in 1985. At the end of the
data period, no patents have received very many citations because very little time has
passed in which to observe them, but limited information suggests rough parity between
Korea and Japan, and Taiwanese patents are actually more highly cited in all categories
than those of Japan.
III. Korea and Taiwan: from imitators to innovators We will not elaborate on the economic success that Korea and Taiwan have achieved in
the second half of the twentieth century. It has been documented and debated extensively
elsewhere (World Bank, 1993; Krugman, 1994). Our focus is the role of knowledge
diffusion from the U.S. and Japan in the technological progress that Korea and Taiwan
have obtained. With a successful export-oriented development strategy and an
interventionist government, both Korea and Taiwan have worked hard to move up the
international technology ladder. In this process many Korean and Taiwanese companies
have graduated from imitators of western technology to genuine innovators (Kim, 1997).
The electronic industry, where for example, Korea’s Samsung and Taiwan’s Acer are
already world players, is often cited to attest to the success story.
[Insert Figure 2 here]
8
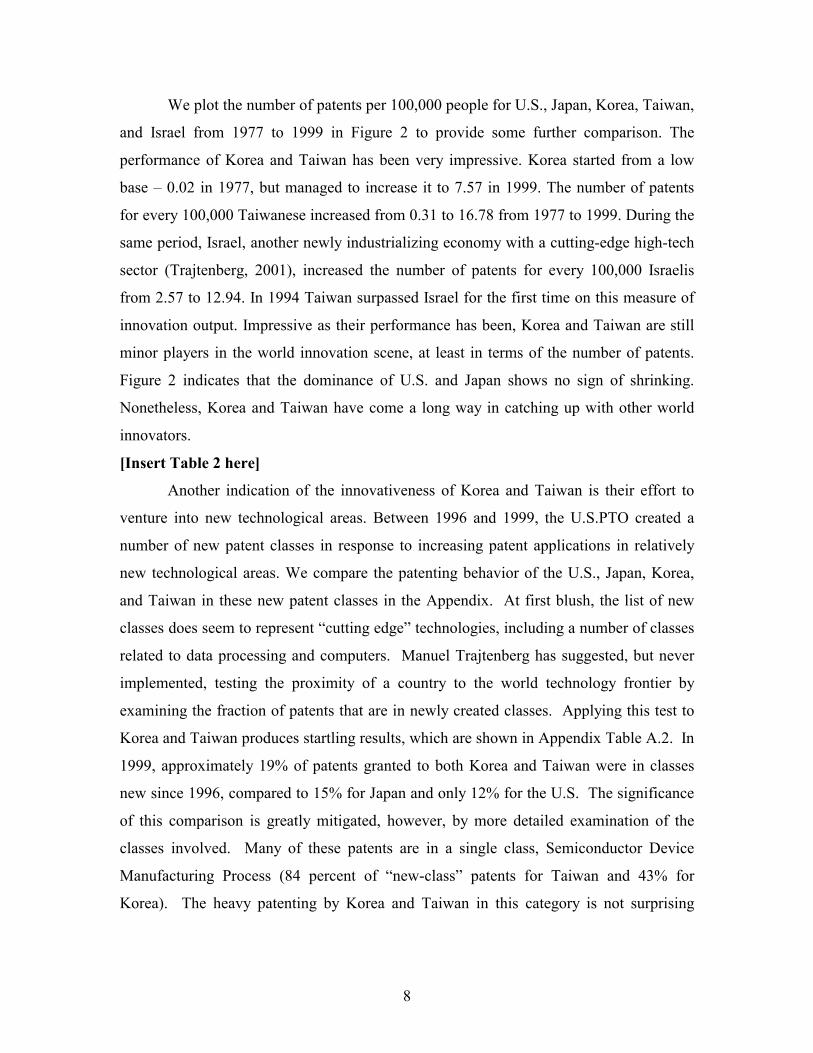
We plot the number of patents per 100,000 people for U.S., Japan, Korea, Taiwan,
and Israel from 1977 to 1999 in Figure 2 to provide some further comparison. The
performance of Korea and Taiwan has been very impressive. Korea started from a low
base – 0.02 in 1977, but managed to increase it to 7.57 in 1999. The number of patents
for every 100,000 Taiwanese increased from 0.31 to 16.78 from 1977 to 1999. During the
same period, Israel, another newly industrializing economy with a cutting-edge high-tech
sector (Trajtenberg, 2001), increased the number of patents for every 100,000 Israelis
from 2.57 to 12.94. In 1994 Taiwan surpassed Israel for the first time on this measure of
innovation output. Impressive as their performance has been, Korea and Taiwan are still
minor players in the world innovation scene, at least in terms of the number of patents.
Figure 2 indicates that the dominance of U.S. and Japan shows no sign of shrinking.
Nonetheless, Korea and Taiwan have come a long way in catching up with other world
innovators.
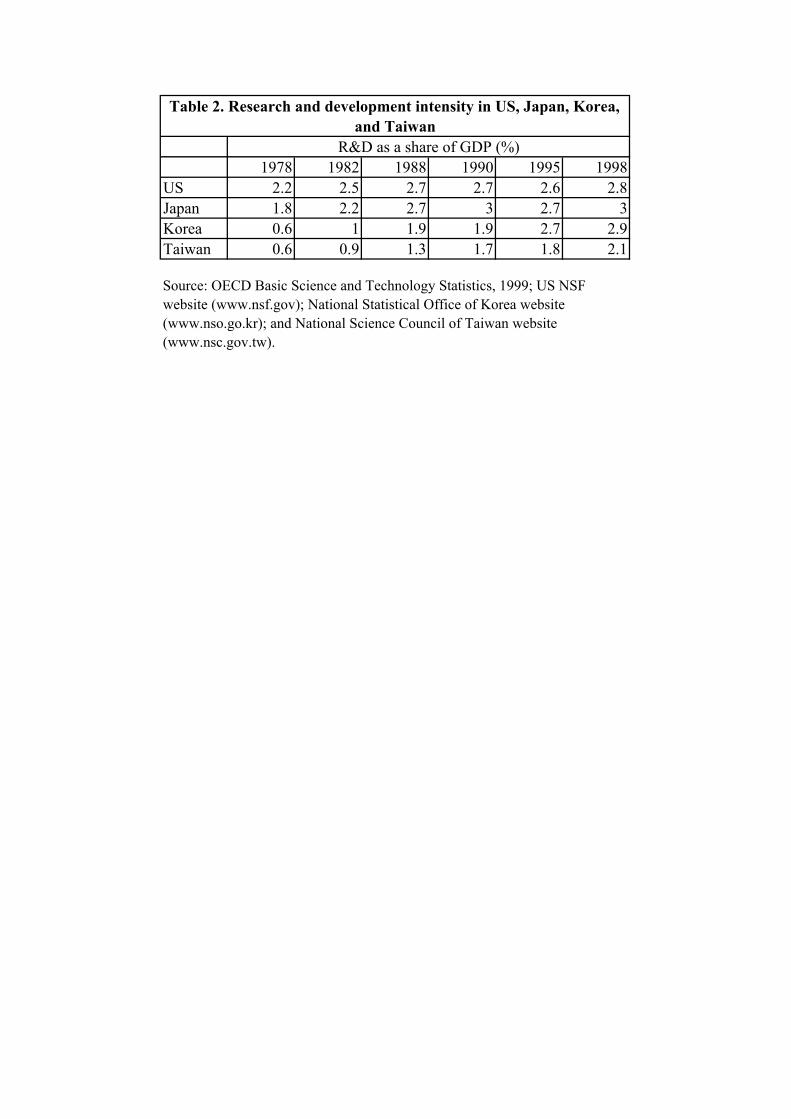
[Insert Table 2 here]
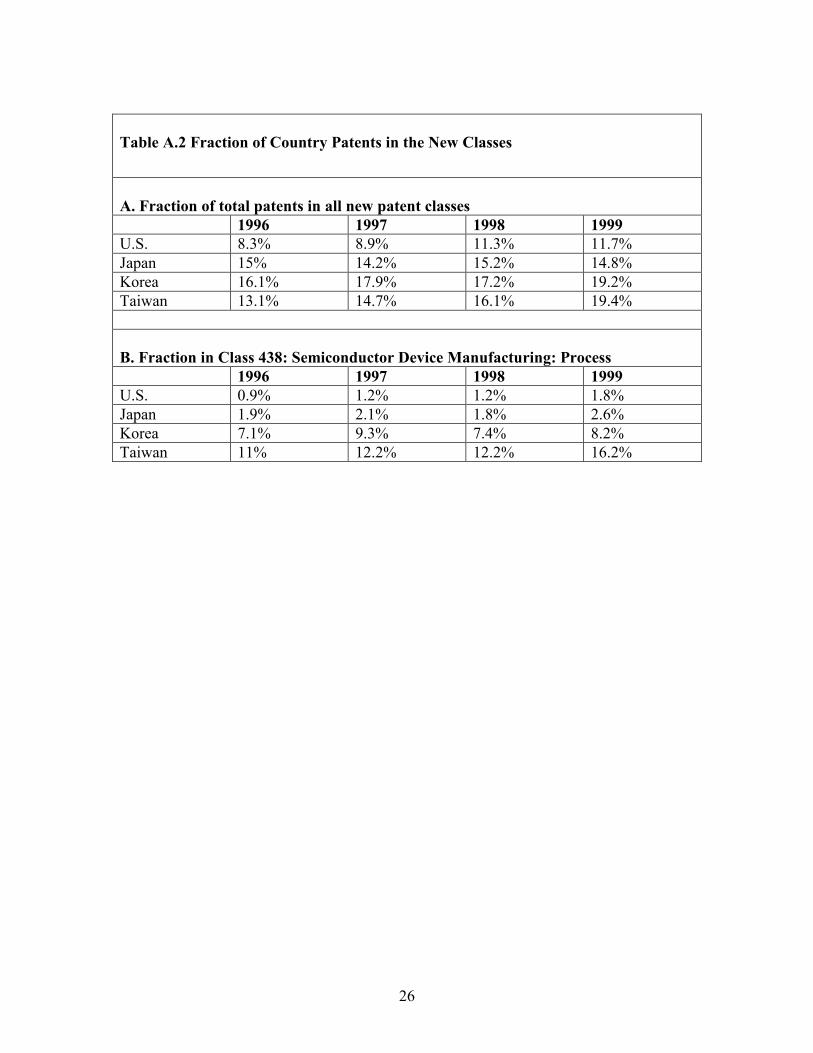
Another indication of the innovativeness of Korea and Taiwan is their effort to
venture into new technological areas. Between 1996 and 1999, the U.S.PTO created a
number of new patent classes in response to increasing patent applications in relatively
new technological areas. We compare the patenting behavior of the U.S., Japan, Korea,
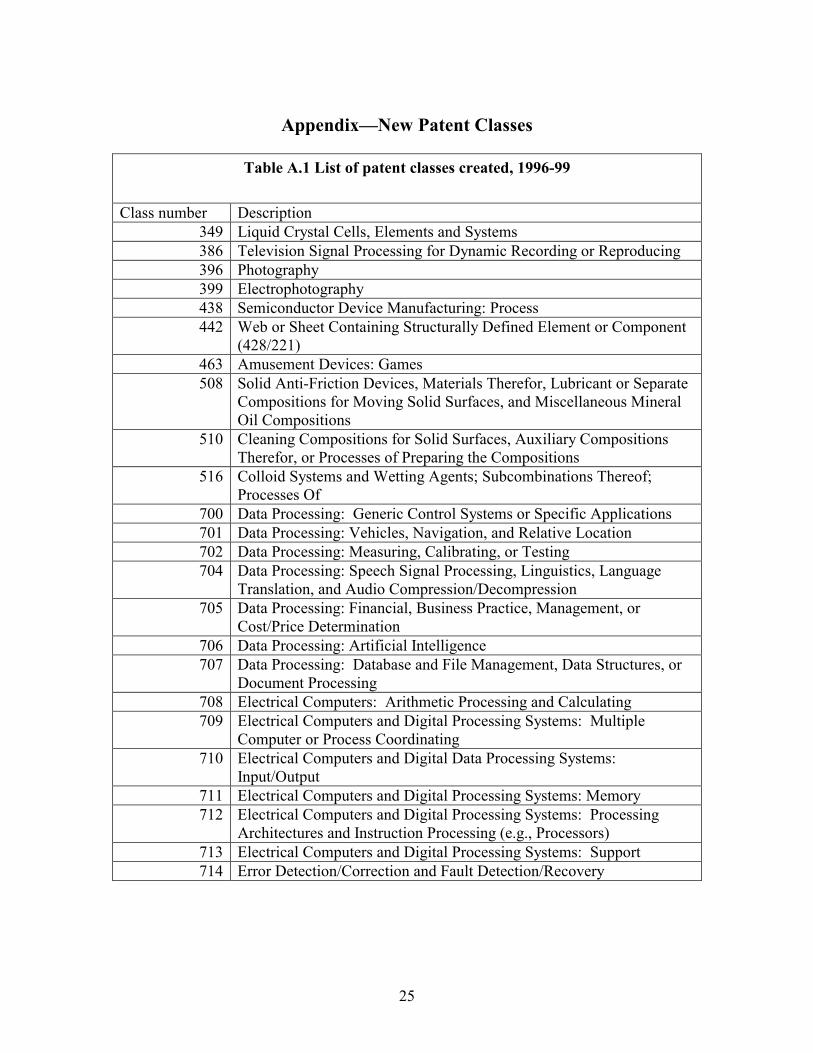
and Taiwan in these new patent classes in the Appendix. At first blush, the list of new
classes does seem to represent “cutting edge” technologies, including a number of classes
related to data processing and computers. Manuel Trajtenberg has suggested, but never
implemented, testing the proximity of a country to the world technology frontier by
examining the fraction of patents that are in newly created classes. Applying this test to
Korea and Taiwan produces startling results, which are shown in Appendix Table A.2. In
1999, approximately 19% of patents granted to both Korea and Taiwan were in classes
new since 1996, compared to 15% for Japan and only 12% for the U.S. The significance
of this comparison is greatly mitigated, however, by more detailed examination of the
classes involved. Many of these patents are in a single class, Semiconductor Device
Manufacturing Process (84 percent of “new-class” patents for Taiwan and 43% for
Korea). The heavy patenting by Korea and Taiwan in this category is not surprising
9
given the success of their semiconductor industry. While this is an important “high-tech”
industry, it is not clear that it is particularly indicative of truly cutting-edge technology.
Korea and Taiwan’s success is due to both their expanding indigenous
technological capability and their relentless effort to acquire technology from the west.
The two are complementary to each other and reinforce each other, as an economy’s
ability to absorb new technology or knowledge depends on its indigenous R&D
capability (Cohen and Levinthal, 1989). New knowledge absorbed in turn broadens and
deepens an economy’s technological base, leading to opportunities of further indigenous
innovation. Table 2 compares R&D intensity as measured by the ratio of R&D
expenditure to GDP for U.S., Japan, Korea, and Taiwan. In about two decades, R&D
expenditure increased from 0.6 percent of GDP to 2.9 percent and 2.1 percent in Korea
and Taiwan respectively. In fact the 1998 R&D-GDP ratio of Korea exceeded those of
Germany (2.3%), France (2.2%), and Great Britain (1.83%), and was similar to those of
the U.S. and Japan.
Technology diffusion and knowledge spillover from developed economies,
particularly Japan and the U.S., has played an important role in the success of Korea and
Taiwan. Hobday (1995) identified several mechanisms through which Korea and Taiwan
have acquired foreign technology. These include foreign direct investment (FDI), joint
ventures, licensing, original equipment manufacture (OEM), and capital goods import.
Korea and Taiwan have much in common in their relationship with Japan and the U.S..
Both were colonized in the first half of the twentieth century by Japan. Both received
substantial aid from the U.S. after the Second World War. Both have made U.S. their
major export market. However, there are major differences between these economies as
well.
[Insert Figure 3 here]
In venturing to new industries and technologies, Korea has relied on big business
groups, or the Chaebols, which bear much resemblance to their Japanese antecedent, the
Zaibastu. Taiwan has seen a large number of small and medium enterprises playing an
active role. In Figure 3 we plot the Herfindahl index of patent concentration across patent
10
assignees for the four economies.5 Korea’s high concentration of patent assignees
certainly reflects the role of big business groups in the country’s economic life. In fact the
degree of concentration increased steadily from the late 1980s to early 1990s and has
been rising again since 1997. The degree of concentration of inventors in Taiwan is lower
than that in Korea, but it has also been rising and is still much higher than the
concentration in the U.S. and Japan. The U.S., having the most liberal and dynamic
innovation system in the world, not surprisingly has the most diversified population of
inventors.
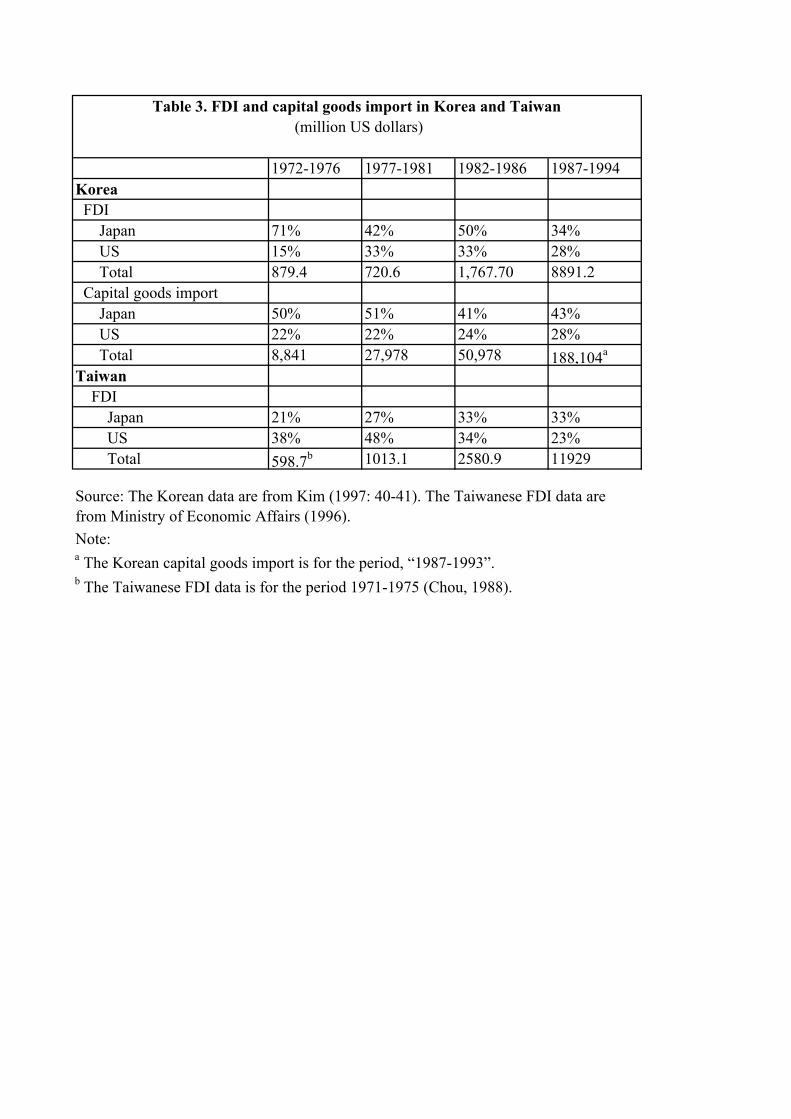
[Insert Table 3 here]
The two often-cited channels of technology transfer and diffusion, FDI and capital
goods import, have also played different roles in the two economies. As Hobday
observed, Korea has shown a greater reliance on Japan for capital goods import than
Taiwan. This is no historical accident. The Korean government undertook a restrictive
policy towards FDI after the 1970s, which led to a limited role of FDI in Korea’s
economic development. Instead, “Korea promoted technology transfer in the early years
through the procurement of turnkey plants and capital goods” (Kim, 1997, p.42). In Table
3 We present statistics on FDI and capital goods import for Korea and FDI for Taiwan.
Japan clearly dominates the U.S. in Korea’s capital goods import, consistently accounting
for between 40 to 50 percent of Korea’s enormous capital goods import. In a study of
intra-industry trade between Japan and Korea in the machinery industry, Tahara-Domoto
and Kohama (1989) reported that, “at the beginning of the 1980s, Korean government
worried about the heavy dependency of the machinery parts imported from Japan. In spite
of the increasing trend of local content ratio, more than 90% of the parts imported from
foreign countries for various electronics products was from Japan.”
The Taiwanese government’s more liberal policy towards FDI led to a larger role
of FDI in Taiwan than in Korea. U.S. and Japan account for the majority of foreign direct
investment in Korea and in Taiwan. In the early 70s, as Table 3 shows, 71 percent of
Korea’s FDI was from Japan and only 15 percent was from U.S.. In Taiwan, on the other
5 Again, these numbers have been corrected for the bias due to low patent counts in the early years. The patent “assignee” is the legal entity to which the property right is assigned. To the extent that members of the Chaebol accept patent assignments as distinct entities, our measure of concentration arguably understates the true concentration by treating these affiliated but distinct entities as separate.
11
hand, 38 percent was from U.S. and 21 percent was from Japan. This pattern remained in
the late 70’s and early 80’s. Since then Japan has become the largest investor in both
economies. Taiwan’s connection to the U.S. semiconductor industry through Taiwanese
engineers working in the U.S. played an important role in the development of the
electronics industry in Taiwan (Mathews, 1995, and Saxenian, 2000). According to
Mathews and Cho (2000, p.158), Taiwan’s strategy of developing the semiconductor
industry was largely the brainchild of a group of Taiwanese engineers working in the
U.S. semiconductor industry. And the whole industry started off with the licensing of an
IC fabrication technology from the U.S. semiconductor firm, RCA in 1976.
In sum, Korea and Taiwan are graduating from imitation to genuine technological
innovation and are fast catching up with advanced economies. However, the
technological gap remains. U.S. and Japan have maintained a close economic association
with Korea and Taiwan through investment and trade. To the extent that FDI and trade
are potential facilitators of knowledge diffusion, the economic connections between
U.S./Japan and Korea/Taiwan are likely to have an impact on the patterns of knowledge
diffusion.
IV. Patent Citation, Technology Proximity, And Knowledge Diffusion The validity of using patent citations as an indicator of knowledge spillover has been
extensively discussed elsewhere (Jaffe, Trajtenberg, and Henderson, 1993 and Jaffe,
Trajtenberg and Fogarty, 2000). We do not intend to discuss this issue at length here.
Patent citation is a coarse and noisy measure of knowledge spillover, but it does contain
much useful information that provides insight on how knowledge may diffuse across
geographical and technological regions as well as over time.
[Insert Figure 4 here]
Figure 4 presents a rough picture of how patent citation has evolved for Korea and
Taiwan. We observe the following stylized facts. First, U.S. and Japan appear to be the
major source of international knowledge flow to Korea and Taiwan. The share of
citations made by Korean and Taiwanese patents to their U.S. and Japanese counterparts
consistently account for over 70 percent of all citations they make. Second, both Korean
and Taiwanese inventors have made more citations to U.S. patents than Japanese patents.
Third, there seems to be a trend for the shares of citations to U.S. and Japanese patents to

12
converge, particularly for Korea from the mid 1980s’ to 1997. Fourth, Figure 4 also
seems to suggest that Korea makes a larger fraction of citations to Japanese patents than
Taiwan, whereas Taiwanese inventors cite relatively more U.S. patents.
Stylized fact One suggests that U.S. and Japan are the major sources of
knowledge spillover for Korea and Taiwan. Indeed this is part of the reason we choose to
focus on U.S. and Japan as the origins of external knowledge that Korea and Taiwan
draws upon. It is also consistent with the close economic association between Korea and
Taiwan with the U.S. and Japan, which we discussed in the previous section. It is
tempting to interpret stylized facts two to four as indicating different patterns of
knowledge diffusion from U.S. and Japan to Korea and Taiwan. As we will see,
interesting as they are, some of these stylized facts may be artifacts that result from the
fact that the raw share of total citations fails to account for certain factors that can
potentially distort the picture.
A. Citation frequency and knowledge spillover One problem with the share of citations measure is that it does not account for the change
in the absolute number of the potentially citable patents in the source economy. The
number of patents (taken out in the U.S.) by U.S. inventors is larger than the number
taken out by Japanese inventors, although the Japanese total has been rising much more
rapidly. This makes it more likely, all else equal, for any patent to cite U.S. patents than
to cite Japanese patents, with this difference declining over time. To the extent that the
relative patenting rates of the two countries reflected their relative rates of knowledge
creation, the tendency for more citation to the country that produces more patents could
be an accurate reflection of the relative contribution of the U.S. and Japan to knowledge
spillovers. It is likely, however, that the “propensity to patent in the U.S.” is different for
the two countries, and has been changing over time. To the extent this is the case, both
the greater rates of citation of U.S. patents relative to Japan, and the decline in that
difference over time, are likely to be artifacts of differential patent propensities, rather
than reflections of differences in spillover flow. For this reason, we develop measures of
citation intensity that control for differences in the rate of patenting by the source
country.
13
To remove the effects of the patenting rate of the source country, we interpret the
intensity of knowledge spillover as the likelihood that any given inventor in a recipient
country will cite any given invention created in a potential source country. This intensity
measure does not necessarily capture the overall magnitude of knowledge flow; it is
better interpreted as the strength of the communication pathway from the cited country to
the citing country. To estimate the likelihood or frequency of citation from Korea and
Taiwan to the U.S. and Japan, we adopt a slight modification of the citation frequency
measure defined in Jaffe and Trajtenberg (1999):
Dtjti
tjitji
NPNP
NCCF
,,
,,
−− = , (1)
where CFi-j, t denotes the frequency of country i’s patents that are granted in year t citing
all potentially citable patents taken out by country j up to t. The numerator of the right
hand side of (1), NCi-j, t, represents the total number of citations made by i’s patents
granted in year t to j’s patents. The denominator is the product of the number of i’s
patents in year t (NPi, t) and the number of potentially citable patents in country j as of
year t. The number of citations and the number of citing patents are given in the data. It is
not immediately clear how the number of potentially citable patents should be
constructed. This is the number of patents in the cited country j, which can be cited by an
inventor in country i as of year t. Since the knowledge embodies in patents becomes
obsolete, the total stock of patents of country j up to year t would not be a proxy for this
variable. Instead of trying to construct some kind of measure of an effective pool of
patents of the cited country, we propose the following relative citation frequency
measure:
))((,
,
,
,,
tk
ti
tji
tjktjik NP
NPNCNC
RCF−
−−− = (2)
where RCFk-i-j,t is the ratio of the frequency of country k citing country j to that of i citing
j in year t. Equation (2) says that for example, the relative frequency of Korean (k) and
Japanese (i) inventors citing a U.S. (j) patent is equal to the ratio of the number of
citations Koreans make to U.S. patents in year t over the number of Korean patents in
year t, multiplied by the inverse of this same ratio for Japan. By looking at the Korean
14
citation frequency to the U.S. relative to that of Japan, we remove effects due to the
number of U.S. patents available to be cited.
[Insert Figure 5 here]
The relative citation frequency measure in equation (2) is particularly helpful in
assessing the fourth stylized fact we identified above, i.e., is it more likely for Korean
(Taiwanese) inventors to cite Japanese (U.S.) patents than Taiwanese (Korean) inventors?
In Figure 5 we plot four series: Korean citations to the U.S. relative to Japanese citations
to the U.S. (RCFKUJ), Taiwanese citations to the U.S. relative to Japanese citations to the
U.S. (RCFTUJ), Korean citations to Japan relative to U.S. citations to Japan (RCFKJU), and
Taiwanese citations to Japan relative to U.S. citations to Japan (RCFTJU). These ratios are
were fairly volatile early in the period, probably due to the relatively small number of
citing patents in Korea and Taiwan, but they settle into a reasonably stable pattern in the
mid-1980s. For both Korea and Taiwan, the rate of citation to the U.S. is similar to that
of Japan, i.e., the relative citation frequency is approximately unity, with perhaps some
weak evidence of a higher rate for Taiwan in the 1990s. In contrast, citations from these
countries to Japan are at different rates than citations to Japan from the U.S. Korea cites
Japan at close to twice the rate that the U.S. does, while Taiwan cites Japan at a rate
approximately one-half to two-thirds the U.S. rate.
B. Technology proximity and knowledge spillover One factor that may account for the observed patterns of citation from U.S. and Japan to
Korea and Taiwan is the degree of closeness or similarity between countries in
technological space. In other words, if both Japan and Korea do disproportionately more
R&D and therefore patent more intensively in electronics than Taiwan and U.S., then we
would expect Korean inventors to cite Japanese patents more often than Koreans cite
U.S. patents, and more often than Taiwanese patents cite Japanese patents. The
technology space is a multi-dimensional space, with each dimension defined by a unique
technological area. We use the patent technological class information to construct a
measure of the closeness between two countries in the technology space.
The U.S.PTO assigns each granted patent into one of the 400 plus three-digit
patent technological classes. Each class represents a unique technological area. The
distribution of a country’s patents can be thought of as a 400-element vector, with each
15
element being the number of patents assigned to a specific patent technology class. These
400 patent classes span the technology space. We can then compute the closeness
between two countries in the technological space as the distance between the two vectors
of patent distribution. Following Jaffe (1986) and Jaffe and Trajtenberg (1999), we use
the following variable to measure the technological proximity of two countries in a given
year:
∑==
400
1,,,,,,
ntjntintji ffTP (3)
where technology proximity between countries i and j in year t, Tproxi,j,t, is the sum of the
product of fn,i,t, the share of country i’s patents in year t allocated to patent class n, and
fn,i,t , the counterpart for country j. The greater the extent to which the two patent
distribution vectors overlap, the bigger the technology proximity between the two
countries. When the two vectors are orthogonal, Tprox will be zero. It will be at its
maximum when the two vectors are identical.
[Insert Figure 6 here]
In Figure 6, we plot the technology proximities Korea-U.S., Korea-Japan,
Taiwan-U.S. and Taiwan-Japan. The most striking contrast is between the Korea-Japan
technology proximity and the Taiwan-Japan technology proximity. Korea is much closer
to Japan in the technology class distribution of patents than Taiwan is to Japan. This
difference increased from the mid 1980s to 1996, and has since shrunk slightly as Taiwan
and Japan moved slightly closer to each other. On the other hand, although Korea
resembles the U.S. more than Taiwan does, the difference is not large and has been
stable. Comparing Figures 5 and 6 we can see that the technology proximity differences
vis-à-vis Japan seem quite consistent with the observation that the citation frequency
from Korea to Japan is higher than that of Taiwan to Japan. The small and stable
difference between the Korea-U.S. and Taiwan-U.S. technology proximities also
corresponds to the difference between Taiwanese and Korean citation rates to the U.S.
(relative to the Japanese rates) in Figure 5.
Thus, at a descriptive level, we observe a pattern of significant citation of
Japanese and U.S. inventions by Korean and Taiwanese patents, with differences that
appear to have some connection to patterns of technological proximity. We now move
16
on to econometric estimation of a model of the citation process that incorporates the
effects of technological proximity, and allows more explicitly for the gradual diffusion
and obsolescence of knowledge over time.
V. A Model for Knowledge Diffusion We have examined citation frequency at the country level. The basic unit of analysis is
for example, the frequency with which Korean patents granted in 1990 cite all U.S.
patents. This formulation subsumes within the overall average frequency of citations the
time path over which knowledge transfer occurs. On the one hand, knowledge becomes
obsolete and therefore is less likely to be cited as time elapses. On the other hand, due to
language, geographical, trade, and other barriers, the accessibility to new knowledge
grows with time. The two effects are offsetting each other. To account for these factors,
we move the unit of our analysis to a more specific level and specify the following
citation frequency equation as in Jaffe and Trajtenberg (1999): 1 2( ( )) ( ( ))
, , ,(1 ) ( , , , ) [1 ]ij T t T tiT jtg iT jtg iT jtgCF Tprox i j g T e eβ βγ α ε− − − −= + − + (4)
where CFiT,jtg is the frequency of country i’s patents in year T citing country j’s patents in
technology area g in year t. Tprox is the technology proximity index measuring the
technological closeness of the citing country i’s patents in year T and the cited country j’s
patents in year t in one of the six technology subclasses, g.6 The rate at which a piece of
knowledge embodied in a patent becomes obsolete is measured by β1, which is allowed
to vary across country pairs. β2 measures the rate of diffusion, i.e., all else equal, how
fast a piece of knowledge travels across geographical and technological areas. The
various indices take on the following values: i = Korea, Taiwan, U.S., Japan; j = U.S.,
Japan; T =1977, …, 1999; t =1963,…, 1998; g =1,…,6. For citing countries, we include
U.S. and Japan for comparison with earlier studies, although our main interest focuses on
the citing behavior of Korea and Taiwan.
In addition to the above three basic parameters, we also exam how the citation
frequency differs across technological and geographical areas, and time by including a
number of shift parameters, which are collectively denoted by α(i,j):
6 Jaffe and Trajtenberg (1999) derive Eq. (4) from an underlying model in which a single patent cites other patents with a probability that is increased by γ if the patents are in the same class.
17
TgijTgji αααα =),,,( (5)
where all α’s enter in multiplicative form7. For example, for αij, there are eight
parameters for the eight country pair combinations: U.S.-U.S., U.S.-JP, JP-U.S., JP-JP,
KR-U.S., KR-JP, TW-U.S., and TW-Japan. When equation (4) is estimated, one of the
parameters, say αU.S.-U.S., is set to one as the reference case. If αKR-U.S. is estimated to be
0.5, it means a Korean patent is only half as likely to cite a U.S. patent as a U.S. patent is
to cite a U.S. patent. We also allow the rate of decay, β1, to differ across country pairs by
including βij, which is similar to αij by construction.
As we mentioned before, the relative citation frequency patterns we observed in
Figure 5 are cumulative in the sense that the citation frequency has been aggregated over
all the lags between t and T, to use the notation in equation (4). The parameters αij and βij
help us to decompose this aggregate difference into two components: on average how
much more likely it is for say Korea to cite U.S. relative to U.S. citing U.S. and how
much faster (slower) Korea cites U.S. than U.S. citing U.S.. αij and βij have offsetting
effects on the cumulative citation frequency: higher α means a higher probability of
citation across all lags, while higher β1 means the rate of citation decays more quickly,
which (holding other parameters constant) reduces the cumulative total made by any
given lag.
VI. Results The model in equation (4) is estimated with weighted nonlinear least square (NLS). As
long as the error term ε is not correlated with any of the regressors in (4), the NLS
estimation should yield consistent estimates. We weight each of the observations to
account for potential heteroskedasticity with the reciprocal of iTjtg NPNP , where NPjtg
is the number of potentially citable patents and NPiT is the number of potential citing
patents in the cell defined by j, t, g, i, and T.
[Insert Table 4 here]
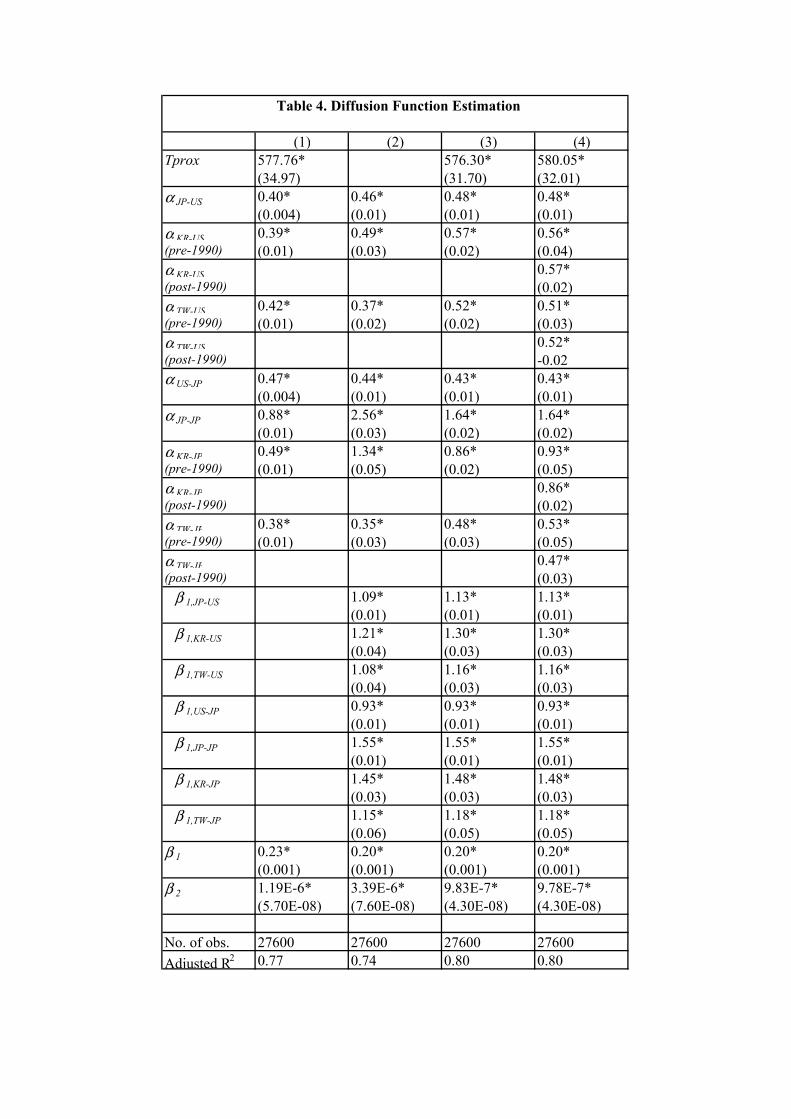
Results from estimating various variations of the model are presented in Table 4.
Column (3) represents the “full” model as presented in Eq. (4). Column (1) constrains
7 There are six αg’s, one for each technological are, and 23 αT’s, one for each T.
18
the obsolescence effects to be the same for all country pairs. Column (2) suppresses the
technological proximity effect. Column (4) explores whether, given the rapid changes in
apparent citing behavior visible in Figures 4 and 5, there are measurable differences in
citation rates from Korea and Japan after 1990, controlling for other effects.
All parameters estimated are highly statistically significant, far above
conventional confidence levels. The adjusted R2 of the model, ranging from 0.46 for the
bare bone version to 0.80 for the full model, suggests that the model fits the data
reasonably well. The technology proximity parameter is very significant, both
economically and statistically. The coefficient from the full model indicates that, all else
equal, citations to patents in the same patent class as the citing patent are over 500 times
as likely as citations to patents in other classes. This is even bigger than the
corresponding estimate of 99 that Jaffe and Trajtenberg (1999) estimated. It is unclear
why we get this larger technological proximity effect. One possibility is that we are
using more recent data (citations made through 99 versus through 94). The recent surge
in patenting has been generally observed to have led to overburdened patent examiners; it
is possible that this has led to citation searches that are less complete, and hence less
likely to require citations to more technologically distant inventions.8
The α parameter for each country pair captures the overall average rate of
citation, relative to citations by U.S. patents to U.S. patents, which is normalized to unity.
Consistent with the previously noted finding of geographic localization, all of these are
less than unity, except for Japan-Japan, which indicates extreme localization of Japanese
citations, consistent with previous findings. The effects of greatest interest for this group
of parameters are the estimates for Korea-U.S., Korea-Japan, Taiwan-U.S., and Taiwan-
Japan. The striking result is that Korea cites Japan at a rate 86% of the base U.S.-U.S.
rate, while all of the other estimates are in the 50%-60% range. What this says is that, on
average, Korea is almost as close to Japan as the U.S. is to itself. This is higher than any
other cross-border rate found previously; it suggests, for example, that Korea is closer to
Japan in this sense than the U.K. is to the U.S. (estimated at .72 in Jaffe and Trajtenberg,
1999). In contrast, the rates for Korea citing the U.S. and for Taiwan citing both Japan
8 Hall, Jaffe and Trajtenberg (2001) show that the absolute number of citations made over this period has been falling, also suggesting less thorough patent searches.
19
and the U.S. are slightly lower than most of the pairwise estimates for G-5 countries
found by Jaffe and Trajtenberg. Overall, then, Taiwan draws on Japan and the U.S., and
Korea draws on the U.S. at rates consistent with their being slightly more remote in terms
of knowledge flows than G-5 countries are from each other.
While these α coefficients shift the rate of citation at all lags, the β1 parameters
capture the speed with which citations decay. The estimated base value for β1 (again
corresponding to citations from the U.S. to the U.S. is about .2, implying a modal lag of
about 5 years, i.e., on average, the peak of the citation frequency occurs about 5 years
after a patent is granted. This value is similar to that found by Jaffe and Trajtenberg. The
estimates for each country pair indicate the decay rate relative to this base, with an
estimated value greater than unity implying faster decay. Interestingly, all of the Korea
and Taiwan estimates are greater than one, implying a focus on more recent inventions,
compared to citations made by U.S. inventors. This is particularly true for Korea, whose
values of 1.30 (for citations to the U.S.) and 1.48 (for citations to Japan) exceed the
estimate for Japan citing the U.S. and approach the estimate of 1.55 for Japan citing
itself. Thus these countries (particularly Korea) appear to behave in a manner similar to
Japan, focusing more narrowly on recently developed technology to an extent
significantly greater than is the case in the other G-5 countries. This is particularly
interesting, given that it might have been supposed that Korea and Taiwan are “catching
up,” potentially adapting and building on older technology than would be of interest to
more technologically advanced economies. The age of their citations is not consistent
with that view of innovation in countries like Korea and Taiwan.
Comparison of columns (2) and (3) shows that there is some degree of interaction
between the technological proximity effects and the estimated citation parameters. In
particular, the estimated α for Korea citing Japan is increased significantly if the
technological proximity effect is suppressed (1.34 in column (2) as compared to .86 in
column (3)). In effect, part of the high rate of citation can be attributed to the close
technological proximity of the two countries, visible in Figure 6. Once this effect is
controlled for, the “pure” citation frequency is not estimated to be as high. Other
contrasts between columns (2) and (3) are not as easy to relate to the contrasts in Figure
6. This could be because there is variation in the proximities between countries at the
20
lower level of aggregation used in the estimation, and also because all of the pairwise
effects are changing simultaneously between columns (2) and (3), including those in the
reference case of U.S.-U.S.
Comparison of columns (1) and (3) illustrates how overall citation rates are
affected by both the multiplicative α effects and the obsolescence effect captured by β1.
When β1 is allowed to vary, Japan-Japan and Korea-Japan evidence high rates of
obsolescence, which reduce the predicted number of citations at later lags. If this
variation in obsolescence rates is suppressed as in column (1), the model attempts to fit
the lower citation rates at high lags by reducing the overall citation intensity
parameterized by α. Thus, the α effects for Japan-Japan, Korea-Japan and Korea-U.S.
are reduced in column (1). Allowing both the α and β1 parameters to vary in column (3)
allows the model to fit both the higher overall citation intensity and higher obsolescence
of these pairs.
Finally, Column (4) was motivated by differences in citation patterns from Korea
and Taiwan in the latter part of the time period that appear in Figures 1,3,4 and 5. We
allowed both the α and β1 parameters to differ in value for citations made before and after
1990. As can be seen, however, there are no large differences in these parameters. This
means that the changes visible in the Figures were not associated with changes in the
underlying citation rate, after controlling for other factors such as technological
proximity.
[Insert Figures 7 and 8 here]
Using the estimated coefficients in column (3) of Table 4, we calculated
simulated citation distributions. These simulated frequencies are driven by the estimated
the α and β1 parameters, as well as the technological proximities between countries. In
Figure 7 the estimated frequencies of Japanese, Korean, and Taiwanese patents citing
U.S. patents are plotted, as a function of time elapsed after initial patent grant. The rising
and then falling citation probability is the combination of the diffusion and obsolescence
effects estimated in the model. The combination of similar α and higher β1 for Korea is
visible in that the simulated citation frequency is initially higher and than lower for Korea
as compared to Taiwan. Overall, the pattern of citation of these 3 countries to the U.S. is
21
similar, showing again the surprising extent to which Korea and Taiwan behave like
Japan with respect to citation of U.S. patents.
The much more intensive knowledge flow from Japan to Korea than to Taiwan is
dramatically displayed in Figure 8, where the estimated frequencies of Korean,
Taiwanese, and U.S. patents citing Japanese patents are plotted. Not only do Korean
patens cite Japanese patents much more intensively than do Taiwanese patents, but the
Korean citations also occur faster than Taiwanese ones. A year after a Japanese patent is
granted, the likelihood that a Korean patent cites it is over two times larger than the
likelihood that it is cited by a Taiwanese patent. The peak frequency of the Korean
citations is more than two times as large as that of the Taiwanese citations. The modal lag
for the Korean citation frequency distribution is 4 years, whereas the Taiwanese modal
lag is 6 years.
VII. Conclusions Korea and Taiwan are graduating from imitation to innovation. The number of patents
granted in the U.S. to these two economies has been growing rapidly. On per capita
patent count terms, Korea and Taiwan are catching up with the lower-tier developed
economies. Anecdotal evidence suggests that knowledge diffusion from the advanced
economies, particularly U.S. and Japan, played an important role in this catching up
process. We used patent citation as an indicator of knowledge diffusion to investigate the
pattern and intensity of knowledge flow from U.S. and Japan to Korea and Taiwan. With
a knowledge diffusion model that explicitly takes into account the role of technology
proximity and knowledge decay and knowledge diffusion over time, we analyzed several
stylized patterns that are derived from simple citation statistics.
We found interesting differences between the citation practices of Korea and
Taiwan. Korea is much closer to Japan than it is to the U.S., whereas Taiwan draws on
both Japan and the U.S. with similar frequency. Further, the frequency of citation of
Taiwan to the U.S. and Japan (after controlling for other effects) is similar to the
frequency of citation of Korea to the U.S., making the high frequency of citation of Korea
to Japan the “outlier” among these four country pairs. This high citation dependence of
Korea on Japan is partly due to their technological proximity, but even after controlling
for that effect, it is very high, higher than has been found among any of the G-5 countries.

22
These patterns of knowledge flow seem to be consistent with the anecdotal
evidence various authors have provided that Japan and the U.S. have played an important
role in the economic development of Korea and Taiwan through investment and trade.
Korea maintains a very close link to Japan economically and technologically. Our data
show that Japan is a more important source of foreign direct investment and capital goods
for Korea than the U.S. The fact that there is a higher incidence for Taiwan to cite U.S.
patents than Japanese patents is also consistent with the argument that foreign direct
investment from the U.S. and linkage of Taiwanese firms to U.S. firms through returning
students and Taiwanese expatriates working in the U.S. play an important role in
Taiwan’s technological progress, particularly in the electronics industry. Therefore, our
study points to the potential linkage between international knowledge flow and foreign
direct investment and trade in capital goods.
The other strong finding is that Korea and, to a lesser extent, Taiwan exhibit rapid
obsolescence, implying focus on relatively recent inventions and neglect of older
technology in their citation patterns. This is somewhat surprising given their presumed
distance from the world technology frontier. In this behavior they resemble Japan,
indeed they are more like Japan in this respect than are other G-5 countries. This
apparent focus on “rapid” adaptation of recent technology would be a fruitful area for
future research.
Our analysis of patent citation data has yielded several interesting patterns of
knowledge diffusion from U.S. and Japan to Korea and Taiwan. Although knowledge has
the property of being non-rival and non-exclusive, it follows different paths in diffusing
across countries. Many authors have proposed various channels through which
knowledge diffusion may be facilitated, such as foreign direct investment, international
trade, scholarly exchange, exchange of personnel, so on and so forth. Therefore, an
interesting research avenue we would like to pursue is whether and to what extent these
channels may facilitate knowledge diffusion from world innovators to developing
countries. This line of research is likely to generate interesting policy implications,
particularly for developing countries.
23
References Amsden, Alice. Asia’s Next Giant: South Korea and Late Industrialization, New York:
Oxford University Press, 1989. Chou, Tein-Chen, “American and Japanese Direct Foreign Investment in Taiwan: a
Comparative Study.” Hitotsubashi Journal of Economics. 29(2): 165-179. December 1988.
Coe, David T. and Helpman, Elhanan, (1995), “International R&D Spillovers.” European
Economic Review. 39 (5): 859-887. Coe, David T., Helpman, Elhanan, and Haffmaister, Alexander W. (1997), “North-South
R&D Spillovers.” Economic Journal. 107 (?): 134-149. January 1997. Cohen, Wesley M; Levinthal, Daniel A. “Innovation and Learning: The Two Faces of
R&D.” Economic Journal. 99 (397): 569-96. September 1989. Dollar, David, Sokoloff, Kenneth L., “Industrial Policy, Productivity Growth, and
Structural Change in the Manufacturing Industries: A Comparison of Taiwan and South Korea.” In Joel D. Aberbach, David Dollar, and Kenneth L. Sokoloff eds., The Role of the State in Taiwan’s Development. Pp. 5-25. New York: M.E. Sharpe, 1994.
Hall, Bronwyn H., Jaffe, Adam B. and Manuel Trajtenberg, “The NBER Patent Citations
Data File: Lessons, Insights and Methodological Tools,” National Bureau of Economic Research Working Paper No. XXXX, 2001
Hobday, Michael, Innovation in East Asia: the Challenge to Japan. Vermont: Edward
Elgar, 1995. Jaffe, Adam B., and Trajtenberg, Manuel, “International Knowledge Flows: Evidence
from Patent Citations.” Economics of Innovation & New Technology. 8 (1-2): 105-36. 1999.
Jaffe, Adam B., Trajtenberg, Manuel, and Henderson, Rebecca, “Geographic
Localization of Knowledge Spillovers as Evidenced by Patent Citations.” Quarterly Journal of Economics. 108 (3): 577-598. August 1993.
Jaffe, Adam B., Manuel Trajtenberg and Michael S. Fogarty, “Knowledge Spillovers and
Patent Citations: Evidence from A Survey of Inventors”. American Economic Review, Papers and Proceedings, pp. 215-218, May 2000
Keller, Wolfgang, “The Geography and Channels of Diffusion at the World’s
Technology Frontier,” NBER Working Paper No. 8150, March 2001.
24
Kim, Linsu, “Pros and Cons of International Technology Transfer: A Developing Country’s View,” in Tamir Agmon and Mary Ann von Glinow eds., Technology Transfer in International Business, New York: Oxford University Press, 1991, 223-39.
Kim, Linsu, Imitation to Innovation : the dynamics of Korea's technological learning,
Boston : Harvard Business School Press , 1997 Krugman, Paul. "The Myth of Asia Miracle." Foreign Affairs, 73(6): 62-78, 1994. Mathews, John A., High-Technology Industrialization in East Asia: the Case of the
Semiconductor Industry in Taiwan and Korea. Taiwan: Chung-Hua Institution for Economic Research, December 1995.
Mathews, John A. and Cho, Dong-Sung, Tiger Technology: The Creation of a
Semiconductor Industry in East Asia, Cambridge, UK: Cambridge University Press, 2000.
Tahara-Domoto, Kenji and Kohama, Hirohisa, “Machinery Industry Development in
Korea: Intra-industry Trade Between Japan and Korea.” International Development Center of Japan, Working Paper Series No. 43, Tokyo, Japan, 1989.
Trajtenberg, Manuel, “Innovation in Israel 1968-97: A Comparative Analysis Using
Patent Data.” Research Policy, 30 (3), pp. 363-390, March 2001 World Bank, The East Asian Miracle: Economic Growth and Public Policy, N.Y.:
Oxford University Press, 1993.
25
Appendix—New Patent Classes
Table A.1 List of patent classes created, 1996-99
Class number Description
349 Liquid Crystal Cells, Elements and Systems 386 Television Signal Processing for Dynamic Recording or Reproducing 396 Photography 399 Electrophotography 438 Semiconductor Device Manufacturing: Process 442 Web or Sheet Containing Structurally Defined Element or Component
(428/221) 463 Amusement Devices: Games 508 Solid Anti-Friction Devices, Materials Therefor, Lubricant or Separate
Compositions for Moving Solid Surfaces, and Miscellaneous Mineral Oil Compositions
510 Cleaning Compositions for Solid Surfaces, Auxiliary Compositions Therefor, or Processes of Preparing the Compositions
516 Colloid Systems and Wetting Agents; Subcombinations Thereof; Processes Of
700 Data Processing: Generic Control Systems or Specific Applications 701 Data Processing: Vehicles, Navigation, and Relative Location 702 Data Processing: Measuring, Calibrating, or Testing 704 Data Processing: Speech Signal Processing, Linguistics, Language
Translation, and Audio Compression/Decompression 705 Data Processing: Financial, Business Practice, Management, or
Cost/Price Determination 706 Data Processing: Artificial Intelligence 707 Data Processing: Database and File Management, Data Structures, or
Document Processing 708 Electrical Computers: Arithmetic Processing and Calculating 709 Electrical Computers and Digital Processing Systems: Multiple
Computer or Process Coordinating 710 Electrical Computers and Digital Data Processing Systems:
Input/Output 711 Electrical Computers and Digital Processing Systems: Memory 712 Electrical Computers and Digital Processing Systems: Processing
Architectures and Instruction Processing (e.g., Processors) 713 Electrical Computers and Digital Processing Systems: Support 714 Error Detection/Correction and Fault Detection/Recovery
26
Table A.2 Fraction of Country Patents in the New Classes
A. Fraction of total patents in all new patent classes 1996 1997 1998 1999 U.S. 8.3% 8.9% 11.3% 11.7% Japan 15% 14.2% 15.2% 14.8% Korea 16.1% 17.9% 17.2% 19.2% Taiwan 13.1% 14.7% 16.1% 19.4% B. Fraction in Class 438: Semiconductor Device Manufacturing: Process 1996 1997 1998 1999 U.S. 0.9% 1.2% 1.2% 1.8% Japan 1.9% 2.1% 1.8% 2.6% Korea 7.1% 9.3% 7.4% 8.2% Taiwan 11% 12.2% 12.2% 16.2%
Patents Cites Patents Cites Patents Cites
(1) US: All Classes 39556 5.7 80291 0.4 47252 4.0 Chemical 21% 5.4 14% 0.2 9591 3.7 Computers & Communications 8% 9.1 20% 0.8 4190 5.8 Drugs & Medical 7% 10.3 15% 0.3 3286 6.4 Electrical & Electronic 17% 5.5 15% 0.3 7785 3.7 Mechanical 22% 4.2 15% 0.3 10624 3.2 Other 26% 5.2 20% 0.3 11776 3.8
(2) Japan: All Classes 12746 3.1 30840 0.1 10843 2.1 Chemical 20% 3.3 15% 0.1 2142 2.2 Computers & Communications 13% 4.5 26% 0.2 1811 2.7 Drugs & Medical 4% 3.7 5% 0.1 493 2.6 Electrical & Electronic 20% 3.4 23% 0.2 2339 2.1 Mechanical 28% 2.2 21% 0.1 2731 1.6 Other 14% 3.1 10% 0.1 1327 2.1
(3) Korea: All Classes 41 3.5 3259 0.2 342 0.9 Chemical 17% 2.1 11% 0.1 55 0.5 Computers & Communications 10% 2.3 28% 0.2 162 1.0 Drugs & Medical 5% 1.5 2% 0.2 15 1.3 Electrical & Electronic 5% 2.5 35% 0.2 190 1.0 Mechanical 22% 2.7 14% 0.1 61 0.7 Other 41% 5.2 11% 0.1 47 1.1 Receptacles 12% 0.50% Apparel & Textile 10% 2%
(4) Taiwan: All Classes 174 3.0 3100 0.2 679 1.5 Chemical 7% 2.7 8% 0.1 52 1.1 Computers & Communications 3% 3.3 10% 0.3 51 1.9 Drugs & Medical 2% 2.5 2% 0.1 21 1.9 Electrical & Electronic 13% 3.4 34% 0.3 173 1.4 Mechanical 22% 1.7 19% 0.2 156 1.4 Other 52% 3.4 27% 0.2 239 1.6 Furniture, House Fixtures 11% 6% Miscellaneous 20% 10%
1985 1998 Overall average
Table 1 Basic Patent Statistics
1978 1982 1988 1990 1995 1998US 2.2 2.5 2.7 2.7 2.6 2.8Japan 1.8 2.2 2.7 3 2.7 3Korea 0.6 1 1.9 1.9 2.7 2.9Taiwan 0.6 0.9 1.3 1.7 1.8 2.1
Table 2. Research and development intensity in US, Japan, Korea, and Taiwan
R&D as a share of GDP (%)
Source: OECD Basic Science and Technology Statistics, 1999; US NSF website (www.nsf.gov); National Statistical Office of Korea website (www.nso.go.kr); and National Science Council of Taiwan website (www.nsc.gov.tw).
1972-1976 1977-1981 1982-1986 1987-1994Korea FDI Japan 71% 42% 50% 34% US 15% 33% 33% 28% Total 879.4 720.6 1,767.70 8891.2 Capital goods import Japan 50% 51% 41% 43% US 22% 22% 24% 28% Total 8,841 27,978 50,978 188,104a
Taiwan FDI Japan 21% 27% 33% 33% US 38% 48% 34% 23% Total 598.7b 1013.1 2580.9 11929
Note:a The Korean capital goods import is for the period, “1987-1993”.b The Taiwanese FDI data is for the period 1971-1975 (Chou, 1988).
Table 3. FDI and capital goods import in Korea and Taiwan(million US dollars)
Source: The Korean data are from Kim (1997: 40-41). The Taiwanese FDI data are from Ministry of Economic Affairs (1996).
(1) (2) (3) (4)577.76* 576.30* 580.05*(34.97) (31.70) (32.01)0.40* 0.46* 0.48* 0.48*(0.004) (0.01) (0.01) (0.01)
α KR-US 0.39* 0.49* 0.57* 0.56*(pre-1990) (0.01) (0.03) (0.02) (0.04)α KR-US 0.57*(post-1990) (0.02)α TW-US 0.42* 0.37* 0.52* 0.51*(pre-1990) (0.01) (0.02) (0.02) (0.03)α TW-US 0.52*(post-1990) -0.02
0.47* 0.44* 0.43* 0.43*(0.004) (0.01) (0.01) (0.01)0.88* 2.56* 1.64* 1.64*(0.01) (0.03) (0.02) (0.02)
α KR-JP 0.49* 1.34* 0.86* 0.93*(pre-1990) (0.01) (0.05) (0.02) (0.05)α KR-JP 0.86*(post-1990) (0.02)α TW-JP 0.38* 0.35* 0.48* 0.53*(pre-1990) (0.01) (0.03) (0.03) (0.05)α TW-JP 0.47*(post-1990) (0.03)
1.09* 1.13* 1.13*(0.01) (0.01) (0.01)1.21* 1.30* 1.30*(0.04) (0.03) (0.03)1.08* 1.16* 1.16*(0.04) (0.03) (0.03)0.93* 0.93* 0.93*(0.01) (0.01) (0.01)1.55* 1.55* 1.55*(0.01) (0.01) (0.01)1.45* 1.48* 1.48*(0.03) (0.03) (0.03)1.15* 1.18* 1.18*(0.06) (0.05) (0.05)
0.23* 0.20* 0.20* 0.20*(0.001) (0.001) (0.001) (0.001)1.19E-6* 3.39E-6* 9.83E-7* 9.78E-7*(5.70E-08) (7.60E-08) (4.30E-08) (4.30E-08)
No. of obs. 27600 27600 27600 27600Adjusted R2 0.77 0.74 0.80 0.80
α JP-JP
β 1,TW-JP
α JP-US
α US-JP
β 1,JP-JP
β 1,KR-JP
β 1
β 2
β 1,JP-US
β 1,KR-US
β 1,TW-US
β 1,US-JP
Table 4. Diffusion Function Estimation
Tprox
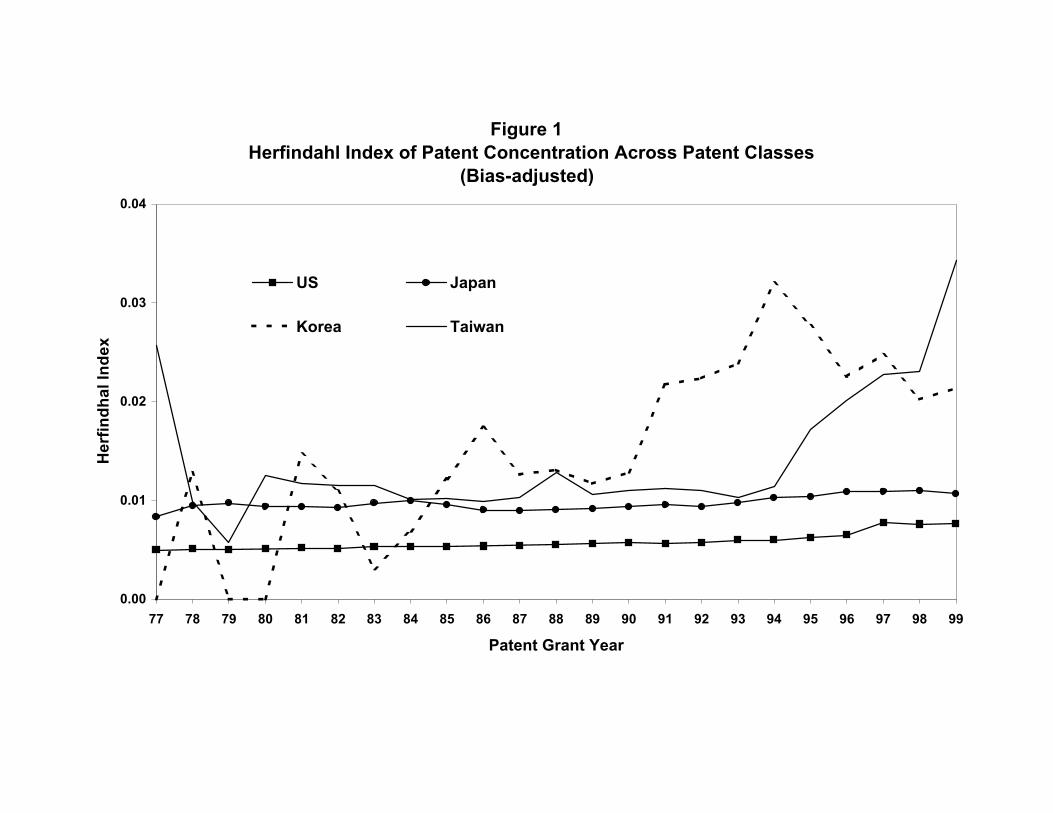
Figure 1 Herfindahl Index of Patent Concentration Across Patent Classes
(Bias-adjusted)
0.00
0.01
0.02
0.03
0.04
77 78 79 80 81 82 83 84 85 86 87 88 89 90 91 92 93 94 95 96 97 98 99
Patent Grant Year
Her
findh
al In
dex
US Japan
Korea Taiwan

Figure 2 Patents per Capita
0
5
10
15
20
25
30
77 78 79 80 81 82 83 84 85 86 87 88 89 90 91 92 93 94 95 96 97 98 99
Patent Grant Year
Pate
nts
per 1
00,0
00 P
opul
atio
n
USJapanKoreaTaiwanIsrael

Figure 3 Herfindahl Index of Patent Concentration Across Assignees
(Bias-adjusted)
0.00
0.05
0.10
0.15
0.20
0.25
0.30
81 82 83 84 85 86 87 88 89 90 91 92 93 94 95 96 97 98 99
Patent Grant Year
Bia
s-ad
just
ed H
erfin
dhal
Inde
x
USJapanKoreaTaiwan
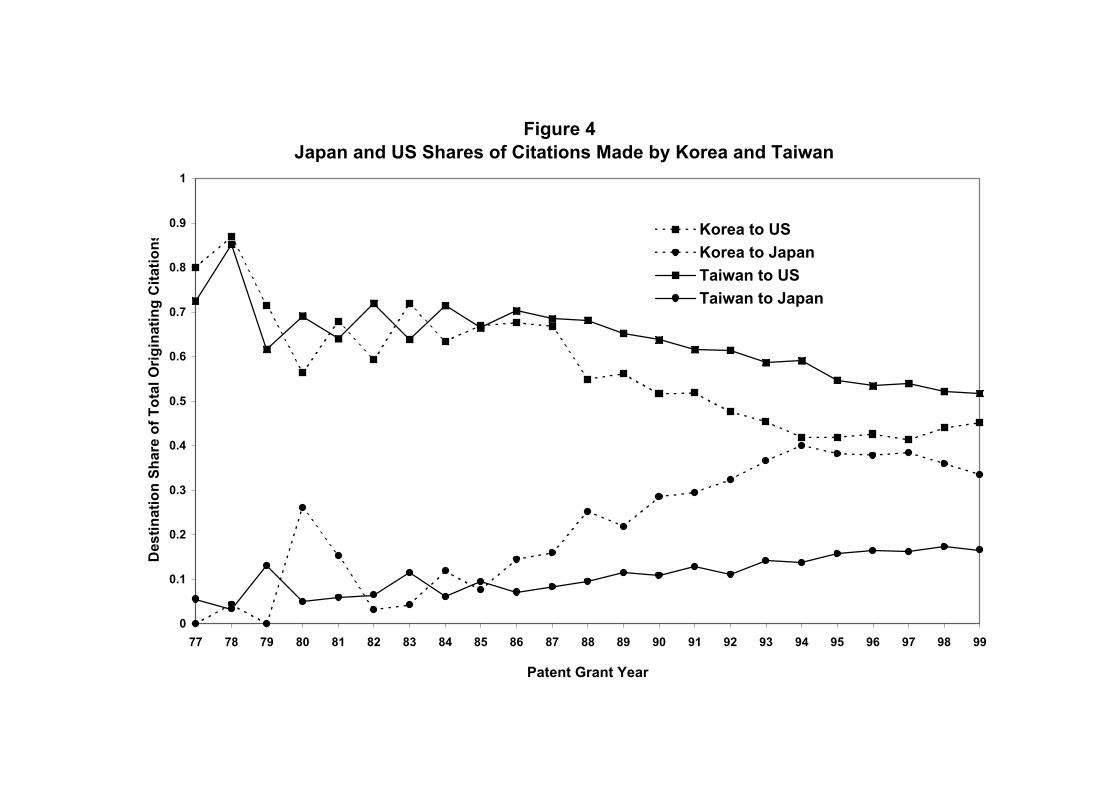
Figure 4 Japan and US Shares of Citations Made by Korea and Taiwan
0
0.1
0.2
0.3
0.4
0.5
0.6
0.7
0.8
0.9
1
77 78 79 80 81 82 83 84 85 86 87 88 89 90 91 92 93 94 95 96 97 98 99
Patent Grant Year
Des
tinat
ion
Shar
e of
Tot
al O
rigin
atin
g C
itatio
ns
Korea to USKorea to JapanTaiwan to USTaiwan to Japan
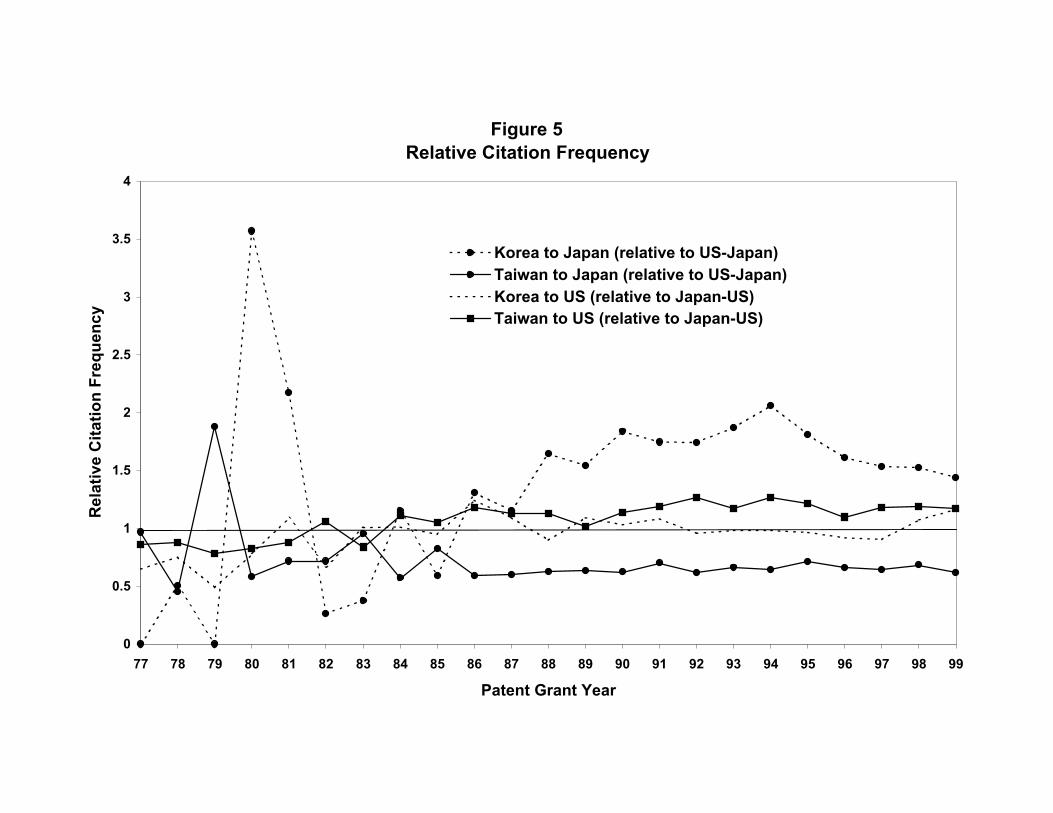
Figure 5Relative Citation Frequency
0
0.5
1
1.5
2
2.5
3
3.5
4
77 78 79 80 81 82 83 84 85 86 87 88 89 90 91 92 93 94 95 96 97 98 99
Patent Grant Year
Rel
ativ
e C
itatio
n Fr
eque
ncy
Korea to Japan (relative to US-Japan)Taiwan to Japan (relative to US-Japan)Korea to US (relative to Japan-US)Taiwan to US (relative to Japan-US)
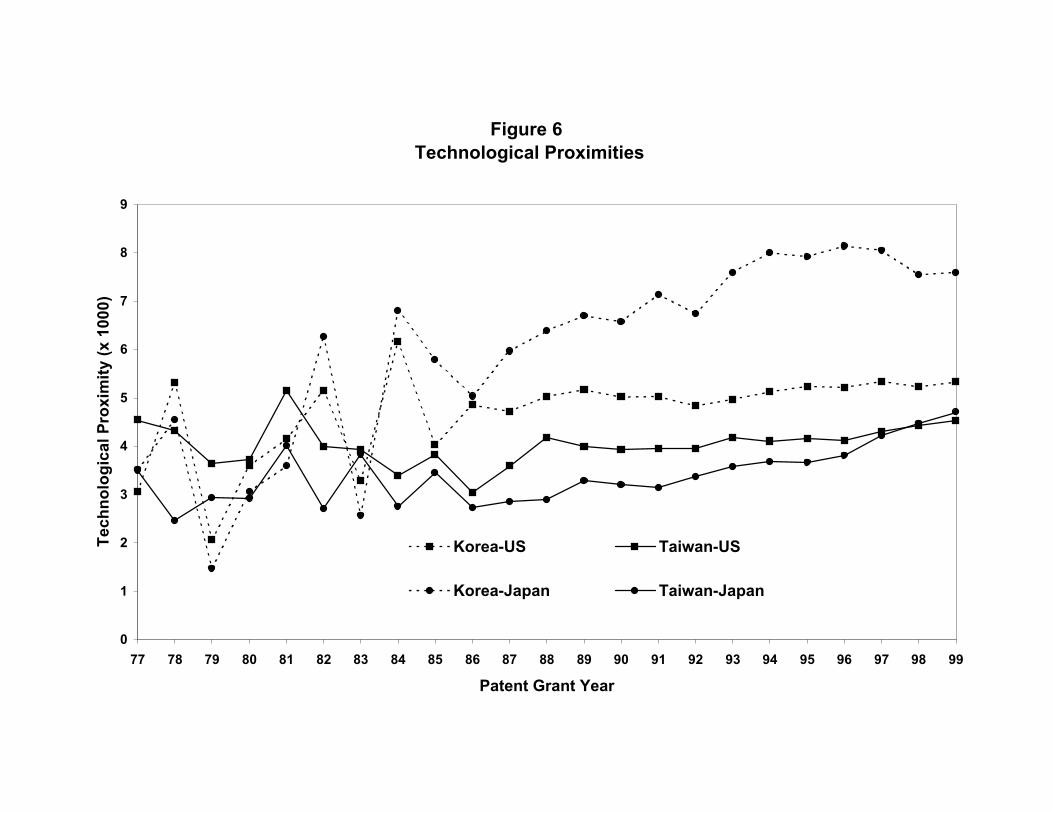
Figure 6 Technological Proximities
0
1
2
3
4
5
6
7
8
9
77 78 79 80 81 82 83 84 85 86 87 88 89 90 91 92 93 94 95 96 97 98 99
Patent Grant Year
Tech
nolo
gica
l Pro
xim
ity (x
100
0)
Korea-US Taiwan-US
Korea-Japan Taiwan-Japan
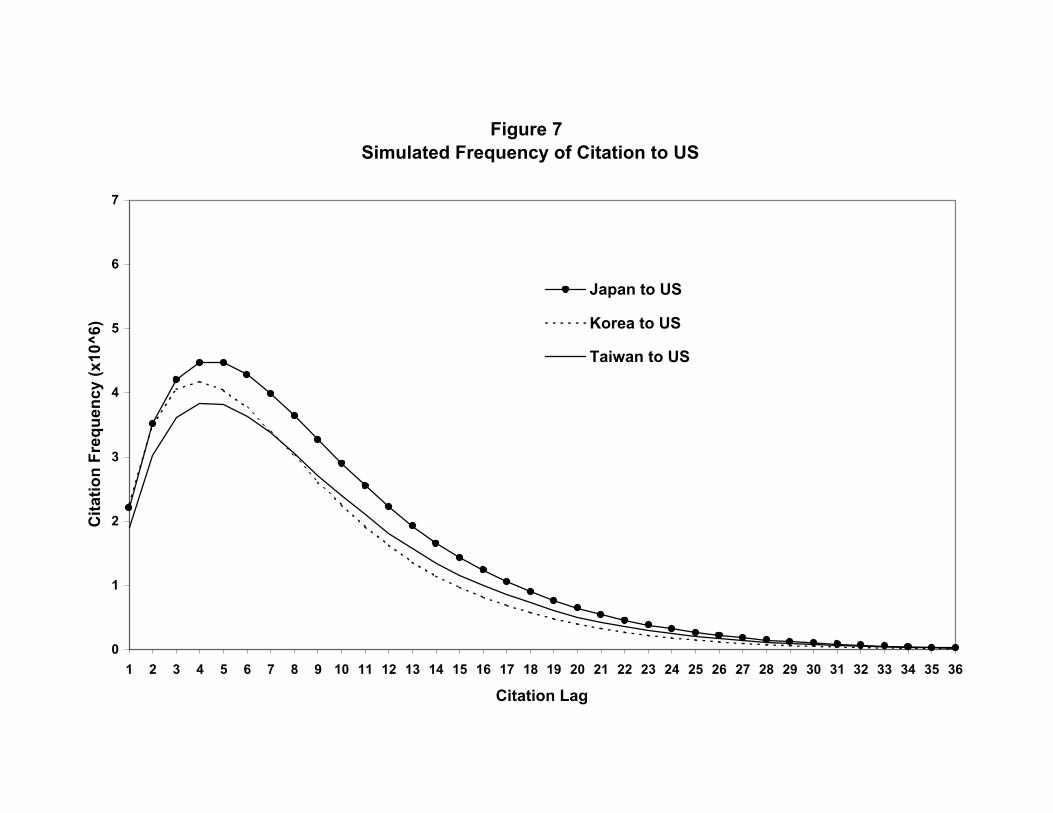
Figure 7 Simulated Frequency of Citation to US
0
1
2
3
4
5
6
7
1 2 3 4 5 6 7 8 9 10 11 12 13 14 15 16 17 18 19 20 21 22 23 24 25 26 27 28 29 30 31 32 33 34 35 36
Citation Lag
Cita
tion
Freq
uenc
y (x
10^6
)
Japan to US
Korea to US
Taiwan to US
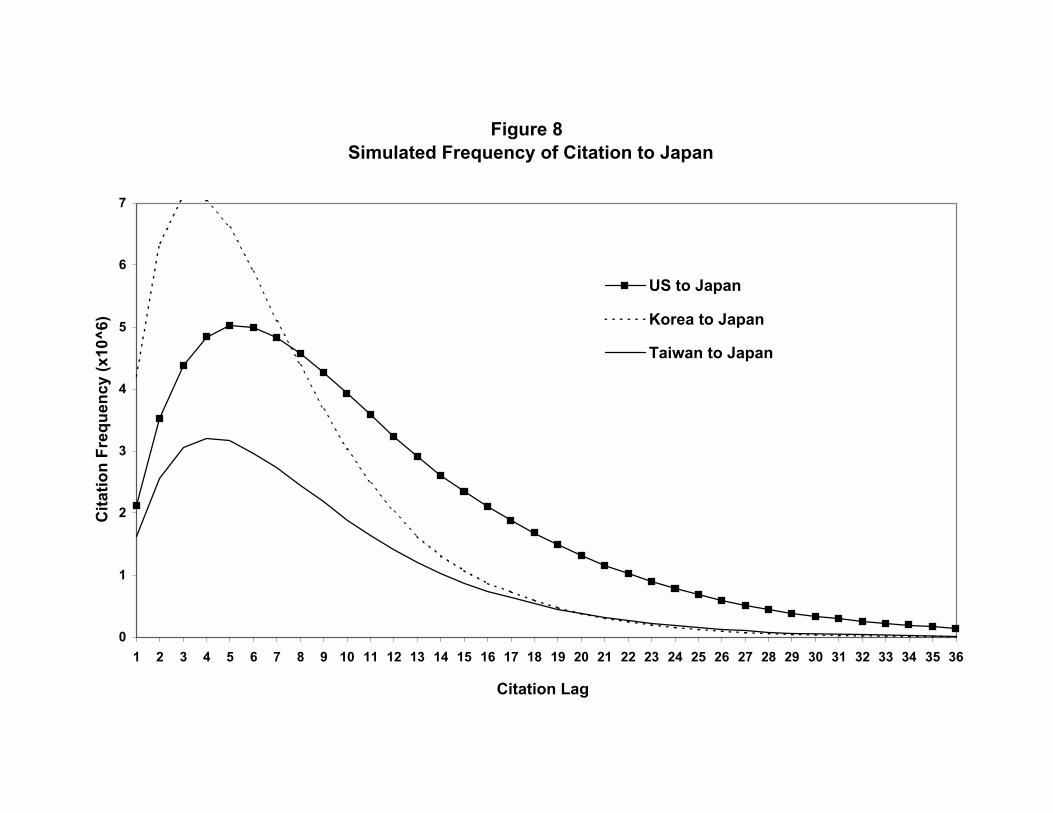
Figure 8 Simulated Frequency of Citation to Japan
0
1
2
3
4
5
6
7
1 2 3 4 5 6 7 8 9 10 11 12 13 14 15 16 17 18 19 20 21 22 23 24 25 26 27 28 29 30 31 32 33 34 35 36
Citation Lag
Cita
tion
Freq
uenc
y (x
10^6
)
US to Japan
Korea to Japan
Taiwan to Japan