MARKET STUDY: CURRENT AND PROJECTED...
34
MARKET STUDY: CURRENT AND PROJECTED WIND AND SOLAR RENEWABLE ELECTRIC GENERATING CAPACITY AND RESULTING COPPER DEMAND BBF Associates & Konrad J.A. Kundig, Ph.D. Submitted to the Copper Development Association Inc. Sustainable Electrical Energy Program July 20, 2011
Transcript of MARKET STUDY: CURRENT AND PROJECTED...
MARKET STUDY: CURRENT AND PROJECTED WIND AND SOLAR RENEWABLE ELECTRIC GENERATING CAPACITY AND
RESULTING COPPER DEMAND
BBF Associates & Konrad J.A. Kundig, Ph.D.
Submitted to the Copper Development Association Inc.
Sustainable Electrical Energy Program
July 20, 2011
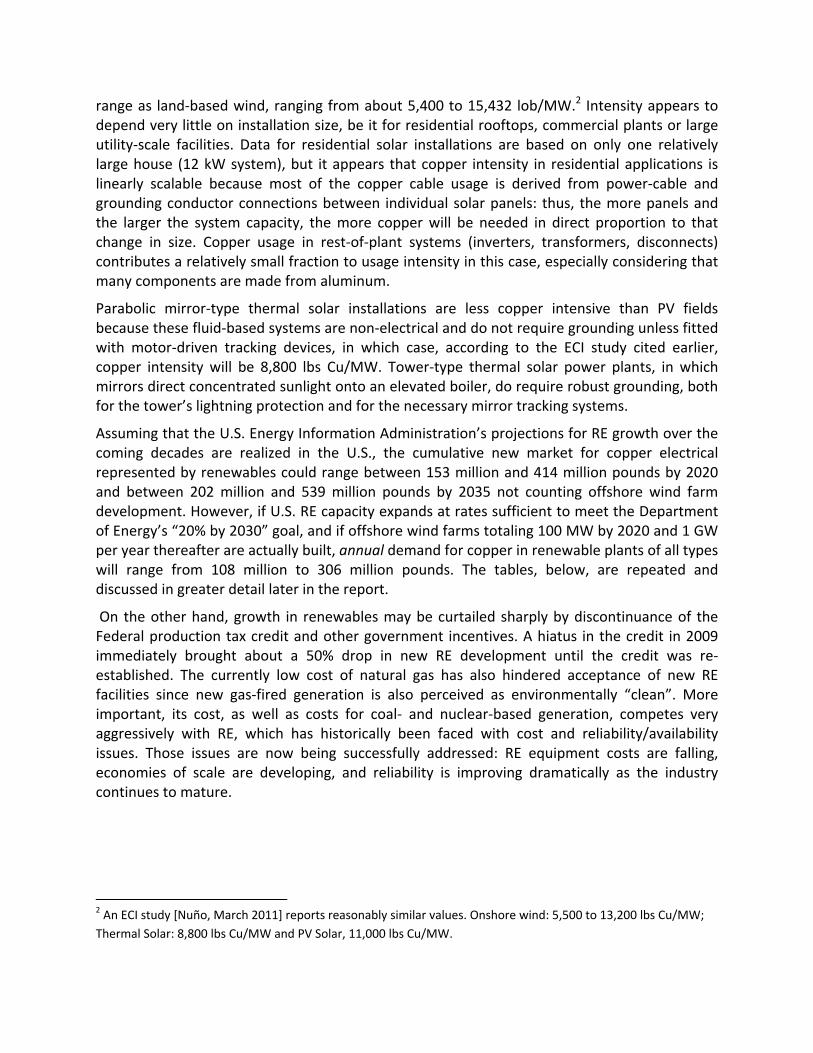
Executive Summary
The present report is based on a study of copper usage in major sectors of the U.S. renewable energy (RE) industry. It is intended to inform CDA members about the growing market for copper electrical products represented by this sizeable and rapidly expanding technology. It includes a description of the industry’s major components and of its market drivers and potential roadblocks. It also provides estimates of potential future copper usage intensity based on site visits, interviews and published industry experience. Estimates are presented for land‐based wind energy, offshore wind energy (based on recent UK experience), residential, commercial and utility‐scale photovoltaic installations and several trough‐ and tower‐type concentrating thermal solar electric plants. A brief examination of geothermal plants revealed that their copper usage intensity is essentially similar to that in conventional generating stations, and that the potential for large‐scale expansion of geothermal power is modest. The report further elaborates several interesting state RE plans, and suggests potentially fruitful areas for future copper promotion by CDA.
The RE industry is expanding rapidly. Wind‐energy generating capacity in the U.S. recently attained 40 gigawatts (GW), and the sector has posted a 25% compounded annual growth rate (CAGR) for the past several years. Photovoltaic (PV) solar, while starting from a much smaller base (2.6 GW installed as of 2010 [Bloomberg, 2011]), is growing at 60‐to‐70% CAGR in its residential and commercial sectors, while utility‐scale PV installations have quadrupled since 2008. Several utility‐scale thermal solar energy installations are planned or under development in the Southwest and Florida. There are as yet no offshore wind installations in the U.S., but a permit has recently been granted to developers in Massachusetts and at least three other states (Maine, New Jersey, Ohio) are aggressively preparing plans for state‐funded development off their coastlines.
Growth in RE capacity is extremely interesting to copper producers and fabricators of copper electrical products. Copper usage intensity, as measured in pounds needed per megawatt of new capacity (lb/MW) is larger in RE plants of all sizes and types, by a factor ranging between two and almost six times, than that seen in conventional fossil‐ or nuclear‐based generation.1 The larger usage intensity derives mainly from the large geographic areas taken up by utility‐scale RE installations and the consequent need for long runs of power and grounding cables to connect the plants’ widely dispersed components. Offshore wind energy, when it arrives, will be especially interesting for copper in this regard.
The land‐based wind “farms” examined in the study require between 5,600 and 14,900 pounds of copper per megawatt (lb/MW). Based on British experience, it appears that offshore wind farms may average as much as 21,076 lb/MW installed, including the submarine transmission cables to the onshore grid. Photovoltaic (PV) solar installations fall in the same usage intensity
1 The multiplier is based on the assumption that conventional/nuclear plants utilize 2,000 to 3,000 lbs Cu/MW, and somewhat less in plants larger than one gigawatt in capacity. A study by the Shaw Consulting Group commissioned by CDA approximately 10 years ago cited significantly higher values for conventional plants, but CDA membership reviewers believed those figures to be excessive, a sentiment that the authors of this support.
range as land‐based wind, ranging from about 5,400 to 15,432 lob/MW.2 Intensity appears to depend very little on installation size, be it for residential rooftops, commercial plants or large utility‐scale facilities. Data for residential solar installations are based on only one relatively large house (12 kW system), but it appears that copper intensity in residential applications is linearly scalable because most of the copper cable usage is derived from power‐cable and grounding conductor connections between individual solar panels: thus, the more panels and the larger the system capacity, the more copper will be needed in direct proportion to that change in size. Copper usage in rest‐of‐plant systems (inverters, transformers, disconnects) contributes a relatively small fraction to usage intensity in this case, especially considering that many components are made from aluminum.
Parabolic mirror‐type thermal solar installations are less copper intensive than PV fields because these fluid‐based systems are non‐electrical and do not require grounding unless fitted with motor‐driven tracking devices, in which case, according to the ECI study cited earlier, copper intensity will be 8,800 lbs Cu/MW. Tower‐type thermal solar power plants, in which mirrors direct concentrated sunlight onto an elevated boiler, do require robust grounding, both for the tower’s lightning protection and for the necessary mirror tracking systems.
Assuming that the U.S. Energy Information Administration’s projections for RE growth over the coming decades are realized in the U.S., the cumulative new market for copper electrical represented by renewables could range between 153 million and 414 million pounds by 2020 and between 202 million and 539 million pounds by 2035 not counting offshore wind farm development. However, if U.S. RE capacity expands at rates sufficient to meet the Department of Energy’s “20% by 2030” goal, and if offshore wind farms totaling 100 MW by 2020 and 1 GW per year thereafter are actually built, annual demand for copper in renewable plants of all types will range from 108 million to 306 million pounds. The tables, below, are repeated and discussed in greater detail later in the report.
On the other hand, growth in renewables may be curtailed sharply by discontinuance of the Federal production tax credit and other government incentives. A hiatus in the credit in 2009 immediately brought about a 50% drop in new RE development until the credit was re‐established. The currently low cost of natural gas has also hindered acceptance of new RE facilities since new gas‐fired generation is also perceived as environmentally “clean”. More important, its cost, as well as costs for coal‐ and nuclear‐based generation, competes very aggressively with RE, which has historically been faced with cost and reliability/availability issues. Those issues are now being successfully addressed: RE equipment costs are falling, economies of scale are developing, and reliability is improving dramatically as the industry continues to mature.
2 An ECI study [Nuño, March 2011] reports reasonably similar values. Onshore wind: 5,500 to 13,200 lbs Cu/MW;
Thermal Solar: 8,800 lbs Cu/MW and PV Solar, 11,000 lbs Cu/MW.
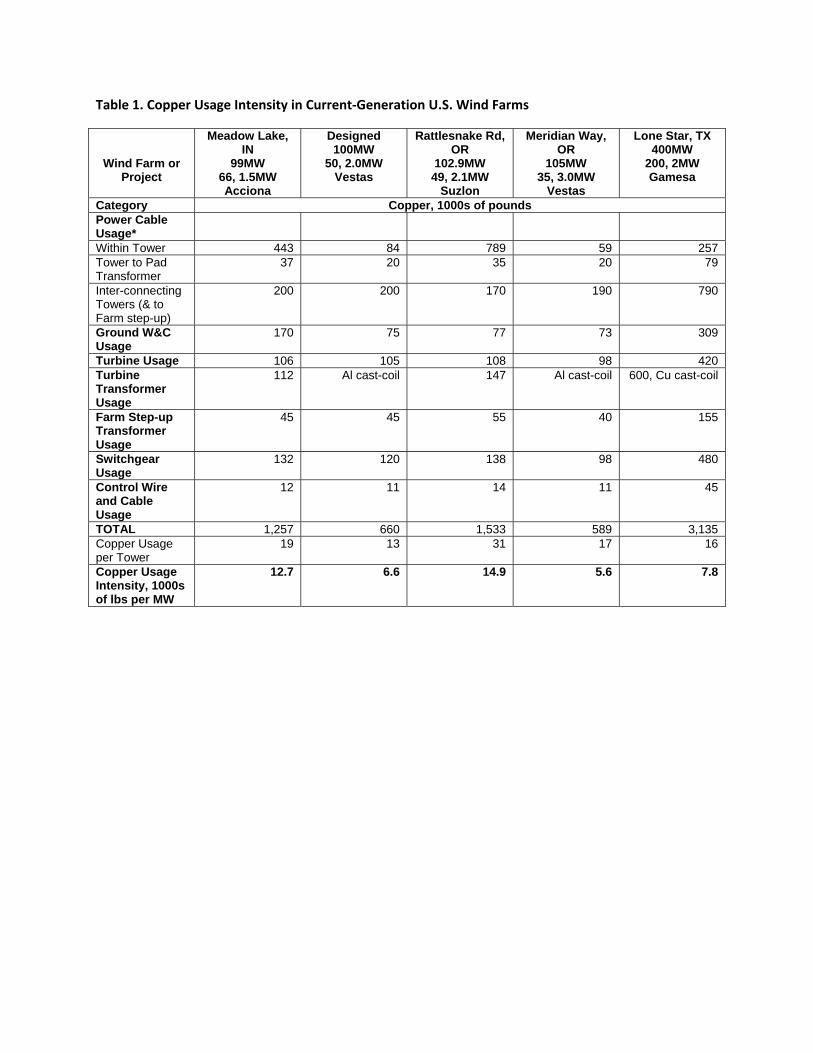
Table 1. Copper Usage Intensity in Current‐Generation U.S. Wind Farms
Wind Farm or Project
Meadow Lake, IN
99MW 66, 1.5MW Acciona
Designed100MW
50, 2.0MW Vestas
Rattlesnake Rd, OR
102.9MW 49, 2.1MW
Suzlon
Meridian Way, OR
105MW 35, 3.0MW
Vestas
Lone Star, TX400MW
200, 2MW Gamesa
Category Copper, 1000s of pounds Power Cable Usage*
Within Tower 443 84 789 59 257 Tower to Pad Transformer
37 20 35 20 79
Inter-connecting Towers (& to Farm step-up)
200 200 170 190 790
Ground W&C Usage
170 75 77 73 309
Turbine Usage 106 105 108 98 420 Turbine Transformer Usage
112 Al cast-coil 147 Al cast-coil 600, Cu cast-coil
Farm Step-up Transformer Usage
45 45 55 40 155
Switchgear Usage
132 120 138 98 480
Control Wire and Cable Usage
12 11 14 11 45
TOTAL 1,257 660 1,533 589 3,135 Copper Usage per Tower
19 13 31 17 16
Copper Usage Intensity, 1000s of lbs per MW
12.7 6.6 14.9 5.6 7.8
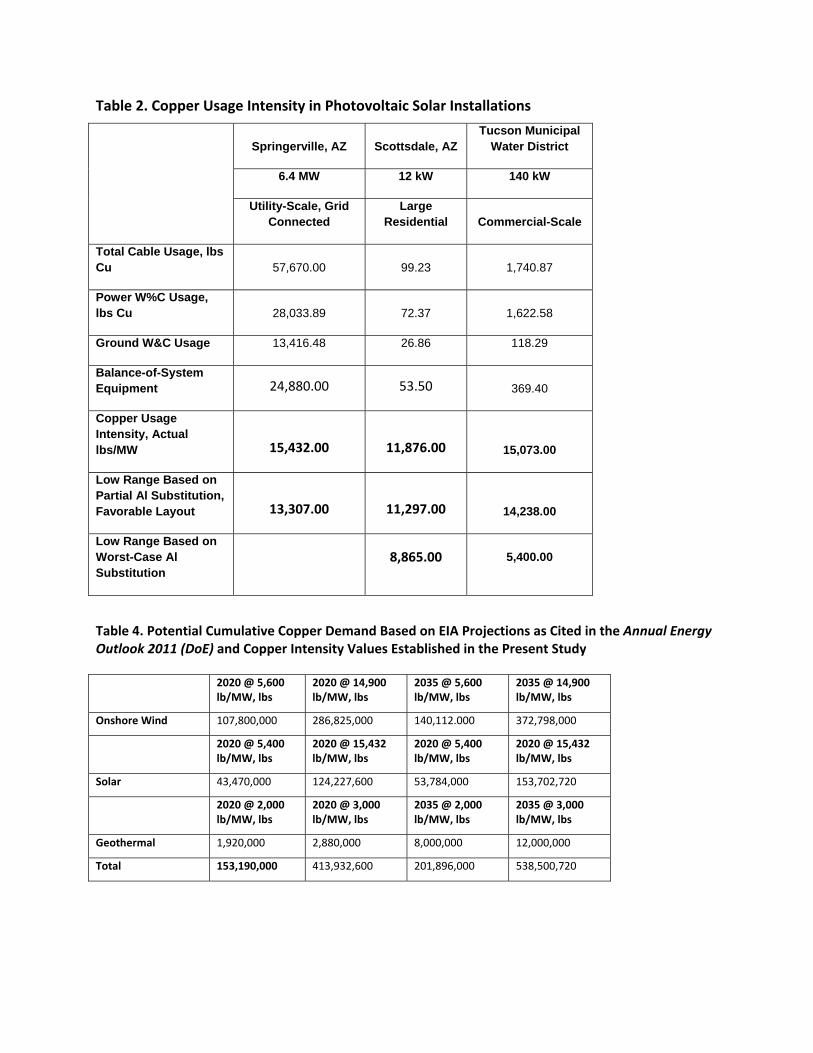
Table 2. Copper Usage Intensity in Photovoltaic Solar Installations
Springerville, AZ Scottsdale, AZ Tucson Municipal
Water District
6.4 MW 12 kW 140 kW
Utility-Scale, Grid Connected
Large Residential Commercial-Scale
Total Cable Usage, lbs Cu 57,670.00 99.23 1,740.87
Power W%C Usage, lbs Cu 28,033.89 72.37 1,622.58
Ground W&C Usage 13,416.48 26.86 118.29
Balance-of-System Equipment 24,880.00 53.50 369.40
Copper Usage Intensity, Actual lbs/MW 15,432.00 11,876.00 15,073.00
Low Range Based on Partial Al Substitution, Favorable Layout 13,307.00 11,297.00 14,238.00
Low Range Based on Worst-Case Al Substitution
8,865.00 5,400.00
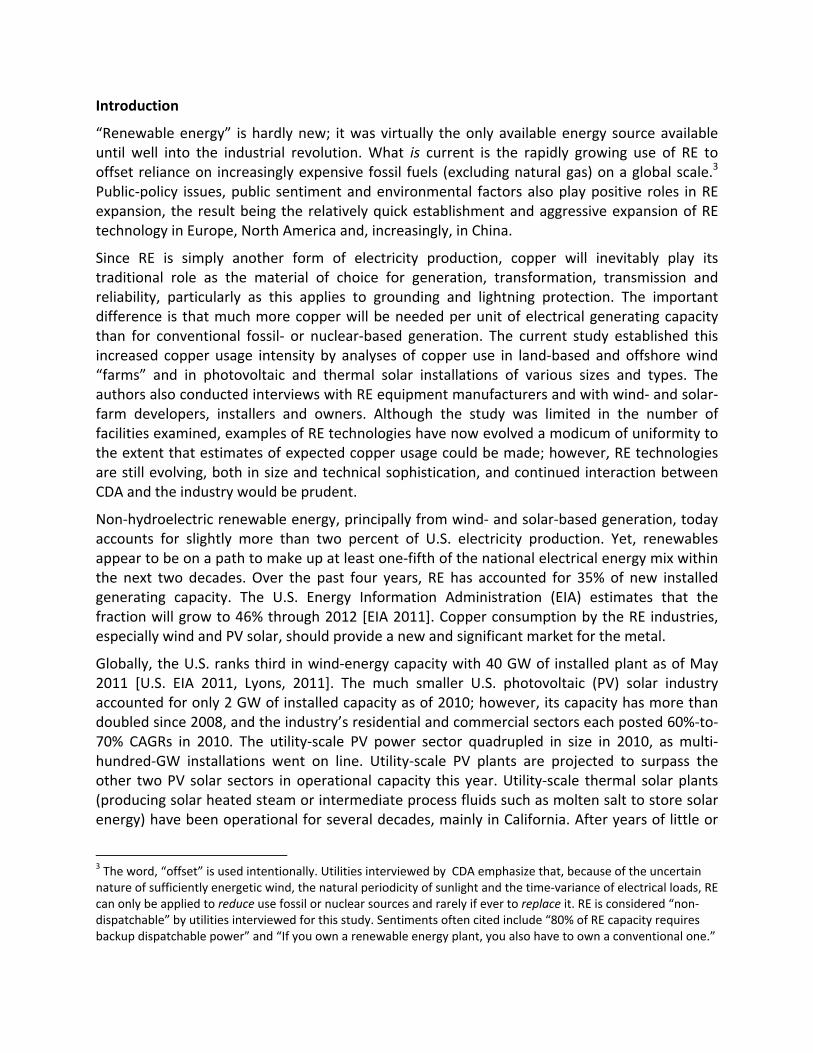
Table 4. Potential Cumulative Copper Demand Based on EIA Projections as Cited in the Annual Energy Outlook 2011 (DoE) and Copper Intensity Values Established in the Present Study
2020 @ 5,600 lb/MW, lbs
2020 @ 14,900 lb/MW, lbs
2035 @ 5,600 lb/MW, lbs
2035 @ 14,900 lb/MW, lbs
Onshore Wind 107,800,000 286,825,000 140,112.000 372,798,000
2020 @ 5,400 lb/MW, lbs
2020 @ 15,432 lb/MW, lbs
2020 @ 5,400 lb/MW, lbs
2020 @ 15,432 lb/MW, lbs
Solar 43,470,000 124,227,600 53,784,000 153,702,720
2020 @ 2,000 lb/MW, lbs
2020 @ 3,000 lb/MW, lbs
2035 @ 2,000 lb/MW, lbs
2035 @ 3,000 lb/MW, lbs
Geothermal 1,920,000 2,880,000 8,000,000 12,000,000
Total 153,190,000 413,932,600 201,896,000 538,500,720
Introduction
“Renewable energy” is hardly new; it was virtually the only available energy source available until well into the industrial revolution. What is current is the rapidly growing use of RE to offset reliance on increasingly expensive fossil fuels (excluding natural gas) on a global scale.3 Public‐policy issues, public sentiment and environmental factors also play positive roles in RE expansion, the result being the relatively quick establishment and aggressive expansion of RE technology in Europe, North America and, increasingly, in China.
Since RE is simply another form of electricity production, copper will inevitably play its traditional role as the material of choice for generation, transformation, transmission and reliability, particularly as this applies to grounding and lightning protection. The important difference is that much more copper will be needed per unit of electrical generating capacity than for conventional fossil‐ or nuclear‐based generation. The current study established this increased copper usage intensity by analyses of copper use in land‐based and offshore wind “farms” and in photovoltaic and thermal solar installations of various sizes and types. The authors also conducted interviews with RE equipment manufacturers and with wind‐ and solar‐farm developers, installers and owners. Although the study was limited in the number of facilities examined, examples of RE technologies have now evolved a modicum of uniformity to the extent that estimates of expected copper usage could be made; however, RE technologies are still evolving, both in size and technical sophistication, and continued interaction between CDA and the industry would be prudent.
Non‐hydroelectric renewable energy, principally from wind‐ and solar‐based generation, today accounts for slightly more than two percent of U.S. electricity production. Yet, renewables appear to be on a path to make up at least one‐fifth of the national electrical energy mix within the next two decades. Over the past four years, RE has accounted for 35% of new installed generating capacity. The U.S. Energy Information Administration (EIA) estimates that the fraction will grow to 46% through 2012 [EIA 2011]. Copper consumption by the RE industries, especially wind and PV solar, should provide a new and significant market for the metal.
Globally, the U.S. ranks third in wind‐energy capacity with 40 GW of installed plant as of May 2011 [U.S. EIA 2011, Lyons, 2011]. The much smaller U.S. photovoltaic (PV) solar industry accounted for only 2 GW of installed capacity as of 2010; however, its capacity has more than doubled since 2008, and the industry’s residential and commercial sectors each posted 60%‐to‐70% CAGRs in 2010. The utility‐scale PV power sector quadrupled in size in 2010, as multi‐hundred‐GW installations went on line. Utility‐scale PV plants are projected to surpass the other two PV solar sectors in operational capacity this year. Utility‐scale thermal solar plants (producing solar heated steam or intermediate process fluids such as molten salt to store solar energy) have been operational for several decades, mainly in California. After years of little or
3 The word, “offset” is used intentionally. Utilities interviewed by CDA emphasize that, because of the uncertain nature of sufficiently energetic wind, the natural periodicity of sunlight and the time‐variance of electrical loads, RE can only be applied to reduce use fossil or nuclear sources and rarely if ever to replace it. RE is considered “non‐dispatchable” by utilities interviewed for this study. Sentiments often cited include “80% of RE capacity requires backup dispatchable power” and “If you own a renewable energy plant, you also have to own a conventional one.”
no growth, the technology is experiencing a renaissance, with utility‐scale expansion now planned or underway in several the Southwestern states [Swanson, 2011]. Development of new geothermal energy, another well‐known RE technology, is, like hydroelectric power, limited by the availability of suitable and/or environmentally acceptable sites.
According to the EIA’s Annual Energy Outlook 2011, growth of the U.S. RE industry is currently driven by Federal tax incentives, state renewable energy portfolios. In place in 29 states, the portfolios mandate the minimum renewable energy fraction of total capacity. The most important incentive is the Federal production tax credit, which expires at the end of 2012 unless Congress extends it. Additional drivers, not cited by the EIA, include the perception that RE reduces dependence on imported fuels and the fact that it improves atmospheric quality. EIA estimates that RE will dominate new electric generation build‐outs until 2016‐2020, after which natural gas‐fired facilities will take an overwhelming lead [U.S. EIA 2011].
The Department of Energy has called for RE expansion to provide 20% of U.S. electrical needs by 2030. According to one major wind turbine manufacturer (and soon also a major solar cell manufacturer), attaining 20% RE penetration would require 300+ GW, a 15% CAGR over 25 years and a $60 billion investment in transmission. States have been encouraged to develop Renewable Energy Portfolios, which are essentially roadmaps toward installation of a minimum fraction of expected electrical future requirements by renewables by some future date. Twenty nine states have published formal portfolios and an additional 11 states have similar but less binding statements in place, as described later in this report.
Growth of the emerging RE industry is vulnerable to several counteracting factors, the most potent of which would be a discontinuance of the Federal production tax credit. A hiatus in the credit in 2009 immediately brought about a 50% drop in new RE construction. Next in influence is the price of natural gas, currently low due to the recent discovery of large domestic reserves. Natural gas is considered a cleaner fuel than coal or oil and new gas‐fired plants face fewer environmental hurdles. The cost of power generated by these plants is highly competitive with RE energy, as is that for coal‐based generation, and this factor already hinders the trend toward more RE installations. While this issue is obviously beyond CDA’s influence, maintaining continued awareness of legislative and budgetary issues that affect growth of the RE industries should be considered.
Copper usage intensity for RE generation (pounds needed per megawatt of new capacity, lbs/MW) exceeds that for conventional fossil and nuclear generating facilities by a factor of between two and five. Thus, all new RE capacity added during the coming decades will require significant quantities of copper electrical products. Aggressive development of offshore wind energy will require even more copper owing to the large distances to be spanned with large‐gage conductors.
Substitution by aluminum is still a relatively minor issue in the U.S., although ECI believe it is already a threat in on‐shore wind as well as thermal and PV solar installations. The authors believe substitution by aluminum can be addressed with proactive promotion based on copper’s known benefits to energy efficiency and assurance of long‐term reliability. Aluminum is vulnerable here by virtue of its lower strength, relaxation behavior and corrosion resistance. The downstream technical and economic risks associated with “value engineering” copper out
of critical components are unknown. And, because the costs or repair, maintenance and downtime are known to be high in RE, especially in wind‐energy plants, copper promotion based on reducing life‐cycle costs through improved reliability and efficiency should be a worthwhile undertaking. Institutional promotion through the establishment of prudent codes, standards and recommended practices should is also recommended, especially in the rapidly growing residential and commercial PV solar industries.
RE’s early cost and reliability issues are now being successfully addressed; equipment and operating costs are falling while efficiency and reliability are improving. The cost of solar PV modules has plummeted in recent years, and at least one prominent U.S. manufacturer expects to offer modules for as low as $0.50/watt by 2013 (down from $2.10 in 2011). Mass‐produced cells can now exceed 20% efficiency, a virtual doubling over the past two years. Wind‐based RE is undergoing a similar trend. Efficiencies of scale are expected to reduce life‐cycle costs as the size of wind turbines increases to five megawatts and larger. For example, erecting a 500‐MW wind farm with 4‐MW turbines would entail a capital cost of $1.4 billion and capital cost per MW of $2.80. The same plant built with 7‐MW turbines would require about $1.24 billion in capital cost, or $2.46/MW, a 12% reduction [Lyons, 2011]. Wind turbine capacity factors (fraction of power actually produced) have risen 10 percentage points since 2000. Reliability is also improving, mainly due to technological advances such as direct‐drive systems in wind turbines that eliminate trouble‐prone gearboxes, and electrical innovations such as high‐frequency power conditioning in the nacelle to ensure optimum grid compatibility. Nonetheless, the increasing emphasis on efficiency and reliability in order to reduce both operating‐ and life‐cycle costs presents an opportunity to bring information about copper’s advantages to RE equipment suppliers, RE‐farm developers and, especially, prospective owners. Key issues to address include copper’s higher conductivity (for lower transformer losses, for example, copper’s inherent corrosion resistance (especially in offshore plants, but elsewhere, as well, and copper’s higher strength and relaxation resistance (especially in connectors, but also in transformers). Evidence and documentation of these advantages in RE installations is being sought.
The cost differential between copper and aluminum is seen as an emerging issue by some manufacturers who were interviewed for the present study. It has begun to affect copper usage intensity in some equipment brands and in some RE installations. For example, one leading European wind turbine supplier now substitutes aluminum for copper in step‐up transformers. The supplier also moved the step‐up transformers from the tower base to the nacelles, thereby transmitting high‐voltage power ― over smaller‐gage cables ―to the ground‐based collection grid. In the utility‐scale PV solar arena, there may be a trend away from the extensive buried copper grounding/lightning protection networks found in early installations. This is not a universal phenomenon, and it has only a moderate effect on copper usage intensity. More troubling is the trend toward the use of metallic structural members as the ground return path in residential PV solar installations, thereby eliminating more‐reliable copper grounding conductors. The technique is permitted, although safety codes are vague and are seen as work in progress. The grounding issue is entirely analogous to the practice of using metallic conduit or raceways instead of a more‐reliable “green wire” in electrical installations. Combatting the lower‐reliability practice presents an opportunity for copper promotion. It should be noted that
individual residential PV systems consume only modest amounts of copper wire, but their aggregate number is large and growing. In contrast, wind farm designs have become somewhat more uniform than in early years, and it has become accepted practice to install a single all‐copper grounding system connecting all components (turbines, transformers, substations, etc.). Grounding conductors are usually AWG 4/0 but may be as large as 250 MCM. A survey of more than 100 wind farms revealed that conductor lengths average 25 miles per 100‐MW wind farm. Grounding is of paramount importance to ensure uniform ground potential among electrical components. Grounding also serves for lightning protection. This sort of standardized, all‐copper grounding is common but not yet formalized in PV solar fields. Because of its importance to reliability and to avoid risk of liability for developers, appropriate promotion by CDA is recommended.
There have also been reports of increasing use of copper‐clad steel grounding conductors by some utilities in the U.S. in order to thwart pilferage, but the practice is not yet known in the RE industry according to industry sources contacted during the study. CDA should consider a promotion campaign designed to discourage this reliability‐reducing practice.
Industry Overview
It may be useful to begin by the various types of RE generation, their scope and market size, and factors that affect their growth and their product needs.
Onshore Wind Energy: An Established but Still Rapidly Growing Copper Market. Onshore wind comprises by far the largest segment of the RE industry. Although commercial wind farms were established in the U.S. as early as 30 years ago, interest waned until earnest development arose in Europe, where fossil fuel costs are high and improved technology was soon developed. Wind‐based RE then re‐emerged in North America and other developed regions. There were some 200 gigawatts (GW) of installed land‐based wind capacity globally as of 2010. The industry has surpassed $60 billion in size and is expanding at a 25% compounded annual growth rate (CAGR). China installed 16 GW in 2010 alone. [Lyons, 2011] The U.S. ranks third in capacity with 40 GW in installed plant as of May 2011 [U.S. EIA 2011, Lyons, 2011].) Texas leads the U.S. in installed capacity, followed by Iowa and California [EIA, various]. The Great Plains states have the most favorable wind resources, but viable tracts exist in the Pacific Northwest, Appalachia, the South and portions of Ohio, New York and New England. Future expansion will continue in these regions, but, long‐term, more promising development is likely to occur offshore, as described later.
Leading manufacturers of wind turbines include General Electric, Vestas (Denmark), Siemens (Germany), Gamesa (Spain) and Suzlon (India). There are many smaller manufacturers.
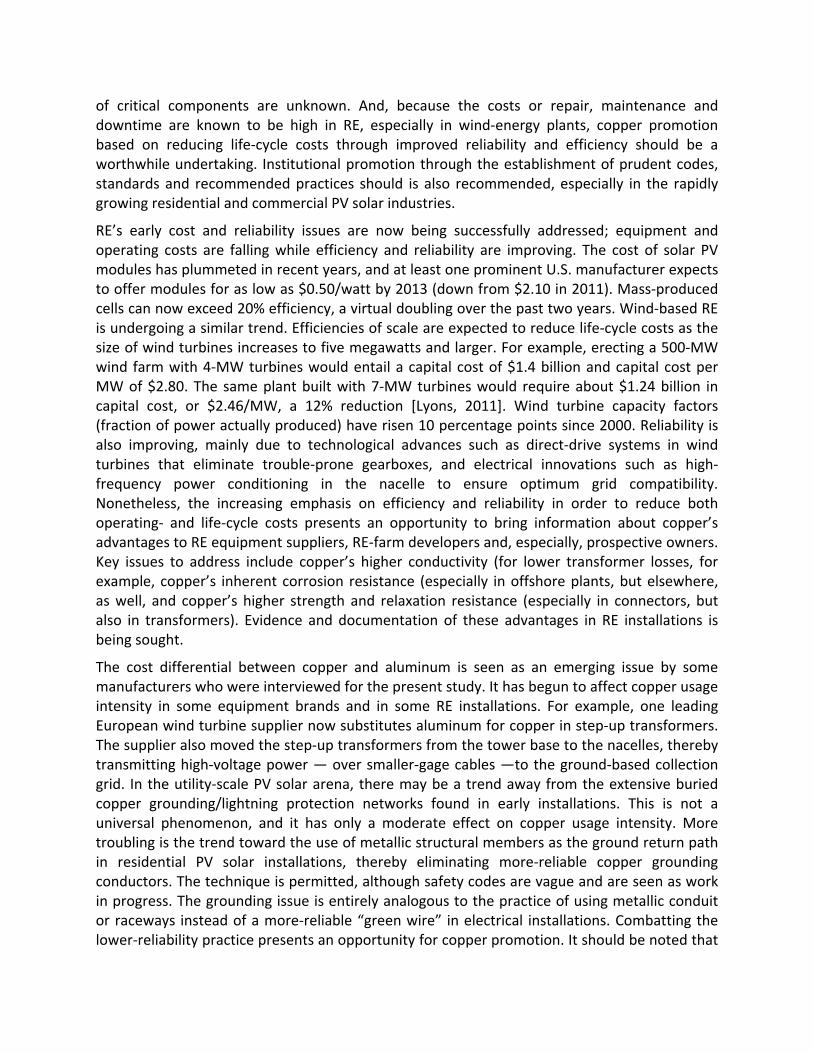
In traditional designs, three‐bladed rotors with speed‐controlling blades turn at about 14 rpm over a range of wind speeds from about eight to 28 mph (limits vary). A massive gearbox mounted behind the rotor increases shaft speed to 1200 rpm for an in‐line ac generator. Current‐technology turbines produce between 1.5 and 3 MW of power, but sizes up to 4 MW are already in use and still larger models will soon become available, Figure 1.
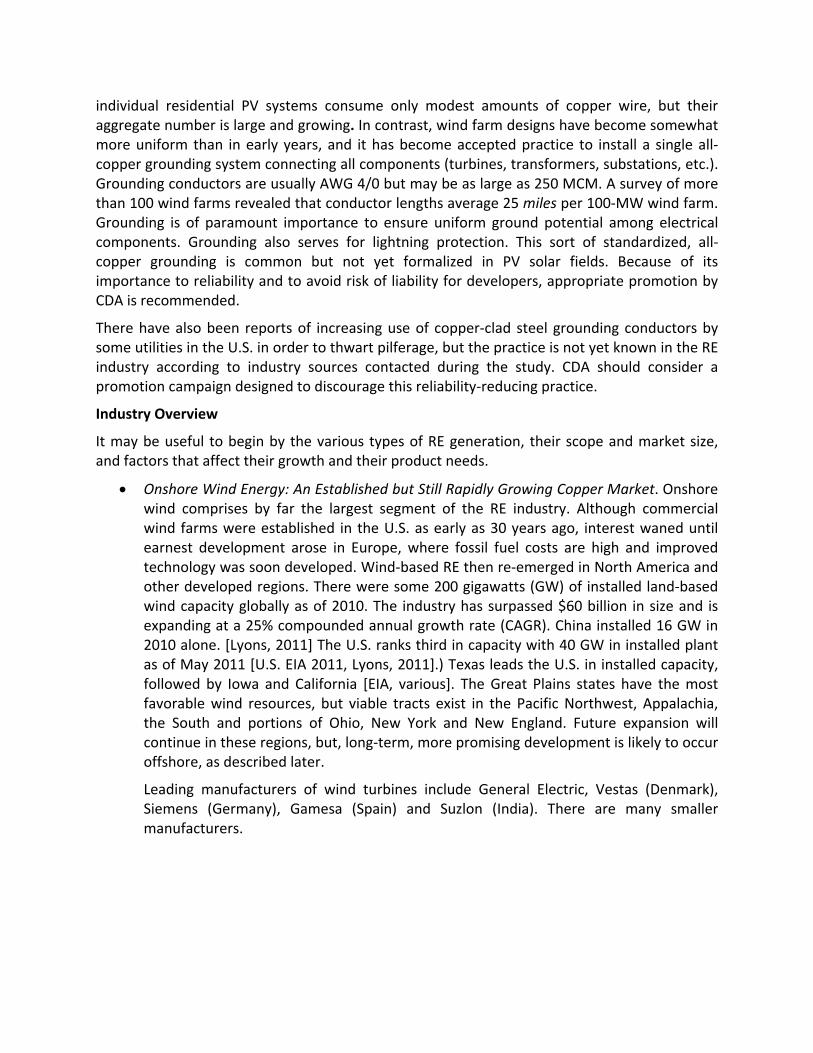
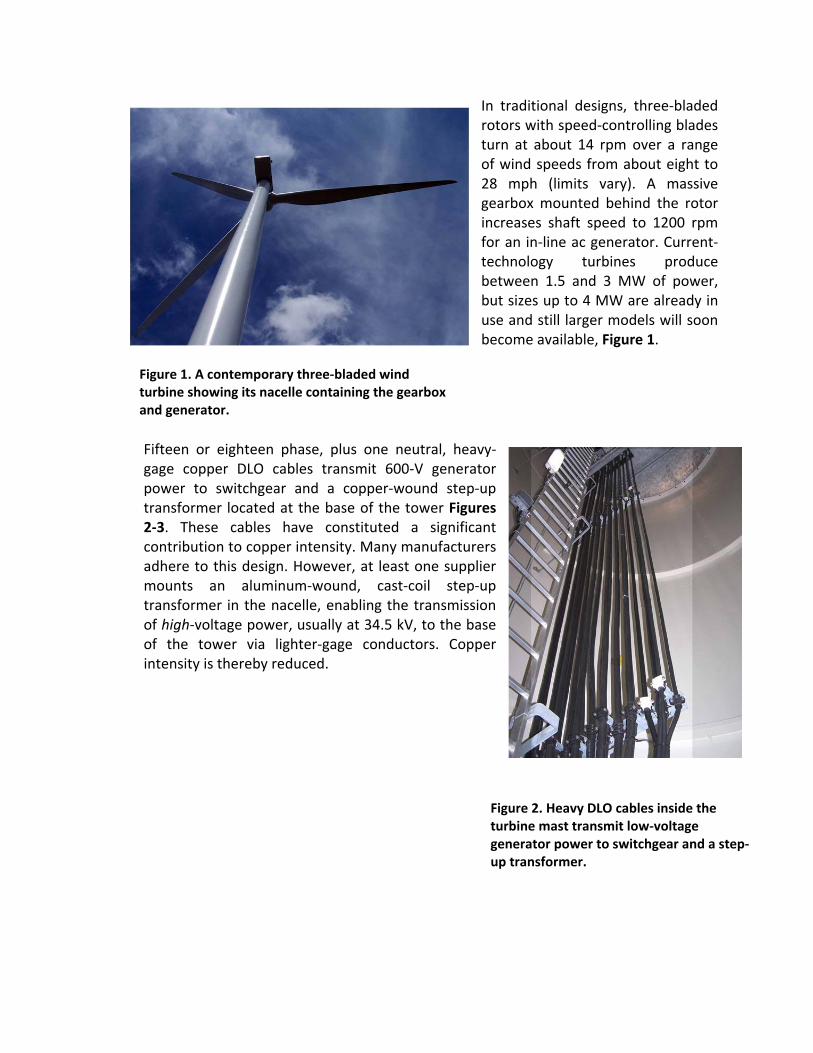
Fifteen or eighteen phase, plus one neutral, heavy‐gage copper DLO cables transmit 600‐V generator power to switchgear and a copper‐wound step‐up transformer located at the base of the tower Figures 2‐3. These cables have constituted a significant contribution to copper intensity. Many manufacturers adhere to this design. However, at least one supplier mounts an aluminum‐wound, cast‐coil step‐up transformer in the nacelle, enabling the transmission of high‐voltage power, usually at 34.5 kV, to the base of the tower via lighter‐gage conductors. Copper intensity is thereby reduced.
Figure 1. A contemporary three‐bladed wind turbine showing its nacelle containing the gearbox and generator.
Figure 2. Heavy DLO cables inside the turbine mast transmit low‐voltage generator power to switchgear and a step‐up transformer.
T
Several manufacturers now offer turbines featuring a direct‐drive connection between turbine and generator, eliminating the repair‐prone gearbox. One supplier now offers turbines with variable speed, permanent‐magnet‐excited, dc generators coupled to high‐frequency inverters, power‐conditioning equipment and aluminum‐wound transformers from which high‐voltage ac power is transmitted to the base of the tower.
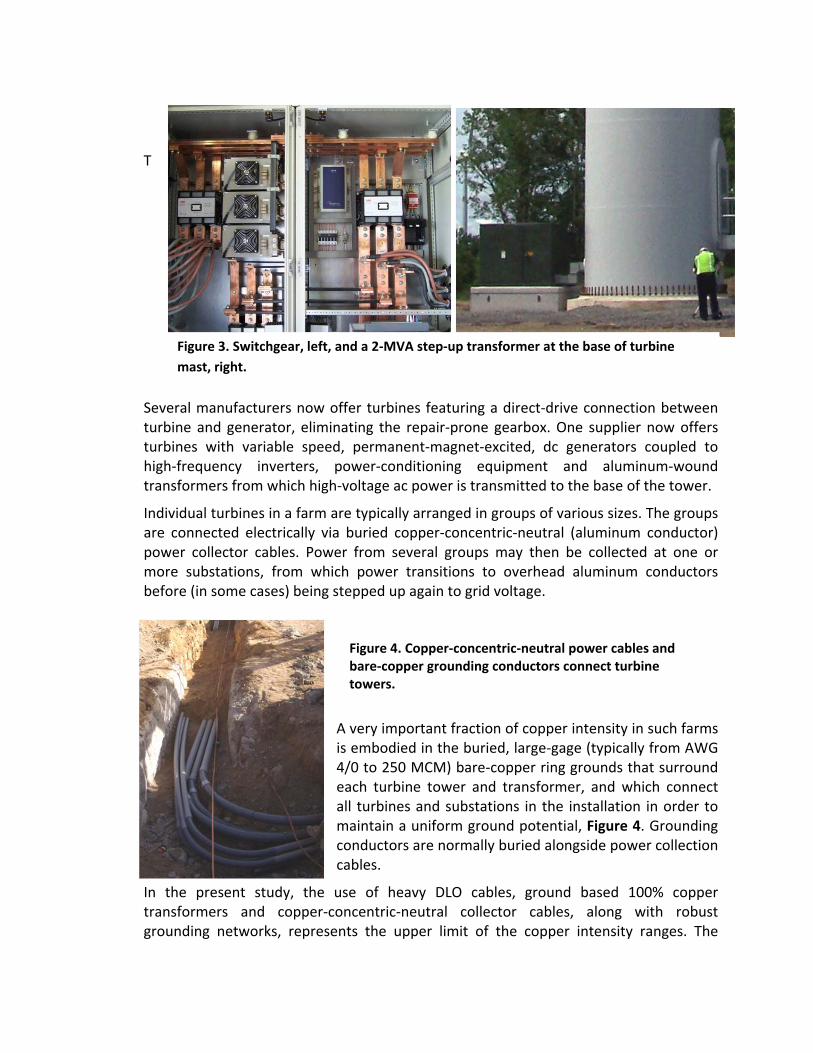
Individual turbines in a farm are typically arranged in groups of various sizes. The groups are connected electrically via buried copper‐concentric‐neutral (aluminum conductor) power collector cables. Power from several groups may then be collected at one or more substations, from which power transitions to overhead aluminum conductors before (in some cases) being stepped up again to grid voltage.
A very important fraction of copper intensity in such farms is embodied in the buried, large‐gage (typically from AWG 4/0 to 250 MCM) bare‐copper ring grounds that surround each turbine tower and transformer, and which connect all turbines and substations in the installation in order to maintain a uniform ground potential, Figure 4. Grounding conductors are normally buried alongside power collection cables.
In the present study, the use of heavy DLO cables, ground based 100% copper transformers and copper‐concentric‐neutral collector cables, along with robust grounding networks, represents the upper limit of the copper intensity ranges. The
Figure 3. Switchgear, left, and a 2‐MVA step‐up transformer at the base of turbine
mast, right.
Figure 4. Copper‐concentric‐neutral power cables and bare‐copper grounding conductors connect turbine towers.
lighter, all‐aluminum step‐up transformers mounted in nacelles along with lighter‐gage, high‐voltage down‐conductors constitute the lower end of the intensity range. There are many variations. In one alternative design, the step‐up transformer is located approximately half‐way up the mast, with DLO cables above and HV cables below. In another variation, the step‐up transformer utilizes copper magnet wire on the primary windings and aluminum on the high‐voltage secondary.
Copper intensity in onshore wind farms is strongly related to the physical size of the installation due to the miles of copper grounding cable and copper‐concentric‐neutral aluminum‐conductor power cable installed over large distances. Other important contributors to copper intensity include magnet wire for generators and transformers, DLO cables, control and communication cables, and busbar for switchgear.
Offshore Wind Energy: Copper’s Largest Future Opportunity. There are currently no offshore wind installations in U.S. waters; however, offshore wind is seen by many as an inevitable and important next step in U.S. RE development. Offshore winds are stronger and more uniform than those on land, with large areas offering Class 5 or 6 velocities, the ideal strength ranges. Unlike on‐shore regions, peak winds offshore often correspond with peak load periods, a very important advantage. Offshore farms can also be located close to major industrial and residential load centers, as along the Atlantic coast.
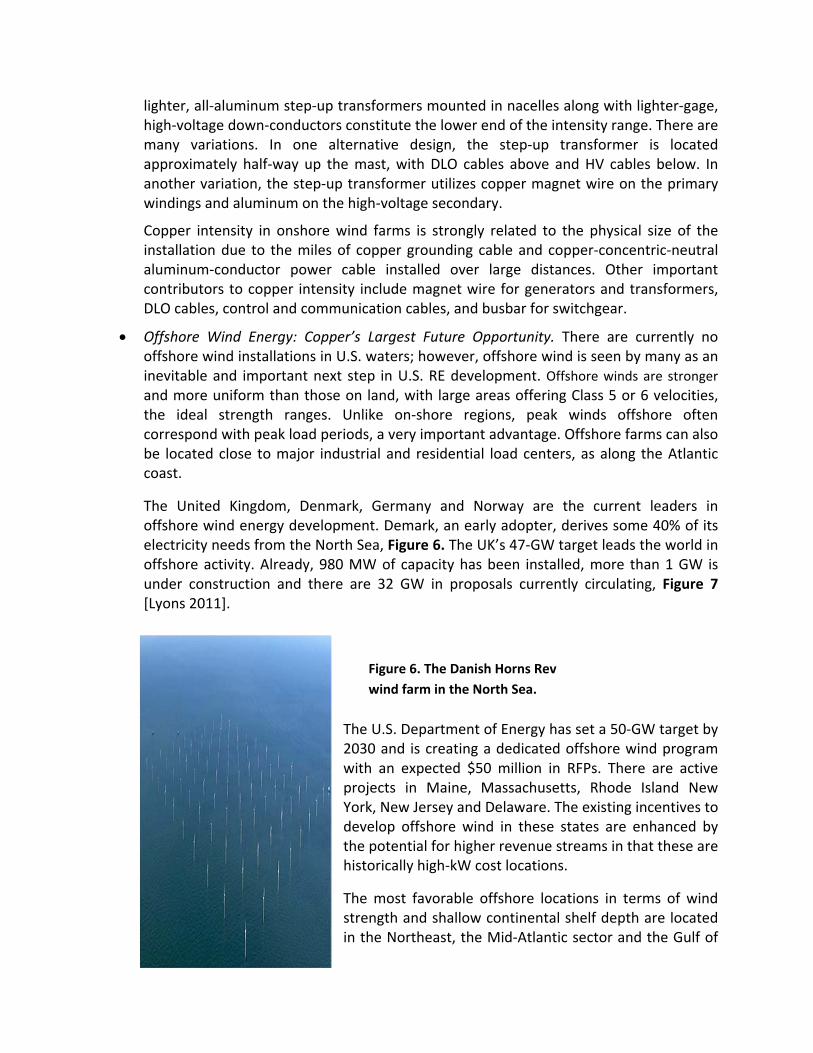
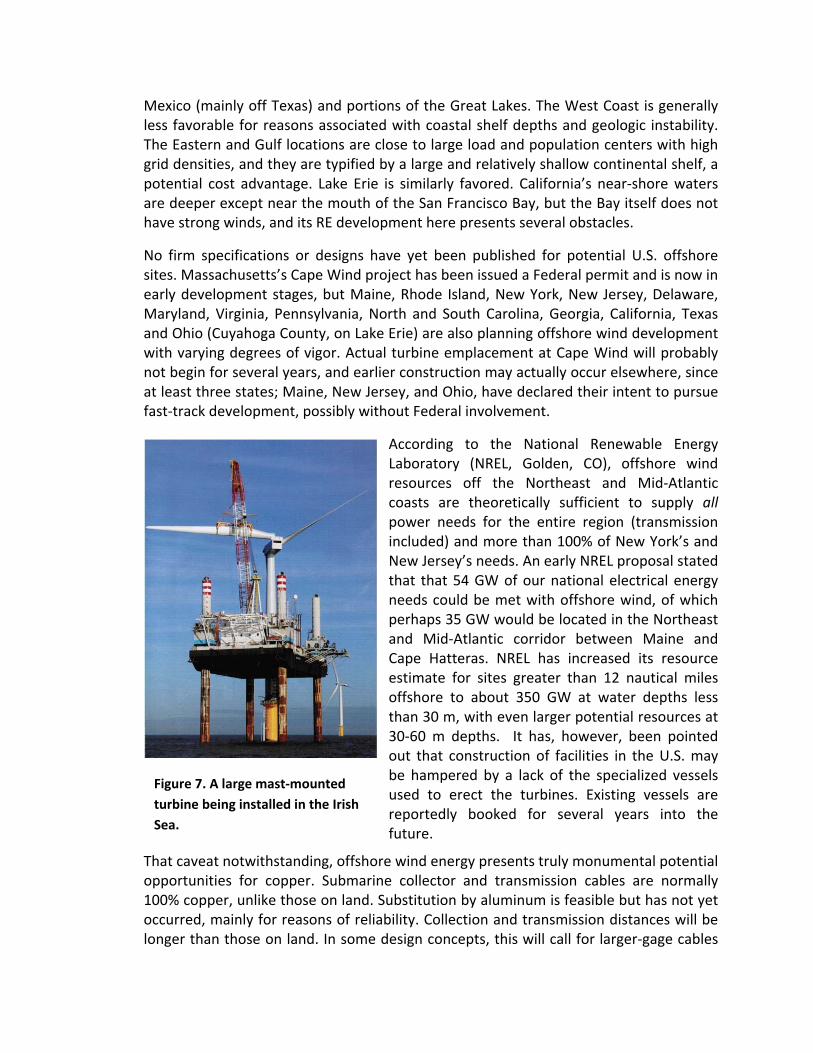
The United Kingdom, Denmark, Germany and Norway are the current leaders in offshore wind energy development. Demark, an early adopter, derives some 40% of its electricity needs from the North Sea, Figure 6. The UK’s 47‐GW target leads the world in offshore activity. Already, 980 MW of capacity has been installed, more than 1 GW is under construction and there are 32 GW in proposals currently circulating, Figure 7 [Lyons 2011].
The U.S. Department of Energy has set a 50‐GW target by 2030 and is creating a dedicated offshore wind program with an expected $50 million in RFPs. There are active projects in Maine, Massachusetts, Rhode Island New York, New Jersey and Delaware. The existing incentives to develop offshore wind in these states are enhanced by the potential for higher revenue streams in that these are historically high‐kW cost locations.
The most favorable offshore locations in terms of wind strength and shallow continental shelf depth are located in the Northeast, the Mid‐Atlantic sector and the Gulf of
Figure 6. The Danish Horns Rev
wind farm in the North Sea.
Mexico (mainly off Texas) and portions of the Great Lakes. The West Coast is generally less favorable for reasons associated with coastal shelf depths and geologic instability. The Eastern and Gulf locations are close to large load and population centers with high grid densities, and they are typified by a large and relatively shallow continental shelf, a potential cost advantage. Lake Erie is similarly favored. California’s near‐shore waters are deeper except near the mouth of the San Francisco Bay, but the Bay itself does not have strong winds, and its RE development here presents several obstacles.
No firm specifications or designs have yet been published for potential U.S. offshore sites. Massachusetts’s Cape Wind project has been issued a Federal permit and is now in early development stages, but Maine, Rhode Island, New York, New Jersey, Delaware, Maryland, Virginia, Pennsylvania, North and South Carolina, Georgia, California, Texas and Ohio (Cuyahoga County, on Lake Erie) are also planning offshore wind development with varying degrees of vigor. Actual turbine emplacement at Cape Wind will probably not begin for several years, and earlier construction may actually occur elsewhere, since at least three states; Maine, New Jersey, and Ohio, have declared their intent to pursue fast‐track development, possibly without Federal involvement.
According to the National Renewable Energy Laboratory (NREL, Golden, CO), offshore wind resources off the Northeast and Mid‐Atlantic coasts are theoretically sufficient to supply all power needs for the entire region (transmission included) and more than 100% of New York’s and New Jersey’s needs. An early NREL proposal stated that that 54 GW of our national electrical energy needs could be met with offshore wind, of which perhaps 35 GW would be located in the Northeast and Mid‐Atlantic corridor between Maine and Cape Hatteras. NREL has increased its resource estimate for sites greater than 12 nautical miles offshore to about 350 GW at water depths less than 30 m, with even larger potential resources at 30‐60 m depths. It has, however, been pointed out that construction of facilities in the U.S. may be hampered by a lack of the specialized vessels used to erect the turbines. Existing vessels are reportedly booked for several years into the future.
That caveat notwithstanding, offshore wind energy presents truly monumental potential opportunities for copper. Submarine collector and transmission cables are normally 100% copper, unlike those on land. Substitution by aluminum is feasible but has not yet occurred, mainly for reasons of reliability. Collection and transmission distances will be longer than those on land. In some design concepts, this will call for larger‐gage cables
Figure 7. A large mast‐mounted
turbine being installed in the Irish
Sea.
than those used on land. Offsetting that positive is the lack of a need for grounding cables. Direct‐current transmission would reduce the number of conductors needed to two.
According to a study reported at the 2011 American Wind Energy Association conference, industry leaders appear to prefer initial development at about eight miles from shore, a balance between shelf depth, transmission cost and acceptable visual pollution (25 miles hides turbines below the horizon but raises costs prohibitively). One supplier proposes that collection between and among turbines will likely involve medium‐voltage, three‐phase ac power, which would be collected at a central substation where large inverters would convert it to high‐voltage dc for transmission to shore. According to that supplier, 10 km (6 miles) is the probable breakeven distance beyond which dc transmission is favored. Maintenance and repair costs are expected to be significantly higher for offshore turbines and rest‐of‐plant equipment, and the consequent need for high reliability would favor copper. These are significant possibilities for future copper promotion.
Based on recent experience at British offshore wind farms [Falconer, 2009], copper intensity may be as high as 22,000 lbs/MW. Assuming that forecasts by NREL are borne out, the Mid‐Atlantic corridor alone would there represent a copper market of approximately 814 million pounds. Realization of that market will take several decades.
Photovoltaic Solar Energy: Still Small but Coming On Strong
The U.S. photovoltaic (PV) solar industry is tiny compared with onshore wind, totaling approximately 2.6 GW of installed capacity as of early 2010. That figure that has more than doubled since 2008 according to the Solar Energy Industry Association.
Moreover, the industry’s residential and commercial sectors each posted 60%‐to‐70% CAGRs in 2010, and its utility‐scale sector quadrupled in size in 2010 as installations ranging in size from one megawatt to more than 200 MW went on line. Utility‐scale plants are projected to surpass the other two sectors in operational capacity this year. According to the latest EIA projection, solar facilities are expected to add 4,087 MW of capacity by 2014, but that figure appears to be conservative in light of recent growth rates.
Early PV plants initially gained a perception as high‐initial‐cost, high‐delivered cost resources, mainly due to the once exorbitant cost of silicon cells. However, order‐of‐magnitude reductions in cell‐grade silicon and in module costs (with more to come), combined with dramatic improvements in cell efficiencies. are now making PV solar much more attractive. For example, a large California‐based silicon solar‐cell manufacturer cites a 2010 module production cost of $2.10/watt. (To put that in perspective, residential systems currently cost between $5.00/W and $7.00/W installed counting utility incentives and tax credits. Non‐residential systems currently cost <$5.00/w installed.) The manufacturer expects to reduce his manufactured module cost to less than $1.00/W in two years (2013) and to as low as $0.50/W by 2017. PV cell efficiency (measured as Watts of dc electrical power produced per Watt of solar input)
has increased from less than 10% five years ago to 23% in production modules today. So‐called “concentrated” PV solar systems that utilize mirrors or lenses can nearly double that level of output. The benefits to consumers are lower capital outlay and a more rapid return on investment. Industry sources expect grid parity to be achieved by 2015.
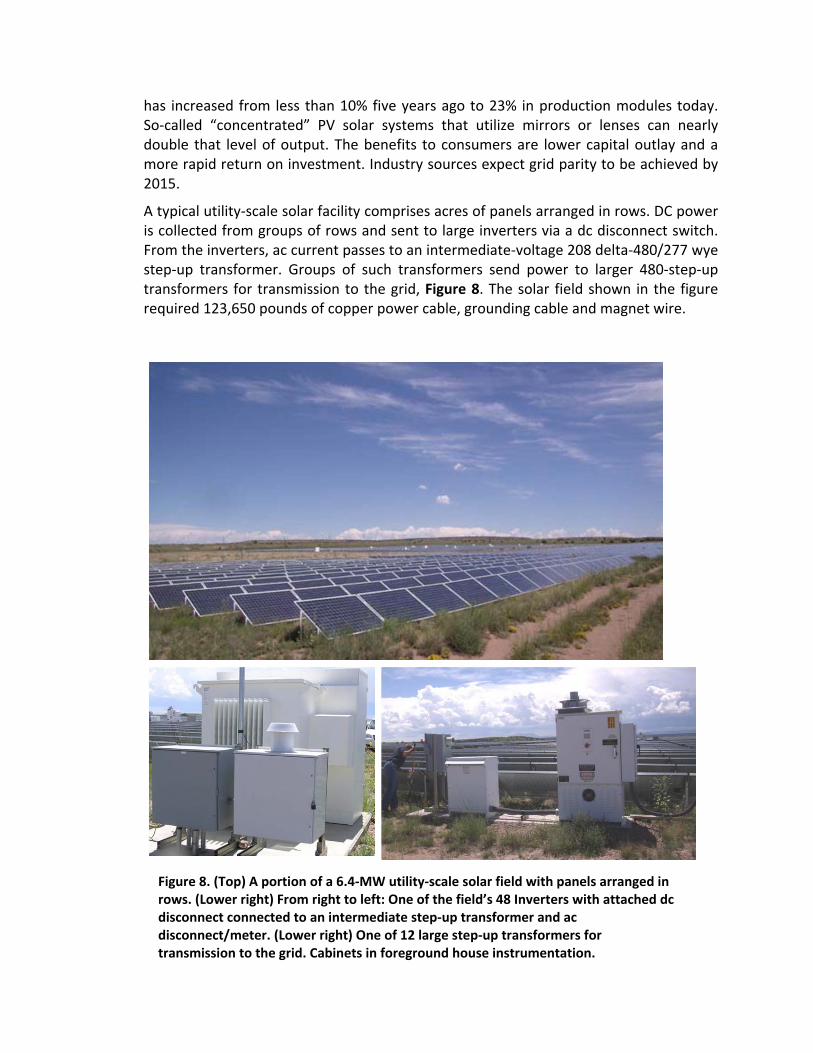
A typical utility‐scale solar facility comprises acres of panels arranged in rows. DC power is collected from groups of rows and sent to large inverters via a dc disconnect switch. From the inverters, ac current passes to an intermediate‐voltage 208 delta‐480/277 wye step‐up transformer. Groups of such transformers send power to larger 480‐step‐up transformers for transmission to the grid, Figure 8. The solar field shown in the figure required 123,650 pounds of copper power cable, grounding cable and magnet wire.
Figure 8. (Top) A portion of a 6.4‐MW utility‐scale solar field with panels arranged in rows. (Lower right) From right to left: One of the field’s 48 Inverters with attached dc disconnect connected to an intermediate step‐up transformer and ac disconnect/meter. (Lower right) One of 12 large step‐up transformers for transmission to the grid. Cabinets in foreground house instrumentation.
The installation shown in Figure 8 was built in stages between 2004 and 2011 and incorporates a massive buried bare‐copper grounding grid to avoid lightning damage. Such grids are emplaced in other, but not all, utility‐scale solar fields.
Residential PV solar installations have become popular, thanks to utility incentives and Federal and State tax rebates. Individual systems are generally smaller than five kilowatts, but their aggregate number is very large, especially in California (22% penetration) and New Jersey (14% penetration). Nationwide, 11% of homes now sport PV solar installations [Gensler, 2011.]
Residential system designs are analogous to utility‐scale fields, with panels connected to one or more inverters through a dc disconnect. Inverters typically incorporate a small transformer, from which ac power is sent to the service entrance and a two‐way meter, from which it is fed to the residence or the grid as determined by need. Copper intensity in residential systems is readily scalable, since most copper is used to string together the required number of panels, and, in best‐practice designs, to ground them. Distances to inverter/transformers, switchgear and the service entrance do not vary much. Hence a four‐kW system will contain approximately twice the copper as a two‐kW installation.
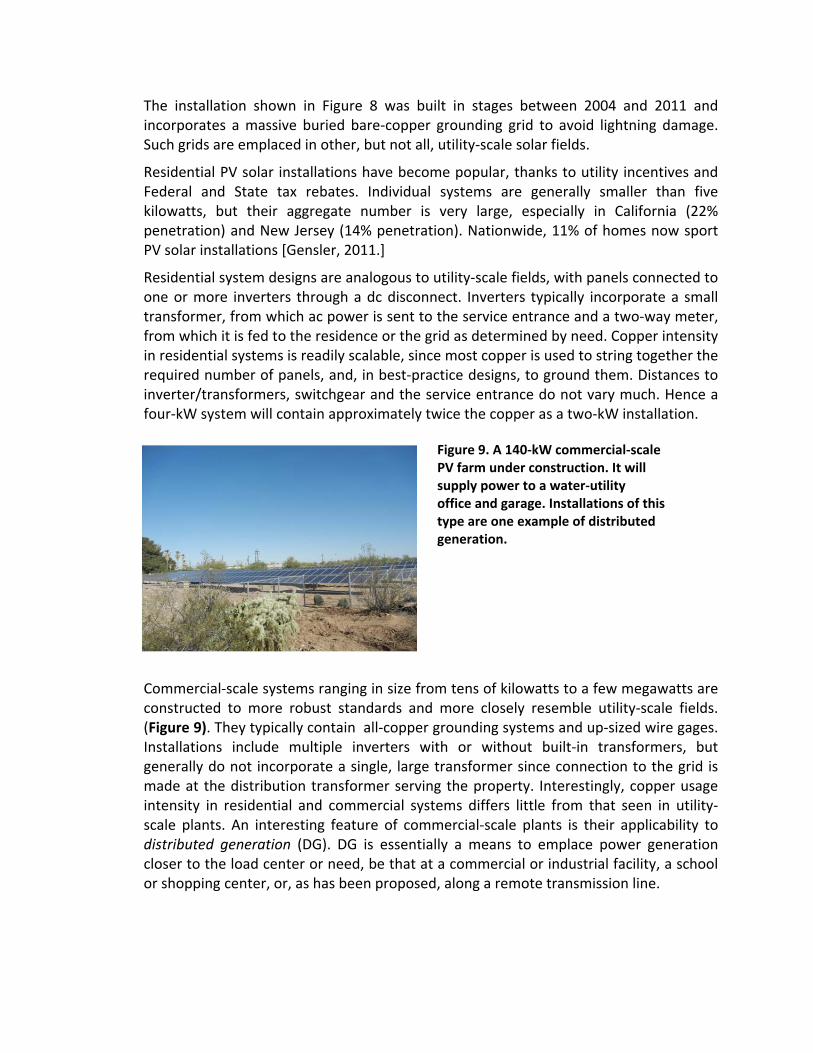
Commercial‐scale systems ranging in size from tens of kilowatts to a few megawatts are constructed to more robust standards and more closely resemble utility‐scale fields. (Figure 9). They typically contain all‐copper grounding systems and up‐sized wire gages. Installations include multiple inverters with or without built‐in transformers, but generally do not incorporate a single, large transformer since connection to the grid is made at the distribution transformer serving the property. Interestingly, copper usage intensity in residential and commercial systems differs little from that seen in utility‐scale plants. An interesting feature of commercial‐scale plants is their applicability to distributed generation (DG). DG is essentially a means to emplace power generation closer to the load center or need, be that at a commercial or industrial facility, a school or shopping center, or, as has been proposed, along a remote transmission line.
Figure 9. A 140‐kW commercial‐scale PV farm under construction. It will supply power to a water‐utility office and garage. Installations of this type are one example of distributed generation.
Substitution is an issue in low‐end residential installs. Interviews with designer‐installers revealed that high‐quality residential installations normally contain separate copper grounding conductors even though such conductors are not required by Code. As with the use of metal conduit for grounding in commercial electrical installations, PV installers are permitted to use the aluminum frames upon which solar panels rest as the ground‐return path. The practice is seen as being less reliable than using a separate copper “green wire” by higher‐quality installers, but it is Code‐acceptable. However, installers see applicable codes as being a work in progress, with much leeway being left to the inspector and plan checker. This situation presents an opportunity for promotion by CDA through its presence on code‐writing panels and its educational services to electrical‐inspector associations.
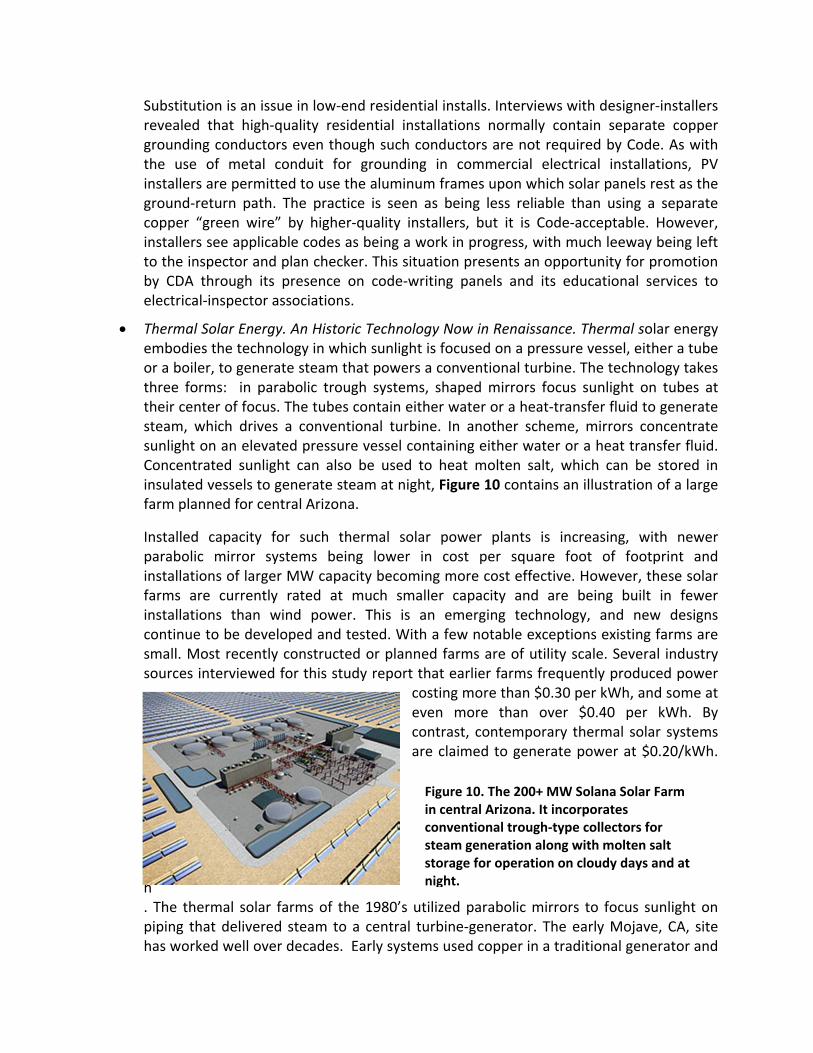
Thermal Solar Energy. An Historic Technology Now in Renaissance. Thermal solar energy embodies the technology in which sunlight is focused on a pressure vessel, either a tube or a boiler, to generate steam that powers a conventional turbine. The technology takes three forms: in parabolic trough systems, shaped mirrors focus sunlight on tubes at their center of focus. The tubes contain either water or a heat‐transfer fluid to generate steam, which drives a conventional turbine. In another scheme, mirrors concentrate sunlight on an elevated pressure vessel containing either water or a heat transfer fluid. Concentrated sunlight can also be used to heat molten salt, which can be stored in insulated vessels to generate steam at night, Figure 10 contains an illustration of a large farm planned for central Arizona.
Installed capacity for such thermal solar power plants is increasing, with newer parabolic mirror systems being lower in cost per square foot of footprint and installations of larger MW capacity becoming more cost effective. However, these solar farms are currently rated at much smaller capacity and are being built in fewer installations than wind power. This is an emerging technology, and new designs continue to be developed and tested. With a few notable exceptions existing farms are small. Most recently constructed or planned farms are of utility scale. Several industry sources interviewed for this study report that earlier farms frequently produced power
costing more than $0.30 per kWh, and some at even more than over $0.40 per kWh. By contrast, contemporary thermal solar systems are claimed to generate power at $0.20/kWh.
per kWh. The thermal solar farms of the 1980’s utilized parabolic mirrors to focus sunlight on piping that delivered steam to a central turbine‐generator. The early Mojave, CA, site has worked well over decades. Early systems used copper in a traditional generator and
Figure 10. The 200+ MW Solana Solar Farm in central Arizona. It incorporates conventional trough‐type collectors for steam generation along with molten salt storage for operation on cloudy days and at night.
transformer, along with conventional grounding systems. They were not particularly copper‐intensive compared with fossil‐fueled steam plants.
Many of the latest thermal solar farms use mirrors that supply heated fluid in the same manner as older fixed‐mirror plants, and the electrical and control systems needed for the tracking drive motors require copper grounding systems. Other variations of thermal solar use innovative “concentrating solar power “ (CSP) schemes, with or without tracking, to the same effect. Tracking is reported to provide 25% to 30% additional sun power into the heat‐transfer tubes; however, it adds moving components that require maintenance, and several solar designers/operators indicate that they prefer the fixed design for long‐life‐in‐service and a better ability to cope with Southwestern U.S. desert conditions, where sand and wind may create dusty conditions. Tracking and CSP are also used in some PV solar plants.
Discussions with solar‐intensive utilities reveal that the industry is motivated to promote “distributed” generation, such as at residences and commercial buildings, because it reduces the need to install additional ― and expensive ― capacity, while at the same time helping meet state‐mandated RE portfolio requirements. CDA should consider promoting distributed generation in both PV and thermal‐solar forms. The technologies are copper‐intensive, and promotion efforts can be directed at developers and consumers, much as it is in CDA’s long‐standing building wire campaigns. One solar developer/installer interviewed for this study foresaw the day when rooftop solar would become a part of the “house package”, much as appliances and central air‐conditioning are today. That would be a worthwhile objective for CDA’s work.
Geothermal Energy. Development of new geothermal energy is, like hydroelectric power, limited by the availability of suitable geologic sites in the U.S. California’s Geysers and Imperial Valley are in the process of being developed as major sites. Hawai’i is also prominent among states with geothermal plants. The Yosemite Park region technically offers significant potential but its national park status prevents it from even being considered.
Geothermal installations are classified by their operating temperature, i.e., plants operating above 600 F and those operating at approximately 400 F. The 600‐F sources are strongly preferred by developers because they can generate steam directly. They utilize copper in traditional turbine‐generators, step‐up transformers and grounding system, just as in fossil‐fired plants. Many “hot” sites exist in California and adjacent states. Nicaragua and other countries and around the Globe have geothermal generation plants, and these facilities are currently being further developed. The low‐ temperature sites are interesting to copper because they include a pumping system at the source, which adds to copper usage for motors and grounding; however, the motor is parasitic to the plant’s output and revenue, which is perhaps why only one such site was found to be in development in the course of this study. Since the number of U.S. geothermal plants is relatively small and since their copper intensity is not remarkable,
they will likely not contribute significantly to copper consumption in the U.S. The situation may be more favorable in other countries.
Copper Intensity Data
Data on copper intensities were obtained by interviews with developers, designer‐installers owners, and by visits to selected installations. Wind and PV solar sites include those visited for previous market‐ and case‐studies, and several of the latter were seen for the first time in the current project. Data regarding offshore wind were obtained from technical literature, principally as related to offshore development in the UK. Other data were taken from information published for the Cape Wind site in Massachusetts and proposed development off Cape May in New Jersey. As stated earlier, geothermal energy was judged to be too small and too similar to conventional power generation in its copper use to have a marked effect on copper consumption.
Onshore Wind
Table 1 contains data on four operational and one design‐stage U.S. wind farms. It can be seen that copper intensity ranges from 5,600 to 14,900 lbs/MW. The surprisingly large spread is attributable to the difference between copper‐ and aluminum‐wound step‐up transformers, furnished in turbines supplied by Vestas and Gamesa.
The wind farms listed in the table were seen as being representative, containing the newer wind turbine sizes now entering the market, and for the fact that they contain design alternatives that affect copper intensity. Current wind turbine sizes include 2.0 MW, 2.1 MW, 3.0 MW and 3.6 MW. A 5‐MW will reportedly be commercially available in 2013, and 7‐MW and 10‐MW models are currently in the design and testing stages of development. The 2005 CDA Wind Farm Market Study included turbines up to 1.8 MW in size, and smaller units at 1.5 MW and 1.65 MW. Today’s larger turbines utilize copper more efficiently. The latest tower designs reportedly vary in their efficiency of copper usage. Interviews with suppliers and developers indicate that some onshore wind turbines incorporate aluminum selectively, especially in the cast‐coil transformer in the nacelle, which, as noted earlier, reduces copper intensity significantly. In addition, some manufacturers are now considering flexible aluminum cable to transmit power from the nacelle to the tower base. However, these manufacturers uniformly indicate the cabling is and will continue to be all‐copper for offshore installations to avoid salt‐water corrosion. That having been said, however, Vestas plans to use cast‐coil aluminum transformer mounted in the nacelle of its offshore turbines, since, as they said, only copper is exposed outside the transformer because the aluminum‐to‐copper transition is made within the cast volume surrounding the windings.
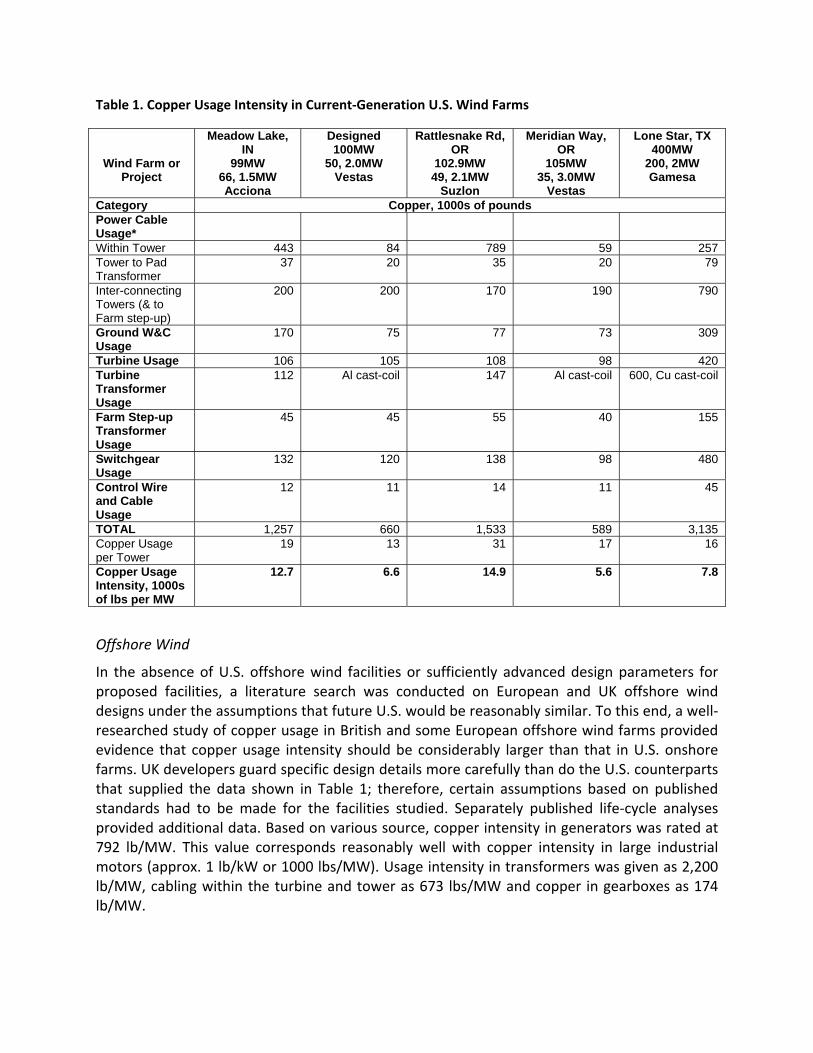
Table 1. Copper Usage Intensity in Current‐Generation U.S. Wind Farms
Offshore Wind
In the absence of U.S. offshore wind facilities or sufficiently advanced design parameters for proposed facilities, a literature search was conducted on European and UK offshore wind designs under the assumptions that future U.S. would be reasonably similar. To this end, a well‐researched study of copper usage in British and some European offshore wind farms provided evidence that copper usage intensity should be considerably larger than that in U.S. onshore farms. UK developers guard specific design details more carefully than do the U.S. counterparts that supplied the data shown in Table 1; therefore, certain assumptions based on published standards had to be made for the facilities studied. Separately published life‐cycle analyses provided additional data. Based on various source, copper intensity in generators was rated at 792 lb/MW. This value corresponds reasonably well with copper intensity in large industrial motors (approx. 1 lb/kW or 1000 lbs/MW). Usage intensity in transformers was given as 2,200 lb/MW, cabling within the turbine and tower as 673 lbs/MW and copper in gearboxes as 174 lb/MW.
Wind Farm or Project
Meadow Lake, IN
99MW 66, 1.5MW Acciona
Designed100MW
50, 2.0MW Vestas
Rattlesnake Rd, OR
102.9MW 49, 2.1MW
Suzlon
Meridian Way, OR
105MW 35, 3.0MW
Vestas
Lone Star, TX400MW
200, 2MW Gamesa
Category Copper, 1000s of pounds Power Cable Usage*
Within Tower 443 84 789 59 257 Tower to Pad Transformer
37 20 35 20 79
Inter-connecting Towers (& to Farm step-up)
200 200 170 190 790
Ground W&C Usage
170 75 77 73 309
Turbine Usage 106 105 108 98 420 Turbine Transformer Usage
112 Al cast-coil 147 Al cast-coil 600, Cu cast-coil
Farm Step-up Transformer Usage
45 45 55 40 155
Switchgear Usage
132 120 138 98 480
Control Wire and Cable Usage
12 11 14 11 45
TOTAL 1,257 660 1,533 589 3,135 Copper Usage per Tower
19 13 31 17 16
Copper Usage Intensity, 1000s of lbs per MW
12.7 6.6 14.9 5.6 7.8
It was reported that, on average, offshore wind farms require 21,076 lbs/MW installed, an intensity that exceeds the largest value reported in Table 1 by more than 41%. Of the total copper reported for UK offshore turbines, 3,850 lbs are contained in the turbine generator and its transformer and 13,310 lbs in the cabling between the turbine and the substation. All farm step‐up transformers included in the report were 100% copper wound, as they were large MVA units (manufacturers indicate that transformers above approximately 20 MVA are all‐copper); however, the smaller step‐up transformers utilized with each wind tower, for example, utilized aluminum in some coils on some farms (usually with low or no efficiency specification) while other farms specified higher efficiencies and/or all‐copper transformers, including those not studied but included for projections.
Estimates of copper used to connect to the onshore grid were based on several lifecycle analyses conducted on European offshore farms. The grid interconnection was found to consume, on average, 25,168 lbs per turbine or 7,766 lbs/MW of nameplate rating. Cabling was found to account for 82% of total copper usage in offshore wind farms or 16,346 lbs/MW. Interestingly, the author concluded that (given the average 2008 price for copper) that metal cost constituted only 3.4% of the total installed cost. This compares favorably with an informal estimate of 3.8% made for this study based on onshore wind farms and PV solar fields in the U.S.
Final permits and design details have reportedly just been issued for Cape Wind. They will be included in the final draft of this report. The facility will include 120 3.6‐MW Siemens wind towers, having 100% copper‐wound transformers in the tower base. There will be a total of eight miles of buried ac submarine collector cable from a central step‐up transformer platform, and an estimated 20 miles connecting towers to this step‐up transformer, plus an additional two miles of cable onshore to connect to the grid. Industry sources indicate that copper intensities are expected to be similar to the current European and UK experience, upon which the data cited above were based.
Photovoltaic Solar Facilities
PV solar facilities are size‐classified as residential, commercial or utility‐scale. Examples of all three sizes were analyzed in the present study. Data presented was complete as of this draft, but additional data is forthcoming. The data represent as‐built copper contents and intensities. However, in order to provide a better view of the range of intensities deriving from design variations, emplacement peculiarities and possible substitution by aluminum in various installation components, and by elimination of copper grounding conductors in some cases, intensities were further calculated based on such hypothetical design changes.
The data show that copper intensities for PV solar RE installations fall in the same range as those for onshore wind farms. Intensity ranges for the three installation classes are also relatively similar. Lowest intensity, 5,400 lb/MW, was calculated for a commercial installation in which it was assumed that the solar field was located directly adjacent to the service entrance. It was actually some 600 ft distant from the service and was connected with 3‐phase, 250‐MCM power cable, yielding a much higher intensity. Maximum intensity, 15,432 lbs/MW, were found in a utility‐scale installation (as built) containing a massive buried copper grounding grid and predominantly all‐copper inverters. Assumed substitution of aluminum in those inverters,
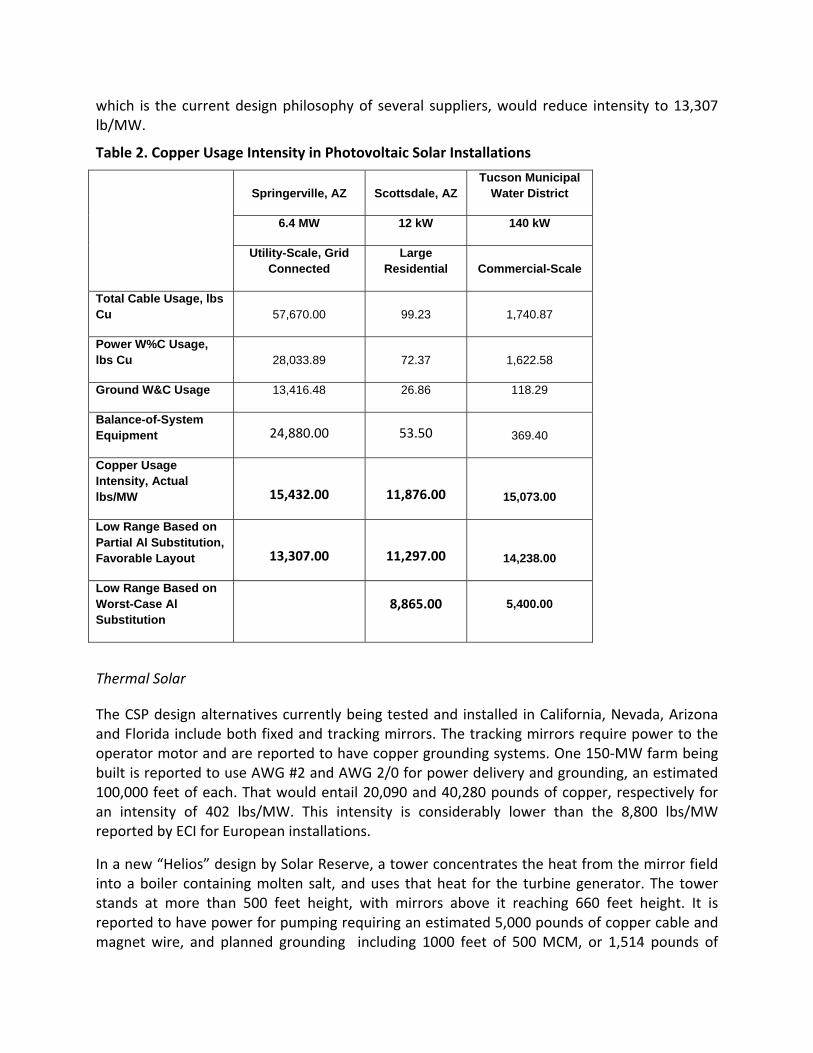
which is the current design philosophy of several suppliers, would reduce intensity to 13,307 lb/MW.
Table 2. Copper Usage Intensity in Photovoltaic Solar Installations
Springerville, AZ Scottsdale, AZ Tucson Municipal
Water District
6.4 MW 12 kW 140 kW
Utility-Scale, Grid Connected
Large Residential Commercial-Scale
Total Cable Usage, lbs Cu 57,670.00 99.23 1,740.87
Power W%C Usage, lbs Cu 28,033.89 72.37 1,622.58
Ground W&C Usage 13,416.48 26.86 118.29
Balance-of-System Equipment 24,880.00 53.50 369.40
Copper Usage Intensity, Actual lbs/MW 15,432.00 11,876.00 15,073.00
Low Range Based on Partial Al Substitution, Favorable Layout 13,307.00 11,297.00 14,238.00
Low Range Based on Worst-Case Al Substitution
8,865.00 5,400.00
Thermal Solar
The CSP design alternatives currently being tested and installed in California, Nevada, Arizona and Florida include both fixed and tracking mirrors. The tracking mirrors require power to the operator motor and are reported to have copper grounding systems. One 150‐MW farm being built is reported to use AWG #2 and AWG 2/0 for power delivery and grounding, an estimated 100,000 feet of each. That would entail 20,090 and 40,280 pounds of copper, respectively for an intensity of 402 lbs/MW. This intensity is considerably lower than the 8,800 lbs/MW reported by ECI for European installations.
In a new “Helios” design by Solar Reserve, a tower concentrates the heat from the mirror field into a boiler containing molten salt, and uses that heat for the turbine generator. The tower stands at more than 500 feet height, with mirrors above it reaching 660 feet height. It is reported to have power for pumping requiring an estimated 5,000 pounds of copper cable and magnet wire, and planned grounding including 1000 feet of 500 MCM, or 1,514 pounds of
copper. This design appears to use approximately 43 lb/MW and the additional 402 lb/MW for tracking. In addition, grounding conductors to tie all the farm elements to a common potential is not consistently planned, according to respondents to inquiries at this time. It would call for(or should have) an additional 40,000‐ft run of AWG 4/0, or 64,050 pounds of copper constituting 427 lb/MW. The grounding system needed to tie all farm elements to a common ground potential does not yet appear to be of a standard design in thermal solar farms, and this situation provides an opportunity for new CDA’s technical market promotion. In the future, thermal solar farms may more closely resemble large wind farms, in which robust appears to becoming an accepted design practice.
Assuming the installation of motor‐driven tracking features and suitably robust grounding systems, copper usage intensity in these systems would be 872 lb/MW in the farm, excluding the turbine generator and transformer. Thermal solar installations appear to have lower copper usage intensities than on‐ or offshore wind or PV solar installations documented to date. However, solar thermal is being actively pursued, and large, new installations are planned or in construction. Significant copper usage will develop, particularly if influenced by the promotion of reliable and life‐cycle economic designs encompassing robust electrical power and grounding systems.
State RE Programs
As of June 2011, 29 states had officially established or were developing RE standards (also called Renewable Portfolio Standards) among a total of 38 states that have at least set RE goals. These roadmaps spell out the amount or percentage of the states’ total electrical energy consumption that will derive from renewables of all sorts by a future data chosen by the individual states. Participation is not mandatory. Of the states that have signed on to standards to date, the range of RE penetration ranges from 10% (North Dakota, South Dakota, Wisconsin) to a high of 40% (Hawai’i, Maine). Most range between 20% and 25%. There is no stipulation as to the types or mix of RE selected. Midwestern states will likely favor wind, Southwestern, California and Hawai’i will add solar and geothermal, and so on. Table 3 lists some of the more active states and the extent of their programs, while Figure 11 illustrates the distribution of state programs graphically.
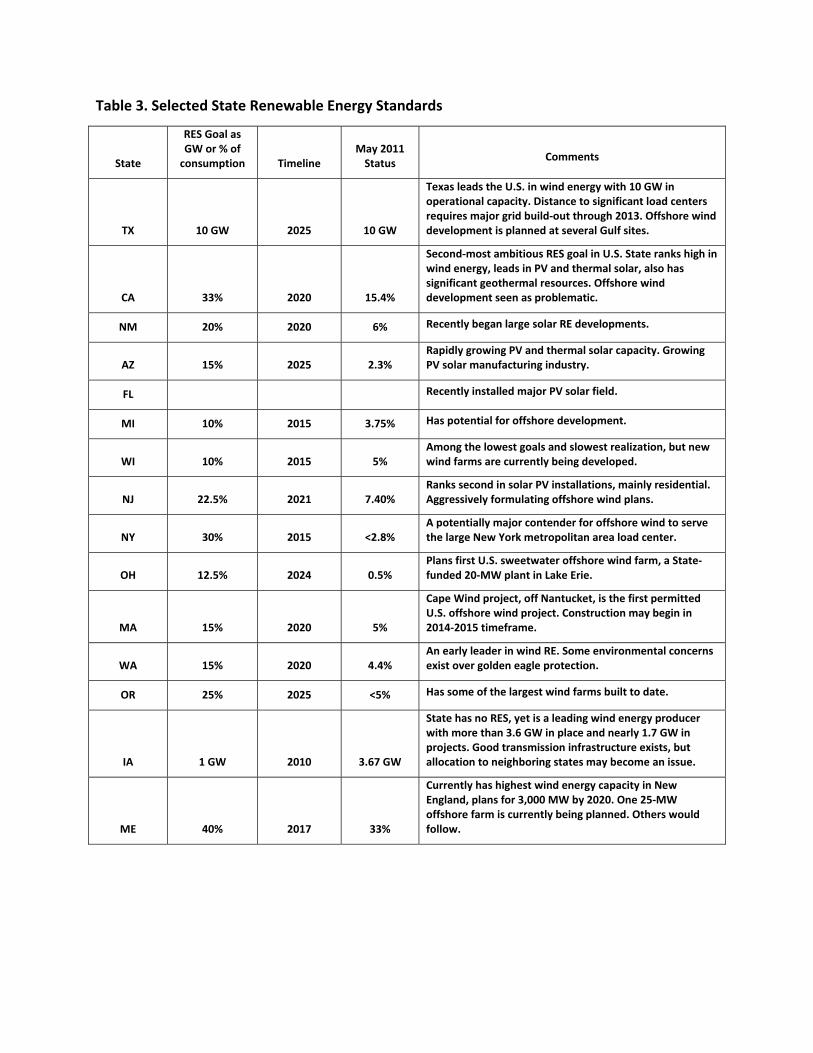
Table 3. Selected State Renewable Energy Standards
State
RES Goal as GW or % of consumption Timeline
May 2011 Status
Comments
TX 10 GW 2025 10 GW
Texas leads the U.S. in wind energy with 10 GW in operational capacity. Distance to significant load centers requires major grid build‐out through 2013. Offshore wind development is planned at several Gulf sites.
CA 33% 2020 15.4%
Second‐most ambitious RES goal in U.S. State ranks high in wind energy, leads in PV and thermal solar, also has significant geothermal resources. Offshore wind development seen as problematic.
NM 20% 2020 6% Recently began large solar RE developments.
AZ 15% 2025 2.3% Rapidly growing PV and thermal solar capacity. Growing PV solar manufacturing industry.
FL Recently installed major PV solar field.
MI 10% 2015 3.75% Has potential for offshore development.
WI 10% 2015 5% Among the lowest goals and slowest realization, but new wind farms are currently being developed.
NJ 22.5% 2021 7.40% Ranks second in solar PV installations, mainly residential. Aggressively formulating offshore wind plans.
NY 30% 2015 <2.8% A potentially major contender for offshore wind to serve the large New York metropolitan area load center.
OH 12.5% 2024 0.5% Plans first U.S. sweetwater offshore wind farm, a State‐funded 20‐MW plant in Lake Erie.
MA 15% 2020 5%
Cape Wind project, off Nantucket, is the first permitted U.S. offshore wind project. Construction may begin in 2014‐2015 timeframe.
WA 15% 2020 4.4% An early leader in wind RE. Some environmental concerns exist over golden eagle protection.
OR 25% 2025 <5% Has some of the largest wind farms built to date.
IA 1 GW 2010 3.67 GW
State has no RES, yet is a leading wind energy producer with more than 3.6 GW in place and nearly 1.7 GW in projects. Good transmission infrastructure exists, but allocation to neighboring states may become an issue.
ME 40% 2017 33%
Currently has highest wind energy capacity in New England, plans for 3,000 MW by 2020. One 25‐MW offshore farm is currently being planned. Others would follow.
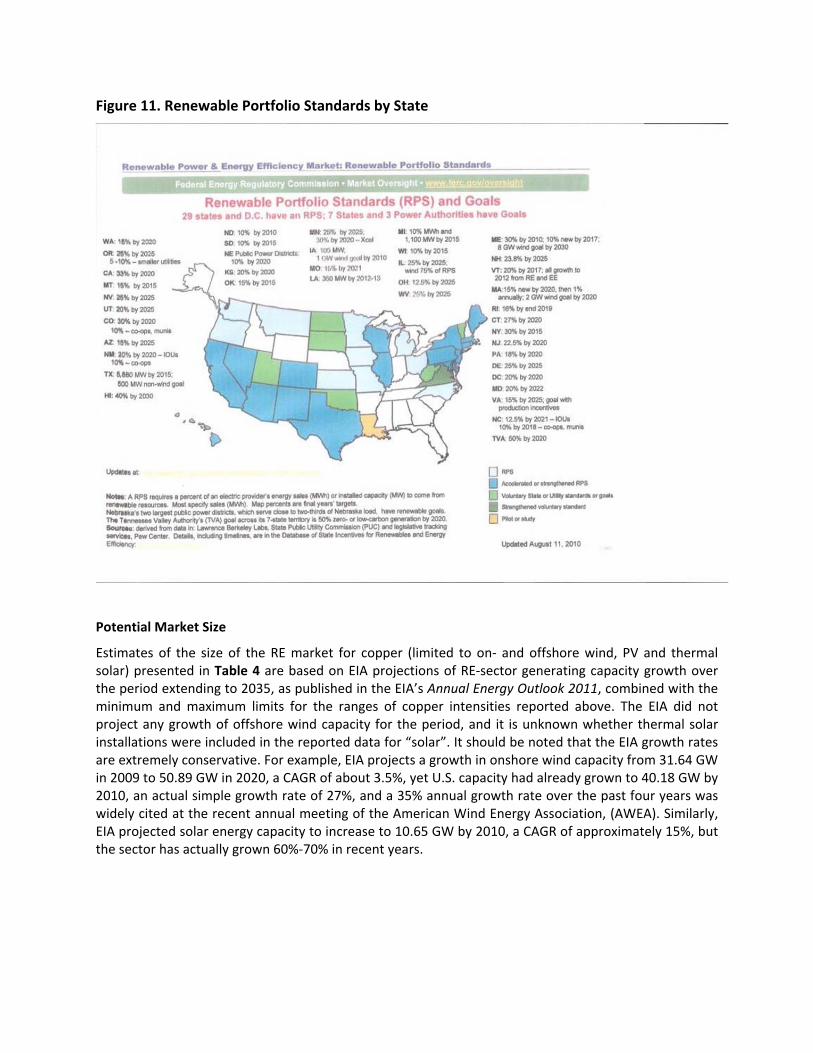
Figure 11. Renewable Portfolio Standards by State
Potential Market Size
Estimates of the size of the RE market for copper (limited to on‐ and offshore wind, PV and thermal solar) presented in Table 4 are based on EIA projections of RE‐sector generating capacity growth over the period extending to 2035, as published in the EIA’s Annual Energy Outlook 2011, combined with the minimum and maximum limits for the ranges of copper intensities reported above. The EIA did not project any growth of offshore wind capacity for the period, and it is unknown whether thermal solar installations were included in the reported data for “solar”. It should be noted that the EIA growth rates are extremely conservative. For example, EIA projects a growth in onshore wind capacity from 31.64 GW in 2009 to 50.89 GW in 2020, a CAGR of about 3.5%, yet U.S. capacity had already grown to 40.18 GW by 2010, an actual simple growth rate of 27%, and a 35% annual growth rate over the past four years was widely cited at the recent annual meeting of the American Wind Energy Association, (AWEA). Similarly, EIA projected solar energy capacity to increase to 10.65 GW by 2010, a CAGR of approximately 15%, but the sector has actually grown 60%‐70% in recent years.
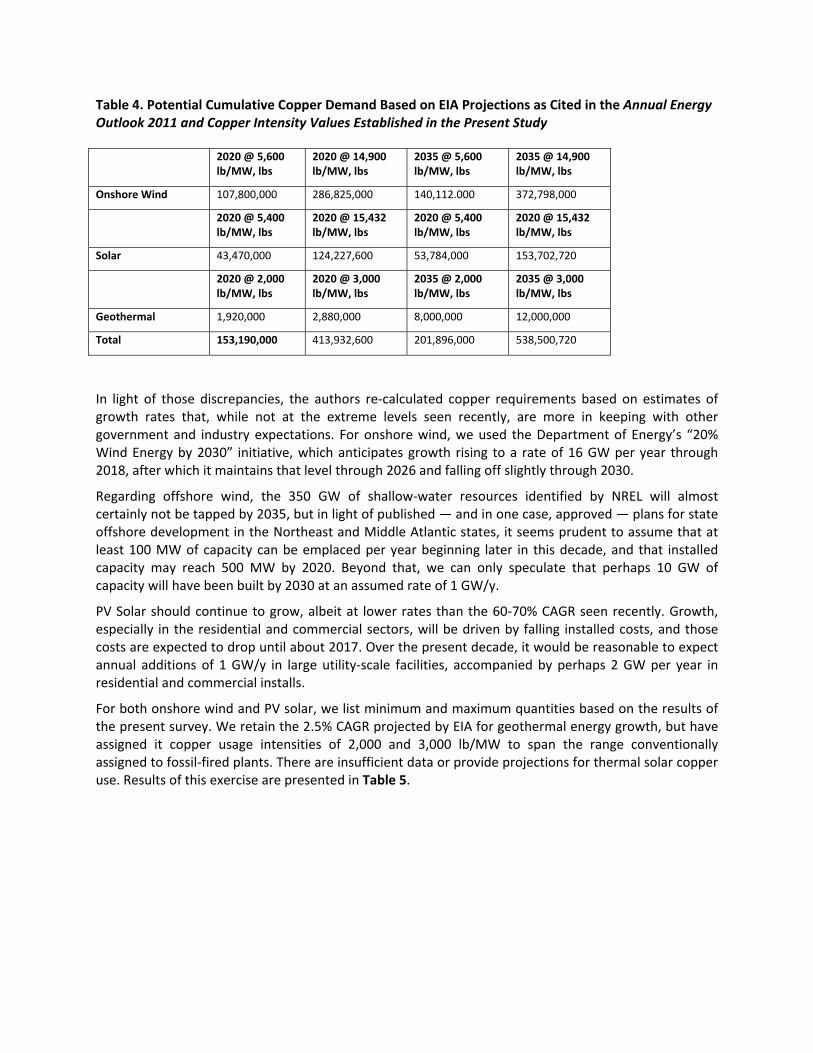
Table 4. Potential Cumulative Copper Demand Based on EIA Projections as Cited in the Annual Energy Outlook 2011 and Copper Intensity Values Established in the Present Study
In light of those discrepancies, the authors re‐calculated copper requirements based on estimates of growth rates that, while not at the extreme levels seen recently, are more in keeping with other government and industry expectations. For onshore wind, we used the Department of Energy’s “20% Wind Energy by 2030” initiative, which anticipates growth rising to a rate of 16 GW per year through 2018, after which it maintains that level through 2026 and falling off slightly through 2030.
Regarding offshore wind, the 350 GW of shallow‐water resources identified by NREL will almost certainly not be tapped by 2035, but in light of published ― and in one case, approved ― plans for state offshore development in the Northeast and Middle Atlantic states, it seems prudent to assume that at least 100 MW of capacity can be emplaced per year beginning later in this decade, and that installed capacity may reach 500 MW by 2020. Beyond that, we can only speculate that perhaps 10 GW of capacity will have been built by 2030 at an assumed rate of 1 GW/y.
PV Solar should continue to grow, albeit at lower rates than the 60‐70% CAGR seen recently. Growth, especially in the residential and commercial sectors, will be driven by falling installed costs, and those costs are expected to drop until about 2017. Over the present decade, it would be reasonable to expect annual additions of 1 GW/y in large utility‐scale facilities, accompanied by perhaps 2 GW per year in residential and commercial installs.
For both onshore wind and PV solar, we list minimum and maximum quantities based on the results of the present survey. We retain the 2.5% CAGR projected by EIA for geothermal energy growth, but have assigned it copper usage intensities of 2,000 and 3,000 lb/MW to span the range conventionally assigned to fossil‐fired plants. There are insufficient data or provide projections for thermal solar copper use. Results of this exercise are presented in Table 5.
2020 @ 5,600 lb/MW, lbs
2020 @ 14,900 lb/MW, lbs
2035 @ 5,600 lb/MW, lbs
2035 @ 14,900 lb/MW, lbs
Onshore Wind 107,800,000 286,825,000 140,112.000 372,798,000
2020 @ 5,400 lb/MW, lbs
2020 @ 15,432 lb/MW, lbs
2020 @ 5,400 lb/MW, lbs
2020 @ 15,432 lb/MW, lbs
Solar 43,470,000 124,227,600 53,784,000 153,702,720
2020 @ 2,000 lb/MW, lbs
2020 @ 3,000 lb/MW, lbs
2035 @ 2,000 lb/MW, lbs
2035 @ 3,000 lb/MW, lbs
Geothermal 1,920,000 2,880,000 8,000,000 12,000,000
Total 153,190,000 413,932,600 201,896,000 538,500,720
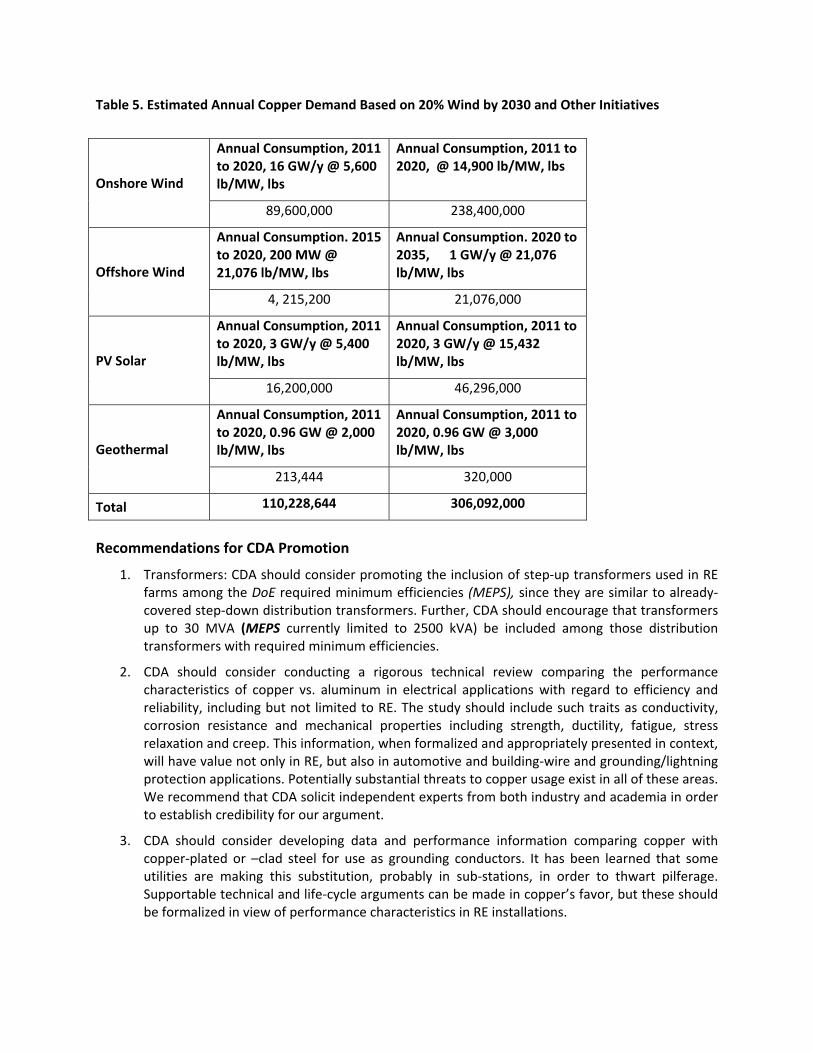
Table 5. Estimated Annual Copper Demand Based on 20% Wind by 2030 and Other Initiatives
Recommendations for CDA Promotion
1. Transformers: CDA should consider promoting the inclusion of step‐up transformers used in RE farms among the DoE required minimum efficiencies (MEPS), since they are similar to already‐covered step‐down distribution transformers. Further, CDA should encourage that transformers up to 30 MVA (MEPS currently limited to 2500 kVA) be included among those distribution transformers with required minimum efficiencies.
2. CDA should consider conducting a rigorous technical review comparing the performance characteristics of copper vs. aluminum in electrical applications with regard to efficiency and reliability, including but not limited to RE. The study should include such traits as conductivity, corrosion resistance and mechanical properties including strength, ductility, fatigue, stress relaxation and creep. This information, when formalized and appropriately presented in context, will have value not only in RE, but also in automotive and building‐wire and grounding/lightning protection applications. Potentially substantial threats to copper usage exist in all of these areas. We recommend that CDA solicit independent experts from both industry and academia in order to establish credibility for our argument.
3. CDA should consider developing data and performance information comparing copper with copper‐plated or –clad steel for use as grounding conductors. It has been learned that some utilities are making this substitution, probably in sub‐stations, in order to thwart pilferage. Supportable technical and life‐cycle arguments can be made in copper’s favor, but these should be formalized in view of performance characteristics in RE installations.
Onshore Wind
Annual Consumption, 2011 to 2020, 16 GW/y @ 5,600 lb/MW, lbs
Annual Consumption, 2011 to 2020, @ 14,900 lb/MW, lbs
89,600,000 238,400,000
Offshore Wind
Annual Consumption. 2015 to 2020, 200 MW @ 21,076 lb/MW, lbs
Annual Consumption. 2020 to 2035, 1 GW/y @ 21,076 lb/MW, lbs
4, 215,200 21,076,000
PV Solar
Annual Consumption, 2011 to 2020, 3 GW/y @ 5,400 lb/MW, lbs
Annual Consumption, 2011 to 2020, 3 GW/y @ 15,432 lb/MW, lbs
16,200,000 46,296,000
Geothermal
Annual Consumption, 2011 to 2020, 0.96 GW @ 2,000 lb/MW, lbs
Annual Consumption, 2011 to 2020, 0.96 GW @ 3,000 lb/MW, lbs
213,444 320,000
Total 110,228,644 306,092,000
4. CDA should consider developing a recommended‐practice document with respect to the use of all‐copper grounding in RE installations, emphasizing the ability to establish and maintain a reliable common ground potential throughout the farm. In view of the threat possibly posed by copper‐clad steel, the study should include examination of galvanic effects in aggressive soil and moisture environments. The involvement of organizations such as the National Association of Corrosion Engineers (NACE) and the American Petroleum Institute (API) may be helpful in this regard.
5. CDA should consider becoming involved in the generation and review of standards for RE installations, particularly with respect to grounding and power quality issues. CDA has historically performed such work in conventional power systems and should extend its influence in the growing RE market, where the issues involved are admittedly (by installers) seen as works in progress.
6. CDA should consider mounting a campaign to promote distributed generation, with emphasis on PV and possibly thermal solar technologies. Opportunities for partnering with utilities and government agencies should be available. Federal, state and local governments already promote RE in residential and commercial‐scale sizes, as do many utilities. CDA can use these existing opportunities to educate potential users on the benefits in efficiency and reliability that copper provides.
References
U.S. Department of Energy/Energy Information Administration, Annual Energy Outlook 2011, Washington, D.C., March, 2011.
J. Lyons (Novus Energy Partners, Dr. Lyons was formerly CEO of GE Energy), Presentation at AWEA WindPower 2011, Anaheim, May 2011.
J. Swanson (SunPower), Presentation at AWEA WindPower 2011, Anaheim, May 2011.
S. Gensler (DoE), Presentation at AWEA Windpower 2011, Anaheim, May 2011.
F. Nuño, Copper and Renewables, 2011 Analysis, ECI, March 2011.
I. K. Falconer (Univ. of Exeter), Metals Required for the UK’s Low Carbon Energy System: The case of copper usage in wind farms, University of Exeter, 2009, http://geography.exeter.ac.uk/media/universityofexeter/schoolofgeography/pdfs/epsdissertations/Ian_Falconer.pdf
Appendix I: Increasing Energy Efficiency in Transformers and its Impact Upon Materials Usage
Distribution transformers vary in efficiency based upon materials selections and quantities utilized. Many manufacturers, utilities, and industrial/commercial users provided data, and usually indicate that higher efficiencies are achieved using “more and better materials”.
The traditional lowest‐first‐cost transformer includes minimum quantities of materials and materials with lowest costs total costs; most transformers are probably purchased on this basis. However, the US Department of Energy (DoE) has evaluated Distribution Transformers for reasons of energy efficiency and opportunities to cost‐effectively reduce electrical losses, emissions, etc. (as required by EPAct 1992). Minimum efficiency standards (MEPS) were issued, effective in 2010 for transformers 10 kVA through 2,500 kVA. These MEPS are currently being re‐evaluated for potentially increasing efficiencies required, and for expanding the included kVA ratings and categories. DoE has suggested ratings through 10 MVA, and CDA has, in turn, further suggested that DoE include transformers through 30 MVA for substantial, cost‐effective energy savings. The additional sizes recommended by CDA are also in the distribution system and include the usual sub‐station MVA applications where the high‐voltage (HV) transmission line voltages are stepped‐down to distribution voltages (frequently 13.8KV).
Figures 1 and 2 include data for specific U. S. distribution transformers (ratings above 2,500 kVA) as energy efficiency increases from minimum efficiency (lowest transformer cost), to transformers of moderate energy efficiency to transformers of very high efficiency (maximum cost‐effective efficiency), for substation sizes.
FIGURE 1 TRANSFORMER COPPER USAGES WITH INCREASING ENERGY EFFICIENCY IN SPECIFIC SUBSTATION TRANSFORMER MVA SIZE*
(1,000’s of KVA)
18 MVA 18 MVA 18 MVA
**
Loss Values
Core ($/Watt) $0 $4.00 $8.00
Conductor ($/Watt) 0 3.00 6.00
Copper (lbs.) 9,700 28,000 39,000
Actual unit shipped. Prepared by: BBF & ASSOCIATES,
**Based upon data from a major manufacturer and ranges of actually requested units, based upon information from management and engineering technical sources. Note: This transformer is rated as 18‐24‐30MVA, where 30MVA is a maximum rating for high loads using fan‐cooling (for the oil, in this “liquid‐filled” transformer). Note:
This table has been prepared on the basis of information from management, interviews, published reference documents and assumptions based upon a standard methodology. Because any forecast is subject to uncertainties, these projections are not represented as specific results that actually will be achieved. Note: “Loss Values” are cited as “dollars per Watt”, a detailed methodology used in the US, developed by EEI and published in 1981, in which the purchaser is prepared to pay those dollars for each loss Watt “saved”/reduced; these are usually cited by purchaser as “A” ‐ core and “B” – conductor value; the transformer is more energy efficient as the values increase, utilizing more/higher‐grade core and conductor materials. A and B values are developed by purchasers considering the transformer application (duty‐cycle, expected life, etc.) and detailed purchaser financial data, regulatory requirements, etc.
FIGURE 2 TRANSFORMER COPPER USAGES WITH INCREASING ENERGY EFFICIENCY IN SPECIFIC SUBSTATION TRANSFORMER MVA SIZE*
(1,000’s of KVA)
12 MVA 12 MVA 12 MVA 12 MVA
**
Loss Values
Core ($/Watt) $0 $1 $4.00 Max
Conductor ($/Watt) 0 0.3 2.26 Max
Copper (lbs.) 7,030 9,734 14,060 18,077
Amps/square inch 1,800 1,300 900 700
*Prepared by BBF & Associates
** Actual unit shipped; actual load loss at 12 MVA was 35KW. Prepared by: BBF & ASSOCIATES. *Based upon data from manufacturers and estimates, based upon information from management, engineering and independent technical sources.
Note: This table has been prepared on the basis of information from management, interviews, published reference documents and assumptions based upon a standard methodology. Because any forecast is subject to uncertainties, these projections are not represented as specific results that actually will be achieved.
These data show substantial increases in copper usage for each MVA transformer as required minimum efficiency increases. From the lowest efficiency liquid‐filled transformer to the highest or maximum efficiency (same MVA) transformer, there is consistently more than a doubling in copper usage in the unit; the unit appearance in size, overall weight, and volume occupied also changes as the efficiency increases. In addition, the core steel will usually improve (to reduce losses) from an M‐6, to and M‐4 or even an M‐2 grade.
Figure 3 provides the range of materials usages for a 25‐kVA pole‐top transformer; however, this high‐volume transformer has required MEPS, and the first 3 units listed in the figure can no longer be utilized in the US. MEPS is set at approximately an “A” (core) value of $4.00 per Watt (W) loss, and a “B” (conductor) value of approximately $1.00 ‐ $1.20 per W. (“A” and “B” values are commonly utilized by utilities in their specifications, based upon studies by Edison Electric Institute and a 1981 publication – a utility will “pay up to that value” per W reduction in losses).
FIGURE 3 POLE‐TOP TRANSFORMER MANUFACTURER DATA FOR COPPER USAGE AND CHARACTERISTICS FOR 25
KVA UNITS FROM LOWEST TO VERY HIGH EFFICIENCIES
25 kVA Pole-top Transformers
"Lowest" "Metglas ®"
EXAMPLES (By Improving Energy
First Cost
Efficiency in Operation
Loss Evaluation Rate:
Core ($/watt) 0 $0.80 $1.00 $3.00 $6.00 $6.76
Conductor ($/watt) 0 $0.30 $0.50 $1.00 $6.00 $0.76
Actual Losses:
Core (watts) 95 75 70 65 58 18
Conductor (watts) 300 200 170 150 130 150
Copper (lbs.)
Primary Winding only 0 0 28 40 58 40
~14lbs.Al ~18lbs.Al
Amps/square inch ~1,800 ~1,400 ~1,900 ~1,330 ~950 ~1,330
. Source: Data provided by a major pole‐top transformer manufacturer.
NOTE: The higher “Conductor Loss Evaluation Rate” uses copper. Note: This table has been prepared on the basis of information from management, interviews, published reference documents and assumptions based upon a standard methodology. Because any forecast is subject to uncertainties, these projections are not represented as specific results that actually will be achieved
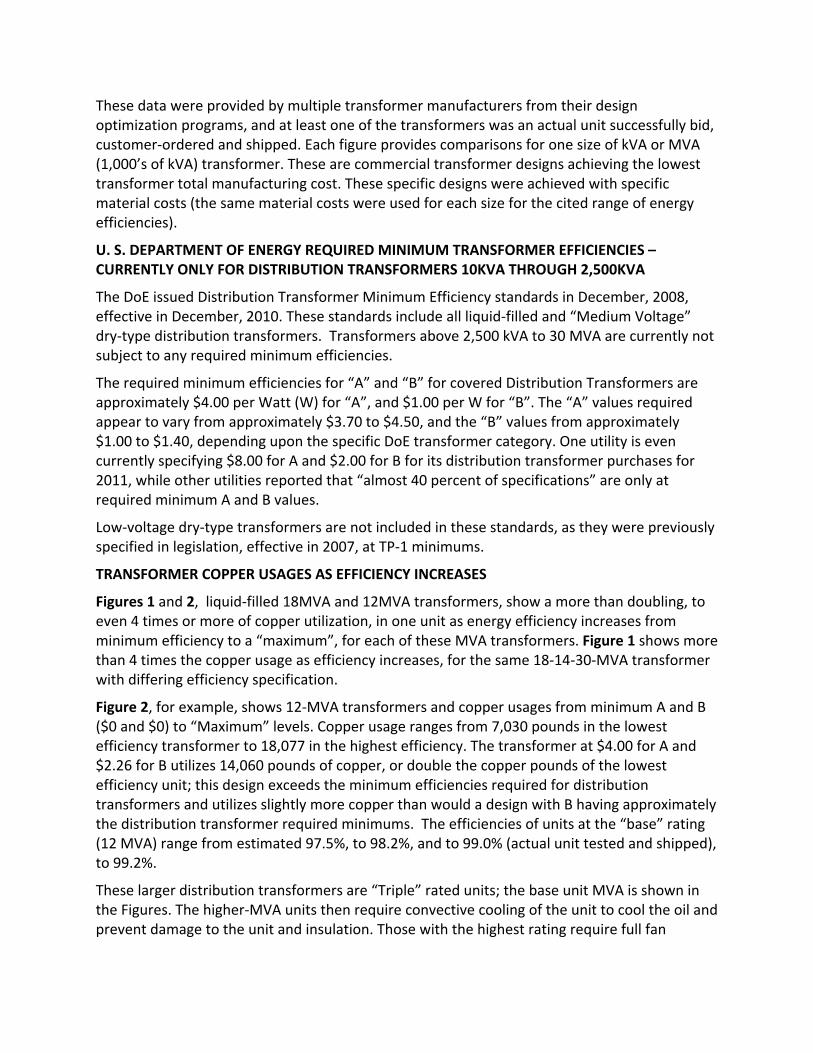
These data were provided by multiple transformer manufacturers from their design optimization programs, and at least one of the transformers was an actual unit successfully bid, customer‐ordered and shipped. Each figure provides comparisons for one size of kVA or MVA (1,000’s of kVA) transformer. These are commercial transformer designs achieving the lowest transformer total manufacturing cost. These specific designs were achieved with specific material costs (the same material costs were used for each size for the cited range of energy efficiencies).
U. S. DEPARTMENT OF ENERGY REQUIRED MINIMUM TRANSFORMER EFFICIENCIES – CURRENTLY ONLY FOR DISTRIBUTION TRANSFORMERS 10KVA THROUGH 2,500KVA
The DoE issued Distribution Transformer Minimum Efficiency standards in December, 2008, effective in December, 2010. These standards include all liquid‐filled and “Medium Voltage” dry‐type distribution transformers. Transformers above 2,500 kVA to 30 MVA are currently not subject to any required minimum efficiencies.
The required minimum efficiencies for “A” and “B” for covered Distribution Transformers are approximately $4.00 per Watt (W) for “A”, and $1.00 per W for “B”. The “A” values required appear to vary from approximately $3.70 to $4.50, and the “B” values from approximately $1.00 to $1.40, depending upon the specific DoE transformer category. One utility is even currently specifying $8.00 for A and $2.00 for B for its distribution transformer purchases for 2011, while other utilities reported that “almost 40 percent of specifications” are only at required minimum A and B values.
Low‐voltage dry‐type transformers are not included in these standards, as they were previously specified in legislation, effective in 2007, at TP‐1 minimums.
TRANSFORMER COPPER USAGES AS EFFICIENCY INCREASES
Figures 1 and 2, liquid‐filled 18MVA and 12MVA transformers, show a more than doubling, to even 4 times or more of copper utilization, in one unit as energy efficiency increases from minimum efficiency to a “maximum”, for each of these MVA transformers. Figure 1 shows more than 4 times the copper usage as efficiency increases, for the same 18‐14‐30‐MVA transformer with differing efficiency specification.
Figure 2, for example, shows 12‐MVA transformers and copper usages from minimum A and B ($0 and $0) to “Maximum” levels. Copper usage ranges from 7,030 pounds in the lowest efficiency transformer to 18,077 in the highest efficiency. The transformer at $4.00 for A and $2.26 for B utilizes 14,060 pounds of copper, or double the copper pounds of the lowest efficiency unit; this design exceeds the minimum efficiencies required for distribution transformers and utilizes slightly more copper than would a design with B having approximately the distribution transformer required minimums. The efficiencies of units at the “base” rating (12 MVA) range from estimated 97.5%, to 98.2%, and to 99.0% (actual unit tested and shipped), to 99.2%.
These larger distribution transformers are “Triple” rated units; the base unit MVA is shown in the Figures. The higher‐MVA units then require convective cooling of the unit to cool the oil and prevent damage to the unit and insulation. Those with the highest rating require full fan
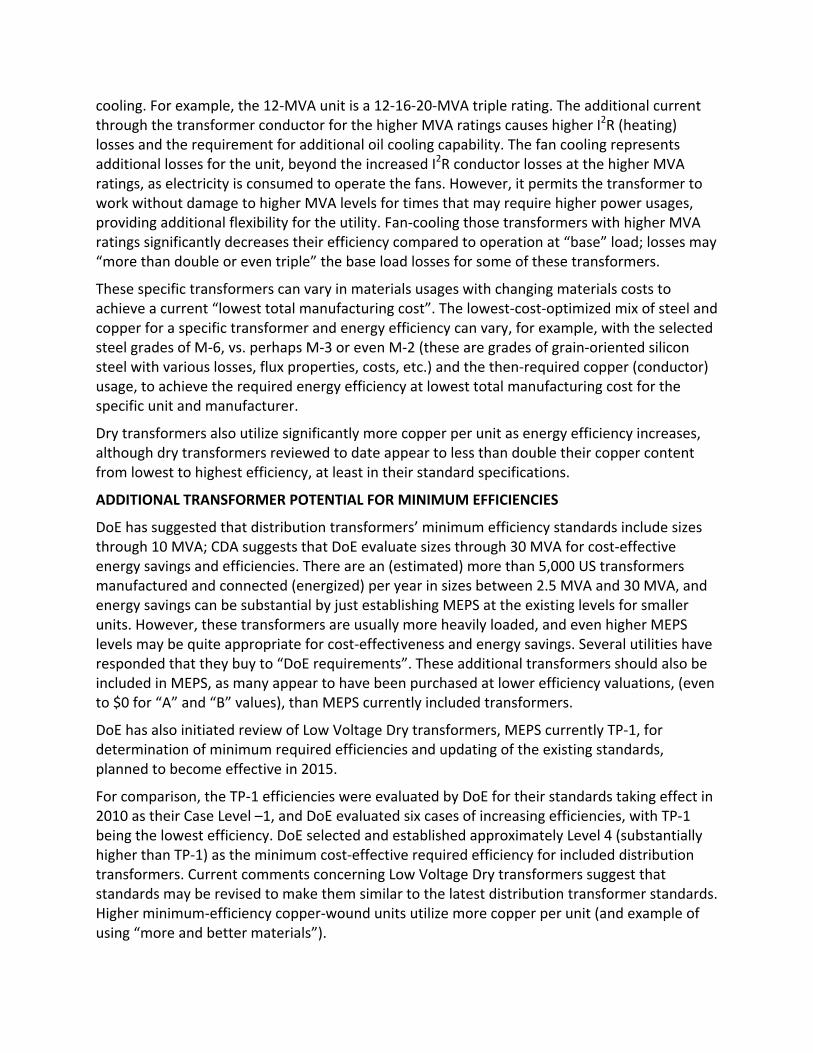
cooling. For example, the 12‐MVA unit is a 12‐16‐20‐MVA triple rating. The additional current through the transformer conductor for the higher MVA ratings causes higher I2R (heating) losses and the requirement for additional oil cooling capability. The fan cooling represents additional losses for the unit, beyond the increased I2R conductor losses at the higher MVA ratings, as electricity is consumed to operate the fans. However, it permits the transformer to work without damage to higher MVA levels for times that may require higher power usages, providing additional flexibility for the utility. Fan‐cooling those transformers with higher MVA ratings significantly decreases their efficiency compared to operation at “base” load; losses may “more than double or even triple” the base load losses for some of these transformers.
These specific transformers can vary in materials usages with changing materials costs to achieve a current “lowest total manufacturing cost”. The lowest‐cost‐optimized mix of steel and copper for a specific transformer and energy efficiency can vary, for example, with the selected steel grades of M‐6, vs. perhaps M‐3 or even M‐2 (these are grades of grain‐oriented silicon steel with various losses, flux properties, costs, etc.) and the then‐required copper (conductor) usage, to achieve the required energy efficiency at lowest total manufacturing cost for the specific unit and manufacturer.
Dry transformers also utilize significantly more copper per unit as energy efficiency increases, although dry transformers reviewed to date appear to less than double their copper content from lowest to highest efficiency, at least in their standard specifications.
ADDITIONAL TRANSFORMER POTENTIAL FOR MINIMUM EFFICIENCIES
DoE has suggested that distribution transformers’ minimum efficiency standards include sizes through 10 MVA; CDA suggests that DoE evaluate sizes through 30 MVA for cost‐effective energy savings and efficiencies. There are an (estimated) more than 5,000 US transformers manufactured and connected (energized) per year in sizes between 2.5 MVA and 30 MVA, and energy savings can be substantial by just establishing MEPS at the existing levels for smaller units. However, these transformers are usually more heavily loaded, and even higher MEPS levels may be quite appropriate for cost‐effectiveness and energy savings. Several utilities have responded that they buy to “DoE requirements”. These additional transformers should also be included in MEPS, as many appear to have been purchased at lower efficiency valuations, (even to $0 for “A” and “B” values), than MEPS currently included transformers.
DoE has also initiated review of Low Voltage Dry transformers, MEPS currently TP‐1, for determination of minimum required efficiencies and updating of the existing standards, planned to become effective in 2015.
For comparison, the TP‐1 efficiencies were evaluated by DoE for their standards taking effect in 2010 as their Case Level –1, and DoE evaluated six cases of increasing efficiencies, with TP‐1 being the lowest efficiency. DoE selected and established approximately Level 4 (substantially higher than TP‐1) as the minimum cost‐effective required efficiency for included distribution transformers. Current comments concerning Low Voltage Dry transformers suggest that standards may be revised to make them similar to the latest distribution transformer standards. Higher minimum‐efficiency copper‐wound units utilize more copper per unit (and example of using “more and better materials”).
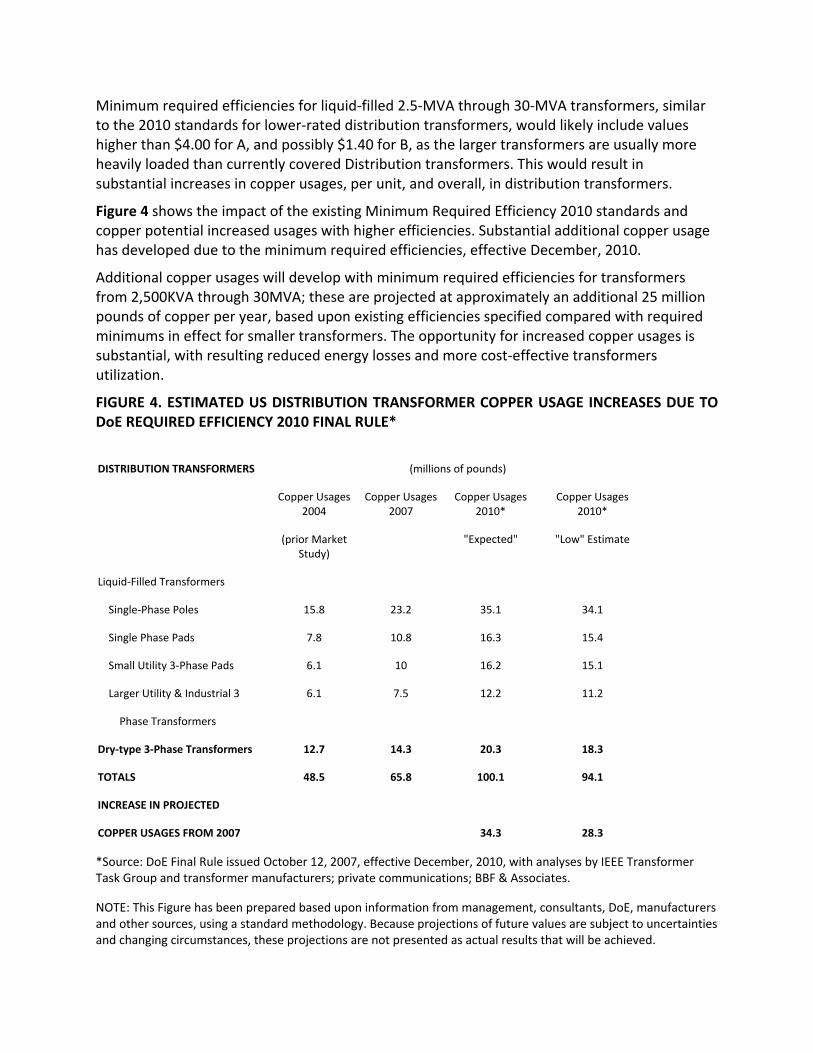
Minimum required efficiencies for liquid‐filled 2.5‐MVA through 30‐MVA transformers, similar to the 2010 standards for lower‐rated distribution transformers, would likely include values higher than $4.00 for A, and possibly $1.40 for B, as the larger transformers are usually more heavily loaded than currently covered Distribution transformers. This would result in substantial increases in copper usages, per unit, and overall, in distribution transformers.
Figure 4 shows the impact of the existing Minimum Required Efficiency 2010 standards and copper potential increased usages with higher efficiencies. Substantial additional copper usage has developed due to the minimum required efficiencies, effective December, 2010.
Additional copper usages will develop with minimum required efficiencies for transformers from 2,500KVA through 30MVA; these are projected at approximately an additional 25 million pounds of copper per year, based upon existing efficiencies specified compared with required minimums in effect for smaller transformers. The opportunity for increased copper usages is substantial, with resulting reduced energy losses and more cost‐effective transformers utilization.
FIGURE 4. ESTIMATED US DISTRIBUTION TRANSFORMER COPPER USAGE INCREASES DUE TO DoE REQUIRED EFFICIENCY 2010 FINAL RULE*
DISTRIBUTION TRANSFORMERS (millions of pounds)
Copper Usages 2004
Copper Usages 2007
Copper Usages 2010*
Copper Usages 2010*
(prior Market Study)
"Expected" "Low" Estimate
Liquid‐Filled Transformers
Single‐Phase Poles 15.8 23.2 35.1 34.1
Single Phase Pads 7.8 10.8 16.3 15.4
Small Utility 3‐Phase Pads 6.1 10 16.2 15.1
Larger Utility & Industrial 3 6.1 7.5 12.2 11.2
Phase Transformers
Dry‐type 3‐Phase Transformers 12.7 14.3 20.3 18.3
TOTALS 48.5 65.8 100.1 94.1
INCREASE IN PROJECTED
COPPER USAGES FROM 2007 34.3 28.3
*Source: DoE Final Rule issued October 12, 2007, effective December, 2010, with analyses by IEEE Transformer Task Group and transformer manufacturers; private communications; BBF & Associates.
NOTE: This Figure has been prepared based upon information from management, consultants, DoE, manufacturers and other sources, using a standard methodology. Because projections of future values are subject to uncertainties and changing circumstances, these projections are not presented as actual results that will be achieved.