
Current Year Revenues minus Ongoing Costs $ 95 Revenue minus One-Time Spending $ 55.5 Projected...
17
Transcript of Current Year Revenues minus Ongoing Costs $ 95 Revenue minus One-Time Spending $ 55.5 Projected...
FISCAL2018
Beginning Balance, October 1, 2017 see one-time revenue
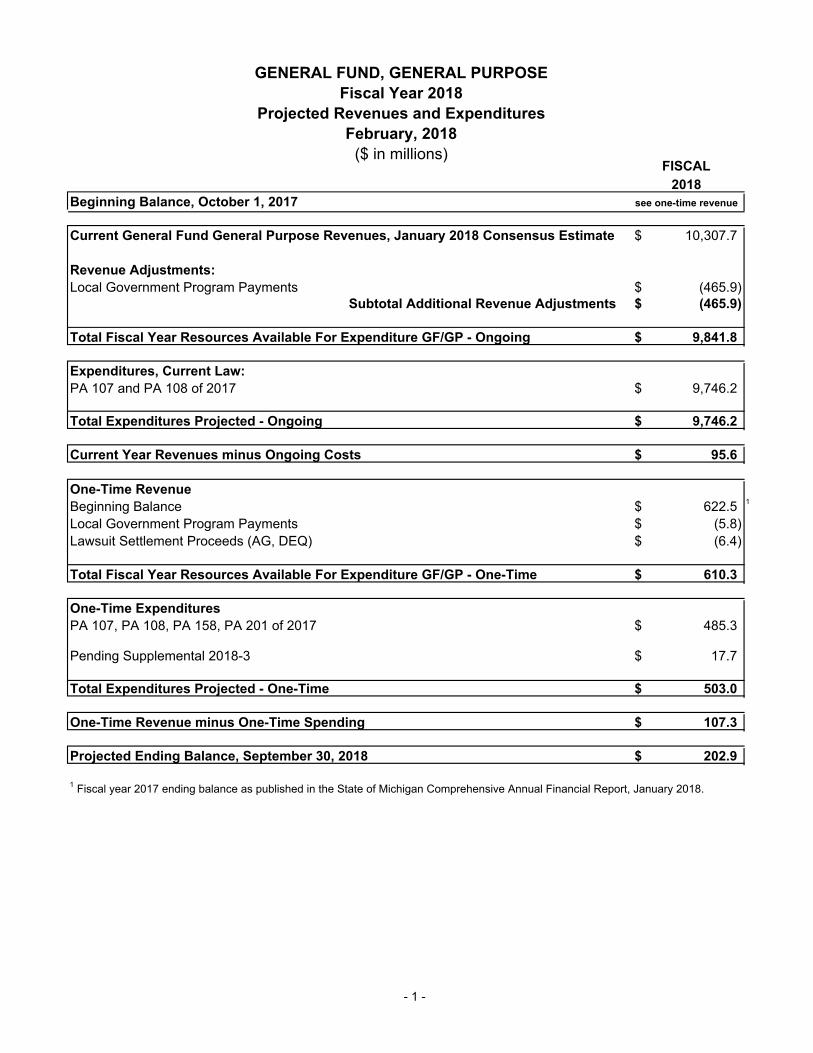
Current General Fund General Purpose Revenues, January 2018 Consensus Estimate 10,307.7$
Revenue Adjustments:Local Government Program Payments (465.9)$
Subtotal Additional Revenue Adjustments (465.9)$
Total Fiscal Year Resources Available For Expenditure GF/GP - Ongoing 9,841.8$
Expenditures, Current Law:PA 107 and PA 108 of 2017 9,746.2$
Total Expenditures Projected - Ongoing 9,746.2$
Current Year Revenues minus Ongoing Costs 95.6$
One-Time RevenueBeginning Balance 622.5$ 1
Local Government Program Payments (5.8)$ Lawsuit Settlement Proceeds (AG, DEQ) (6.4)$
Total Fiscal Year Resources Available For Expenditure GF/GP - One-Time 610.3$
One-Time ExpendituresPA 107, PA 108, PA 158, PA 201 of 2017 485.3$
Pending Supplemental 2018-3 17.7$
Total Expenditures Projected - One-Time 503.0$
One-Time Revenue minus One-Time Spending 107.3$
Projected Ending Balance, September 30, 2018 202.9$
1 Fiscal year 2017 ending balance as published in the State of Michigan Comprehensive Annual Financial Report, January 2018.
GENERAL FUND, GENERAL PURPOSE Fiscal Year 2018
Projected Revenues and Expenditures February, 2018
($ in millions)
- 1 -
FISCAL
2018
Beginning Balance, October 1, 2017 see one-time revenue
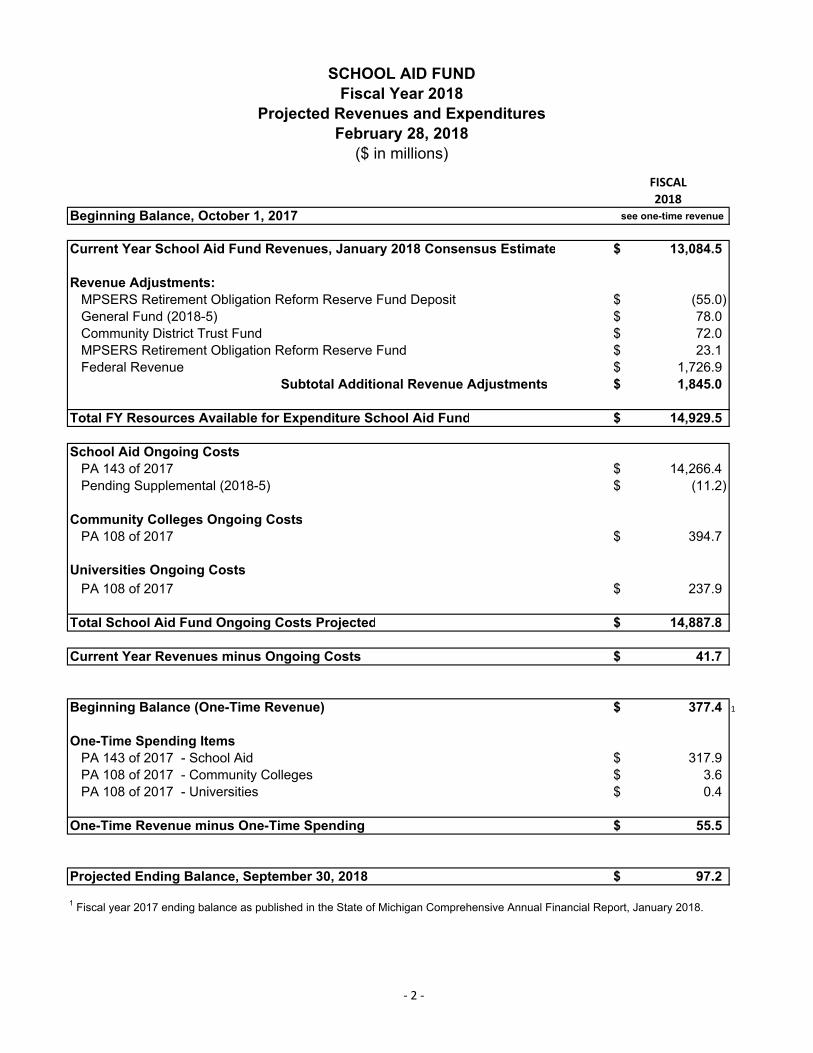
Current Year School Aid Fund Revenues, January 2018 Consensus Estimate 13,084.5$
Revenue Adjustments: MPSERS Retirement Obligation Reform Reserve Fund Deposit (55.0)$ General Fund (2018-5) 78.0$ Community District Trust Fund 72.0$ MPSERS Retirement Obligation Reform Reserve Fund 23.1$ Federal Revenue 1,726.9$
Subtotal Additional Revenue Adjustments 1,845.0$
Total FY Resources Available for Expenditure School Aid Fund 14,929.5$
School Aid Ongoing Costs PA 143 of 2017 14,266.4$ Pending Supplemental (2018-5) (11.2)$
Community Colleges Ongoing Costs PA 108 of 2017 394.7$
Universities Ongoing Costs
PA 108 of 2017 237.9$
Total School Aid Fund Ongoing Costs Projected 14,887.8$
Current Year Revenues minus Ongoing Costs 41.7$
Beginning Balance (One-Time Revenue) 377.4$ 1
One-Time Spending Items PA 143 of 2017 - School Aid 317.9$ PA 108 of 2017 - Community Colleges 3.6$ PA 108 of 2017 - Universities 0.4$
One-Time Revenue minus One-Time Spending 55.5$
Projected Ending Balance, September 30, 2018 97.2$
SCHOOL AID FUNDFiscal Year 2018
Projected Revenues and Expenditures February 28, 2018
($ in millions)
1 Fiscal year 2017 ending balance as published in the State of Michigan Comprehensive Annual Financial Report, January 2018.
‐ 2 ‐
Expenditures & Encumbrances
Year to DateFY 2017
Fiscal YearEnd
SEP 30, 2017Department
InitialAppropriations (2)
ExecutiveOrders &
SupplementalAppropriations (2)
Encumbrance,Work Project &Capital Outlay
Carry Forwards (3)
TotalAuthorization
Expenditures &Encumbrances
Year to DateFY 2018
29.2 82.1 Agriculture and Rural Development 114.4 11.5 13.2 139.1 45.9
33.5 88.2 Attorney General 99.7 4.8 11.3 115.8 26.1
114.6 253.3 Capital Outlay (4) 312.3 0.8 241.6 554.7 184.8
5.2 14.3 Civil Rights 16.2 2.7 0.9 19.8 4.5
706.7 1,472.9 Colleges and Universities 1,391.9 6.0 4.8 1,402.7 675.6
735.7 1,960.2 Corrections 1,992.0 24.0 134.4 2,150.5 834.0
89.2 291.4 Education 351.2 33.6 45.3 430.1 124.1
66.7 253.5 Environmental Quality 485.1 76.1 395.2 956.4 167.5
2.7 5.2 Executive Office 6.8 0.0 0.0 6.9 4.1
8,772.4 23,184.1 Health and Human Services 25,391.4 601.9 270.6 26,263.9 9,236.4
17.4 50.5 Insurance and Financial Service 66.7 6.0 0.0 72.7 16.1
75.2 264.1 Judiciary 300.0 0.4 5.4 305.9 96.5
0.0 4.0 Land Bank Fast Track Authority 4.0 0.0 0.0 4.0 2.0
8.8 22.8 Legislative Auditor General 24.3 0.0 0.8 25.0 7.8
53.8 129.9 Legislature 152.2 0.0 23.6 175.8 54.7
166.0 311.2 Licensing and Regulatory Affairs 386.2 124.9 41.9 552.9 218.3
83.9 156.4 Michigan Strategic Fund 181.7 0.0 0.0 181.8 63.7
57.2 143.0 Military and Veterans Affairs 152.7 17.6 14.7 185.1 80.1
28.0 97.0 Natural Resources 127.9 13.4 36.1 177.4 48.4
72.0 225.8 State 248.3 15.7 43.1 307.1 97.6
204.2 615.1 State Police 693.9 29.9 19.4 743.3 219.4
76.6 255.7 Talent and Economic Development 425.8 44.0 16.7 486.5 100.6
218.9 620.3 Technology, Management and Budget (5) 543.2 163.1 95.2 801.5 188.2
7.0 5.0 Transportation 0.0 42.0 0.9 42.9 0.9
843.3 3,206.1 Treasury 1,829.1 83.2 93.6 2,005.9 1,027.0
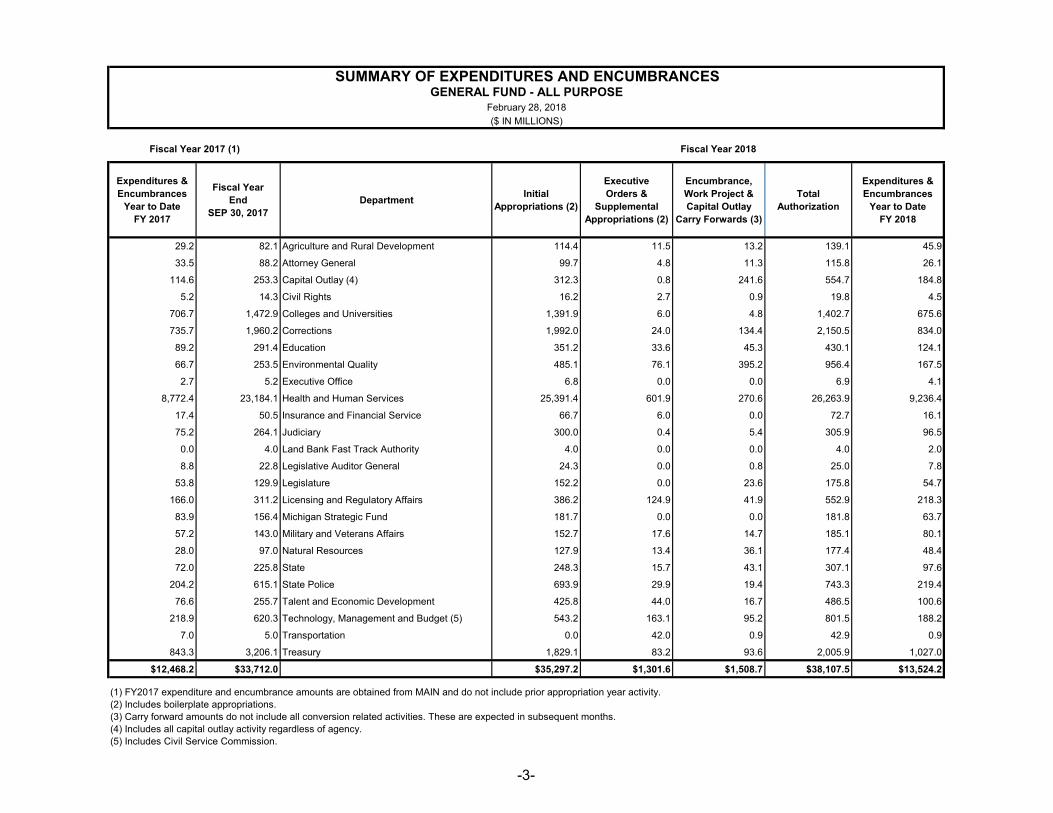
$12,468.2 $33,712.0 $35,297.2 $1,301.6 $1,508.7 $38,107.5 $13,524.2
(1) FY2017 expenditure and encumbrance amounts are obtained from MAIN and do not include prior appropriation year activity.(2) Includes boilerplate appropriations.(3) Carry forward amounts do not include all conversion related activities. These are expected in subsequent months.(4) Includes all capital outlay activity regardless of agency.(5) Includes Civil Service Commission.
SUMMARY OF EXPENDITURES AND ENCUMBRANCESGENERAL FUND - ALL PURPOSE
February 28, 2018
($ IN MILLIONS)
Fiscal Year 2017 (1) Fiscal Year 2018
-3-
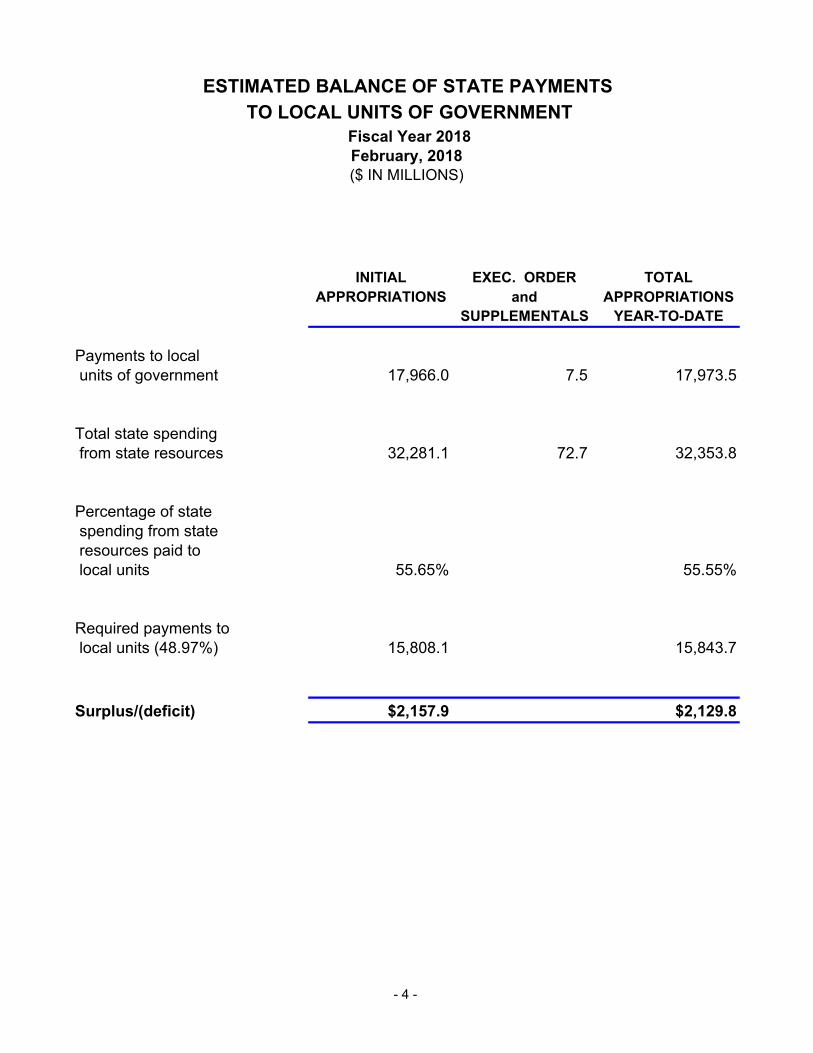
ESTIMATED BALANCE OF STATE PAYMENTS
TO LOCAL UNITS OF GOVERNMENT Fiscal Year 2018February, 2018 ($ IN MILLIONS)
INITIAL EXEC. ORDER TOTALAPPROPRIATIONS and APPROPRIATIONS
SUPPLEMENTALS YEAR-TO-DATE
Payments to local units of government 17,966.0 7.5 17,973.5
Total state spending from state resources 32,281.1 72.7 32,353.8
Percentage of state spending from state resources paid to local units 55.65% 55.55%
Required payments to local units (48.97%) 15,808.1 15,843.7
Surplus/(deficit) $2,157.9 $2,129.8
- 4 -
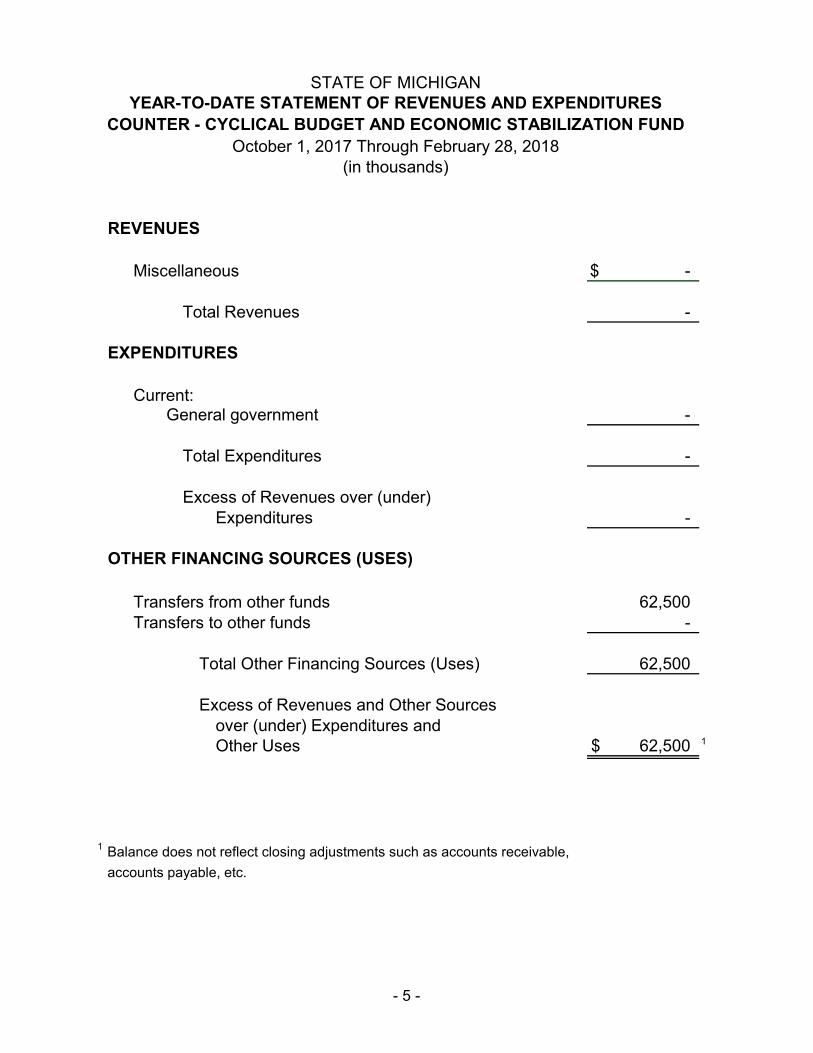
STATE OF MICHIGANYEAR-TO-DATE STATEMENT OF REVENUES AND EXPENDITURES
COUNTER - CYCLICAL BUDGET AND ECONOMIC STABILIZATION FUNDOctober 1, 2017 Through February 28, 2018
(in thousands)
REVENUES
Miscellaneous $ -
Total Revenues -
EXPENDITURES
Current:General government -
Total Expenditures -
Excess of Revenues over (under)Expenditures -
OTHER FINANCING SOURCES (USES)
Transfers from other funds 62,500 Transfers to other funds -
Total Other Financing Sources (Uses) 62,500
Excess of Revenues and Other Sourcesover (under) Expenditures andOther Uses $ 62,500 1
1 Balance does not reflect closing adjustments such as accounts receivable,
accounts payable, etc.
- 5 -

STATE OF MICHIGAN YEAR-TO-DATE STATEMENT OF REVENUES AND EXPENDITURES
October 1, 2017 through February 28, 2018(in thousands)
REVENUES
Taxes $ -From federal agencies -From licenses and permits - Miscellaneous 22,427
Total Revenues 22,427
EXPENDITURES
Current:General government 1,922 Conservation, environment,
recreation, and agriculture 3,698 Capital outlay 15
Total Expenditures 5,635
Excess of Revenues over (under)Expenditures 16,792
OTHER FINANCING SOURCES (USES)
Proceeds from bond issues -Proceeds from sale of capital assets -Transfers from other funds -Transfers to other funds -
Total Other Financing Sources (Uses) -
Excess of Revenues and Other Sourcesover (under) Expenditures andOther Uses $ 16,792 1
1 Balance does not reflect closing adjustments such as accounts receivable,
accounts payable, etc.
MICHIGAN NATURAL RESOURCES TRUST FUND
- 6 -

- 7 -
REVENUE OVERVIEW Office of Revenue and Tax Analysis Michigan Department of Treasury
This Monthly Financial Report to the Legislature presents the Michigan State government's economic situation and cash collections for February 2018, representing some January 2018 and some February 2018 economic activity in Michigan.
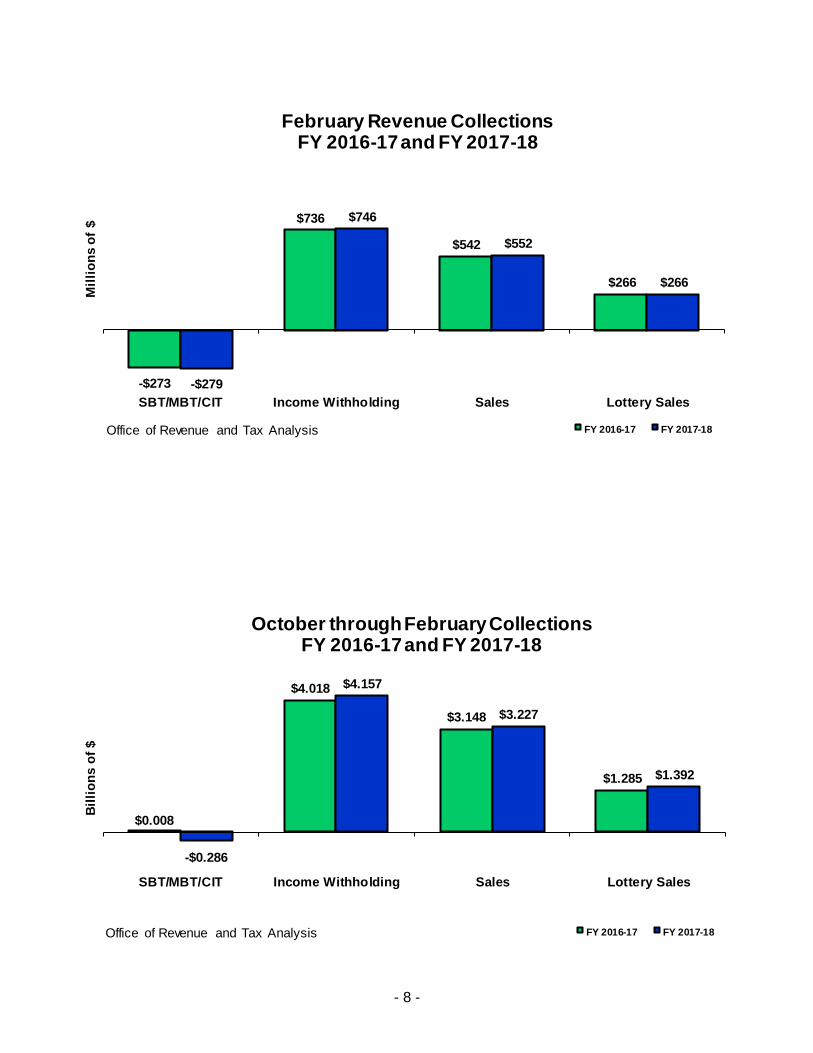
Total General Fund - General Purpose cash collections were $27.7 million (38.7 percent) higher in February 2018 than in February 2017. The February 2018 School Aid Fund cash collections were $87.6 million (11.7 percent) higher than in February 2017. February 2018 transportation collections were $21.4 million (8.6 percent) higher than in February 2017 (see revenue table). February is the fifth month of the state’s fiscal year (FY). Year-to-date collection totals generally provide a more accurate view of collections, since they are less affected by the timing of payments. Year-to-date General Fund - General Purpose cash collections are down $107.5 million (2.6 percent) from a year ago. School Aid Fund cash collections are up $220.6 million (4.0 percent) and transportation collections are up $185.2 million (18.1 percent). The majority of the transportation revenue increase is the result of tax changes.
The FY 2017-18 revenue projections presented in the revenue table on page 9 are from the Consensus Revenue Estimating Conference held on January 11, 2018. The revenue estimate for net General Fund – General Purpose revenue for FY 2017-18 is $10,307.7 million and the net School Aid revenue forecast is $13,084.5 million. The Transportation Funds revenue forecast is $3,039.3 million. The next regularly scheduled Consensus Revenue Estimating Conference will be held on May 16, 2018.
$4.187
$5.516
$1.021
$4.080
$5.736
$1.206
GF-GP Revenue School Aid Revenue Transportation Rev.
Billi
ons
of $
Office of Revenue and Tax Analysis
October through February CollectionsFY 2016-17 and FY 2017-18
FY 2016-17 FY 2017-18
- 8 -
-$273
$736
$542
$266
-$279
$746
$552
$266
SBT/MBT/CIT Income Withholding Sales Lottery Sales
Mill
ions
of $
Office of Revenue and Tax Analysis
February Revenue CollectionsFY 2016-17 and FY 2017-18
FY 2016-17 FY 2017-18
$0.008
$4.018
$3.148
$1.285
-$0.286
$4.157
$3.227
$1.392
SBT/MBT/CIT Income Withholding Sales Lottery Sales
Billi
ons
of $
Office of Revenue and Tax Analysis
October through February CollectionsFY 2016-17 and FY 2017-18
FY 2016-17 FY 2017-18
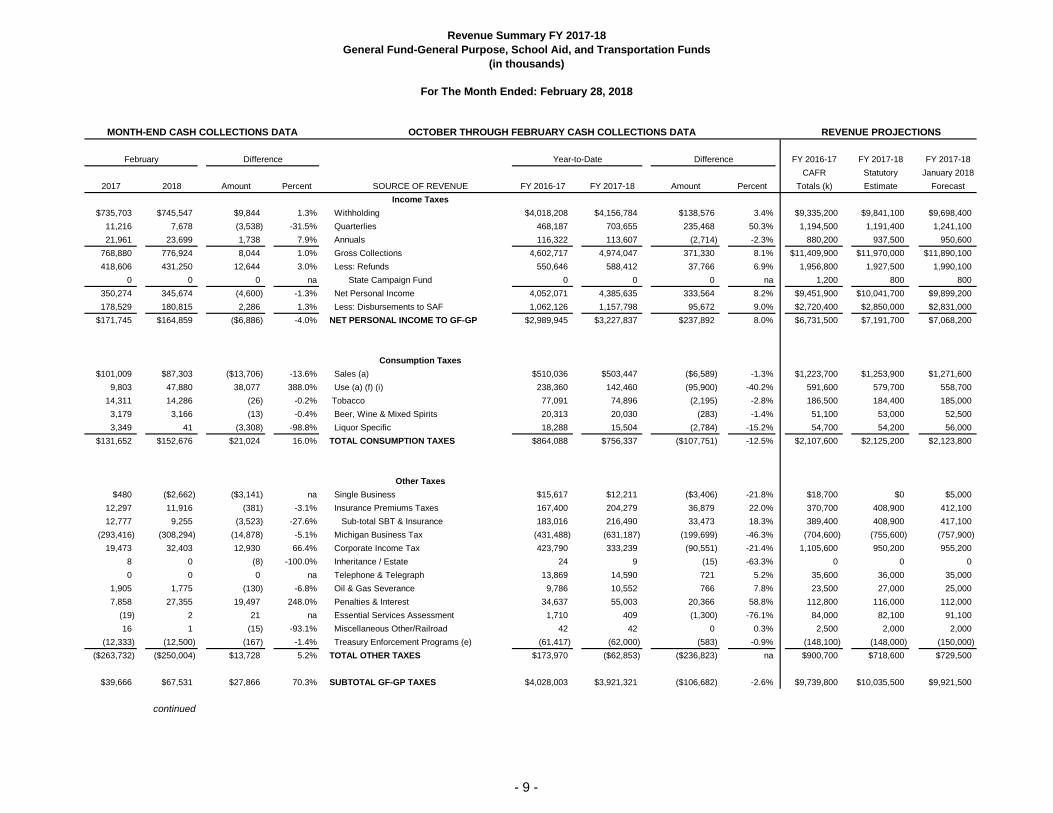
Revenue Summary FY 2017-18General Fund-General Purpose, School Aid, and Transportation Funds
(in thousands)
For The Month Ended: February 28, 2018
MONTH-END CASH COLLECTIONS DATA OCTOBER THROUGH FEBRUARY CASH COLLECTIONS DATA REVENUE PROJECTIONS
February Difference Year-to-Date Difference FY 2016-17 FY 2017-18 FY 2017-18CAFR Statutory January 2018
2017 2018 Amount Percent SOURCE OF REVENUE FY 2016-17 FY 2017-18 Amount Percent Totals (k) Estimate ForecastIncome Taxes
$735,703 $745,547 $9,844 1.3% Withholding $4,018,208 $4,156,784 $138,576 3.4% $9,335,200 $9,841,100 $9,698,40011,216 7,678 (3,538) -31.5% Quarterlies 468,187 703,655 235,468 50.3% 1,194,500 1,191,400 1,241,10021,961 23,699 1,738 7.9% Annuals 116,322 113,607 (2,714) -2.3% 880,200 937,500 950,600
768,880 776,924 8,044 1.0% Gross Collections 4,602,717 4,974,047 371,330 8.1% $11,409,900 $11,970,000 $11,890,100418,606 431,250 12,644 3.0% Less: Refunds 550,646 588,412 37,766 6.9% 1,956,800 1,927,500 1,990,100
0 0 0 na State Campaign Fund 0 0 0 na 1,200 800 800350,274 345,674 (4,600) -1.3% Net Personal Income 4,052,071 4,385,635 333,564 8.2% $9,451,900 $10,041,700 $9,899,200178,529 180,815 2,286 1.3% Less: Disbursements to SAF 1,062,126 1,157,798 95,672 9.0% $2,720,400 $2,850,000 $2,831,000
$171,745 $164,859 ($6,886) -4.0% NET PERSONAL INCOME TO GF-GP $2,989,945 $3,227,837 $237,892 8.0% $6,731,500 $7,191,700 $7,068,200
Consumption Taxes$101,009 $87,303 ($13,706) -13.6% Sales (a) $510,036 $503,447 ($6,589) -1.3% $1,223,700 $1,253,900 $1,271,600
9,803 47,880 38,077 388.0% Use (a) (f) (i) 238,360 142,460 (95,900) -40.2% 591,600 579,700 558,70014,311 14,286 (26) -0.2% Tobacco 77,091 74,896 (2,195) -2.8% 186,500 184,400 185,0003,179 3,166 (13) -0.4% Beer, Wine & Mixed Spirits 20,313 20,030 (283) -1.4% 51,100 53,000 52,5003,349 41 (3,308) -98.8% Liquor Specific 18,288 15,504 (2,784) -15.2% 54,700 54,200 56,000
$131,652 $152,676 $21,024 16.0% TOTAL CONSUMPTION TAXES $864,088 $756,337 ($107,751) -12.5% $2,107,600 $2,125,200 $2,123,800
Other Taxes$480 ($2,662) ($3,141) na Single Business $15,617 $12,211 ($3,406) -21.8% $18,700 $0 $5,000
12,297 11,916 (381) -3.1% Insurance Premiums Taxes 167,400 204,279 36,879 22.0% 370,700 408,900 412,10012,777 9,255 (3,523) -27.6% Sub-total SBT & Insurance 183,016 216,490 33,473 18.3% 389,400 408,900 417,100
(293,416) (308,294) (14,878) -5.1% Michigan Business Tax (431,488) (631,187) (199,699) -46.3% (704,600) (755,600) (757,900)19,473 32,403 12,930 66.4% Corporate Income Tax 423,790 333,239 (90,551) -21.4% 1,105,600 950,200 955,200
8 0 (8) -100.0% Inheritance / Estate 24 9 (15) -63.3% 0 0 00 0 0 na Telephone & Telegraph 13,869 14,590 721 5.2% 35,600 36,000 35,000
1,905 1,775 (130) -6.8% Oil & Gas Severance 9,786 10,552 766 7.8% 23,500 27,000 25,0007,858 27,355 19,497 248.0% Penalties & Interest 34,637 55,003 20,366 58.8% 112,800 116,000 112,000
(19) 2 21 na Essential Services Assessment 1,710 409 (1,300) -76.1% 84,000 82,100 91,10016 1 (15) -93.1% Miscellaneous Other/Railroad 42 42 0 0.3% 2,500 2,000 2,000
(12,333) (12,500) (167) -1.4% Treasury Enforcement Programs (e) (61,417) (62,000) (583) -0.9% (148,100) (148,000) (150,000)($263,732) ($250,004) $13,728 5.2% TOTAL OTHER TAXES $173,970 ($62,853) ($236,823) na $900,700 $718,600 $729,500
$39,666 $67,531 $27,866 70.3% SUBTOTAL GF-GP TAXES $4,028,003 $3,921,321 ($106,682) -2.6% $9,739,800 $10,035,500 $9,921,500
continued
- 9 -
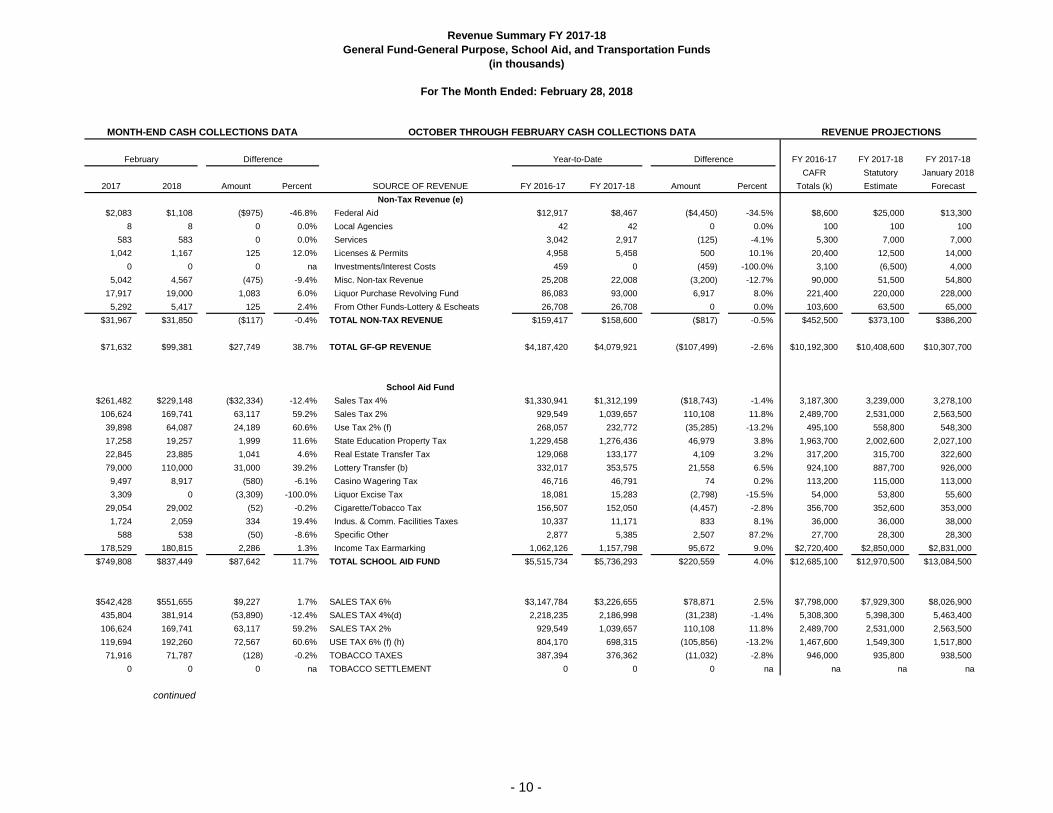
Revenue Summary FY 2017-18General Fund-General Purpose, School Aid, and Transportation Funds
(in thousands)
For The Month Ended: February 28, 2018
MONTH-END CASH COLLECTIONS DATA OCTOBER THROUGH FEBRUARY CASH COLLECTIONS DATA REVENUE PROJECTIONS
February Difference Year-to-Date Difference FY 2016-17 FY 2017-18 FY 2017-18CAFR Statutory January 2018
2017 2018 Amount Percent SOURCE OF REVENUE FY 2016-17 FY 2017-18 Amount Percent Totals (k) Estimate ForecastNon-Tax Revenue (e)
$2,083 $1,108 ($975) -46.8% Federal Aid $12,917 $8,467 ($4,450) -34.5% $8,600 $25,000 $13,3008 8 0 0.0% Local Agencies 42 42 0 0.0% 100 100 100
583 583 0 0.0% Services 3,042 2,917 (125) -4.1% 5,300 7,000 7,0001,042 1,167 125 12.0% Licenses & Permits 4,958 5,458 500 10.1% 20,400 12,500 14,000
0 0 0 na Investments/Interest Costs 459 0 (459) -100.0% 3,100 (6,500) 4,0005,042 4,567 (475) -9.4% Misc. Non-tax Revenue 25,208 22,008 (3,200) -12.7% 90,000 51,500 54,800
17,917 19,000 1,083 6.0% Liquor Purchase Revolving Fund 86,083 93,000 6,917 8.0% 221,400 220,000 228,0005,292 5,417 125 2.4% From Other Funds-Lottery & Escheats 26,708 26,708 0 0.0% 103,600 63,500 65,000
$31,967 $31,850 ($117) -0.4% TOTAL NON-TAX REVENUE $159,417 $158,600 ($817) -0.5% $452,500 $373,100 $386,200
$71,632 $99,381 $27,749 38.7% TOTAL GF-GP REVENUE $4,187,420 $4,079,921 ($107,499) -2.6% $10,192,300 $10,408,600 $10,307,700
School Aid Fund$261,482 $229,148 ($32,334) -12.4% Sales Tax 4% $1,330,941 $1,312,199 ($18,743) -1.4% 3,187,300 3,239,000 3,278,100106,624 169,741 63,117 59.2% Sales Tax 2% 929,549 1,039,657 110,108 11.8% 2,489,700 2,531,000 2,563,50039,898 64,087 24,189 60.6% Use Tax 2% (f) 268,057 232,772 (35,285) -13.2% 495,100 558,800 548,30017,258 19,257 1,999 11.6% State Education Property Tax 1,229,458 1,276,436 46,979 3.8% 1,963,700 2,002,600 2,027,10022,845 23,885 1,041 4.6% Real Estate Transfer Tax 129,068 133,177 4,109 3.2% 317,200 315,700 322,60079,000 110,000 31,000 39.2% Lottery Transfer (b) 332,017 353,575 21,558 6.5% 924,100 887,700 926,0009,497 8,917 (580) -6.1% Casino Wagering Tax 46,716 46,791 74 0.2% 113,200 115,000 113,0003,309 0 (3,309) -100.0% Liquor Excise Tax 18,081 15,283 (2,798) -15.5% 54,000 53,800 55,600
29,054 29,002 (52) -0.2% Cigarette/Tobacco Tax 156,507 152,050 (4,457) -2.8% 356,700 352,600 353,0001,724 2,059 334 19.4% Indus. & Comm. Facilities Taxes 10,337 11,171 833 8.1% 36,000 36,000 38,000
588 538 (50) -8.6% Specific Other 2,877 5,385 2,507 87.2% 27,700 28,300 28,300178,529 180,815 2,286 1.3% Income Tax Earmarking 1,062,126 1,157,798 95,672 9.0% $2,720,400 $2,850,000 $2,831,000
$749,808 $837,449 $87,642 11.7% TOTAL SCHOOL AID FUND $5,515,734 $5,736,293 $220,559 4.0% $12,685,100 $12,970,500 $13,084,500
$542,428 $551,655 $9,227 1.7% SALES TAX 6% $3,147,784 $3,226,655 $78,871 2.5% $7,798,000 $7,929,300 $8,026,900435,804 381,914 (53,890) -12.4% SALES TAX 4%(d) 2,218,235 2,186,998 (31,238) -1.4% 5,308,300 5,398,300 5,463,400106,624 169,741 63,117 59.2% SALES TAX 2% 929,549 1,039,657 110,108 11.8% 2,489,700 2,531,000 2,563,500119,694 192,260 72,567 60.6% USE TAX 6% (f) (h) 804,170 698,315 (105,856) -13.2% 1,467,600 1,549,300 1,517,80071,916 71,787 (128) -0.2% TOBACCO TAXES 387,394 376,362 (11,032) -2.8% 946,000 935,800 938,500
0 0 0 na TOBACCO SETTLEMENT 0 0 0 na na na na
continued
- 10 -
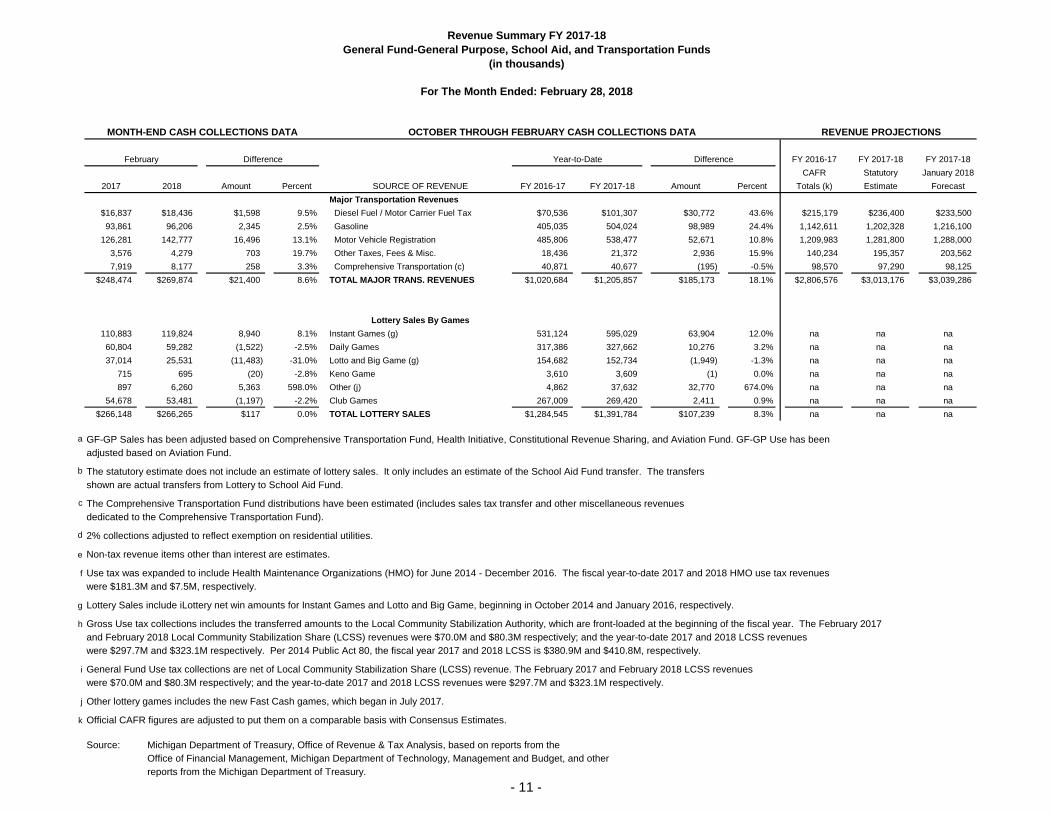
Revenue Summary FY 2017-18General Fund-General Purpose, School Aid, and Transportation Funds
(in thousands)
For The Month Ended: February 28, 2018
MONTH-END CASH COLLECTIONS DATA OCTOBER THROUGH FEBRUARY CASH COLLECTIONS DATA REVENUE PROJECTIONS
February Difference Year-to-Date Difference FY 2016-17 FY 2017-18 FY 2017-18CAFR Statutory January 2018
2017 2018 Amount Percent SOURCE OF REVENUE FY 2016-17 FY 2017-18 Amount Percent Totals (k) Estimate ForecastMajor Transportation Revenues
$16,837 $18,436 $1,598 9.5% Diesel Fuel / Motor Carrier Fuel Tax $70,536 $101,307 $30,772 43.6% $215,179 $236,400 $233,50093,861 96,206 2,345 2.5% Gasoline 405,035 504,024 98,989 24.4% 1,142,611 1,202,328 1,216,100
126,281 142,777 16,496 13.1% Motor Vehicle Registration 485,806 538,477 52,671 10.8% 1,209,983 1,281,800 1,288,0003,576 4,279 703 19.7% Other Taxes, Fees & Misc. 18,436 21,372 2,936 15.9% 140,234 195,357 203,5627,919 8,177 258 3.3% Comprehensive Transportation (c) 40,871 40,677 (195) -0.5% 98,570 97,290 98,125
$248,474 $269,874 $21,400 8.6% TOTAL MAJOR TRANS. REVENUES $1,020,684 $1,205,857 $185,173 18.1% $2,806,576 $3,013,176 $3,039,286
Lottery Sales By Games110,883 119,824 8,940 8.1% Instant Games (g) 531,124 595,029 63,904 12.0% na na na60,804 59,282 (1,522) -2.5% Daily Games 317,386 327,662 10,276 3.2% na na na37,014 25,531 (11,483) -31.0% Lotto and Big Game (g) 154,682 152,734 (1,949) -1.3% na na na
715 695 (20) -2.8% Keno Game 3,610 3,609 (1) 0.0% na na na897 6,260 5,363 598.0% Other (j) 4,862 37,632 32,770 674.0% na na na
54,678 53,481 (1,197) -2.2% Club Games 267,009 269,420 2,411 0.9% na na na$266,148 $266,265 $117 0.0% TOTAL LOTTERY SALES $1,284,545 $1,391,784 $107,239 8.3% na na na
a GF-GP Sales has been adjusted based on Comprehensive Transportation Fund, Health Initiative, Constitutional Revenue Sharing, and Aviation Fund. GF-GP Use has beenadjusted based on Aviation Fund.
b The statutory estimate does not include an estimate of lottery sales. It only includes an estimate of the School Aid Fund transfer. The transfersshown are actual transfers from Lottery to School Aid Fund.
c The Comprehensive Transportation Fund distributions have been estimated (includes sales tax transfer and other miscellaneous revenuesdedicated to the Comprehensive Transportation Fund).
d 2% collections adjusted to reflect exemption on residential utilities.
e Non-tax revenue items other than interest are estimates.
f Use tax was expanded to include Health Maintenance Organizations (HMO) for June 2014 - December 2016. The fiscal year-to-date 2017 and 2018 HMO use tax revenueswere $181.3M and $7.5M, respectively.
g Lottery Sales include iLottery net win amounts for Instant Games and Lotto and Big Game, beginning in October 2014 and January 2016, respectively.
h Gross Use tax collections includes the transferred amounts to the Local Community Stabilization Authority, which are front-loaded at the beginning of the fiscal year. The February 2017 and February 2018 Local Community Stabilization Share (LCSS) revenues were $70.0M and $80.3M respectively; and the year-to-date 2017 and 2018 LCSS revenues were $297.7M and $323.1M respectively. Per 2014 Public Act 80, the fiscal year 2017 and 2018 LCSS is $380.9M and $410.8M, respectively.
i General Fund Use tax collections are net of Local Community Stabilization Share (LCSS) revenue. The February 2017 and February 2018 LCSS revenues were $70.0M and $80.3M respectively; and the year-to-date 2017 and 2018 LCSS revenues were $297.7M and $323.1M respectively.
j Other lottery games includes the new Fast Cash games, which began in July 2017.
k Official CAFR figures are adjusted to put them on a comparable basis with Consensus Estimates.
Source: Michigan Department of Treasury, Office of Revenue & Tax Analysis, based on reports from theOffice of Financial Management, Michigan Department of Technology, Management and Budget, and otherreports from the Michigan Department of Treasury.
- 11 -
-12-
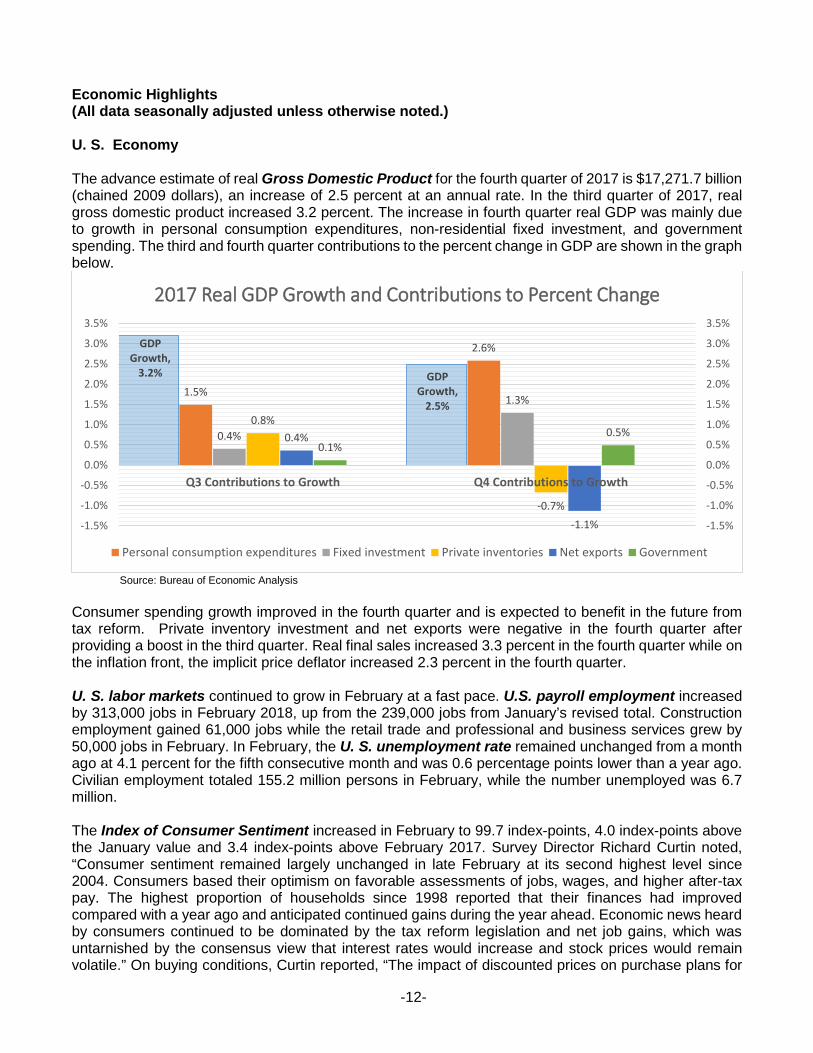
Economic Highlights (All data seasonally adjusted unless otherwise noted.) U. S. Economy The advance estimate of real Gross Domestic Product for the fourth quarter of 2017 is $17,271.7 billion (chained 2009 dollars), an increase of 2.5 percent at an annual rate. In the third quarter of 2017, real gross domestic product increased 3.2 percent. The increase in fourth quarter real GDP was mainly due to growth in personal consumption expenditures, non-residential fixed investment, and government spending. The third and fourth quarter contributions to the percent change in GDP are shown in the graph below.
Source: Bureau of Economic Analysis
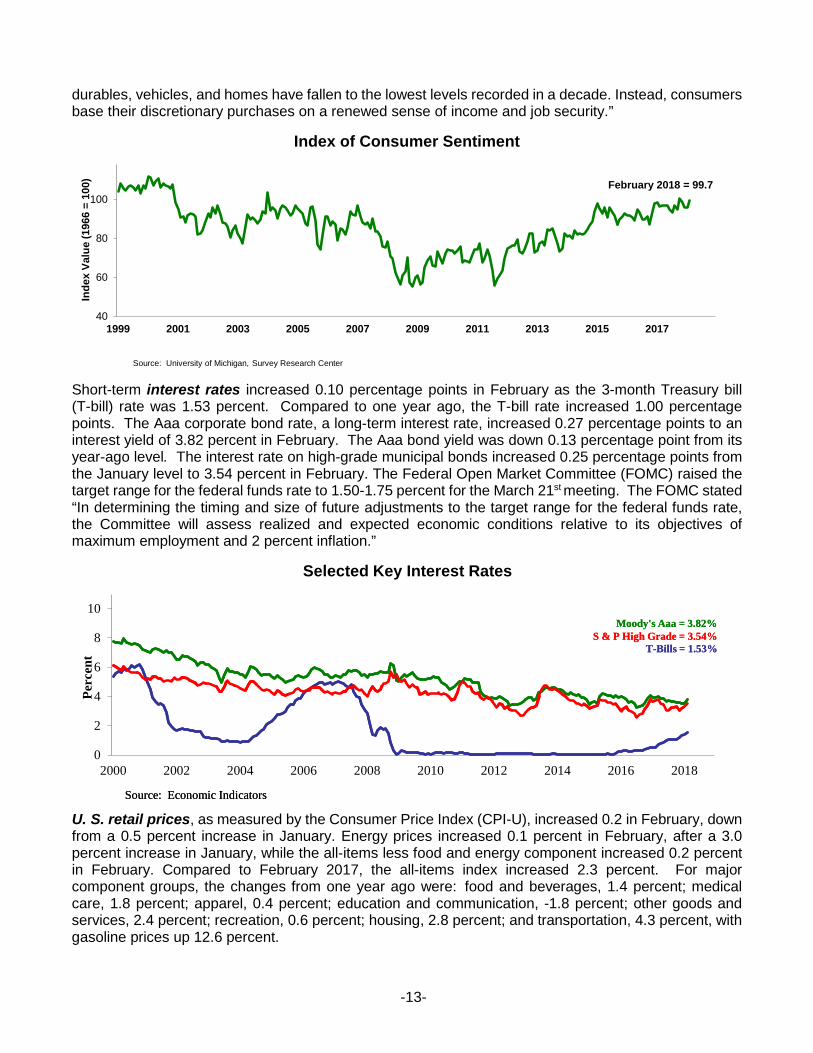
Consumer spending growth improved in the fourth quarter and is expected to benefit in the future from tax reform. Private inventory investment and net exports were negative in the fourth quarter after providing a boost in the third quarter. Real final sales increased 3.3 percent in the fourth quarter while on the inflation front, the implicit price deflator increased 2.3 percent in the fourth quarter. U. S. labor markets continued to grow in February at a fast pace. U.S. payroll employment increased by 313,000 jobs in February 2018, up from the 239,000 jobs from January’s revised total. Construction employment gained 61,000 jobs while the retail trade and professional and business services grew by 50,000 jobs in February. In February, the U. S. unemployment rate remained unchanged from a month ago at 4.1 percent for the fifth consecutive month and was 0.6 percentage points lower than a year ago. Civilian employment totaled 155.2 million persons in February, while the number unemployed was 6.7 million. The Index of Consumer Sentiment increased in February to 99.7 index-points, 4.0 index-points above the January value and 3.4 index-points above February 2017. Survey Director Richard Curtin noted, “Consumer sentiment remained largely unchanged in late February at its second highest level since 2004. Consumers based their optimism on favorable assessments of jobs, wages, and higher after-tax pay. The highest proportion of households since 1998 reported that their finances had improved compared with a year ago and anticipated continued gains during the year ahead. Economic news heard by consumers continued to be dominated by the tax reform legislation and net job gains, which was untarnished by the consensus view that interest rates would increase and stock prices would remain volatile.” On buying conditions, Curtin reported, “The impact of discounted prices on purchase plans for
1.5%
2.6%
0.4%
1.3%
0.8%
-0.7%
0.4%
-1.1%
0.1%0.5%
GDP Growth,
3.2% GDP Growth,
2.5%
-1.5%
-1.0%
-0.5%
0.0%
0.5%
1.0%
1.5%
2.0%
2.5%
3.0%
3.5%
-1.5%
-1.0%
-0.5%
0.0%
0.5%
1.0%
1.5%
2.0%
2.5%
3.0%
3.5%
Q3 Contributions to Growth Q4 Contributions to Growth
2017 Real GDP Growth and Contributions to Percent Change
Personal consumption expenditures Fixed investment Private inventories Net exports Government
-13-
durables, vehicles, and homes have fallen to the lowest levels recorded in a decade. Instead, consumers base their discretionary purchases on a renewed sense of income and job security.”
40
60
80
100
1999 2001 2003 2005 2007 2009 2011 2013 2015 2017
Inde
x Va
lue
(196
6 =
100)
Source: University of Michigan, Survey Research Center
Index of Consumer Sentiment
February 2018 = 99.7
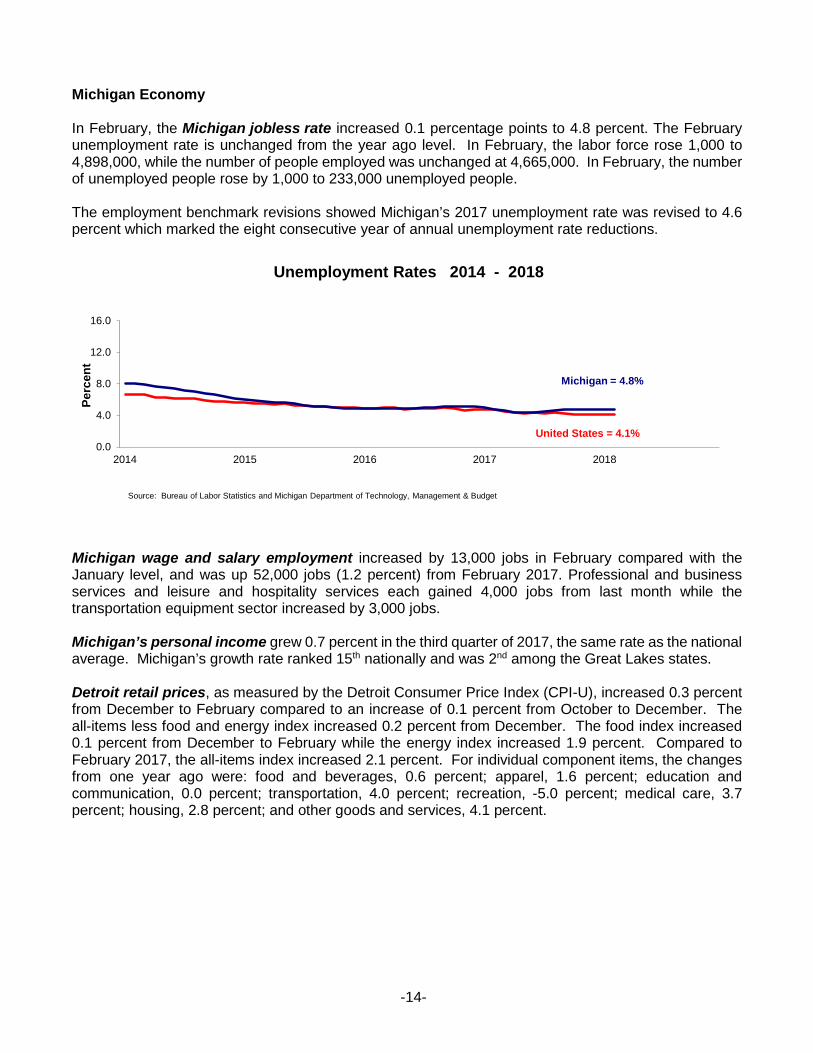
Short-term interest rates increased 0.10 percentage points in February as the 3-month Treasury bill (T-bill) rate was 1.53 percent. Compared to one year ago, the T-bill rate increased 1.00 percentage points. The Aaa corporate bond rate, a long-term interest rate, increased 0.27 percentage points to an interest yield of 3.82 percent in February. The Aaa bond yield was down 0.13 percentage point from its year-ago level. The interest rate on high-grade municipal bonds increased 0.25 percentage points from the January level to 3.54 percent in February. The Federal Open Market Committee (FOMC) raised the target range for the federal funds rate to 1.50-1.75 percent for the March 21st meeting. The FOMC stated “In determining the timing and size of future adjustments to the target range for the federal funds rate, the Committee will assess realized and expected economic conditions relative to its objectives of maximum employment and 2 percent inflation.”
0
2
4
6
8
10
2000 2002 2004 2006 2008 2010 2012 2014 2016 2018
Perc
ent
Selected Key Interest Rates
T-Bills = 1.53%
Moody's Aaa = 3.82%S & P High Grade = 3.54%
Source: Economic Indicators
T-Bills = 1.53%
Moody's Aaa = 3.82%S & P High Grade = 3.54%
Source: Economic Indicators
U. S. retail prices, as measured by the Consumer Price Index (CPI-U), increased 0.2 in February, down from a 0.5 percent increase in January. Energy prices increased 0.1 percent in February, after a 3.0 percent increase in January, while the all-items less food and energy component increased 0.2 percent in February. Compared to February 2017, the all-items index increased 2.3 percent. For major component groups, the changes from one year ago were: food and beverages, 1.4 percent; medical care, 1.8 percent; apparel, 0.4 percent; education and communication, -1.8 percent; other goods and services, 2.4 percent; recreation, 0.6 percent; housing, 2.8 percent; and transportation, 4.3 percent, with gasoline prices up 12.6 percent.
-14-
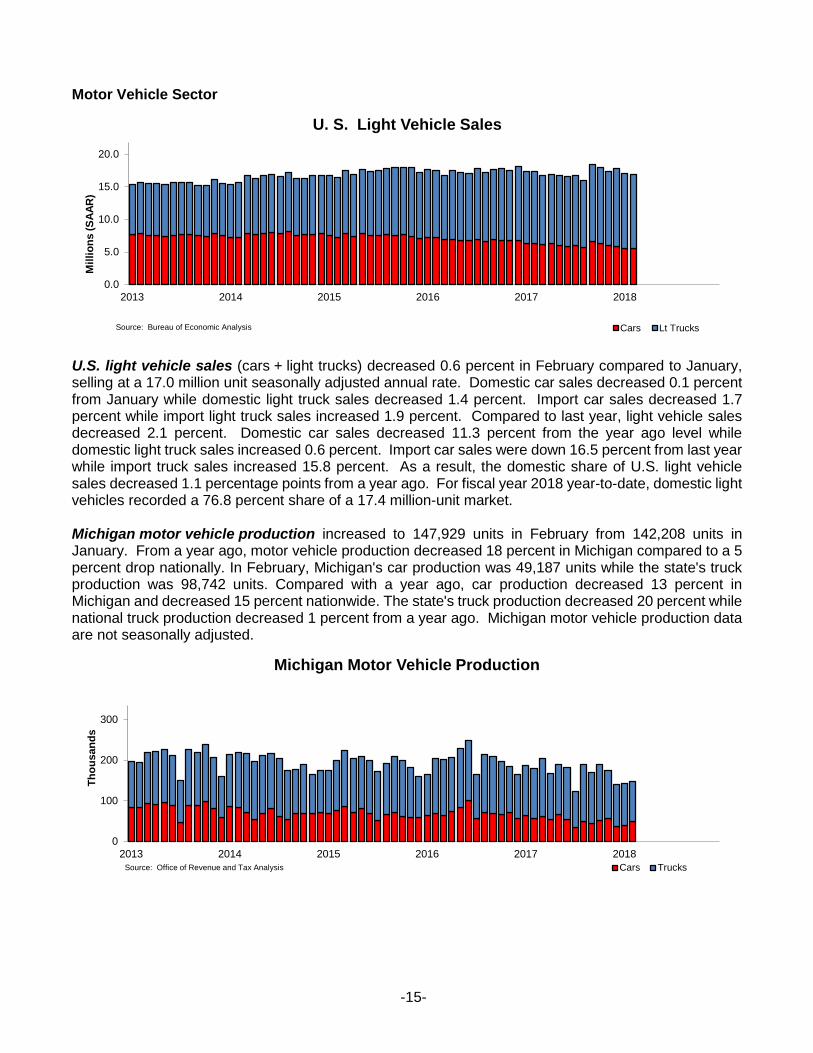
Michigan Economy In February, the Michigan jobless rate increased 0.1 percentage points to 4.8 percent. The February unemployment rate is unchanged from the year ago level. In February, the labor force rose 1,000 to 4,898,000, while the number of people employed was unchanged at 4,665,000. In February, the number of unemployed people rose by 1,000 to 233,000 unemployed people. The employment benchmark revisions showed Michigan’s 2017 unemployment rate was revised to 4.6 percent which marked the eight consecutive year of annual unemployment rate reductions.
0.0
4.0
8.0
12.0
16.0
2014 2015 2016 2017 2018
Perc
ent
Source: Bureau of Labor Statistics and Michigan Department of Technology, Management & Budget
Unemployment Rates 2014 - 2018
Michigan = 4.8%
United States = 4.1%
Michigan wage and salary employment increased by 13,000 jobs in February compared with the January level, and was up 52,000 jobs (1.2 percent) from February 2017. Professional and business services and leisure and hospitality services each gained 4,000 jobs from last month while the transportation equipment sector increased by 3,000 jobs. Michigan’s personal income grew 0.7 percent in the third quarter of 2017, the same rate as the national average. Michigan’s growth rate ranked 15th nationally and was 2nd among the Great Lakes states. Detroit retail prices, as measured by the Detroit Consumer Price Index (CPI-U), increased 0.3 percent from December to February compared to an increase of 0.1 percent from October to December. The all-items less food and energy index increased 0.2 percent from December. The food index increased 0.1 percent from December to February while the energy index increased 1.9 percent. Compared to February 2017, the all-items index increased 2.1 percent. For individual component items, the changes from one year ago were: food and beverages, 0.6 percent; apparel, 1.6 percent; education and communication, 0.0 percent; transportation, 4.0 percent; recreation, -5.0 percent; medical care, 3.7 percent; housing, 2.8 percent; and other goods and services, 4.1 percent.
-15-
Motor Vehicle Sector
0.0
5.0
10.0
15.0
20.0
2013 2014 2015 2016 2017 2018
Mill
ions
(SAA
R)
Source: Bureau of Economic Analysis
U. S. Light Vehicle Sales
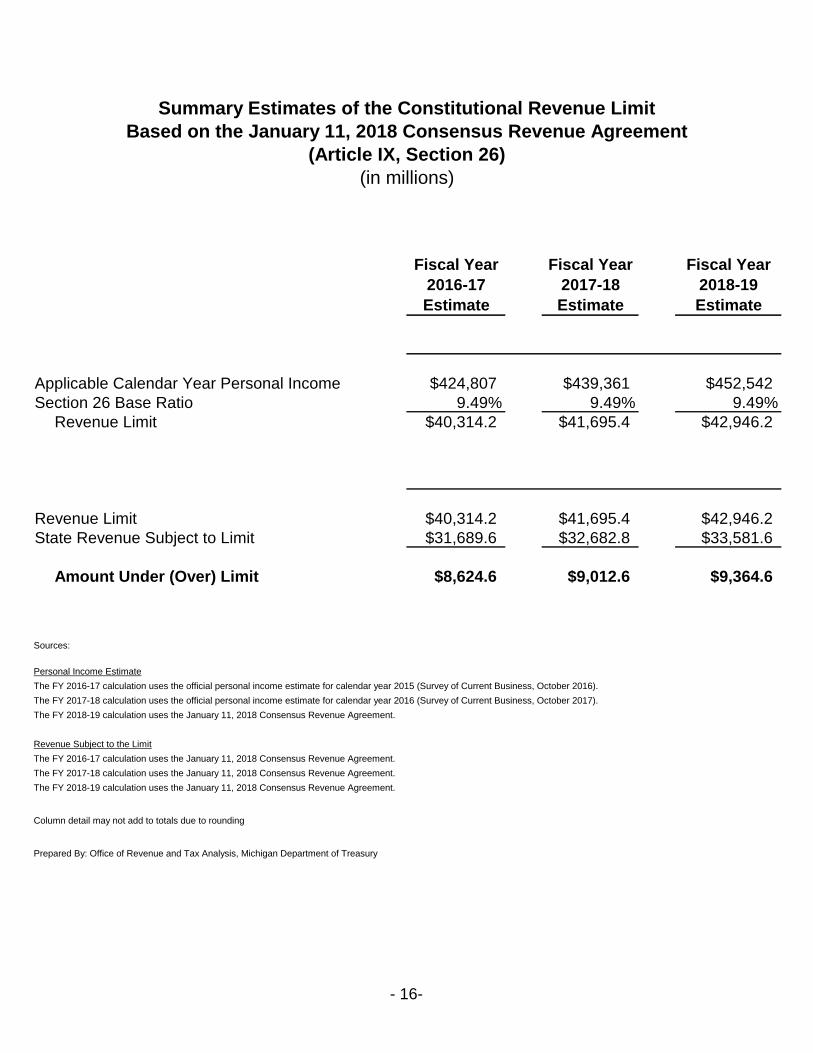
Cars Lt Trucks U.S. light vehicle sales (cars + light trucks) decreased 0.6 percent in February compared to January, selling at a 17.0 million unit seasonally adjusted annual rate. Domestic car sales decreased 0.1 percent from January while domestic light truck sales decreased 1.4 percent. Import car sales decreased 1.7 percent while import light truck sales increased 1.9 percent. Compared to last year, light vehicle sales decreased 2.1 percent. Domestic car sales decreased 11.3 percent from the year ago level while domestic light truck sales increased 0.6 percent. Import car sales were down 16.5 percent from last year while import truck sales increased 15.8 percent. As a result, the domestic share of U.S. light vehicle sales decreased 1.1 percentage points from a year ago. For fiscal year 2018 year-to-date, domestic light vehicles recorded a 76.8 percent share of a 17.4 million-unit market. Michigan motor vehicle production increased to 147,929 units in February from 142,208 units in January. From a year ago, motor vehicle production decreased 18 percent in Michigan compared to a 5 percent drop nationally. In February, Michigan's car production was 49,187 units while the state's truck production was 98,742 units. Compared with a year ago, car production decreased 13 percent in Michigan and decreased 15 percent nationwide. The state's truck production decreased 20 percent while national truck production decreased 1 percent from a year ago. Michigan motor vehicle production data are not seasonally adjusted.
0
100
200
300
2013 2014 2015 2016 2017 2018
Thou
sand
s
Source: Office of Revenue and Tax Analysis
Michigan Motor Vehicle Production
Cars Trucks
Summary Estimates of the Constitutional Revenue LimitBased on the January 11, 2018 Consensus Revenue Agreement
(Article IX, Section 26)(in millions)
Fiscal Year Fiscal Year Fiscal Year2016-17 2017-18 2018-19Estimate Estimate Estimate
Applicable Calendar Year Personal Income $424,807 $439,361 $452,542Section 26 Base Ratio 9.49% 9.49% 9.49%
Revenue Limit $40,314.2 $41,695.4 $42,946.2
Revenue Limit $40,314.2 $41,695.4 $42,946.2State Revenue Subject to Limit $31,689.6 $32,682.8 $33,581.6
Amount Under (Over) Limit $8,624.6 $9,012.6 $9,364.6
Sources:
Personal Income EstimateThe FY 2016-17 calculation uses the official personal income estimate for calendar year 2015 (Survey of Current Business, October 2016). The FY 2017-18 calculation uses the official personal income estimate for calendar year 2016 (Survey of Current Business, October 2017). The FY 2018-19 calculation uses the January 11, 2018 Consensus Revenue Agreement.
Revenue Subject to the LimitThe FY 2016-17 calculation uses the January 11, 2018 Consensus Revenue Agreement.The FY 2017-18 calculation uses the January 11, 2018 Consensus Revenue Agreement.The FY 2018-19 calculation uses the January 11, 2018 Consensus Revenue Agreement.
Column detail may not add to totals due to rounding
Prepared By: Office of Revenue and Tax Analysis, Michigan Department of Treasury
- 16-