March 2016 UK Economic Outlook - PwC · UK Economic Outlook March 2016 ... recessions in Russia and...
40
www.pwc.co.uk/economics UK Economic Outlook March 2016 The UK economic recovery: Better balanced than you might think Which industries will drive future jobs growth in the UK? Visit our blog for periodic updates at: pwc.blogs.com/economics_in_business
Transcript of March 2016 UK Economic Outlook - PwC · UK Economic Outlook March 2016 ... recessions in Russia and...

www.pwc.co.uk/economics
UK Economic Outlook
March 2016
The UK economic recovery: Better balanced than you might think
Which industries will drive future jobs growth in the UK?
Visit our blog for periodic updates at: pwc.blogs.com/economics_in_business
2 UK Economic Outlook March 2016
Contents
Section
1. Summary 4
2. UK economic prospects 7
• 2.1 Recent developments and the present situation 8
• 2.2 Economic growth prospects: national, sectoral and regional 11
• 2.3Outlookforinflationandrealearningsgrowth 14
• 2.4Monetaryandfiscalpolicy 15
• 2.5Summaryandconclusions 16
• Box 2.1: PwC Regional Economic Dashboard 17
3. The UK economic recovery: Better balanced than you might think 19
• Key points and introduction 19
• 3.1 Analysing the demand drivers of economic growth 20
• 3.2 The drivers of UK recoveries – past and present 22
• 3.3 The balance of the recovery 24
• 3.4 Conclusion 25
4. Which industries will drive future jobs growth in the UK? 26
• Key points and introduction 26
• 4.1 Long term changes in the industrial structure of UK employment 26
• 4.2 Employment and productivity growth by industry sector 30
• 4.3 Projected sectoral employment growth trends over the next decade 31
• 4.4Summaryandconclusions 34
• Box 4.1: The rise of self-employment 35
Appendices
A Outlook for the global economy 36
BUKeconomictrends:1979-2015 37
Contacts and services 38

3UK Economic Outlook March 2016
Highlights and key messages for business and public policy
Key projections
2016 2017
Real GDP growth 2.2% 2.3%
Consumer spending growth 3.0% 2.5%
Inflation (CPI) 0.5% 1.6%
Source: PwC main scenario projections
• The UK economy slowed a little in 2015butdomesticdemandgrowthremains relatively strong, helped by lower oil prices. The global outlook remains mixed with a gradual pick-upintheUSandtheEurozone,but a slowdown in China, continued recessionsinRussiaandBrazil, and increased volatility in emerging economiesandfinancialmarketsmore generally.
• In our main scenario we expect UK GDP growth to average around 2.2-2.3% in both 2016 and 2017. Consumer spending and business investment will be the main drivers of UK growth in these years.
• Risks to growth are weighted somewhat to the downside in the short term due to international risks, particularly in relation to emerging markets, as well as uncertainties relating to the EU referendum. But there are also upside possibilities if the global environment improves and productivity growth rates accelerate in the UK.
• London continues to lead the recovery with projected growth of around 3% in 2016 but all other UK regions should also register positive real growth of around 1.4-2.3% per annum this year.
• Inflationwillremainlowthisyearbutseems likely to rise back towards its 2% target by the end of 2017, so the MPC may start to raise interest rates gradually during the course of 2017 and beyond. But this now seems likely to be a very slow process and rates could still be only around 2% in 2020.
• TheBudgetislikelytoconfirmplansforfurtherfiscaltighteningtoeliminatethebudgetdeficitbefore the end of this decade. This will impose some drag on the UK economy, but the private services sector should be strong enough to offset this in terms of GDP and jobs growth.
The UK economic recovery: Better balanced than you might think
• Somecommentatorshaveexpressedconcerns about the balance of the UK economic recovery to date, but AndrewSentancearguesinthisreport that this is not backed up by the facts on growth since mid-2009. These data instead show strong positive contributions to UK growth from business investment and exports as well as, since early 2013, consumer spending.
• The UK recovery has been weaker so far than after some past recessions, but compares reasonably well to other G7 economies since the global financialcrisis,particularlyintermsof employment growth.
Jobs growth of 3 million projected by 2025
• Employment in the UK could grow byaround3millionby2025,withthe total number of jobs reaching almost 37 million.
• Education and health could add over 1millionjobsby2025andbecomethe biggest of the services sectors.
• Business services could create around 1.5millionmorejobsby2025andwill become the second biggest services sector, with distribution, hotels and restaurants in third place.
• The number of jobs in manufacturing could fall by a further 600,000 to around2millionby2025asnewautomated technologies continue to boost productivity and overseas competitionremainsfierce.Butthisshould be far outweighed by the growth in private sector services jobs.
3

4 UK Economic Outlook March 2016
1 – Summary
Recent developmentsThe UK economy grew by just under 3% in 2014, which was the fastest rate seen since 2006 and the strongest growth rate in the G7, but this eased to 2.2% in2015asglobalgrowthmoderated.
UK domestic demand growth has remained relatively strong, however, driven by rising employment, the benefitsoflowerglobaloilpricesfor UK consumers (and many businesses) and, related to this, some pick-up in realearningsgrowthin2015.
UK growth continues to be driven primarily by services, with manufacturing growth having stalled over the past year and construction trends being erratic.
Therateofconsumerpriceinflation(CPI)hasremainedclosetozeroinrecent months as commodity prices have generally remained weak, partly due to relatively subdued global demand growth. The latter has also been a factor in causing the Bank of England to hold off from interest rate rises in recent months.TheUSFederalReservedidraise rates slightly in December, but now seems to be putting off further rate rises due to perceived global risk factors.
Table 1.1: Summary of UK economic prospects
Indicator (% change on previous year)
OBR forecasts (November 2015)
Independent forecasts (February 2016)
PwC Main scenario (March 2016)
2016 2017 2016 2017 2016 2017
GDP 2.4 2.5 2.2 2.2 2.2 2.3
Consumer spending 2.6 2.3 2.6 2.2 3.0 2.5
Source: Office for Budget Responsibility (November 2015), HM Treasury survey of independent forecasts (average values in February 2016 survey) and latest PwC main scenario.
Future prospects
As shown in Table 1.1, our main scenario is for UK GDP growth to average around 2.2-2.3%% in both 2016 and 2017. This is broadly similar to the latest average of independent forecasts although slightly lower than the OBR forecasts made last November.
Consumer spending growth is projected to be somewhat stronger than overall GDP growth at around 3% in 2016, with a boost from lower oil prices and increased real earnings growth, but it may slow gradually in later years as households become reluctant to further reduce their savings ratios.
We expect reasonably strong business investment growth in 2016 and 2017, but there are some potential downside risks with this projection. Business confidencecouldbeaffectedbyincreasedinternational market volatility relating to China and other emerging markets, as well as continuing uncertainties relating toconflictsintheMiddleEastandtheplanned referendum on UK membership of the EU. But the domestic outlook still seems reasonably favourable for UK business investment.
As always there are many uncertainties surrounding our growth projections, as illustrated by the alternative scenarios inFigure1.1.Therearestillconsiderabledownside risks relating to international developments and possibly also the EU
referendum, but there are also upside possibilities if these problems can be contained and a virtuous circle of rising confidenceandspendingcanbeestablished as in past economic recoveries.
Inflationwillremainlowthisyear, but could rebound to close to its 2% target by the end of 2017 assuming there is no repeat of past falls in global energy and food prices. There could beupsideriskstothisinflationoutlookin the longer term if domestic wages continue to recover without a corresponding rise in productivity.
We do not expect any early rise in officialUKinterestrates,butagradualupward trend still seems likely from 2017 onwards. However, the Monetary Policy Committee seems to want to proceed very cautiously on this, so officialinterestratescouldstillbeonlyaround 2% by 2020. This could boost consumer borrowing and spending in the short term, but might lead to the build-up of asset price bubbles and otherfinancialmarketdistortionsin the longer term.
Thebudgetdeficitisfallinggradually,but our projections suggest that it could overshootOBRforecastsboththisfiscalyear and in the medium term, although not by a huge margin. The Chancellor is therefore likely to deliver another tough Budget on 16th March, though we would not expect radical changes to the tax and spending plans he announced last year.

5UK Economic Outlook March 2016
The UK economic recovery: Better balanced than you might think
We are now nearly seven years into the UK economic recovery from its low point in Q2 2009, so it seems timely to take stock of what kind of recovery this has beentodate.AndrewSentance,oursenioreconomic adviser, takes a detailed look at thisquestioninSection3ofthisreport,with the following main conclusions:
• UK economic growth since the financialcrisishasbeendisappointing relative to past recoveries, but not in relation to other G7 economies.
• The main reason for relatively weak growth since 2009 was sluggish consumer spending in the period to 2012, when households where hit by a “perfect storm” of rising VAT, high food and energy prices, and tough lending restrictions from banks. However, consumer spending growth has been stronger since 2013 as these headwinds eased and food and energy prices fell back.
Figure 1.1 – Alternative UK GDP growth scenarios
-8
-6
-4
-2
0
2
4
6
2017Q1
2016Q1
2015Q1
2014Q1
2013Q1
2012Q1
2011Q1
2010Q1
2009Q1
2008Q1
2007Q1
Projections
% c
hang
e on
a y
ear e
arlie
r
Main scenario Renewed slowdown Strong recovery
Source: PwC based on latest ONS data
• Global headwinds do not seem to be responsible for subdued growth. The export contribution to UK growth has been broadly in line with historical trends and previous recovery periods.
• Business investment has also rebounded reasonably strongly since mid-2009 after being hit hard by the recession (although it did falter in late2015accordingtopreliminaryONSestimates).
• Looking ahead, a key risk is that this relatively well balanced recovery does not last, particularly against the background of extremely low interest rates. However, the record to date gives grounds for cautious optimism.

6 UK Economic Outlook March 2016
Number of jobs (millions) Growth rates (per annum)
Industry 1997 2015 2025(projected)
1997-2015 2015-2025(projected)
Agriculture, forestry & fishing 0.5 0.4 0.4 -0.9% -0.9%
Construction 1.8 2.2 2.4 1.1% 0.6%
Manufacturing 4.3 2.6 2.0 -2.6% -2.6%
Energy and water 0.3 0.4 0.4 0.8% 0.8%
Distribution, hotels and restaurants
6.6 7.2 7.5 0.5% 0.5%
Transport and communication
2.2 2.9 3.2 1.6% 1.2%
Financial services 1.1 1.1 1.2 0.2% 0.2%
Business services 3.9 6.3 7.9 2.8% 2.3%
Public administration, defence and security
1.6 1.5 1.3 -0.4% -1.0%
Education and health 5.0 7.1 8.3 2.0% 1.5%
Other services 1.5 1.9 2.2 1.5% 1.5%
Total services 21.8 28.0 31.6 1.4% 1.2%
Total Jobs 28.8 33.7 36.9 0.9% 0.9%
Source: PwC projections and ONS historical data
Table 1.2: UK employment growth rates 1997-2015 and 2015-2025UK could generate 3 million extra jobs by 2025, led by services
The dominant story of the last century has been the rise of services to its current position as the source of over 80% of total UK employment. Manufacturing now accounts for less than 10% of UK jobs and there is little prospect of this reversing, while health and education and business services have been the biggest growth areas for jobs since the late 1970s.
Lookingahead,ouranalysisinSection4of this report (as summarised in Table 1.2) suggests that over the next decade:
• Employment in the UK could grow byaround3millionby2025,withthe total number of jobs reaching almost 37 million.
• Education and health could add over 1millionjobsby2025andbecomethe biggest of the services sectors.
• Business services could create around1.5millionmorejobsby2025andbecomethesecondbiggestservices sector, with distribution, hotels and restaurants in third place.
• The number of jobs in manufacturing could fall by a further 600,000 to around2millionby2025asnewautomated technologies continue to boost productivity and overseas competitionremainsfierce.
• Around150,000jobscouldbelostinpublic administration, defence and social security as austerity measures continue at least until 2020.

7UK Economic Outlook March 2016
2 – UK Economic prospects
Key points• The UK economy has continued its
pattern of steady services-led growth over the past year, although the pace of expansion has moderated.
• In our main scenario, we project the UK economy to grow at around 2.2-2.3% in both 2016 and 2017, down from its recent peak of 2.9% in 2014, but still one of the strongest performances in the G7 along withtheUS.
• Consumer spending growth is projected to be around 3% in 2016, boosted by rising employment and positive real earnings growth as inflationremainsverylow.Weexpect some moderation in real consumer spending growth later as theinflationeffectfades,butitshould remain relatively strong at around2.5%in2017.
• Business investment is projected to be the other main driver of UK growth in 2016-17, although uncertainty surrounding the EU referendum is a downside risk here.
• Servicesectorgrowthhasledthewaysince the recovery began in mid-2009 and this will continue in 2016-17. Manufacturing has weakened due to continued sluggish growth in the euro area and other key export markets, while construction growth has been volatile.
• We project that London will be the fastest growing region in 2016 with an output increase of around 3%. Most other UK regions are expected to see positive growth of around 1.7-2.3% in 2016, but Northern Ireland will continue to lag behind somewhat with projected growth of 1.4%.
• The UK recovery is still exposed to downside global risks related to possible problems in China and some other large emerging economies leading to further volatility and weaknessininternationalfinancialmarkets. However, there are also upsides including the continued feedthrough to consumers of the benefitsoflowoilpricesandthepossibilityoffurthersignificant jobs growth.
• The Bank of England seems likely to keep interest rates at their record low of0.5%forsometime,withverygradual increases now not expected to begin until 2017. This should help to support consumer spending and business investment in the short term, but could add to the risk of asset price bubbles in the longer term.
• Thebudgetdeficithasbeenonagradual decreasing trend, but could overshoot the OBR’s projections somewhat both this year and in the medium term. The Chancellor is therefore likely to deliver another tough Budget on 16th March.
IntroductionIn this section of the report we describe recent developments in the UK economy and review future prospects. The discussion covers:
Section2.1 Recentdevelopments and the present situation
Section2.2 Economicgrowth prospects: national, sectoral and regional
Section2.3 Outlookforinflationand real earnings growth
Section2.4 Monetaryandfiscal policy options
Section2.5 Summaryandconclusions

8 UK Economic Outlook March 2016
Figure 2.1 – Two phases of UK economic recovery
Source: ONS
2.1 Recent developments and the present situation
The UK’s recovery has slowed from 2.9% in2014to2.2%in2015,butremainsclose to its long term trend rate. This slowdownreflectssluggishglobalgrowth as well as the fact that unemployment has now fallen back to pre-crisislevelsofaround5%,sothereis less spare capacity in the economy.
We should take a long-term perspective on this, however, and looking at the recovery period as a whole since mid-2009(seeFigure2.1)weseetwomain periods:
• an initial period from Q3 2009 to the end of 2012 when growth was relativelysluggishataround1.5%per annum, held back by a mixture of consumer and business caution, problems in the euro area and the UKfiscalconsolidation;and
• a period from early 2013 onwards when the euro area crisis eased, businessandconsumerconfidencerevived and domestic demand growth picked up accordingly, leading to stronger growth averaging around2.5%uptotheendof2015.Import growth has outpaced export growth over this second period, however, contributing to a widening currentaccountdeficit(althoughthelatter was more due to a decline in net investment income from abroad than changes in trade balances)1.
A more detailed discussion of the balance of the recovery to date is providedbyAndrewSentance,PwC’ssenioreconomicadviser,inSection3 of this report.
0
1
2
3
4
5
6
ImportsExportsInvestment GovernmentSpending
ConsumerSpending
GDP
Q3 2009 - Q4 2012 Q1 2013 - Q4 2015
Aver
age
% c
hang
e pe
r ann
um
Figure 2.2 – Sectoral output and GDP trends
Source: ONS
75
80
85
90
95
100
105
110
115
2015 Q12014 Q12013 Q12012 Q12011 Q12010 Q12009 Q12008 Q12007 Q1
Inde
x (Q
1 20
07 =
100
)
Services ManufacturingGDP Construction
Services
GDP
Manufacturing
Construction
Services continue to lead the way
Manufacturing output has been gradually decreasing over the past 12 months,followingarelativelyflatperiodsinceearly2011(seeFigure2.2).
Output in the construction industry has been volatile in recent years, with a period of relatively strong growth from early2013tomid-2015followedbyarenewed decline in the second half of
1 ThecurrentaccountdeficitwasdiscussedinmoredetailintheNovember2015issueofthisreport,withtheconclusionthatitwasnotyetamajorsourceofconcern,but did need to be monitored for any signs of further deterioration. It could also be a source of future sterling weakness.
2015accordingtoofficialdata.Thismaypartlyreflectsomecoolingoftheearlierrecovery in housebuilding, as well as a moderation in civil engineering activity. However,figuresfromtheConstructionPurchasing Managers’ Index (PMI) have generally remained stronger than the officialdatathrough2015andsignalcontinued growth into early 2016, albeit at a slower pace than before.

9UK Economic Outlook March 2016
Figure 2.3 – Purchasing Managers’ Indices of business activity
Source: Markit/CIPS
30
35
40
45
50
55
60
65
2016Jan
2015Jan
2014Jan
2013Jan
2012Jan
2011Jan
2010Jan
2009Jan
2008Jan
2007Jan
Services Manufacturing
Services
ManufacturingAbove 50 indicates rising activity levels
Services,however,isthekeysectorforthe UK economy and has generally seen much stronger and steadier growth since 2009 than either manufacturing or construction,asFigure2.2shows.Thishas been associated with exceptionally strong jobs growth in services, particularly since 2012, as discussed in moredetailinSection4below.
ThelatestMarkit/CIPSPurchasingManagers’Indices(Figure2.3)showboth manufacturing and services remainingabove50,indicatingrisinglevels of activity, but both are down from their peak levels in 2014. As with officialoutputdata,thePMIindicesseeservices growth as being consistently stronger than manufacturing and still sufficientlyhightokeepthedomesticUK recovery going through early 2016.
Jobs growth remains stronger than productivity
As noted above, jobs growth has been very strong in the UK for the past three years with the unemployment rate falling backtopre-crisislevelsofaround5%.However, this has been at the expense of relatively muted productivity growth overthisperiod,asshowninFigure2.4.
AndrewSentance,oursenioreconomicadviser, looked in detail at the reasons forthisintheJuly2015editionofUKEconomic Outlook, highlighting the factor that this was largely driven by weakness in productivity growth in the financialservices,energyandpublicsectors. Other private services sectors and manufacturing have shown stronger productivity growth since mid-20092.
Figure 2.4 – Employment rising strongly but productivity has been weaker
Source: ONS
94
96
98
100
102
104
106
2015Q1
2014Q1
2013Q1
2012Q1
2011Q1
2010Q1
2009Q1
2008Q1
2007Q1
Inde
x (Q
1 20
07 =
100
)
Output per job Workforce jobs
Jobs
Productivity
2 Seefullarticleat:http://www.pwc.co.uk/services/economics-policy/insights/uk-economic-outlook/ukeo-july-15-summary.html
10 UK Economic Outlook March 2016
Figure 2.6 – Equity market indices
Source: Thomson Reuters Datastream
40
60
80
100
120
140
160
180
200
220
240
2016Jan
2015Jan
2014Jan
2013Jan
2012Jan
2011Jan
2010Jan
2009Jan
2008Jan
2007Jan
Inde
x (J
anua
ry 2
007
= 1
00)
FTSE 100 Euronext 100 Dow Jones Industrial
US
UK
Eurozone
Shanghai
Shanghai
Figure 2.5 – Consumer confidence and retail sales
Sources: PwC Consumer survey, ONS data for retail sales
-0.6
-0.5
-0.4
-0.3
-0.2
-0.1
0.0
0.1
90
95
100
105
110
115
120
Cons
umer
con
fiden
ce (n
et b
alan
ce)
Reta
il sa
les
inde
x (J
an 2
007
= 1
00)
Consumer confidence (LHS) Retail sales volume (RHS)
2008April
2010Dec
Consumer confidence
Retail sales volume
2014Nov
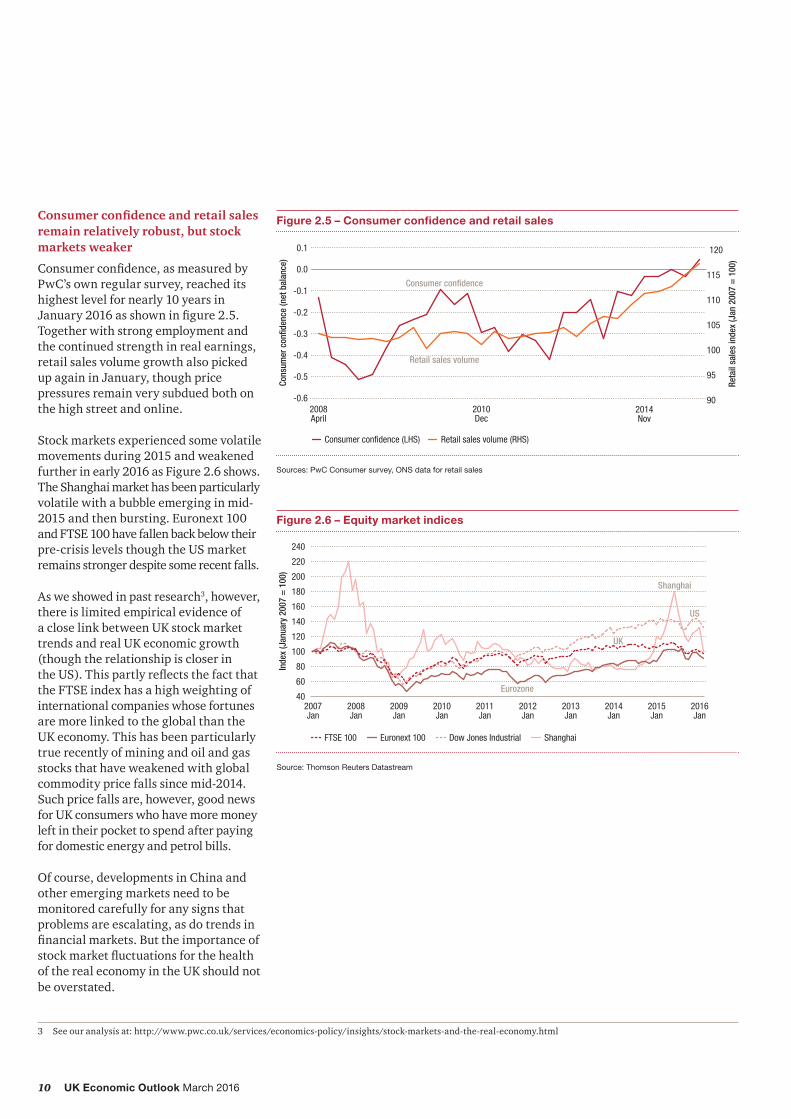
Consumer confidence and retail sales remain relatively robust, but stock markets weaker
Consumerconfidence,asmeasuredbyPwC’s own regular survey, reached its highest level for nearly 10 years in January2016asshowninfigure2.5.Together with strong employment and the continued strength in real earnings, retail sales volume growth also picked up again in January, though price pressures remain very subdued both on the high street and online.
Stockmarketsexperiencedsomevolatilemovementsduring2015andweakenedfurtherinearly2016asFigure2.6shows.TheShanghaimarkethasbeenparticularlyvolatile with a bubble emerging in mid- 2015andthenbursting.Euronext100 andFTSE100havefallenbackbelowtheirpre-crisislevelsthoughtheUSmarketremains stronger despite some recent falls.
As we showed in past research3, however, there is limited empirical evidence of a close link between UK stock market trends and real UK economic growth (though the relationship is closer in theUS).ThispartlyreflectsthefactthattheFTSEindexhasahighweightingofinternational companies whose fortunes are more linked to the global than the UK economy. This has been particularly true recently of mining and oil and gas stocks that have weakened with global commodity price falls since mid-2014. Suchpricefallsare,however,goodnewsfor UK consumers who have more money left in their pocket to spend after paying for domestic energy and petrol bills.
Of course, developments in China and other emerging markets need to be monitored carefully for any signs that problems are escalating, as do trends in financialmarkets.Buttheimportanceofstockmarketfluctuationsforthehealthof the real economy in the UK should not be overstated.
3 Seeouranalysisat:http://www.pwc.co.uk/services/economics-policy/insights/stock-markets-and-the-real-economy.html

11UK Economic Outlook March 2016
2.2 Economic growth prospects: national, sectoral and regional
SincethelastUKEconomicOutlookinNovember we have revised down our main scenario for UK growth slightly but we still expected reasonably stable growthofaround2-2.5%perannumin2016-17 as summarised in Table 2.1.
We expect the annual growth rate of consumer spending to remain strong at around3%in2016justasitwasin2015.We then expect it to moderate somewhat in 2017 and beyond, however, as households become more reluctant to run down their savings ratio further to keep spending growth going. Nonetheless, with employment continuing to rise, consumer spending growth should continue to be an important contributor to UK growth for the next few years.
Business investment growth should also remain relatively strong barring any verysignificantdeteriorationintheglobal economic outlook. Uncertainties surrounding the EU referendum represent a potential dampening factor here, however, particularly as regards foreign direct investment to the UK in the event of a vote to leave the EU in June. We treat this as a downside risk to our main scenario, but one for which businesses should make appropriate contingency plans.
Government consumption remains moderate though still positive in real terms,giventhatfuturefiscalconsolidation will proceed at a relatively modest pace and will now partly be achieved through tax rises rather than spending cuts following the Chancellor’s decisions last year.
Table 2.1 - PwC main scenario for UK growth and inflation
% real annual growth unless stated otherwise
2015 2016p 2017p
GDP 2.2% 2.2% 2.3%
Consumer spending 3.0% 3.0% 2.5%
Government consumption 1.6% 1.6% 1.1%
Fixed investment 4.2% 3.1% 4.5%
Domestic demand 2.7% 2.6% 2.5%
Net exports (% of GDP) -0.5% -0.6% -0.2%
CPI inflation (%: annual average) 0.0% 0.5% 1.6%
Source: ONS for 2015, PwC main scenario projections for 2016-17
Table 2.2: Official and independent forecasts
(% real YoY growth unless stated otherwise)
Latest estimates
OBR forecasts (November 2015)
Average independent forecast (Feb 2016)
2015 2016 2017 2016 2017
GDP 2.2% 2.4% 2.5% 2.2% 2.2%
Manufacturing output -0.2% N/A N/A 0.7% 1.7%
Consumer spending 3.0% 2.6% 2.3% 2.6% 2.2%
Fixed investment 4.2% 5.4% 5.1% 4.0% 4.1%
Government consumption 1.6% 0.4% 0.6% 1.0% 0.4%
Domestic demand 2.7% 2.6% 2.5% 2.4% 2.2%
Exports 5.0% 3.4% 3.5% 3.2% 4.3%
Imports 6.2% 3.9% 3.4% 3.9% 4.0%
Current account (£bn) -80 -79 -59 -76 -66
Unemployment claimant count (Q4, m) 0.8 0.8 0.8 0.8 0.7
Source: ONS for 2015 estimates, OBR Economic and Fiscal Outlook (November 2015), HM Treasury survey of independent forecasters (February 2016).

12 UK Economic Outlook March 2016
Figure 2.7 – Alternative UK GDP growth scenarios
Source: ONS, PwC scenarios
-8
-6
-4
-2
0
2
4
6
2017Q1
2016Q1
2015Q1
2014Q1
2013Q1
2012Q1
2011Q1
2010Q1
2009Q1
2008Q1
2007Q1
Projections
% c
hang
e on
a y
ear e
arlie
r
Main scenario Renewed slowdown Strong recovery
UK net exports again made a negative contributiontoGDPgrowthin2015andwe would expect this to continue in 2016, although it should fade in 2017 as we are assuming a gradual revival in growth in theUSandtheeuroareainthatyear,helped by a feed-through from lower oil prices to these economies, which are all net oil importers.
Overall, our growth projections are broadly similar to the latest average of independent forecasters, as shown in Table 2.2. They are somewhat lower than the forecasts made by the OBR last November, but we would expect these to be edged down in the OBR’s Budget forecasts on 16th March.
Alternative growth scenarios
In addition to our main scenario as outlined in Table 2.1, we have also considered two alternative UK growth scenarios,asshowninFigure2.7.
• Our ‘strong recovery’ scenario projects growth picking up again toaround3.5%in2017.Thisisarelatively optimistic scenario which assumesthatrecentfinancialmarketweakness is quickly reversed, supportedbyaboosttoUSandeuroarea growth from lower oil prices, all of which will help to bolster consumer andbusinessconfidenceintheUK.
• On the other hand, our ‘renewed slowdown scenario’ sees UK GDP growthfalltoclosetozeroin2017asthe global outlook worsens and there are disruptive effects from a possible vote to Leave in the EU referendum in June, which would probably be followed by a prolonged period of uncertainty while negotiations took place as to the nature of future trading relationships with the rest of the EU after UK exit. Under Article 50,thesenegotiationscouldtakeupto two years, although in practice it could take even longer to put all aspects of a new UK/EU relationship in place on trade and other issues.
We do not believe that these alternative scenarios are the most likely outcome, but they are certainly possible and, at present, risks do appear to be weighted to the downside given recent global volatility and the uncertainties posed by the EU referendum. Businesses would therefore be well advised to make appropriate contingency plans for such less favourable outcomes, but without losing sight of the more positive possibilities for the UK economy should these downside risks not materialise.

13UK Economic Outlook March 2016
Table 2.3: UK sector dashboard
Growth
Sector and GVA share 2015 2016 2017 Key issues/trends
Manufacturing (10%) -0.2% 0.2% 1.7% Manufacturing PMI fell in February and official data showed declining output in late 2015.
Sluggish Eurozone economy has limited growth of UK manufacturing exports.
Construction (6%) 3.3% 0.2% 2.4% The construction sector fell back in the second half of last year according to official data, reversing earlier strong output growth.
Construction PMI suggests a more optimistic picture, but does indicate a fall in the pace of growth in a fall in the pace of growth in January and February 2016.
Distribution, hotels & restaurants (14%)
4.8% 4.0% 3.0% ONS figures show that retail sales volume growth picked up sharply in January after dipping in December, though prices continue to fall on the high street and online due to fierce competition.
Positive real earnings growth and continued increases in employment have lifted consumer purchasing power given recent very low rate of inflation.
Business services and finance (31%) 2.5% 3.1% 3.4% Business services and finance sector continues to show relatively strong growth despite some volatility quarter to quarter.
Services PMI fell back in February, but remains above 50 so is still signalling gradual growth.
Financial sector faces regulatory challenges but business services have been stronger in recent years.
Government and other services (23%) 0.3% 0.8% 0.8% Civil service and local authority spending is expected to be cut back in real terms over the next few years, but growth should remain positive for the NHS and schools.
Total GDP 2.2% 2.2% 2.3%
Sources: ONS for 2015, PwC for 2016 and 2017 main scenario projections and key issues. These are five of the largest sectors but they do not cover the whole economy - their GVA shares only sum to around 84% rather than 100%.
Growth likely to remain stronger in services than manufacturing
The sector dashboard in Table 2.3 shows theactualgrowthratesfor2015alongwith our projected growth rates for 2016 and2017forfiveofthelargestsectorswithin the UK economy.
The table also includes a summary of the key issues affecting each sector. The outlook is clearly stronger for privatenon-financialservicesthanothersectors, as we also discuss in much more detailforjobprospectsinSection4 of this report.

14 UK Economic Outlook March 2016
Regional prospects: London continues to lead the way
London is expected to continue to lead the regional growth rankings in 2016, expanding by around 3% as shown inFigure2.8.Mostotherregionsareexpected to expand at rates closer to the UK average of around 2%, but Northern Ireland is expected to lag behind somewhat with growth of around 1.4%.
It is important to note, however, that regional output data are published on a much less timely basis than national data. As a result, the margins of error around these regional projections are even larger than for the national growth projections and so they can only be taken as illustrative of broad directional trends.
There is also a strong case to look at a broader range of indicators of regional economic performance and we have developed a new PwC Regional Economic Dashboard to do this as presented in Box 2.1 at the end of this section. While London still scores relatively well on most of the indicators we consider, all regions are shown to have both areas of strength to build on as well as areas where more development is needed.
Figure 2.8 – PwC main scenario for output growth by region in 2016
Source: PwC analysis
0.0
0.5
1.0
1.5
2.0
2.5
3.0
3.5
N IrelandWestMidlands
WalesNorthEast
ScotlandYorkshire &Humberside
NorthWest
EastMidands
SouthWest
EastAnglia
UKSouth EastLondon
% g
row
th b
y re
gion
3.1%
2.3% 2.2% 2.1% 2.1% 1.9% 1.9%1.8% 1.8% 1.7% 1.7% 1.6% 1.4%
2.3 Outlook for inflation and real earnings growth
Consumerpriceinflation(CPI)pickedup slightly to 0.3% in the year to January, which is its highest rate for a year but still very low by UK historical standards. The major cause of this persistently subduedinflationisthelowlevelofglobalprices for oil and other commodities, but unit labour costs also remain relatively well behaved for the moment despite the tightening of the labour market.
Alternative inflation scenarios
In our main scenario we are projecting an averageconsumerpriceinflationrateof0.5%in2016,whichwehavereviseddownsince our last Economic Outlook report in the face of further weakness in global commodity prices in early 2016. We do, however, then see a gradual rise back to close to the 2% target rate by the end of 2017(seeFigure2.9)asthesecommodityprice effects are assumed to fall out of the 12monthinflationratecalculationandtheeffect of the recent fall in the pound comes through4. This is broadly in line with the latest independent and Bank of England forecastsforinflation,butissubjecttosignificantuncertaintiesasalways.
To capture these we have considered two alternativescenariosforUKinflation:
• In our ‘high inflation’ scenario we projectinflationtoaveragejustover1% in 2016 as a result of stronger UK and global demand growth and an associated pick-up in oil and other commodity prices. In this case, the UK inflationratecouldrisetoanaverageof over 3% by the second half of 2017, potentially prompting sharper than expected interest rate rises.
• In our ‘low inflation’ scenario, by contrast, the UK and global economies would weaken, as would global commodity prices. In this case UKinflationcouldfallbackintonegative territory in late 2016 and 2017 and interest rates would remain nearthezerobound.
As with our GDP growth scenarios, these alternative variants are not as likely as our main scenario, but given recent volatility and uncertainty, businesses should plan for such contingencies.
4 FuturemovementsinsterlingmaywellbeaffectedbytheEUreferendumoutcome,butwedonottrytomakeanypredictionofthathere.Inourmainscenarioweadopt the conventional assumption of a stable trade-weighted exchange rate for sterling.
15UK Economic Outlook March 2016
Figure 2.10 – CPI inflation vs average earnings growth
Source: ONS, PwC analysis
0
1.0
2.0
3.0
4.0
5.0
20172016201520142013201220112010200920082007200620052004200320022001
Average weekly earnings (excl bonus)CPI
% c
hang
e p.
a.
Projections
Real squeeze
Earnings
CPI
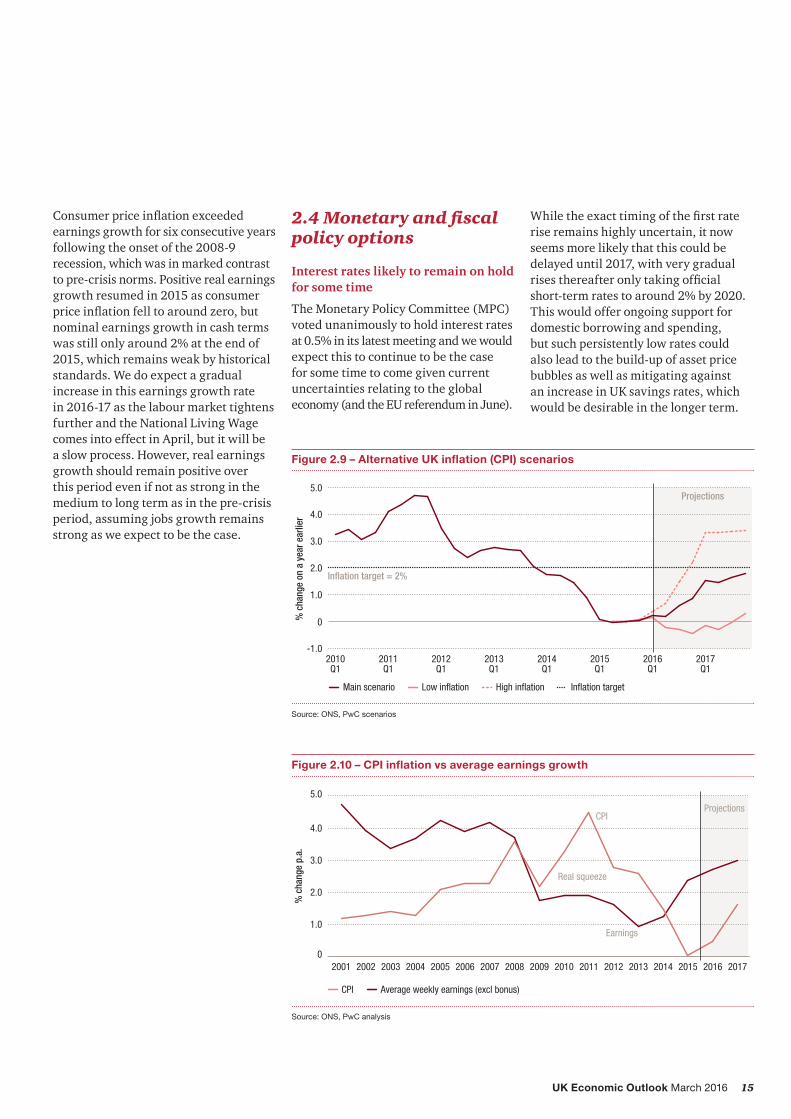
Consumerpriceinflationexceededearnings growth for six consecutive years following the onset of the 2008-9 recession, which was in marked contrast to pre-crisis norms. Positive real earnings growthresumedin2015asconsumerpriceinflationfelltoaroundzero,butnominal earnings growth in cash terms was still only around 2% at the end of 2015,whichremainsweakbyhistoricalstandards. We do expect a gradual increase in this earnings growth rate in 2016-17 as the labour market tightens further and the National Living Wage comes into effect in April, but it will be a slow process. However, real earnings growth should remain positive over this period even if not as strong in the medium to long term as in the pre-crisis period, assuming jobs growth remains strong as we expect to be the case.
2.4 Monetary and fiscal policy options
Interest rates likely to remain on hold for some time
The Monetary Policy Committee (MPC) voted unanimously to hold interest rates at0.5%initslatestmeetingandwewouldexpect this to continue to be the case for some time to come given current uncertainties relating to the global economy (and the EU referendum in June).
Figure 2.9 – Alternative UK inflation (CPI) scenarios
Source: ONS, PwC scenarios
Projections
-1.0
0
1.0
2.0
3.0
4.0
5.0
2017Q1
2016Q1
2015Q1
2014Q1
2013Q1
2012Q1
2011Q1
2010Q1
% c
hang
e on
a y
ear e
arlie
r
Main scenario Low inflation High inflation
Inflation target = 2%
Inflation target
Whiletheexacttimingofthefirstraterise remains highly uncertain, it now seems more likely that this could be delayed until 2017, with very gradual risesthereafteronlytakingofficialshort-term rates to around 2% by 2020. This would offer ongoing support for domestic borrowing and spending, but such persistently low rates could also lead to the build-up of asset price bubbles as well as mitigating against an increase in UK savings rates, which would be desirable in the longer term.

16 UK Economic Outlook March 2016
Chancellor likely to deliver another tough Budget
TheUKbudgetdeficitstoodataround£67billioninthefirsttenmonthsofthe2015/16fiscalyear.Thiswasaround£10 billion lower than in the same monthsin2014/15,butstillappears to run a risk of overshooting slightly theOBR’sNovember2015forecastof a£73.5billiondeficitin2015/16asawhole, given that there was a combined £15billionnetdeficitinFebruaryandMarch last year.
Moresignificant,however,isthemediumterm outlook for public borrowing. As Table 2.4 shows, our main scenario projection is that this should fall over time but somewhat less rapidly than the OBR projected in November. This is partly as we expect slightly lower nominal GDP growth and partly as we are slightly less optimistic than the OBR about the ratio of tax revenues to GDP going forward.
These differences are not great relative to the margins of error around any such mediumtermpublicfinanceprojections,but they do suggest that the Chancellor may only broadly meet his balanced budget objective by the end of the Parliament, rather than building up a £10 billion surplus as the last OBR forecasts suggested.
Giventhisslightlylessfavourablefiscaloutlook, we think the Chancellor will needtoreaffirmhistoughfiscalstancein the Budget on 16th March. If anything, hemayerronthesideofsomenetfiscaltightening, although we would not expect him to diverge too far from the tax and spending plans set out last year.
2.5 Summary and conclusions
UK economic growth slowed a little in 2015,butremainsclosetoitslong-termtrend of just over 2% per annum and we expect this to continue in 2016-17. This would still leave the UK, along with the US,asoneofthestrongestgrowingeconomies in the G7.
Consumer spending continues to provide the primary driver of UK growth, supported by a recent pick-up inrealearningsgrowthasinflationhasfallentoclosetozero,aswellasacontinued strong pace of jobs growth. Real consumer spending growth may moderate somewhat in 2017 and beyond,however,asinflationreturns to more normal levels and households become reluctant to reduce their savings rates further.
Business investment should also make a positive contribution to growth in 2016-17, though this is more vulnerable toadverseglobalshockstoconfidence,which remain the main downside risks to the UK economic outlook together with uncertainties surrounding the EU referendum vote in June.
The public sector is likely to be a drag on growth for the next 3-4 years as the Chancellor pursues his objective ofeliminatingthebudgetdeficit by 2019/20. This is likely to require another tough Budget on 16th March. However, the strength of the private services sector should keep the UK domestic recovery on track in the short term unless we suffer very severe external shocks.
We expect earnings growth to pick up gradually as the labour market tightens, so we would expect the Monetary Policy Committee to start raising interest rates at some point, but this may be delayed until 2017 based on recent MPC statements. This should offer further support for consumer borrowing and spending in the short term, but could add to the risk of asset price bubbles and other financialmarketdistortionsinthelongerterm if rates remain lower for longer.
Table 2.4 – Comparison of PwC and OBR public borrowing projections
Public sector net borrowing (£ billion)* 2015/16 2016/17 2017/18 2018/19 2019/20
OBR forecast (November 2015) 74 50 25 5 -10
PwC main scenario (March 2016) 76 59 37 18 1
Source: OBR Economic and Fiscal Outlook (November 2015), PwC main scenario
*Excluding borrowing of public sector banks but including borrowing of housing associations
17UK Economic Outlook March 2016
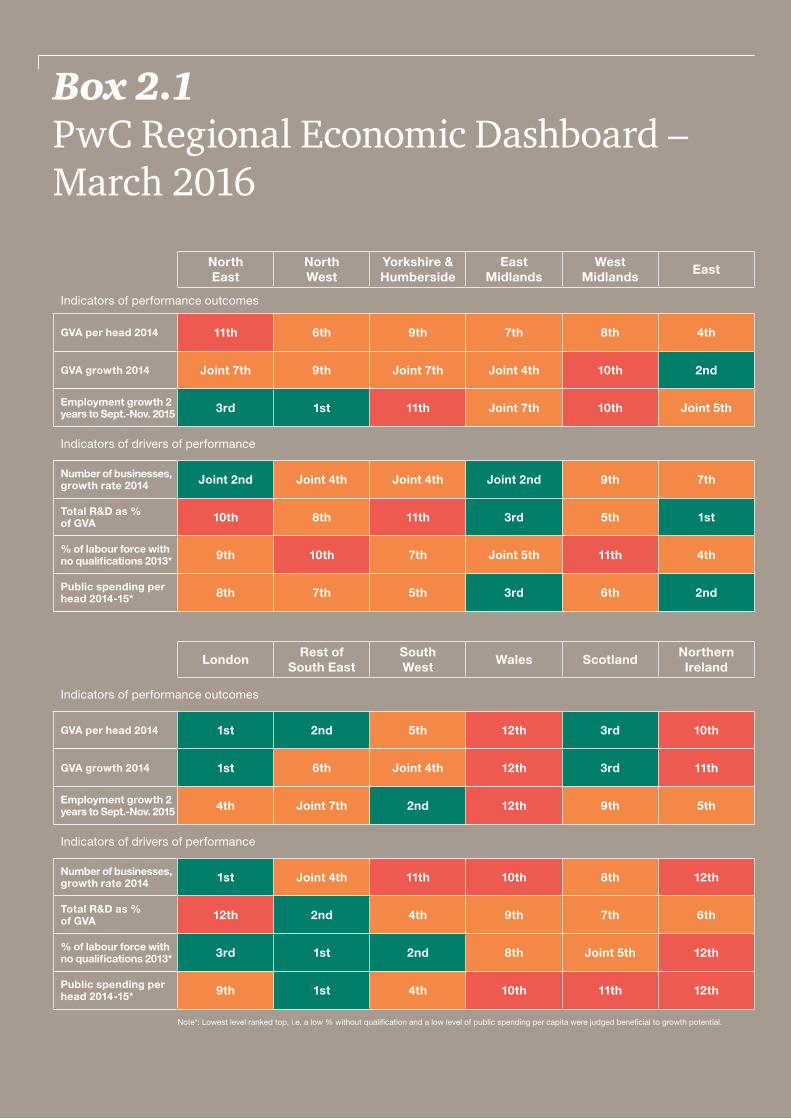
Box 2.1 PwC Regional Economic Dashboard – March 2016
North East
North West
Yorkshire &Humberside
East Midlands
West Midlands
East
Indicators of performance outcomes
GVA per head 2014 11th 6th 9th 7th 8th 4th
GVA growth 2014 Joint 7th 9th Joint 7th Joint 4th 10th 2nd
Employment growth 2 years to Sept.-Nov. 2015 3rd 1st 11th Joint 7th 10th Joint 5th
Indicators of drivers of performance
Number of businesses, growth rate 2014 Joint 2nd Joint 4th Joint 4th Joint 2nd 9th 7th
Total R&D as % of GVA 10th 8th 11th 3rd 5th 1st
% of labour force with no qualifications 2013* 9th 10th 7th Joint 5th 11th 4th
Public spending per head 2014-15* 8th 7th 5th 3rd 6th 2nd
LondonRest of
South EastSouth West
Wales ScotlandNorthern Ireland
Indicators of performance outcomes
GVA per head 2014 1st 2nd 5th 12th 3rd 10th
GVA growth 2014 1st 6th Joint 4th 12th 3rd 11th
Employment growth 2 years to Sept.-Nov. 2015 4th Joint 7th 2nd 12th 9th 5th
Indicators of drivers of performance
Number of businesses, growth rate 2014 1st Joint 4th 11th 10th 8th 12th
Total R&D as % of GVA 12th 2nd 4th 9th 7th 6th
% of labour force with no qualifications 2013* 3rd 1st 2nd 8th Joint 5th 12th
Public spending per head 2014-15* 9th 1st 4th 10th 11th 12th
Note*: Lowest level ranked top, i.e. a low % without qualification and a low level of public spending per capita were judged beneficial to growth potential.
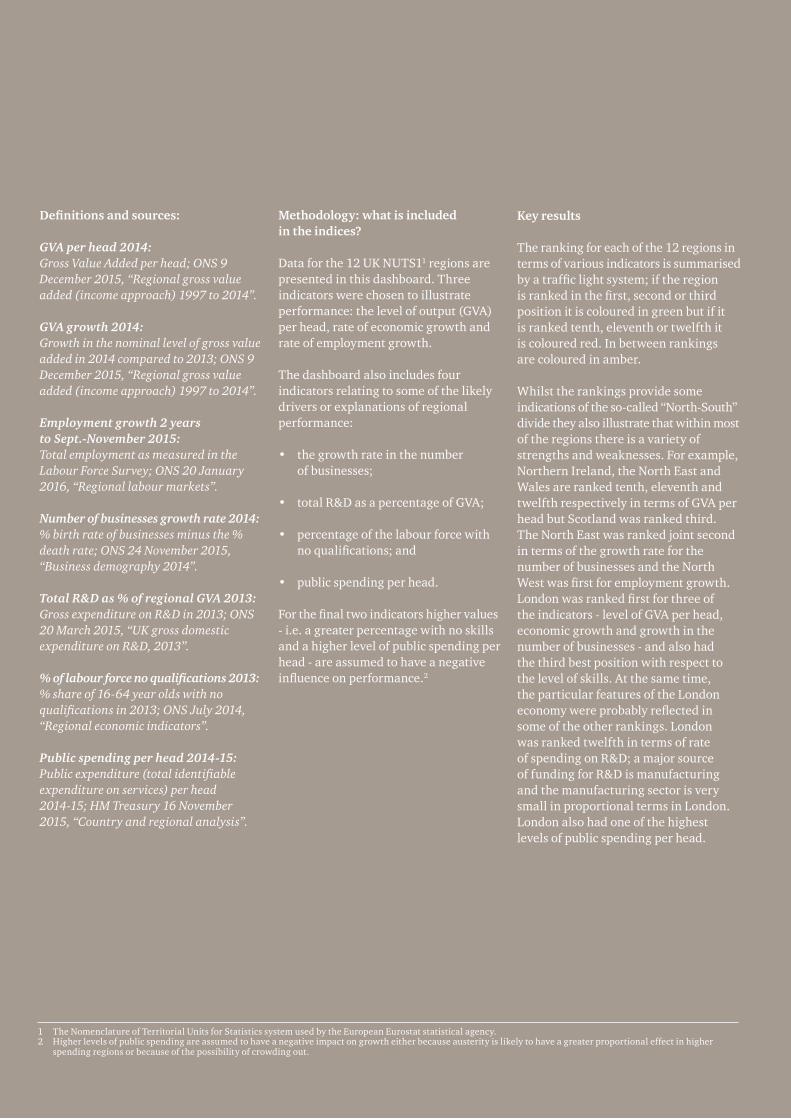
18 UK Economic Outlook March 2016
Definitions and sources:
GVA per head 2014: Gross Value Added per head; ONS 9 December 2015, “Regional gross value added (income approach) 1997 to 2014”.
GVA growth 2014: Growth in the nominal level of gross value added in 2014 compared to 2013; ONS 9 December 2015, “Regional gross value added (income approach) 1997 to 2014”.
Employment growth 2 years to Sept.-November 2015: Total employment as measured in the Labour Force Survey; ONS 20 January 2016, “Regional labour markets”.
Number of businesses growth rate 2014: % birth rate of businesses minus the % death rate; ONS 24 November 2015, “Business demography 2014”.
Total R&D as % of regional GVA 2013: Gross expenditure on R&D in 2013; ONS 20 March 2015, “UK gross domestic expenditure on R&D, 2013”.
% of labour force no qualifications 2013: % share of 16-64 year olds with no qualifications in 2013; ONS July 2014, “Regional economic indicators”.
Public spending per head 2014-15: Public expenditure (total identifiable expenditure on services) per head 2014-15; HM Treasury 16 November 2015, “Country and regional analysis”.
Methodology: what is included in the indices?
Dataforthe12UKNUTS11 regions are presented in this dashboard. Three indicators were chosen to illustrate performance: the level of output (GVA) per head, rate of economic growth and rate of employment growth.
The dashboard also includes four indicators relating to some of the likely drivers or explanations of regional performance:
• the growth rate in the number ofbusinesses;
• totalR&DasapercentageofGVA;
• percentage of the labour force with noqualifications;and
• public spending per head.
Forthefinaltwoindicatorshighervalues- i.e. a greater percentage with no skills and a higher level of public spending per head - are assumed to have a negative influenceonperformance.2
Key results
The ranking for each of the 12 regions in terms of various indicators is summarised byatrafficlightsystem;iftheregion isrankedinthefirst,secondorthirdposition it is coloured in green but if it is ranked tenth, eleventh or twelfth it is coloured red. In between rankings are coloured in amber.
Whilst the rankings provide some indicationsoftheso-called“North-South”divide they also illustrate that within most of the regions there is a variety of strengthsandweaknesses.Forexample,Northern Ireland, the North East and Wales are ranked tenth, eleventh and twelfth respectively in terms of GVA per headbutScotlandwasrankedthird. The North East was ranked joint second in terms of the growth rate for the number of businesses and the North Westwasfirstforemploymentgrowth.Londonwasrankedfirstforthreeof the indicators - level of GVA per head, economic growth and growth in the number of businesses - and also had the third best position with respect to the level of skills. At the same time, the particular features of the London economywereprobablyreflectedinsome of the other rankings. London was ranked twelfth in terms of rate ofspendingonR&D;amajorsource of funding for R&D is manufacturing and the manufacturing sector is very small in proportional terms in London. London also had one of the highest levels of public spending per head.
1 TheNomenclatureofTerritorialUnitsforStatisticssystemusedbytheEuropeanEurostatstatisticalagency.2 Higher levels of public spending are assumed to have a negative impact on growth either because austerity is likely to have a greater proportional effect in higher
spending regions or because of the possibility of crowding out.
19UK Economic Outlook March 2016
3 – The UK economic recovery: Better balanced than you might think 1
Key points• UK economic growth since the financialcrisishasbeendisappointingrelative to past recoveries but not in relation to other G7 economies.
• The main reason for relatively weak growth has been sluggish consumer spending, particularly in the early phases of the recovery when consumers were hit by a “perfect storm” of rising VAT, high food and energy prices, and tough lending restrictions from banks. However, recent consumer spending growth has been stronger.
• Global headwinds do not seem to be responsible for subdued growth. The export contribution to UK growth has been broadly in line with historical trends and previous recoveries of a similar duration.
• Public spending “austerity” is not an obvious culprit for slower growth either. The contribution of government spending on goods and services to UK growth is small but broadly similar to the 1970s, 1980s and 1990s recoveries.
• Looking ahead, the key risk is that this relatively well balanced recovery does not last, particularly against the background of extremely low interest rates.
IntroductionThe UK economic recovery – which started in the middle of 2009 – is now into its seventh year. In terms of GDP growth, it has been a relatively weak recovery, though this is not unique to the UK. In the past six and a half years, UK economic growth has averaged around2%,significantlybelowtheaverage of 3.4% for similar phases of previous post-war recoveries and also below the average trend rate of growth since 1970 (2.3%). Despite this disappointing growth, UK GDP has risen at the third fastest rate of all the G7 economies,behindCanadaandtheUS,and our economy has rebounded more strongly than any other major European economy(Figure3.1).TheUKhasalsoenjoyed a strong employment recovery, which has taken the employment rate to a new record high and brought the unemployment rate down to its lowest level for about a decade.
Alongside worries about the disappointing pace of recovery, there have also been concerns about its balance. Growth has been led by the services sector and manufacturing industry has lagged behind the pace of recovery in the rest of the economy – with output rising at around 1% per annum since 2009. As we discuss in Section4ofthisreport,therehasbeenalong-term decline in UK manufacturing employment, which is set to continue in the years ahead. We have not seen the “march of the makers” in the way that the Chancellor George Osborne suggested back in 2011.
At the same time, economists have registered other concerns about the balance of the recovery. In its New Year review of economic forecasts the FinancialTimesfoundawidespreadview that the UK recovery was unbalanced in some way. About half of the economists surveyed had concerns that growth was over-dependent on consumer spending or that the country’s largebalanceofpaymentsdeficitwasasignificantproblem.
Buthowjustifiedarethesefears?Consumer spending has not been particularly strong over this recovery. Household expenditure has risen on average by 1.7% a year, slower than overall GDP growth and considerably slower than the long-term rate of consumer spending growth of 2.7% per annum since 1970. Even though consumer spending has picked up in the past three years, its average growth rate since 2013 has still been below the long-term historical trend.
To understand better the drivers of this recovery and the question of the balance of growth, this article sets out a new framework for analysing the contribution of different sources of demand. The basis forthisapproachissetoutinSection3.1below.Section3.2thenusesthisframework to look at the recent drivers of growth, comparing the balance between different elements to previous recoveries and long-term historical trends. Section3.3discussestheimplicationsofthis analysis for the issue of the balance of growth and for the sustainability and durability of the economic recovery. Section3.4summarisesconclusionsfrom the analysis.
1 ThisarticlewaswrittenbyAndrewSentance,SeniorEconomicAdviseratPwC.

20 UK Economic Outlook March 2016
3.1 - Analysing the demand drivers of economic growthThe conventional analysis of GDP growth starts from a decomposition of GDP into domestic demand and net trade – exports less imports. This decomposition can then be used to account for the contribution of the different components of domestic spending – consumption, investment and government spending – with net trade making either a positive or negative contribution, depending on whether the growth of exports exceeds imports (positive) or import growth exceeds exports, which creates a drag on GDP growth.
As a piece of accounting this is mathematically correct, but there are a number of ways it does not capture very well the key features of a modern economy like the UK and the way it is affectedbyinternationaltrade.First,thecontribution of net trade to GDP growth – which normally appears relatively small in this conventional GDP accounting - does notreflecttheveryimportantinfluencethat trade has on economic growth, both in the short-term and the long-term.
Figure 3.1 – Recovery in G7 and major European economies
Source: OECD Quarterly National Accounts
*Growth to 2015 Q3
In the short-term, big swings in demand in the UK economy can have very significantimplicationsforgrowth, aswesawintheglobalfinancialcrisis.Yet this does not show up clearly in the conventional accounting because imports often move in the same direction as exports in a recession or a boom. As a result the net trade contribution does not capture the full impact of swings in trade. Indeed, if imports and exports move broadly in line with each other, then the net trade contribution to growth will always be zero,eventhoughtheunderlyinglevelof economic activity could change. And if imports fall more sharply than exports in a recession (which is what happened in the UK in the 2008/9 recession), there can appear to be a positive net trade contribution, even though the economy has been hit by a large negative international shock.
In the long-term, globalisation and the growth of international trade are very powerful drivers of economic growth. But because exports and imports tend to grow together as world trade expands, this is not captured by the movement in net trade, which only reflectsthedifferencebetweenexportandimportgrowth.Sooverlongerperiods, conventional GDP accounting doesnotreflecttheverypowerfulcontribution of world trade to economic growth.
A second weakness of this net trade accounting approach is that it effectively counts the full weight of import growth against one component of demand – exports – whereas imports are generated by all the components of demand. Consumer spending and investment have a relatively high contribution to import growth, but this is not apparent in the accounting framework based on a net trade contribution to GDP. To understand the drivers of growth properly, we need aframeworkwhichreflectstheway in which both domestic demand and exports affect import growth.
-0.5
0.0
0.5
1.0
1.5
2.0
2.5
3.0
ItalySpainNetherlandsFranceJapanSwitzerland*GermanyUKUSCanada*
% a
vera
ge a
nnua
l gro
wth
,20
09 Q
2 to
201
5 Q4
21UK Economic Outlook March 2016
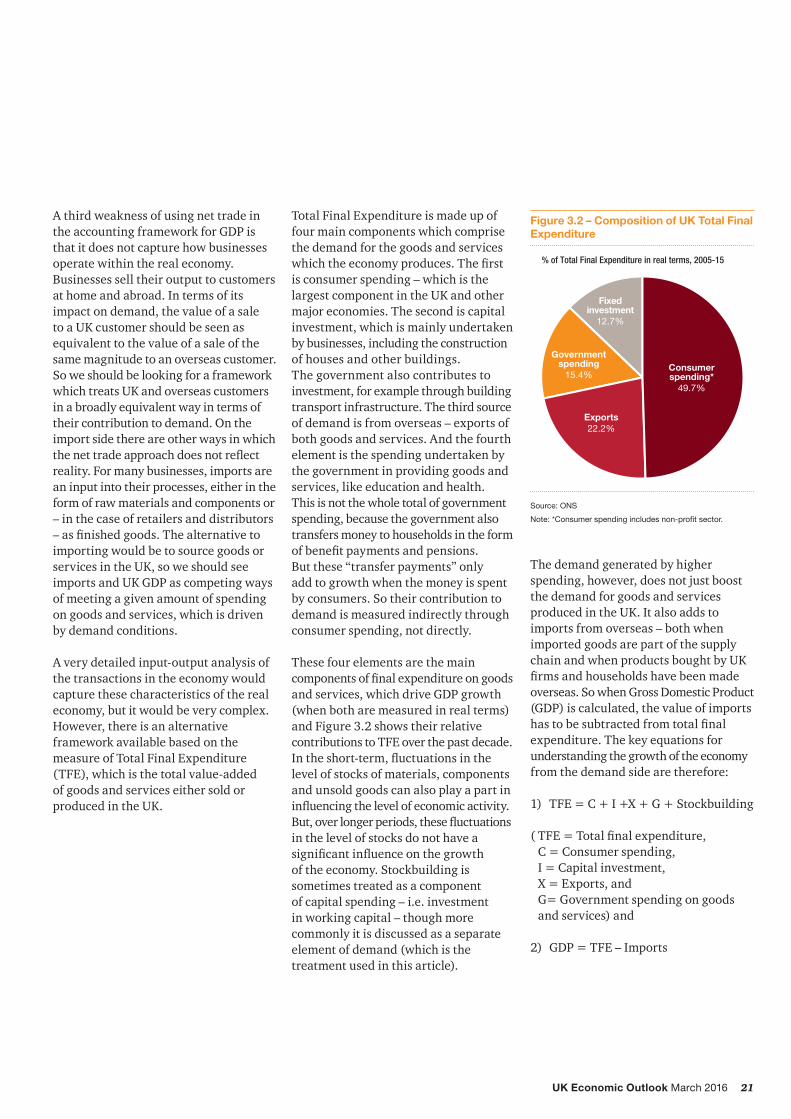
Figure 3.2 – Composition of UK Total Final Expenditure
Source: ONS
Note: *Consumer spending includes non-profit sector.
Consumerspending*
49.7%
Exports22.2%
Governmentspending
15.4%
Fixedinvestment
12.7%
% of Total Final Expenditure in real terms, 2005-15
A third weakness of using net trade in the accounting framework for GDP is that it does not capture how businesses operate within the real economy. Businesses sell their output to customers at home and abroad. In terms of its impact on demand, the value of a sale to a UK customer should be seen as equivalent to the value of a sale of the same magnitude to an overseas customer. Soweshouldbelookingforaframeworkwhich treats UK and overseas customers in a broadly equivalent way in terms of their contribution to demand. On the import side there are other ways in which thenettradeapproachdoesnotreflectreality.Formanybusinesses,importsarean input into their processes, either in the form of raw materials and components or – in the case of retailers and distributors –asfinishedgoods.Thealternativetoimporting would be to source goods or services in the UK, so we should see imports and UK GDP as competing ways of meeting a given amount of spending on goods and services, which is driven by demand conditions.
A very detailed input-output analysis of the transactions in the economy would capture these characteristics of the real economy, but it would be very complex. However, there is an alternative framework available based on the measureofTotalFinalExpenditure(TFE),whichisthetotalvalue-added of goods and services either sold or produced in the UK.
TotalFinalExpenditureismadeupoffour main components which comprise the demand for the goods and services whichtheeconomyproduces.Thefirst is consumer spending – which is the largest component in the UK and other major economies. The second is capital investment, which is mainly undertaken by businesses, including the construction of houses and other buildings. The government also contributes to investment, for example through building transport infrastructure. The third source of demand is from overseas – exports of both goods and services. And the fourth element is the spending undertaken by the government in providing goods and services, like education and health. This is not the whole total of government spending, because the government also transfers money to households in the form ofbenefitpaymentsandpensions. But these “transfer payments” only add to growth when the money is spent byconsumers.Sotheircontributiontodemand is measured indirectly through consumer spending, not directly.
These four elements are the main componentsoffinalexpenditureongoodsand services, which drive GDP growth (when both are measured in real terms) andFigure3.2showstheirrelativecontributionstoTFEoverthepastdecade.Intheshort-term,fluctuationsinthelevel of stocks of materials, components and unsold goods can also play a part in influencingthelevelofeconomicactivity.But,overlongerperiods,thesefluctuationsin the level of stocks do not have a significantinfluenceonthegrowth oftheeconomy.Stockbuildingissometimes treated as a component of capital spending – i.e. investment in working capital – though more commonly it is discussed as a separate element of demand (which is the treatment used in this article).
The demand generated by higher spending, however, does not just boost the demand for goods and services produced in the UK. It also adds to imports from overseas – both when imported goods are part of the supply chain and when products bought by UK firmsandhouseholdshavebeenmadeoverseas.SowhenGrossDomesticProduct(GDP) is calculated, the value of imports hastobesubtractedfromtotalfinalexpenditure. The key equations for understanding the growth of the economy from the demand side are therefore:
1) TFE=C+I+X+G+Stockbuilding
(TFE=Totalfinalexpenditure, C=Consumerspending, I=Capitalinvestment, X=Exports,and G=Governmentspendingongoodsand services) and
2) GDP=TFE–Imports

22 UK Economic Outlook March 2016
Figure 3.3 – UK economic growth since 1970
Source: PwC analysis, ONS
-6
-4
-2
0
2
4
6
8
% p
er a
nnum
cha
nge
in G
DP a
ndTo
tal F
inal
Exp
endi
ture
(TFE
)
TFEGDP Average GDP growth
Iffinalexpenditureandimportsgrow at the same rate, then GDP growth will beinlinewithTFEgrowth.Butifimports grow faster than spending, then GDP growth will be below the rate ofgrowthofTFE–whichhasnormallybeen the case for the UK economy. Figure3.3showshowGDPandTFEgrowth have moved closely together in the UK economy since 1970.
3.2 - The drivers of UK recoveries – past and presentThis accounting framework provides an alternative and arguably more realistic way of decomposing GDP growth. Instead of using net trade, the contribution of exports and imports can be assessed separately. The way in which they feed into the growth accounting calculation is different, however. Exports add directly to demand, but it is only if imports grow faster than total spending (TFE)thattheydetractfromgrowth. IfimportsgrowmoreslowlythanTFE,then their contribution to economic growth will be positive because that allows GDP to rise faster than total demandmeasuredbyTFE.
To set the context for analysing the currentrecovery,ithelpsfirsttolook at the historical pattern of growth and the contribution of the different drivers identifiedbyourframework.Table3.1shows two sets of benchmarks that we canuseforouranalysis.Thefirstisthelong-term historical trend, which is measured from 1970. The second is the experience of previous UK recoveries – measured, where possible, over the firstsix-and-a-halfyearsofgrowth–which is the current length of the recovery we have experienced so far since mid-2009.2
Table 3.1: Contributions to UK growth: past trend and previous recoveries
Contribution to TFE growth: % points per annum TFE (% p.a.)
Imports (% p.a.)
GDP (% p.a.)Consumer Investment Exports Gov’t Stocks
1970-2015 1.34 0.28 0.73 0.32 0.07 2.74 -0.46 2.28
Recoveries
1948-55 1.45 1.12 0.54 0.96 -0.33 3.74 -0.07 3.67
1975-79 1.18 0.87 0.90 0.26 0.60 3.81 -0.25 3.56
1981-87 2.02 1.01 0.74 0.18 0.33 4.26 -0.65 3.61
1991-97 1.72 0.27 1.22 0.13 0.28 3.62 -0.88 2.74
Average 1.59 0.82 0.85 0.38 0.22 3.86 -0.47 3.39
Source: PwC analysis of ONS data
Not surprisingly, consumer spending is still the largest single contributor to growth, accounting for nearly half of TFEgrowthsince1970andjustover40% of demand growth in previous recoveries. Exports are the second most important contributor to the growth of demand both in the long-term and in recoveries. Investment makes a big contribution during recoveries, but a smaller contribution to trend growth as it is highly cyclical – falling sharply in downturns and then bouncing back aseconomicconfidencerecovers.
Government spending, however, is normally the smallest contributor of the major demand components in recoveries. This is an important point to bear in mind when considering the view that “austerity” in public spending plans is responsible for slow growth in this recovery. It would be surprising if the smallest major contributor of demand to economic growth in a recovery could exercise so much leverage on the path of the economy in this recovery.
2 SeeearlierUKEconomicOutlookarticlesbyAndrewSentanceonservicesproductivityhere:http://www.pwc.co.uk/assets/pdf/ukeo-jul2015.pdf and on the contribution of services to regional growth here: http://www.pwc.co.uk/services/economics-policy/insights/uk-economic-outlook/ukeo-nov2014-getting-the-balance-right-in-the-uk-regions.html

23UK Economic Outlook March 2016
Sohowdoesthepatternofgrowth over this recovery compare with past historical experience? As we noted earlier, there have been two different phases to the current recovery. Until the end of 2012, GDP growth was relatively sluggish,averagingaround1.5%perannum.Sincethen,ithasaveragedaround2.5%-abovethelong-runtrendand closer to the growth we have seen in previous recoveries. Table 3.2 shows both phases and the contributions to the average growth rate of 2% since 2009, which is then compared to the long-run historical trend and the average experience of previous recoveries.
The most striking feature of the analysis in Table 3.2 is that the weakness of consumer spending is the main difference between the pattern of demand in this recovery and previous experience. Despite all the concern about the weakness of the world economy – often referred to as global headwinds – the contribution of exports to growth since 2009 has been similar to previous recoveries and historical trends. It is worth recalling that UK recoveries in the 1980s and 1990s also took place against a turbulent global economic background. In the 1980s there was a major debt crisis in Latin America, and in the 1990s Europe went into recession in 1993 just as the UK recovery was getting underway. European growth was sluggish through the 1990s as Germany grappled with thechallengesofunification,justasithas been disappointing over much of this recovery. Yet exports made a very strong contribution to growth in the 1990s recovery, as Table 3.1 shows.
Table 3.2: Contributions to UK growth: the current recovery in context
Contribution to TFE growth: % points per annum TFE (% p.a.)
Imports (% p.a.)
GDP (% p.a.)Consumer Investment Exports Gov’t Stocks
2009-12 0.47 0.39 0.72 0.12 0.33 2.04 -0.52 1.52
2013-15 1.24 0.60 0.73 0.27 0.06 2.91 -0.39 2.52
2009-15 0.84 0.49 0.72 0.20 0.19 2.42 -0.44 1.98
Differences of 09-15 from:
1970-15 -0.50 0.21 0.00 -0.13 0.13 -0.30 0.00 -0.30
Previous
recoveries
-0.75 -0.33 -0.13 -0.19 -0.02 -1.41 0.01 -1.42
Source: PwC analysis of ONS data
The weakness of consumer spending was particularly noticeable in the early years of the current UK recovery. Householdspendingwassqueezedoverthis period by a combination of sluggish wagegrowthandhighinflation. Asinflationfellfromapeakofover5% in late 2011 to 2% by the end of 2013, the pressures on household expenditure eased. In the past three years, consumer spending has made a more normal contribution to the recovery. Another component of demand which has been making a stronger contribution since 2013 has been investment. However, this is less to do with business investment, which has grown fairly consistently since thefinancialcrisis.Investmenthasbeenboosted since 2013 by a bounce-back in housing construction, helped by government initiatives like Help-to-Buy andHelp-to-Build.Thesqueezeongovernment investment has also eased over the past few years.
What has been the contribution of “austerity” to the pattern of weaker growth of this recovery compared to the past? The contribution of government spending – adding about 0.2percentagepointstoTFEgrowthover the recovery – has been very similar to the growth contribution made by public spending in the 1970s, 1980s and 1990s recoveries. Probably the main impactofgovernmentfiscalplanswerefelt in 2010 and 2011 when the VAT rate was increased from a reduced rate of 15%to20%inthespaceoftwoyears.Thisaddedtothesqueezeonhouseholdsin the early phase of the recovery and contributed to the weakness of consumer spending. But there were other powerful factors adding to this consumersqueezeaswell,including the impact of high energy and food prices from 2010 to 2012 and restricted accesstofinanceforborrowersfollowingthefinancialcrisis.

24 UK Economic Outlook March 2016
3 Quarterlydataisonlyavailablefrom1955sothefirstpost-warrecoveryperiodismeasuredusing7yearsofannualdata(1948-55).Thelate70srecoverycametoanendin1979,soismeasuredover4¼yearsratherthan6½years(1975Q3to1979Q4).TheperiodsusedforanalysisoftheotherrecoveriesshowninTables3.1and3.1are1981Q1-1987Q3;1991Q3-1998Q1;and2009Q2-2015Q4.
3.3 - The balance of the recoveryThis analysis suggests that some of the commonly expressed concerns about the balance of the UK economic recovery are exaggerated and misplaced. Consumer spending has made a lower contribution to economic growth across this recovery than in the equivalent phase of any previous post-war recovery. Meanwhile, investment and exports contributed jointly around half of the demand growth we have seen since 2009 – the firsttimethishashappenedatthisstageofanypost-warUKrecovery.Figure3.4shows that the ratio of investment and export growth to increased consumption has been the most favourable of any of the previous recoveries of this duration that we have experienced since the SecondWorldWar.
However, that still leaves us with some puzzlesaboutthebalanceoftherecovery.First,whyhasmanufacturingbeen struggling so much when exports have been doing relatively well? The answer here lies in the success of the UK’s services exports, which have been discussed in a number of recent articles in previous editions of this report.3 Indeed, in the second half of last year, the UK exported more services thanmanufacturesforthefirsttime in its history. Given our comparative advantage in services exports – not just inthefinancialsector,butinbusinessand professional services and a wide range of other creative and knowledge-intensive activities – this pattern is likely to continue into the future.
Asecondpuzzlerelatestothebalance of payments. The UK has a total balance ofpaymentsdeficitwhichhasaveragednearly 4% of GDP in the past couple of quarters. However, the relatively high deficitdoesnotreflectasignificantdeterioration on the trade account. Ourtradedeficithasbeenaround2% of GDP or so for the past few years and, if anything, it has narrowed slightly in recentquarters.Rather,UKfirmsandinvestors are receiving less income from their activities overseas than wearepayingouttoforeignfirms and investors. This may be a temporary phase linked to slow growth in Europe and other weak spots in the world economy. Or it may be the start of a longer term pattern. But the key point isthatthebalanceofpaymentsfiguresdonotreflectpoorUKtradeperformance.As this article has argued, the contribution of exports and imports to our growth over this recovery has been broadly in line with past trends.
There are, however, risks for the future which we need to be aware of. The household savings ratio has fallen quite sharply in recent years and one of the drivers of this shift has been a recovery in mortgage borrowing, which has also been associated with higherhousepriceinflation–particularlyinLondonandtheSouth-East.Soawell-balancedrecoveryso far could become less balanced in the future, and this is one of the risks of a prolonged period of low interest rates. Persistentdelaysintakingthefirststepto raise interest rates in the UK could be aggravating the prospect of excessive borrowingandotherfinancialrisks.
Figure 3.4 – Recovery driven by investment and exports
Source: PwC analysis of ONS data
0
10
20
30
40
50
60
2009-151975-791948-551991-981981-87
40.9 41.244.5 46.5
49.5
Incr
ease
in fi
xed
inve
stm
ent a
ndex
port
s as
% o
f TFE
gro
wth

25UK Economic Outlook March 2016
3.4 - ConclusionEvery phase of economic growth is different, so there is no such thing as a typical recovery. This recovery has been characterised by weak consumer spending growth, particularly before 2013, and this has exerted a drag on the overall rate of expansion of the UK economy. In other respects, however, the pattern of growth does not look abnormal. Despite concerns about global headwinds and disappointing world growth, the contribution of UK exports and imports to our recovery has been much in line with previous experience. The role of public spending on goods and services has also been much in line with our experience from the 1970s, 1980s and 1990s, when the UK government was also trying to control deficitspending.Fromamacroeconomicperspective this has not been an unusual period of austerity in government spending. The main dampening influenceongrowthfromfiscalpolicyhas come from the effect of the two VAT rises earlier in the recovery on consumer spending – which are now behind us.
Concerns that this has been an excessively consumer-driven recovery so far are misplaced. Investment and exports have contributed about half of total growth, above their historical contribution, whereas consumer spending has contributed just about a third. The UK’s balance of payments deficitreflectsshiftsontheincomesideof the account rather than poor trade performance.Sofar,thisrecovery has been better balanced than many economists recognise. The challenge looking ahead is to keep it that way.

26 UK Economic Outlook March 2016
4 – Which industries will drive future jobs growth in the UK?
Key points• Total employment in the UK could
grow by around 3 million over the next decade, with the total number of jobs reaching almost 37 million by2025.
• Education and health could add over 1millionjobsby2025andbecomethe biggest of the services sectors.
• Business services could create around 1.5millionmorejobsby2025andbecome the second biggest services sector, with distribution, hotels and restaurants in third place.
• The number of jobs in manufacturing could fall by a further 600,000 to around2millionby2025asnewautomated technologies continue to boost productivity and overseas competitionremainsfierce.
• Around150,000jobscouldbelostinpublic administration, defence and social security as austerity measures continue at least until 2020.
4.1 - Long term changes in the industrial structure of UK employment
We begin with a long term view of how the structure of UK employment has changed overthepast175yearsusingPopulationCensusdata.Figure4.1showshowthiscanbe divided into three distinct time periods.
Back in 1841, manufacturing was the largest employer in Britain, closely followed by services. By that time, only 1 in 4 people were employed in the agriculture, forestryandfishingindustry,whichhadbeen dominant before the Industrial Revolution began in the mid-18th century, and this fell to less than 1 in 10 by the start ofthe20thcentury.Serviceshadcaught up with manufacturing by 1871, but employment in these two sectors remained broadly similar prior to World War I.
The second period, from 1911 to 1961, saw stronger growth in the services industry, reaching around half of total employment in England and Wales by 1931. Manufacturing’s share fell during the inter-war years when the global trade environment was disrupted, but recoveredslightlyafter1945asworldtrade growth picked up again. The percentage of employment in agriculture continued to fall and, by 1961, only 1 in 25peoplewereemployedinthissector.
However,itwasinthefinalperiodfrom1961 until the present day during which the growth in services really took off, now accounting for over 80% of all jobs. Manufacturing, on the other hand, fell to just 9% of all jobs by 2011 as international competition increased, production moved overseas seeking lower costs and some services previously undertaken within manufacturing companies were outsourced (e.g. cleaning and catering)1. As we will discuss later, however, manufacturing output held up much better than employment as productivity growth remained relatively strong.
IntroductionThe UK has been a powerful job creating machine in recent years, with gains in private services sectors far outweighing cuts in manufacturing and parts of the public sector (other than health and education). But can we expect these positive trends to continue over the next decade in the face of further austerity, automation and international competition? This section presents our projections for jobs growth by industry sectorto2025afterfirstanalysinghistorical trends. Our focus here is on the UK as a whole.
The discussion is organised as follows:
Section4.1 Longtermchangesin the industrial structure of UK employment
Section4.2 Employmentand productivity growth by industry sector
Section4.3 Projectedemployment growth trends over the next decade
Section4.4 Summaryandconclusions
1 Thislatterpointmayoverstatethedeclinein‘true’manufacturingjobsintheofficialstatisticsweuseforthisarticle,butunfortunatelynodataarereadilyavailablethat adjust for this effect.

27UK Economic Outlook March 2016
Detailed analysis of sectoral employment trends since 1978
Census data give an indication of the broad shift in UK employment since the mid-19th century, but more detailed sectoral breakdowns are only available since1978basedontheofficialONSworkforce jobs survey2.Figure4.2showsthisforselecteddates,allforSeptemberfor consistency, as follows:
• September1978– Thefirstdetailedsectoraldata availablefromtheONSworkforce jobssurveyinitscurrentformat;
• September1997– A mid-cycle date that could be considered broadly comparable with 2015sothatthewholeperiodfrom 1997-2015coverstrendsoverroughly afulleconomiccycle;
• September2007– Around the start of the global financialcrisis;
• September2010– Around the low point for total UK employmentafterthecrisis;and
• September2015– The latest available data from the workforce jobs survey.
Figure4.2showsthegrowingdominanceof the UK services industry and the sharp decline in manufacturing in recent decades. Employment in energy and water also declined sharply in the 1980s and 1990s with the decline of the UK coal mining industry and the effect of the electricity, gas and water privatisations inencouragingefficiency-enhancingjobcuts. Employment in construction has, by contrast, been remarkably stable at around 6-7% of the total for nearly 40 years, despite some cyclical ups and downs during this period.
Figure 4.1 – UK Employment shares by industry since 1841
0
10
20
30
40
50
60
70
80
90
% o
f tot
al e
mpl
oym
ent
20111841 1851 1861 1871 1881 1891 1901 1911 1921 1931 1941 1961 20011951 199119811971
Services Manufacturing Agriculture, forestry and fishing
Period 2 Period 3Period 1
Source: ONS census data
Note: Data until 1911 covers Great Britain, and from 1921-2011 covers England and Wales, but this should not make a major difference to the broad trends shown.
Figure 4.2 – Breakdown of UK jobs by industry sector since 1978
0% 10% 20% 30% 40% 50% 60% 70% 80% 90% 100%
September 78
September 97
September 07
September 10
September 15
Agriculture, forestry & fishing Construction Manufacturing Energy & Water Total Services
Source: PwC analysis of ONS data
2 Note that this measures the numbers of jobs (including self-employment), which will be higher than the number of people employed given that some may have two or morejobs.Theseestimatesaremostlybasedonemployersurveys,whichareconsideredbytheONStobemorereliableinprovidinganindustryclassificationthantheLabourForceSurvey(LFS),whichisofindividuals.However,LFSdataisusedforself-employmentandotheradministrativesourcesarealsousedbytheONStosupplementemployersurveyswhereappropriate.ThelatestsuchworkforcejobsdatapublishedatthetimeofwritingareforSeptember2015giventhattheyareonlyproduced quarterly with some time lag.

28 UK Economic Outlook March 2016
Figure4.3showsamoredetailedsectoral breakdown of the growth rates of employment within three sub-periods of what we estimate to be the latest full economic cycle: pre crisis (1997-2007), crisis (2007-2010) and post-crisis (2010-2015).Constructionandmanufacturing were hit the hardest bythefinancialcrisis,withemploymentin these sectors falling by around 4% per annum in 2007-10. By contrast, education and health employment continued to grow through the recession and beyond, while the public administration, defence and social security sector saw jobs cut after 2010 as austerity started to bite.
To understand what is really driving UK employment growth, however, we need to look more closely at the growth in key servicessectors,asshowninFigure4.4.
Figure 4.3 – Annual job growth rates by sector since 1997
-6
-4
-2
0
2
4
6
ManufacturingAgriculture,forestry
and fishing
Energyand Water
Distribution,hotels andrestaurants
FinancialServices
Public admin,defence
and security
Totalservices
Otherservices
Educationand health
Transportand
communication
ConstructionBusinssServices
Total jobs
Pre-crisis: 1997-2007 Crisis: 2007-2010
% a
nnua
l gro
wth
rate
Post-crisis: 2010-2015
Source: PwC analysis of ONS data
Figure 4.4 – Jobs trends in services sectors
Distribution, hotels and restaurants
0
1
2
3
4
5
6
7
8
Jun 14Jun 10Jun 06Jun 02Jun 98Jun 94Jun 90Jun 86Jun 82Jun 78
Transport and communication Financial Services
Tota
l job
s (m
)
Business Services Public admin, defence and security Education and health
Other Services
Source: PwC analysis of ONS data
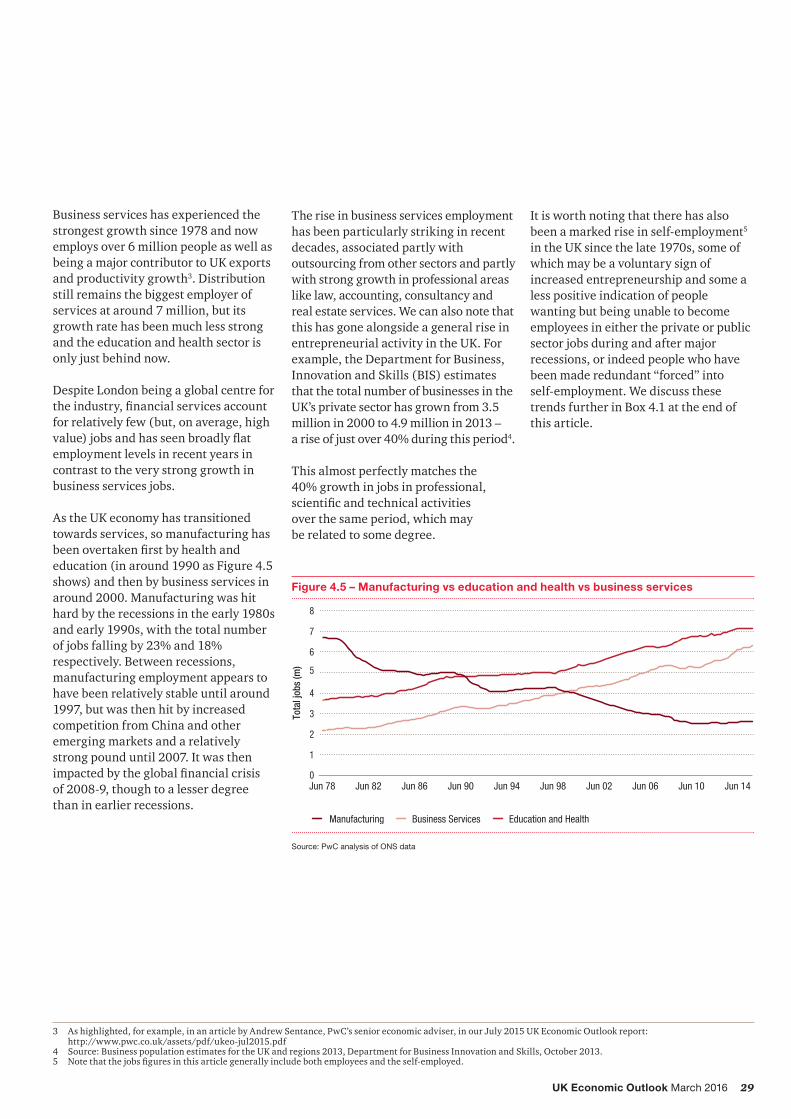
29UK Economic Outlook March 2016
Business services has experienced the strongest growth since 1978 and now employs over 6 million people as well as being a major contributor to UK exports and productivity growth3. Distribution still remains the biggest employer of services at around 7 million, but its growth rate has been much less strong and the education and health sector is only just behind now.
Despite London being a global centre for theindustry,financialservicesaccountfor relatively few (but, on average, high value)jobsandhasseenbroadlyflatemployment levels in recent years in contrast to the very strong growth in business services jobs.
As the UK economy has transitioned towards services, so manufacturing has beenovertakenfirstbyhealthandeducation(inaround1990asFigure4.5shows) and then by business services in around 2000. Manufacturing was hit hard by the recessions in the early 1980s and early 1990s, with the total number of jobs falling by 23% and 18% respectively. Between recessions, manufacturing employment appears to have been relatively stable until around 1997, but was then hit by increased competition from China and other emerging markets and a relatively strong pound until 2007. It was then impactedbytheglobalfinancialcrisis of 2008-9, though to a lesser degree than in earlier recessions.
The rise in business services employment has been particularly striking in recent decades, associated partly with outsourcing from other sectors and partly with strong growth in professional areas like law, accounting, consultancy and real estate services. We can also note that this has gone alongside a general rise in entrepreneurialactivityintheUK.Forexample, the Department for Business, InnovationandSkills(BIS)estimatesthat the total number of businesses in the UK’sprivatesectorhasgrownfrom3.5million in 2000 to 4.9 million in 2013 – a rise of just over 40% during this period4.
This almost perfectly matches the 40% growth in jobs in professional, scientificandtechnicalactivities over the same period, which may be related to some degree.
Figure 4.5 – Manufacturing vs education and health vs business services
0
1
2
3
4
5
6
7
8
Jun 14Jun 10Jun 06Jun 02Jun 98Jun 94Jun 90Jun 86Jun 82Jun 78
Business ServicesManufacturing Education and Health
Tota
l job
s (m
)
Source: PwC analysis of ONS data
It is worth noting that there has also been a marked rise in self-employment5 in the UK since the late 1970s, some of which may be a voluntary sign of increased entrepreneurship and some a less positive indication of people wanting but being unable to become employees in either the private or public sector jobs during and after major recessions, or indeed people who have been made redundant “forced” into self-employment. We discuss these trends further in Box 4.1 at the end of this article.
3 Ashighlighted,forexample,inanarticlebyAndrewSentance,PwC’ssenioreconomicadviser,inourJuly2015UKEconomicOutlookreport: http://www.pwc.co.uk/assets/pdf/ukeo-jul2015.pdf
4 Source:BusinesspopulationestimatesfortheUKandregions2013,DepartmentforBusinessInnovationandSkills,October2013.5 Notethatthejobsfiguresinthisarticlegenerallyincludebothemployeesandtheself-employed.

30 UK Economic Outlook March 2016
4.2 - Employment and productivity growth by industry sectorThe relationship between productivity growth6 and employment growth is also important in assessing overall sectoral performance.Figure4.6showshowindustries compare on these two measures over the period since 1997 (which is roughly a full economic cycle as we noted earlier).
Our analysis shows a negative correlation coefficientbetweenemploymentgrowthandproductivitygrowthofaround-0.5(thedottedlineinFigure4.6).Whilecorrelation does not necessarily imply causation, there does appear to be some tendency for labour-intensive sectors that face increased demand but have relatively low productivity growth potential to generate a lot of jobs so as to meet this extra demand (e.g. education and health). The opposite may tend to be true for more capital-intensive sectors (e.g. manufacturing, energy and water). But there are also ‘star’ sectors that are outliers on the chart and perform relatively well on both measures, in particular: Figure 4.6 – UK sectoral jobs growth vs productivity growth (1997-2014)
0 10 20 30 40 50 60 70-60
-40
-20
0
20
40
60
80
Cum
ulat
ive
empl
oym
ent g
row
th19
97-2
014
(%)
Cumulative productivity growth 1997-2014 (%)
Energy and water
Manufacturing
Transport and communication
Financial services
Agriculture, forestry and fishing
Distribution, hotels and restaurants
Business services
Public administration
Construction
Other Services
Education and health
Source: PwC analysis of ONS data
• business services, which tend to be labour-intensive and so have increased employment numbers greatly in response to a strong increases in demand, but have also beenabletomakesomeefficiencygains over time through use of new informationtechnologies;and
• transport and communication, which is a more capital-intensive sector in general, but has also seen reasonably strong jobs growth since 1997.
These two sectors illustrate the possibility that higher productivity might itself, through lowering costs and prices, actually boost output and hence employment in the medium to long run.
There are also some sectors, however, where either productivity growth has been weak without being a huge job creator (e.g. construction), or where employment has been stagnant or falling without particularly strong productivity growth since 1997 (e.g. public administration and agriculture).
6 Measured here as output per job in volume terms.
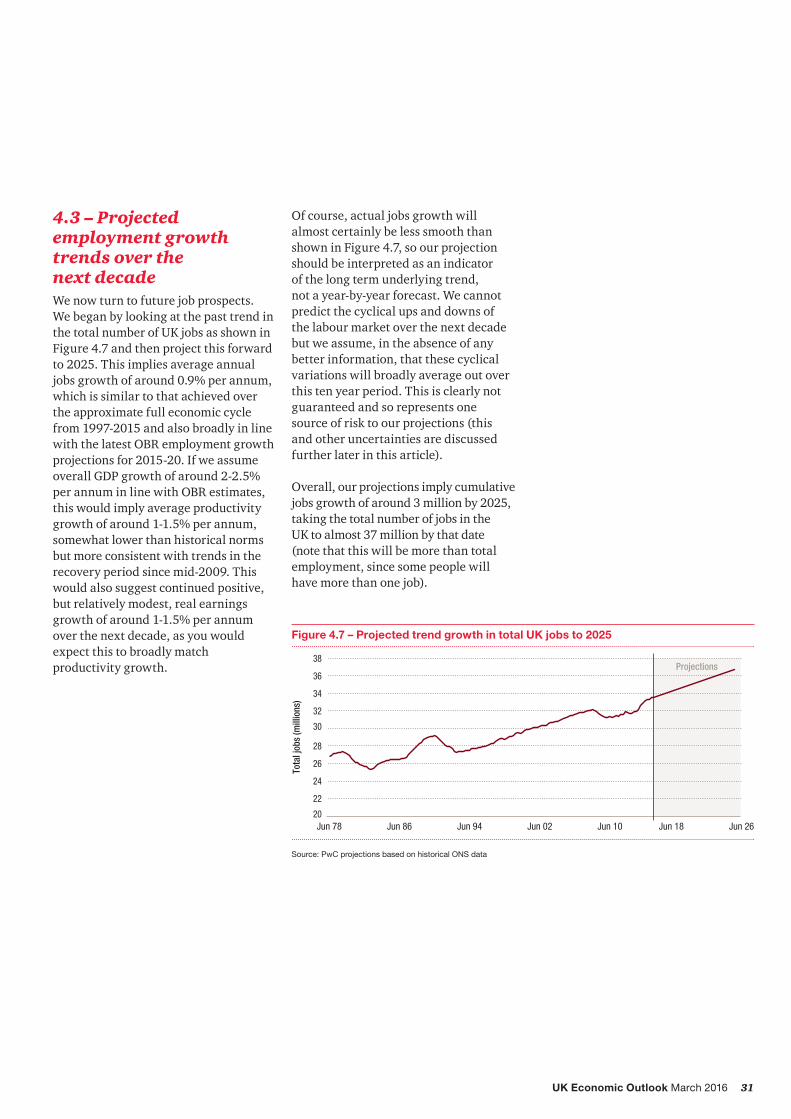
31UK Economic Outlook March 2016
4.3 – Projected employment growth trends over the next decadeWe now turn to future job prospects. We began by looking at the past trend in the total number of UK jobs as shown in Figure4.7andthenprojectthisforwardto2025.Thisimpliesaverageannualjobs growth of around 0.9% per annum, which is similar to that achieved over the approximate full economic cycle from1997-2015andalsobroadlyinlinewith the latest OBR employment growth projectionsfor2015-20.IfweassumeoverallGDPgrowthofaround2-2.5%per annum in line with OBR estimates, this would imply average productivity growthofaround1-1.5%perannum,somewhat lower than historical norms but more consistent with trends in the recovery period since mid-2009. This would also suggest continued positive, but relatively modest, real earnings growthofaround1-1.5%perannumover the next decade, as you would expect this to broadly match productivity growth.
Of course, actual jobs growth will almost certainly be less smooth than showninFigure4.7,soourprojectionshould be interpreted as an indicator of the long term underlying trend, not a year-by-year forecast. We cannot predict the cyclical ups and downs of the labour market over the next decade but we assume, in the absence of any better information, that these cyclical variations will broadly average out over this ten year period. This is clearly not guaranteed and so represents one source of risk to our projections (this and other uncertainties are discussed further later in this article).
Overall, our projections imply cumulative jobsgrowthofaround3millionby2025,taking the total number of jobs in the UK to almost 37 million by that date (note that this will be more than total employment, since some people will have more than one job).
Figure 4.7 – Projected trend growth in total UK jobs to 2025
20
22
24
26
28
30
32
34
36
38
Jun 26Jun 18Jun 10Jun 02Jun 94Jun 86Jun 78
Tota
l job
s (m
illio
ns)
Projections
Source: PwC projections based on historical ONS data

32 UK Economic Outlook March 2016
Having set the overall jobs envelope, we assess how this might break down by industry sector as set out in Table 4.1.
Comparing the last two columns in Table 4.1 shows that in many sectors we consider it reasonable for historic trends to continue over the next decade. This includes a continued decline in manufacturing jobs as smart automation reduces the number of workers required while also boosting productivity as in the past. There may be some areas where ‘cobotics’ will involve increased demand for people with the skills to work in a complementary way with robots7, but these are likely to involve a small number of relatively highly qualifiedstaff,notareturntothemassmanufacturing employment seen in the UK in earlier periods.
Public administration is also likely to see further job losses as austerity continues over the period to 2020. Even beyond this date, however, we expect the UK government to use digital technologies toenhanceefficiencyandreduceheadcount while aiming to maintain service quality8.
Number of jobs (millions) Growth rates (per annum)
Industry 1997 2015 2025(projected)
1997-2015 2015-2025(projected)
Agriculture, forestry & fishing 0.5 0.4 0.4 -0.9% -0.9%
Construction 1.8 2.2 2.4 1.1% 0.6%
Manufacturing 4.3 2.6 2.0 -2.6% -2.6%
Energy and water 0.3 0.4 0.4 0.8% 0.8%
Distribution, hotels and restaurants
6.6 7.2 7.5 0.5% 0.5%
Transport and communication
2.2 2.9 3.2 1.6% 1.2%
Financial services 1.1 1.1 1.2 0.2% 0.2%
Business services 3.9 6.3 7.9 2.8% 2.3%
Public administration, defence and security
1.6 1.5 1.3 -0.4% -1.0%
Education and health 5.0 7.1 8.3 2.0% 1.5%
Other services 1.5 1.9 2.2 1.5% 1.5%
Total services 21.8 28.0 31.6 1.4% 1.2%
Total Jobs 28.8 33.7 36.9 0.9% 0.9%
Table 4.1 – UK employment growth rates 1997-2015 and 2015-2025
Source: PwC projections and ONS historical data
7 AsdiscussedfurtherinourStrategy&IndustryPerspectivespieceonthefutureofmanufacturinghere: http://www.strategyand.pwc.com/perspectives/2016-manufacturing-trends
8 Formorediscussionoftheseandotherissuesaroundthefutureofgovernmentsee: http://www.pwc.com/gx/en/industries/government-public-services/public-sector-research-centre/publications/government-19th-annual-ceo-survey.html

33UK Economic Outlook March 2016
But we expect that these areas of declining headcount will be far outweighed by continued strong job creation in health and education and business services in particular (seeFigure4.8).
Although we believe the growth in business services will slow down slightly from its past trend as some of these markets mature, we are projecting close to 900,000 new jobs in professional, scientificandtechnicalactivitiesby2025(in contrast, administrative and support services jobs may be more at risk from further advances in automation9).
In contrast to business services, the financialservicessectorisunlikelytobea large job creator, though there could be plenty of change within the market due to regulatory pressures and challenges toincumbentsfromFinTechstart-ups10.
We project around 1.1 million new jobs inhealthandeducationby2025,takingits total above that for distribution, hotels and catering, with around 60% of these new jobs arising in the health sector as an ageing population further increasesdemandinthisarea.TheNHSis pushing towards more healthcare being provided in the community, where it is relatively cheaper, rather than the expensive acute sector, but this is more to save non-labour costs rather than reduce the number of doctors, nurses and other carers needed. We do expect the growth in this sector over the next decade to slow down somewhat, as the rateofjobsgrowthseenin1997-2015seemsfinanciallyunsustainableinthelong run, but this is still likely to be a major net job creator if health and long term care service standards are not to be seriously eroded over the next decade.
Overall, therefore, we are projecting close to 3.6 million extra jobs within services over the next decade, with this broadsectoraccountingforover85%oftotalUKemploymentby2025.Bythatdate, there could also be fewer people working within manufacturing than constructionforthefirsttimeinrecorded history.
Figure 4.8 – Change in jobs over the next decade by UK industry sector (2015-2025)
Source: PwC projections based on historical ONS data
-1.0
-0.5
0.0
0.5
1.0
1.5
2.0
ManufacturingPublic admin,defence
and security
Agriculture,forestry& fishing
Financialservices
Energyand Water
ConstructionOther services
Distribution,hotels andrestaurants
Transportand
communication
Educationand health
BusinessServices
-30
-20
-10
0
10
20
30
40
50
60
Change in jobs
Chan
ge in
jobs
(mill
ions
)
% c
hang
e 20
15-2
025
% change (2015-2025)
9 Offshoring may also continue to be a factor in some support services, though there could also be some ‘reshoring’ of customer service call centres as we argued in earlier research here: http://www.pwc.co.uk/services/economics-policy/insights/uk-economic-outlook/reshoring-a-new-direction-for-the-uk-economy-ukeo-march14.html
10 Asdiscussedfurtherhere:http://www.strategyand.pwc.com/perspectives/2016-financial-services-trends

34 UK Economic Outlook March 2016
Risks to our projections
Whilst we believe our projections are plausible, they could be thrown off by various factors including:
• a deep and prolonged recession from which the economy was not able to recoverfullyby2025(thoughpastexperience is that jobs growth does eventually bounce back from such cyclical downturns, so our projections may still be a good guide tolongertermunderlyingtrends);
• little or no continuation of recent trends towards increased labour force participation by older people, which will be needed to keep the workforce growing strongly despite anageingpopulation;plannedfurther rises in state pension ages will tend to support this trend continuing but it is not guaranteed it willproceedasfastasinthepastfiveyearsinparticular;
• severe limits being imposed on migration of workers to the UK, for example after a vote to leave the EU (although it is important to note that our projections are broadly consistentwithONSpopulationprojections which suggest a gradual moderation in net migration to the UK from the very high levels seen overthepastfewyears);and
• asignificantnumberofworkersbeing displaced from some jobs by smart machines, although these should – as in the past – be compensated for to a large degree by job creation in other services areas, even if we cannot easily predict what these new jobs will be (there should certainly be some new digital job creation, as we have argued in our previous research).
4.4 – Summary and conclusionsThe dominant story of the last century has been the rise of services to its current position as the dominant source of UK employment. Manufacturing now accounts for less than 10% of UK jobs and there is little prospect of this reversing, while health and education and business services have been the biggest growth areas since the late 1970s.
Looking ahead, our analysis suggests that over the next decade:
• Employment in the UK could grow by around3millionby2025,withthetotal number of jobs reaching almost 37 million.
• Education and health could add over 1millionjobsby2025andbecomethe biggest of the services sectors.
• Business services could create around1.5millionmorejobsby2025andwillbecomethesecondbiggest services sector, with distribution, hotels and restaurants in third place.
• The number of jobs in manufacturing could fall by a further 600,000 to around2millionby2025asnewautomated technologies continue to boost productivity and overseas competitionremainsfierce.
• Around150,000jobscouldbelostinpublic administration, defence and social security as austerity measures continue at least until 2020.
11 TheONSprojectionssuggestworkingagepopulationgrowthofaround0.6-0.7%perannumascomparedtoour0.9%perannumemploymentgrowthprojections. We would see the difference as being made up by a continued trend towards higher employment rates, particularly for women and older workers.
12 PwCUKEconomicOutlook,March2015here:http://www.pwc.co.uk/services/economics-policy/insights/uk-economic-outlook/ukeo-mar2015-new-job-creation.html

35UK Economic Outlook March 2016
Box 4.1 The rise of self-employment
AsFigure4.9showstherewasastrongrise in self-employment in the UK in the 1980s and then again over the past decade (though the last year has seen more volatile trends).
The industries with the highest and lowest self-employment rates are shown in Table 4.2.
Whilst it may be no surprise to see that agriculture,forestryandfishinghasthehighest rate of self-employment the absolute numbers involved are small. Therehave,however,beensignificantincreases recently in the construction and other services sectors, perhaps partly as a result of people laid off during the last recession being unable to get corporate jobs after that, as well as by older workers preferring to be their own boss.
It is also notable that the biggest growth in self-employment over the past 10 yearshasbeenineducation:from2005to2015therewerenearly200,000moreself-employed people in this sector, perhapsreflectingbothcutbacksinsome public sector services, particularly in further education, as well as people turning to tutoring as a supplement to other household incomes and/or a convenient source of part-time work for older, well educated people.
We believe that this growing trend for self-employment will continue over the next 10 years, perhaps pushing up the proportion of self-employed workers to closeto20%by2025.Theriseofthe‘gigeconomy’,asexemplifiedbydigitalagecompanies like Uber and Task Rabbit, may be at the forefront of this trend as discussed in previous PwC research13.
13 Seeouranalysisofthesharingeconomy’sgrowthpotentialat:http://www.pwc.co.uk/issues/megatrends/collisions/sharingeconomy.html
Figure 4.9 – Self-employment as a percentage of total employment
56
7
8
9
1011
12
13
14
15
Jun 14Jun 10Jun 06Jun 02Jun 98Jun 94Jun 90Jun 86Jun 82Jun 78
Self-
empl
oym
ent a
s a
%of
tota
l em
ploy
men
t
Source: PwC analysis of ONS data
Table 4.2: Highest and lowest rates of self-employment (as % of total jobs in sector)
Highest self-employment rates Lowest self-employment rates
Agriculture, forestry & fishing (48%) Public administration, defence and social security (3%)
Construction (37%) Water supply, waste & remediation activities (5%)
Other services (34%) Accommodation and food services, and financial and insurance activities (7%)
Source: PwC analysis of ONS data

36 UK Economic Outlook March 201636
Appendix A Outlook for the global economy
Table A.1 presents our latest main scenario projections for a selection of economies across the world.
Growth in leading developed economies remainedmodestin2015andthislookssettocontinuein2016,withtheUSnarrowly outpacing the UK as the fastest growingG7economy.OverallEurozonegrowth rate is picking up slowly led by SpainandIrelandreboundingfromearlier crises, but remains modest in the bigthreeeconomiesofGermany,Franceand Italy.
Growth in emerging markets has lost momentum with a slowdown in China andcontinuingrecessionsinBrazilandRussia, though the growth outlook appears brighter at present in India (which is a gainer from lower oil prices). In light of these uncertainties, global GDP projections remain moderate for 2016 at around 3.2% using PPP weights – estimated global growth is lower at around 2.7% in 2016 using MER weights as this gives less weight to China and India in particular.
Globalinflationhasfallenin2015asrateshoveraroundzeroformostoftheG7.Inflationisexpectedtoedgeback up through 2016 and beyond, however, as past commodity price decreases graduallyfalloutof12-monthinflationrate calculations.
These projections (including those for the UK) are updated monthly in our Global Economy Watch publication, which can be found at www.pwc.com/gew
Table A.1: Global economic prospects
Share of world GDP
Real GDP growth (%) Inflation (%)
2014 at MERs 2015e 2016p 2015e 2016p
US 22.5% 2.4 2.3 0.1 1.3
China 13.4% 6.9 6.5 1.5 1.8
Japan 6.0% 0.7 1.3 0.8 0.9
UK 3.8% 2.2 2.2 0.0 0.5
France 3.7% 1.1 1.3 0.1 0.4
Germany 5.0% 1.4 1.8 0.1 0.6
Greece 0.3% -0.3 -1.0 -1.1 0.1
Ireland 0.3% 6.5 5.0 0.0 1.0
Italy 2.8% 0.6 1.0 0.1 0.2
Netherlands 1.1% 1.9 1.7 0.2 1.0
Portugal 0.3% 1.5 1.5 0.5 0.8
Spain 1.8% 3.2 2.8 -0.6 0.2
Poland 0.7% 3.5 3.5 -0.9 0.8
Russia 2.4% -3.8 -1.1 15.5 7.9
Turkey 1.0% 3.4 3.3 7.7 8.5
Australia 1.9% 2.2 2.4 1.5 2.3
India 2.7% 7.1 7.7 -4.9 4.1
Indonesia 1.1% 5.2 4.8 6.8 6.1
South Korea 1.8% 2.6 3.1 0.8 1.5
Argentina 0.7% 2.0 1.7 17.0 25.0
Brazil 3.0% -3.8 -3.6 9.0 9.0
Canada 2.3% 1.3 1.6 1.1 1.7
Mexico 1.7% 2.5 2.7 2.7 3.2
South Africa 0.5% 1.5 1.0 4.6 5.8
Nigeria 0.7% 3.2 3.7 9.0 10.0
Saudi Arabia 1.0% 3.2 1.3 2.2 2.7
World (PPP) 3.2 3.2
World (Market Exchange Rates) 100% 2.6 2.7 1.9 2.3
Eurozone 17.4% 1.5 1.6 0.0 0.5
Source: Latest estimates for 2015 and PwC main scenario for 2016; IMF for GDP shares in 2014 at market exchange rates (MERs).

37UK Economic Outlook March 2016
Appendix B UKeconomictrends:1979–2015
Annual averages GDP growth Household expenditure growth
Manufacturing output growth*
Inflation (CPI**)
3 month interest rate (% annual average)
Current account balance (% of GDP)
PSNB*** (% of GDP)
1979 3.7 4.8 13.7 -0.6 4.5
1980 -2.2 0.1 16.6 0.6 4.1
1981 -0.8 0.3 13.9 1.7 3.3
1982 2.1 1.2 12.2 0.7 2.5
1983 4.2 4.4 10.1 0.3 3.3
1984 2.3 2.5 10.0 -0.5 3.6
1985 4.1 5.1 12.2 -0.2 2.8
1986 3.2 6.5 10.9 -1 2.2
1987 5.6 5.4 9.7 -1.6 1.4
1988 5.9 7.8 10.4 -3.8 -0.7
1989 2.5 3.9 5.2 13.9 -4.3 -0.7
1990 0.6 0.7 7.0 14.8 -3.3 0.7
1991 -1.3 -0.8 7.5 11.5 -1.4 2.8
1992 0.4 1.2 4.3 9.6 -1.6 6.0
1993 2.6 3.1 2.5 5.9 -1.4 7.2
1994 4.0 3.3 2.0 5.5 -0.5 6.2
1995 2.5 2.1 2.6 6.7 -0.7 5.0
1996 2.7 4.2 2.5 6.0 -0.6 3.6
1997 3.1 4.9 1.8 6.8 -0.2 1.7
1998 3.4 4.4 0.3 1.6 7.3 -0.4 -0.1
1999 3.1 5.0 0.6 1.3 5.4 -2.5 -1.2
2000 3.8 5.3 2.3 0.8 6.1 -2.2 -1.5
2001 2.8 3.7 -1.7 1.2 5.0 -2 -0.7
2002 2.5 4.1 -2.4 1.3 4.0 -2.1 1.8
2003 3.3 3.7 -0.6 1.4 3.7 -1.7 2.8
2004 2.5 3.5 1.7 1.3 4.6 -1.8 3.1
2005 3.0 3.1 0.0 2.1 4.7 -1.2 3.5
2006 2.7 2.0 2.1 2.3 4.8 -2.3 2.6
2007 2.6 3.1 0.7 2.3 6.0 -2.5 2.7
2008 -0.5 -0.7 -2.8 3.6 5.5 -3.6 5.0
2009 -4.2 -3.4 -9.4 2.2 1.2 -3 10.4
2010 1.5 0.0 4.5 3.3 0.7 -2.8 9.3
2011 2.0 -0.1 2.1 4.5 0.9 -1.7 7.2
2012 1.2 2.0 -1.4 2.8 0.8 -3.3 7.7
2013 2.2 1.9 -1.1 2.6 0.5 -4.5 5.9
2014 2.9 2.6 2.7 1.5 0.5 -5.1 5.5
2015 2.2 3.0 -0.2 0.0 0.5 -5.4 4.4
Average over economic cycles****
1979 - 1989 2.7 3.7 12.0 -0.4 2.7
1989 - 2000 2.3 3.0 3.5 8.5 -1.5 2.9
2000 - 2007 2.8 3.3 0.0 1.5 4.7 -1.9 1.7
* After the revisions to the national accounts data, pre-1998 data is not currently available ** Pre-1997 data estimated *** Public Sector Net Borrowing (calendar years excluding public sector banks) **** Peak-to-peak for GDP relative to trend Sources: ONS, Bank of England

38 UK Economic Outlook March 2016
Contacts and services
Economics and policyOur macroeconomics team produce the UK Economic Outlook three times a year.
The present report was written by JohnHawksworth,AndrewSentance,GeorgeSquibbsandEsmondBirnie.
Formoreinformationaboutthetechnicalcontent of this report please contact:
John Hawksworth [email protected] or02072131650
In addition, we provide a range of macroeconomic consulting services for clients, including:
• Revenue forecasting
• Stresstesting
• Economic impact analysis
Forenquiriesconcerningthese services, please contact Richard Boxshall on 020 7213 2079 or Richard Snookon02072121195.
Our UK economics and policy team is partofStrategy&PwC’sstrategyconsultingpractice.Strategy&isaglobal team of practical strategists committedtohelpingyouseizeessential advantage.
Our economics and policy practice offers a wider range of services, covering competition and regulation issues, litigation support, bids and business cases, public policy and project appraisals,financialeconomics,theeconomics of sustainability and macroeconomics.
Formoreinformationaboutthese services please visit our website (www.pwc.co.uk/economics) or contact the relevant person from the list to the right.
Competition Economics Tim Ogier +44 (0)20 7804 5207
Daniel Hanson +44 (0)20 7804 5774
Luisa Affuso +44 (0)20 7212 1832
Economic Regulation David Armstrong +44 (0)28 9041 5716
Dan Burke +44 (0)20 7212 6494
Alastair Macpherson +44 (0)20 7213 4463
Stuart Cook +44 (0)20 7804 7167
Economic Appraisal Nick Forrest +44 (0)20 7804 5695
Richard Boxshall +44 (0)20 7213 2079
Andrew Sentance +44 (0)20 7213 2068
Total impact measurement and management
Mark Ambler +44 (0)20 7213 1591
Mark Graham +44 (0)131 260 4054
Sustainabilty and climate change Andrew Thurley +44 (0)20 7212 6503
Health industries Tim Wilson +44 (0)20 7213 2147
Kalee Talvite-Brown +44 (0)20 7213 4372
Dan Burke +44 (0)20 7212 6494
Andy Statham +44 (0)20 7213 1486
Education and skills Christopher Kirk +44 (0)20 7213 3275
Michael Kane +44 (0)28 9041 5303
Sean Hughes +44 (0)20 7212 4194
International development David Armstrong +44 (0)28 9041 5716
Sheetal Vyas +44 (0)7730 146352
Zlatina Loudjeva +44 (0)20 7213 4815
Financial services Nick Forrest +44 (0)20 7804 5695
Darren Pigg +44 (0)20 7774 9989
Telecommunications Alastair Macpherson +44 (0)20 7213 4463
Media and entertainment David Lancefield +44 (0)20 7213 2263
Water Richard Laikin +44 (0)20 7212 1204
Power and utilities Stuart Cook +44 (0)20 7804 7167
Transport Daniel Hanson +44 (0)20 7804 5774
In response to reader feedback and our own sustainability drive, this updated version will not be available in hard copy. This will enable us to improve the functionality of the report as well as reduce our impact on global resources.
To receive future editions by e-mail please sign up on our website www.pwc.co.uk/economy or e-mail [email protected]


www.pwc.co.uk/economics
At PwC, our purpose is to build trust in society and solve important problems. We’re a network of firms in 157 countries with more than 208,000 people who are committed to delivering quality in assurance, advisory and tax services. Find out more and tell us what matters to you by visiting us at www.pwc.com.
This publication has been prepared for general guidance on matters of interest only, and does not constitute professional advice. You should not act upon the information contained in this publication without obtaining specific professional advice. No representation or warranty (express or implied) is given as to the accuracy or completeness of the information contained in this publication, and, to the extent permitted by law, PricewaterhouseCoopers LLP, its members, employees and agents do not accept or assume any liability, responsibility or duty of care for any consequences of you or anyone else acting, or refraining to act, in reliance on the information contained in this publication or for any decision based on it.
© 2016 PricewaterhouseCoopers LLP. All rights reserved. In this document, “PwC” refers to the UK member firm, and may sometimes refer to the PwC network. Each member firm is a separate legal entity. Please see www.pwc.com/structure for further details.
Design Group 30431 (03/16)