July 2015 UK Economic Outlook - PwC UK - Building ... UK Economic Outlook July 2015 Contents Section...
40
www.pwc.co.uk/economics UK Economic Outlook July 2015 UK housing market outlook: the continuing rise of Generation Rent Does trade hold the key to the UK services productivity puzzle? Visit our blog for periodic updates at: pwc.blogs.com/economics_in_business
Transcript of July 2015 UK Economic Outlook - PwC UK - Building ... UK Economic Outlook July 2015 Contents Section...

www.pwc.co.uk/economics
UK Economic Outlook
July 2015
UK housing market outlook: the continuing rise of Generation Rent
Does trade hold the key to the UK services productivity puzzle?
Visit our blog for periodic updates at: pwc.blogs.com/economics_in_business
2 UK Economic Outlook July 2015
Contents
Section
1. Summary 4
2. UK economic prospects 7
• 2.1 Recent developments and the present situation 8
• 2.2 Economic growth prospects: national, sectoral and regional 11
• 2.3Outlookforinflationandrealearningsgrowth 14
• 2.4Monetaryandfiscalpolicy 15
• 2.5Summaryandconclusions 16
3. UK housing market outlook: the continuing rise of Generation Rent 17
• Introduction and summary 17
• 3.1 Recent housing market developments 17
• 3.2Housingtenurein2025:thecontinuingriseofGenerationRent? 18
• 3.3 House price prospects: UK and regional projections 23
• Technical Annex – modelling methodologies 26
4. Does trade hold the key to the UK services productivity puzzle? 28
• Introduction and summary 28
• 4.1 The productivity puzzle 28
• 4.2 UK trade performance in services 31
• 4.3 Productivity outlook and policy implications 32
• 4.4 Conclusion 34
Appendices
A Outlook for the global economy 36
B UK economic trends: 1979-2014 37
Contacts and services 38

3UK Economic Outlook July 2015
Highlights and key messages for business and public policy
Key projections
2015 2016
Real GDP growth 2.6% 2.4%
Inflation (CPI) 0.3% 1.7%
Source: PwC main scenario projections
• The UK economy slowed a little in early2015butdomesticdemandgrowth remained relatively strong, helped by lower oil prices. Net exports continued to subtract from UK growth, reflectingsluggishgrowthinearly2015inboththeUSandtheEurozone.
• In our main scenario we expect UK GDPgrowthtoaveragearound2.6%in2015,whichcouldagainbethefastestintheG7,beforeeasingslightlytoaround2.4%in2016.Consumer spending and business investment will be the main drivers of UK growth in these years.
• Risks to growth are weighted somewhat to the downside in the short term due to international risks, including uncertainties relating to Greeceandtherecentturbulence in the Chinese stock market. But there are also upside possibilities in the medium term if the global environment improves and real wage and productivity growth rates accelerate in the UK.
• LondonandtheSouthEastcontinuetolead the recovery, with growth of around3%in2015,butallotherUKregions should also register positive real growthofaround1.8-2.5%in2015.
• Inflationseemslikelytorisebacktowardsits2%targetbytheendof2016, so the MPC may start to raise interest rates gradually from early next year. Businesses and households should plan for rates to be back to around 3-3.5%by2020.
• TheJulyBudgetconfirmedplansforsignificantfurtherfiscaltighteningtoeliminatethebudgetdeficitbeforethe end of this decade, but with a somewhat slower and smoother profileofpublicspendingcutsandaround £7 billion per annum of net tax rises to be phased in by 2020. The impact of £12 billion of welfare cuts
will be offset for some lower earners by the new National Living Wage.
House price growth moderates but rise of Generation Rent will continue
• UK house price growth has moderated recently, particularly in London. But lack of supply means that we expect medium-term UK house pricegrowthtoaveragejustover5%per annum over the period to 2020.
• This would be somewhat higher than expected average earnings growth of around3-4%,implyingsomefurtherworsening of affordability problems in getting on to the housing ladder, particularly as mortgage rates are also likely to increase gradually over the rest of this decade.
• As a result, we expect a continuing rise in the proportion of households rentingfromaround20%nowtoaround25%by2025.For20-39yearolds, we would expect over half to be rentingby2025,implyingacontinuing rise in the size of ‘GenerationRent’.
• At the other end of the housing market, we would also expect a growing number of older households to own their home outright, while fewer would have mortgages. In total, we project the owner occupation rate tofalltoaround60%by2025,downfromitspeakofjustunder70%inthemid-2000s.
• Increasing the supply of affordable housing in the long run, which the
government has set as an objective, will require a range of measures including further planning reform, action to address skills shortages in the housebuilding sector and enhancedfinancialincentivestobuildmore homes. But cuts to social rents announced in the Budget will tend to work against this for local authorities and housing associations, while private developers may be cautious aboutexpandingtoorapidly.Soweexpect housing supply shortages to persist for at least the next decade.
Services sector remains key driver of growth and trade
• The services sector will remain the main engine of UK growth for both output and employment, with manufacturing and construction growth having slowed since last summer.
• Productivity growth has been relatively weak since the crisis in financialservicesandalsoremainssubdued in the public sector. But it remains stronger in other non-financialprivateservicessectors,where we estimate the long-term trend productivity growth rate at around1.7%perannum.
• Serviceshavealsobecomeincreasingly important for UK trade. Indeed we expect the total value of UK services exports to exceed that of manufactured goods exports by 2020.
3
4 UK Economic Outlook July 2015
1 – Summary
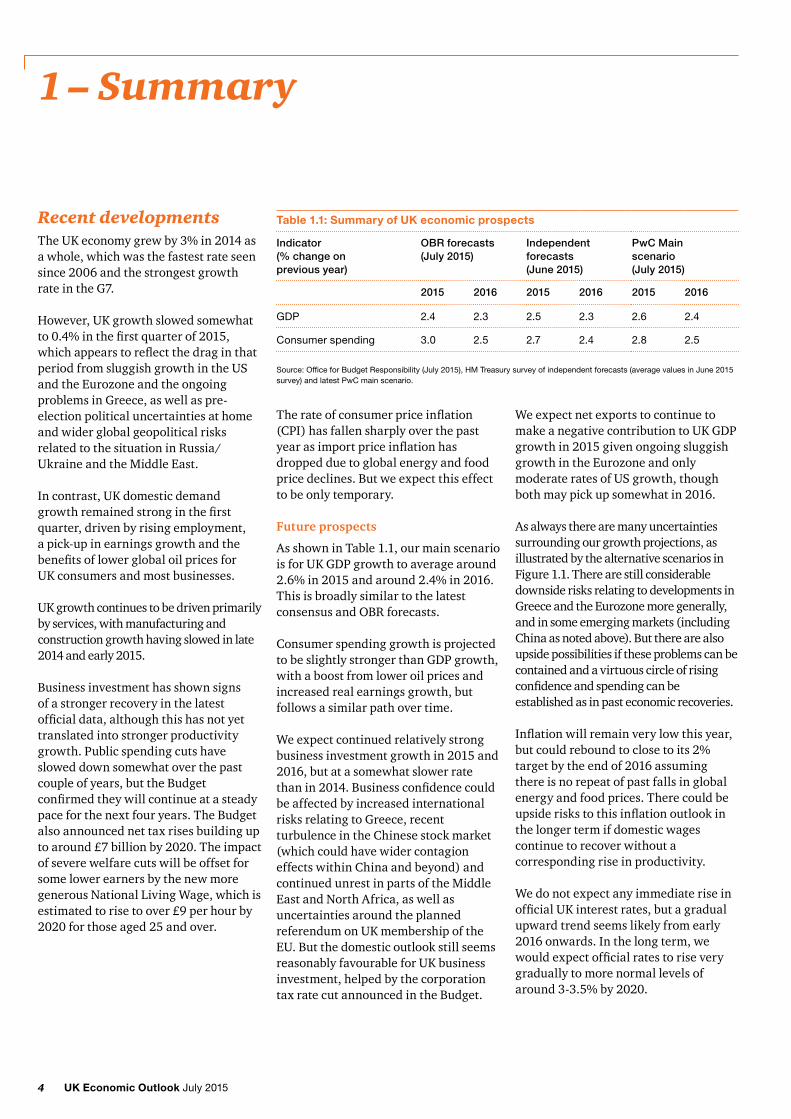
Recent developmentsTheUKeconomygrewby3%in2014asa whole, which was the fastest rate seen since 2006 and the strongest growth rateintheG7.
However, UK growth slowed somewhat to0.4%inthefirstquarterof2015,whichappearstoreflectthedraginthatperiodfromsluggishgrowthintheUSand the Eurozone and the ongoing problemsinGreece,aswellaspre-election political uncertainties at home and wider global geopolitical risks related to the situation in Russia/Ukraine and the Middle East.
In contrast, UK domestic demand growthremainedstronginthefirstquarter, driven by rising employment, a pick-up in earnings growth and the benefitsoflowerglobaloilpricesfor UK consumers and most businesses.
UK growth continues to be driven primarily by services, with manufacturing and construction growth having slowed in late 2014andearly2015.
Business investment has shown signs of a stronger recovery in the latest officialdata,althoughthishasnotyettranslated into stronger productivity growth. Public spending cuts have slowed down somewhat over the past couple of years, but the Budget confirmedtheywillcontinueatasteadypace for the next four years. The Budget also announced net tax rises building up to around £7 billion by 2020. The impact of severe welfare cuts will be offset for some lower earners by the new more generous National Living Wage, which is estimated to rise to over £9 per hour by 2020forthoseaged25andover.
Table 1.1: Summary of UK economic prospects
Indicator (% change on previous year)
OBR forecasts (July 2015)
Independent forecasts (June 2015)
PwC Main scenario (July 2015)
2015 2016 2015 2016 2015 2016
GDP 2.4 2.3 2.5 2.3 2.6 2.4
Consumer spending 3.0 2.5 2.7 2.4 2.8 2.5
Source: Office for Budget Responsibility (July 2015), HM Treasury survey of independent forecasts (average values in June 2015 survey) and latest PwC main scenario.
Therateofconsumerpriceinflation(CPI) has fallen sharply over the past yearasimportpriceinflationhasdropped due to global energy and food price declines. But we expect this effect to be only temporary.
Future prospects
As shown in Table 1.1, our main scenario isforUKGDPgrowthtoaveragearound2.6%in2015andaround2.4%in2016.This is broadly similar to the latest consensus and OBR forecasts.
Consumer spending growth is projected tobeslightlystrongerthanGDPgrowth,with a boost from lower oil prices and increased real earnings growth, but follows a similar path over time.
We expect continued relatively strong businessinvestmentgrowthin2015and2016, but at a somewhat slower rate thanin2014.Businessconfidencecouldbe affected by increased international risksrelatingtoGreece,recentturbulence in the Chinese stock market (which could have wider contagion effects within China and beyond) and continued unrest in parts of the Middle East and North Africa, as well as uncertainties around the planned referendum on UK membership of the EU. But the domestic outlook still seems reasonably favourable for UK business investment, helped by the corporation tax rate cut announced in the Budget.
We expect net exports to continue to makeanegativecontributiontoUKGDPgrowthin2015givenongoingsluggishgrowth in the Eurozone and only moderateratesofUSgrowth,thoughboth may pick up somewhat in 2016.
As always there are many uncertainties surrounding our growth projections, as illustrated by the alternative scenarios in Figure1.1.Therearestillconsiderabledownside risks relating to developments in GreeceandtheEurozonemoregenerally,and in some emerging markets (including China as noted above). But there are also upside possibilities if these problems can be contained and a virtuous circle of rising confidenceandspendingcanbeestablished as in past economic recoveries.
Inflationwillremainverylowthisyear,butcouldreboundtoclosetoits2%target by the end of 2016 assuming there is no repeat of past falls in global energy and food prices. There could be upsideriskstothisinflationoutlookinthe longer term if domestic wages continue to recover without a corresponding rise in productivity.
We do not expect any immediate rise in officialUKinterestrates,butagradualupward trend seems likely from early 2016 onwards. In the long term, we wouldexpectofficialratestoriseverygradually to more normal levels of around3-3.5%by2020.
5UK Economic Outlook July 2015
Higher interest rates will help savers andreducepensionfunddeficits,butborrowers (including businesses and the government) might gain from locking in funding now for long term investments such as infrastructure and housing. Households need to bear in mind likely future interest rate rises in any decisions on mortgages or other longer term loans.
Housing market outlook: the continuing rise of Generation Rent
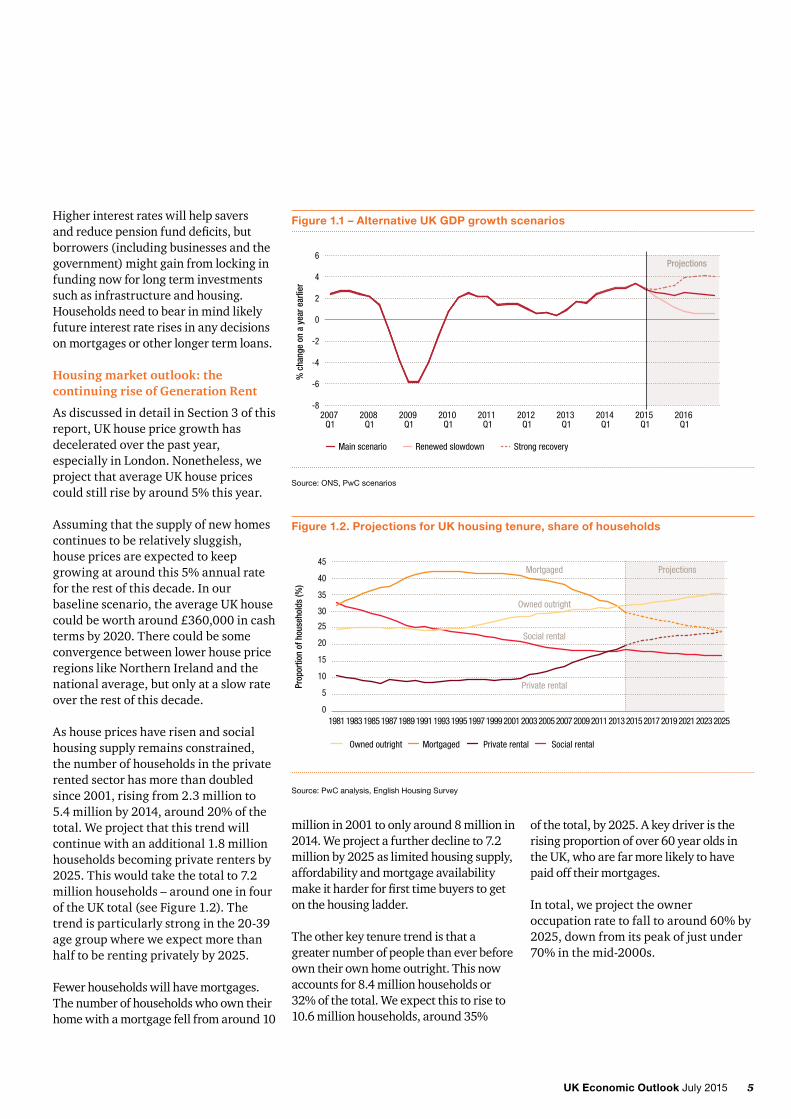
AsdiscussedindetailinSection3ofthisreport, UK house price growth has decelerated over the past year, especially in London. Nonetheless, we project that average UK house prices couldstillrisebyaround5%thisyear.
Assuming that the supply of new homes continues to be relatively sluggish, house prices are expected to keep growingataroundthis5%annualratefor the rest of this decade. In our baseline scenario, the average UK house could be worth around £360,000 in cash terms by 2020. There could be some convergence between lower house price regions like Northern Ireland and the national average, but only at a slow rate over the rest of this decade.
As house prices have risen and social housing supply remains constrained, the number of households in the private rented sector has more than doubled since 2001, rising from 2.3 million to 5.4millionby2014,around20%ofthetotal. We project that this trend will continue with an additional 1.8 million households becoming private renters by 2025.Thiswouldtakethetotalto7.2million households – around one in four oftheUKtotal(seeFigure1.2).Thetrend is particularly strong in the 20-39 age group where we expect more than halftoberentingprivatelyby2025.
Fewerhouseholdswillhavemortgages.The number of households who own their home with a mortgage fell from around 10
million in 2001 to only around 8 million in 2014. We project a further decline to 7.2 millionby2025aslimitedhousingsupply,affordability and mortgage availability makeitharderforfirsttimebuyerstogeton the housing ladder.
The other key tenure trend is that a greater number of people than ever before own their own home outright. This now accounts for 8.4 million households or 32%ofthetotal.Weexpectthistoriseto10.6millionhouseholds,around35%
Figure 1.2. Projections for UK housing tenure, share of households
Source: PwC analysis, English Housing Survey
0
5
10
15
20
25
30
35
40
45
20252023202120192017201520132011200920072005200320011999199719951993199119891987198519831981
Prop
ortio
n of
hou
seho
lds
(%)
ProjectionsMortgaged
Owned outright
Social rental
Private rental
Owned outright Mortgaged Private rental Social rental
ofthetotal,by2025.Akeydriveristherising proportion of over 60 year olds in the UK, who are far more likely to have paid off their mortgages.
In total, we project the owner occupationratetofalltoaround60%by2025,downfromitspeakofjustunder70%inthemid-2000s.
Figure 1.1 – Alternative UK GDP growth scenarios
Source: ONS, PwC scenarios
-8
-6
-4
-2
0
2
4
6
2016 Q1
2015 Q1
2014 Q1
2013 Q1
2012 Q1
2011 Q1
2010 Q1
2009 Q1
2008 Q1
2007 Q1
Projections
% c
hang
e on
a y
ear e
arlie
r
Main scenario Renewed slowdown Strong recovery

6 UK Economic Outlook July 2015
Increasing the supply of affordable housing in the long run, which the government has set as an objective, will require a range of measures including further planning reform, action to address skills shortages in the housebuilding sector and enhanced financialincentivestobuildmorehomes. But cuts to social rents announced in the Budget will tend to work against this for local authorities and housing associations, while private developers may be cautious about expandingtoorapidly.Soweexpecthousing supply shortages to persist for at least the next decade.
The UK services productivity puzzle and trade performance
The UK has a highly services-oriented economy.Servicesmakeupnearly80%ofGDPandmorethan80%ofemployment.Sounderstandingtheservicessectoriscritical to analysing the performance of the British economy as a whole and this is discussedindetailinSection4ofthisreportinanarticlebyAndrewSentance,our senior economic adviser.
Recent economic debate has focussed on the so-called “productivity puzzle”. Output per person employed (or per hour) has not grown as strongly since thefinancialcrisisasbefore.Thebulk ofthispuzzlereflectstheperformanceof the services sector. In the decade from1995to2005,servicessectorproductivitygrewby2%perannumonaverage.Since2005,ithasincreasedbyanaverageofjust0.6%peryear-lessthan a third of the previous rate.
Our analysis suggests that three main factors have contributed to this productivitygrowthslowdown.First, a number of highly tradeable services activities provided a boost to productivitybeforethefinancialcrisis.Thesesectorsbenefitedfromtheglobalisation of the world economy, providing a temporary increase in the
pre-crisis productivity trend. In other words, productivity growth before the crisiswasinflatedbythisone-offshift.
Second,thefinancialandpropertysectorshave been a serious drag on productivity since the crisis, as banks have restructured and had to deal with increased regulation. In retrospect, the strong pre-crisis productivity growth of the banking sector looks to have been unsustainable.
Third, public sector productivity has also been disappointing both before and particularly after the crisis – at least accordingtotheofficialGDPestimates(though there are serious measurement difficultiesinthisarea).
Once we allow for these three factors, the core productivity rate in UK private non-financialserviceshasbeenonamore consistent trend since the mid-1990s, which we estimate at around 1.7%perannum(seeFigure1.3).
OuranalysisinSection4alsohighlightsthe potential role of trade in boosting productivity within UK services. In general, services activities are less open to trade than the production of goods. But the UK appears to have a strong
Figure 1.3: Core UK private services productivity trend has been around 1.7% since 1995
Source: ONS
95
100
105
110
115
120
125
130
135
140
145
20142013201220112010200920082007200620052004200320022001200019991998199719961995
Outp
ut p
er jo
b in
UK
serv
ices
, 199
5=10
0
Total public and private servicesCore private services 1.7% Trend
comparative advantage in many tradeable services sector activities and this has contributed to a substantial trade surplus in services, which is now around5%ofGDP–offsettingtheUK’sdeficitinmanufacturedtrade.Futuretrade agreements which open up overseasmarketstoUKservicesfirmscouldbehighlybeneficialforthefuturegrowth of the UK economy.
Extrapolating from recent trends, we project that the total value of UK services exports will exceed that of manufactured goods exports by 2020, thefirsttimethishashappened.
7UK Economic Outlook July 2015
2 – UK Economic prospects
Key points• TheGDPgrowthrateintheUK was3%in2014,thehighestintheG7.Growthslowedinearly2015, but there are signs of a revival more recently.
• We expect the UK economy to grow byaround2.6%in2015asawhole,somewhat above trend and possibly againthefastestintheG7,beforemoderatingslightlytoaround2.4%in 2016 in our main scenario.
• The services sector remains the key driver of UK growth, which continues to be powered by domestic private demand. The construction sector has cooled from the rapid growth rates seen in mid-2014, though there were signs in June of a post-election upturn. The manufacturing sector continues to be held back by relatively weak growth in the Eurozone and the comparative strength of the pound against the euro.
• LondonandtheSouthEasthavebeen the fastest growing regions in the UK since the recession and are expected to maintain this position withaveragegrowthofcloseto3%in2015and2016.However,mostregions in the UK are expected to growbymorethan2%perannumin2015-16,exceptforNorthern Ireland where average growth may beslightlybelow2%.
• The UK recovery is still exposed to downside risks, including uncertaintiesrelatingtoGreeceandpossiblefinancialcontagioneffectsfrom recent turbulence in Chinese stock markets. However, there are also upside possibilities from stronger than expected trends in real wage and productivity growth and, with the election out of the way, UK business investment.
• Headlineinflationhasbeenclose to zero recently, but this is mostly a temporary effect of past global energy and food price falls. As these falloutofthe12-monthinflationratetowardstheendof2015,wewouldexpectinflationtorisebacktowardsits2%targetratebytheendof2016.Higher unit labour cost growth as wages rise will also contribute to higherinflationinthemediumterm.
• The Bank of England is likely to respond to this by raising interest rates gradually from early 2016 onwards, though a case could be made for moving earlier than that. In any event, businesses and households should prepare for higher borrowing costs in the medium term, perhaps reachingaround3-3.5%by2020.
• The July Budget set out plans for furtherfiscaltighteningoverthenextfour years through a combination of public service spending cuts, welfare benefitcutsandnettaxrises,whichshouldeliminatethebudgetdeficitbefore the end of the decade. This will be a drag on growth over this period, though there should be offsettingbenefitsfromlowerlong-term interest rates than would otherwise be the case.
IntroductionIn this section of the report we describe recent developments in the UK economy and review future prospects. The discussion covers:
2.1 Recent developments and the present situation
2.2 Economic growth prospects: national, sectoral and regional
2.3Outlookforinflationandrealearnings growth
2.4Monetaryandfiscalpolicyoptions
2.5Summaryandconclusions
8 UK Economic Outlook July 2015
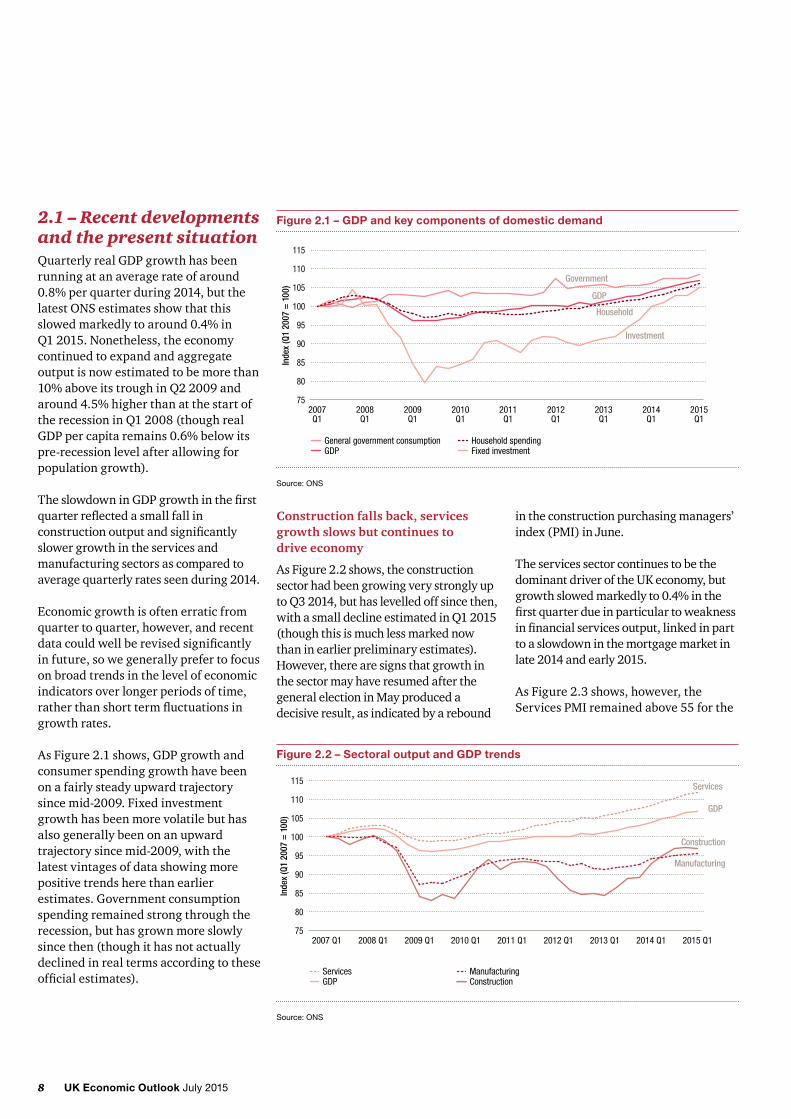
2.1 – Recent developments and the present situationQuarterlyrealGDPgrowthhasbeenrunning at an average rate of around 0.8%perquarterduring2014,butthelatestONSestimatesshowthatthisslowedmarkedlytoaround0.4%in Q12015.Nonetheless,theeconomycontinued to expand and aggregate output is now estimated to be more than 10%aboveitstroughinQ22009andaround4.5%higherthanatthestartofthe recession in Q1 2008 (though real GDPpercapitaremains0.6%belowitspre-recession level after allowing for population growth).
TheslowdowninGDPgrowthinthefirstquarterreflectedasmallfallinconstructionoutputandsignificantlyslower growth in the services and manufacturing sectors as compared to average quarterly rates seen during 2014.
Economic growth is often erratic from quarter to quarter, however, and recent datacouldwellberevisedsignificantlyin future, so we generally prefer to focus on broad trends in the level of economic indicators over longer periods of time, ratherthanshorttermfluctuationsingrowth rates.
AsFigure2.1shows,GDPgrowthandconsumer spending growth have been on a fairly steady upward trajectory sincemid-2009.Fixedinvestmentgrowth has been more volatile but has also generally been on an upward trajectory since mid-2009, with the latest vintages of data showing more positive trends here than earlier estimates.Governmentconsumptionspending remained strong through the recession, but has grown more slowly since then (though it has not actually declined in real terms according to these officialestimates).
Figure 2.1 – GDP and key components of domestic demand
Source: ONS
75
80
85
90
95
100
105
110
115
2015Q1
2014Q1
2013Q1
2012Q1
2011Q1
2010Q1
2009Q1
2008Q1
2007Q1
Inde
x (Q
1 20
07 =
100
)
General government consumption Household spendingGDP Fixed investment
Government
GDP
Household
Investment
Figure 2.2 – Sectoral output and GDP trends
Source: ONS
75
80
85
90
95
100
105
110
115
2015 Q12014 Q12013 Q12012 Q12011 Q12010 Q12009 Q12008 Q12007 Q1
Inde
x (Q
1 20
07 =
100
)
Services ManufacturingGDP Construction
Services
GDP
Manufacturing
Construction
Construction falls back, services growth slows but continues to drive economy
AsFigure2.2shows,theconstructionsector had been growing very strongly up to Q3 2014, but has levelled off since then, withasmalldeclineestimatedinQ12015(though this is much less marked now than in earlier preliminary estimates). However, there are signs that growth in the sector may have resumed after the general election in May produced a decisive result, as indicated by a rebound
intheconstructionpurchasingmanagers’index (PMI) in June.
The services sector continues to be the dominant driver of the UK economy, but growthslowedmarkedlyto0.4%inthefirstquarterdueinparticulartoweaknessinfinancialservicesoutput,linkedinpartto a slowdown in the mortgage market in late2014andearly2015.
AsFigure2.3shows,however,theServicesPMIremainedabove55forthe

9UK Economic Outlook July 2015
Figure 2.4 – Productivity and employment
Source: ONS
94
96
98
100
102
104
106
2014 Q12013 Q12012 Q12011 Q12010 Q12009 Q12008 Q12007 Q1
Inde
x (Q
1 20
07 =
100
)
Output per job Workforce jobs
Jobs
Productivity
firstfivemonthsofthisyear,withthelatest June data showing a pick-up to 58.5,perhapsagaininpartduetoareduction in political uncertainty following the election. This suggests some pick-up in services output growth betweenthefirstandsecondquarters,which should also feed through into strongeroverallGDPgrowth.
The manufacturing sector also disappointed with estimated growth ofjust0.1%inQ12015,andthemanufacturing PMI has also remained relatively subdued in the second quarter, with the latest data showing a decline to 51.4inJune,whichwasa26-monthlow(seeFigure2.3).Itseemstheboosttothissector from lower oil prices has not yet come through with any strength, while continuing relatively sluggish growth in theEurozone,uncertaintyaboutGreeceand the relatively strong pound against the euro, has held back manufacturing output growth recently. Nonetheless, the data suggest modest but positive growth duringthefirsthalfof2015,ratherthanan outright decline in output in the sector.
Employment has risen strongly since 2012, holding down productivity growth
Figure2.4showshowthenumberofworkforce jobs and productivity (definedhereasoutputperjob)havechanged since 2007. The workforce has expanded rapidly for the past three years, while productivity has been broadlyflataccordingtotheofficialdatasince early 2012, having earlier shown a more normal cyclical recovery between mid-2009 and late 2011.
These two trends are connected and reflectarangeofcomplexfactorsthatvarysignificantlybyindustrysector,including measurement issues for services sector productivity in particular. The general topic of productivity growth is discussed in
Figure 2.3 – Purchasing Managers’ Indices of business activity
Source: Markit/CIPS
30
35
40
45
50
55
60
65
2015 Jan
2014 Jan
2013 Jan
2012 Jan
2011 Jan
2010 Jan
2009 Jan
2008 Jan
2007 Jan
Services Manufacturing
Services
ManufacturingAbove 50 indicates rising activity levels
muchmoredetailbyAndrewSentance,oursenioreconomicadviser,inSection4 below, but the general message is that weakness since the recession ended in mid-2009 has been concentrated in a few sectors such as public services, financialservicesandNorthSeaoilandgas. Productivity trends in manufacturingandthenon-financialprivate services sector have generally been stronger and should remain so going forward.
Consumers more confident now than at any point since 2008
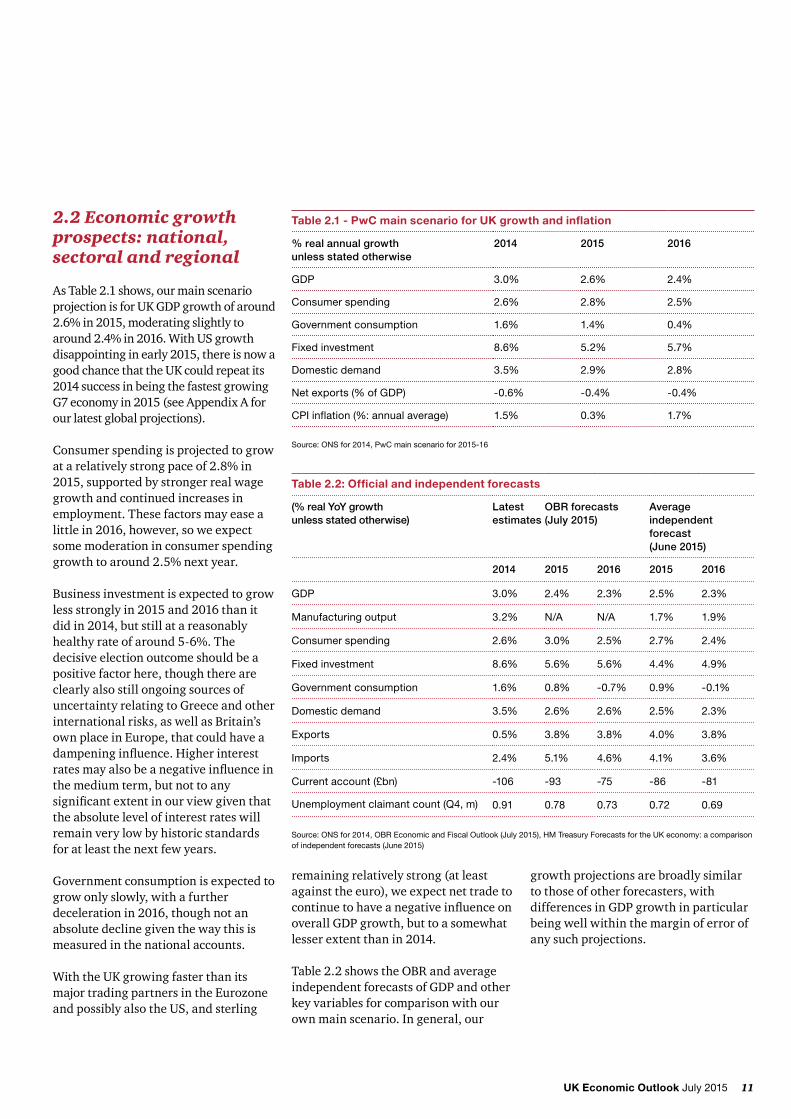
Figure2.5showsresultsfromPwC’sregular consumer survey alongside trends in retail sales volumes since 2008. Consumerconfidencehasbeenvolatileover this period, but has shown a clear positive trend over the past two years, which also matches the upward trend in retail sales volumes over this period.
Growthinretailsalesvalueshas,however, been much less strong over the
10 UK Economic Outlook July 2015
Figure 2.6 – Equity market indices
Source: Thomson Reuters Datastream
40
60
80
100
120
140
160
2015 Jan2014 Jan2013 Jan2012 Jan2011 Jan2010 Jan2009 Jan2008 Jan2007 Jan
Inde
x (J
anua
ry 2
007
= 1
00)
FTSE 100 Euronext 100 Dow Jones Industrial
US
UK
Eurozone
Figure 2.5 – Consumer confidence and retail sales volumes
Sources: PwC Consumer survey, ONS
-0.60
-0.50
-0.40
-0.30
-0.20
-0.10
0
0.10
90
95
100
105
110
115
Cons
umer
con
fiden
ce (n
et b
alan
ce)
Reta
il sa
les
inde
x (J
an 2
007
= 1
00)
Consumer confidence (LHS) Retail sales volume (RHS)
2007Jan
2008Jan
2009Jan
2010Jan
2011Jan
2012Jan
2013Jan
2014Jan
Consumer confidence
Retail sales volume
past12-18months,reflectingatrendtodeflationonthehighstreetdrivenbothby falls in global commodity prices and intense price competition particularly in the supermarket sector where discounters have played an increasing role in the market.
Stocks in Europe rally during Q1 2015 before flattening off in second quarter
AsFigure2.6shows,equitymarketsindeveloped economies have grown at varyingpacessincetheglobalfinancialcrisis.TheUSmarketledtheway,withafairly consistent underlying upward trend since 2009. The UK market initially recovered broadly in line with theUSuntil2011,buthasshownashallower upward trend since then, perhaps because of a greater sensitivity to European economic problems and wider geopolitical risks for those international companies that dominate theFTSEindex.
The European equity market (Euronext 100 index) took longer to recover, only starting this process on a sustained basis from mid-2012 onwards when the ECB introduced its Outright Monetary Transactions (OMT) mechanism and vowed to ‘do whatever it takes to preservetheeuro’.Therewasaparticularly strong surge in the EuropeanindexinQ12015whentheECB announced its new Quantitative Easing (QE) asset purchase programme, though this levelled off in the second quarter as ongoing uncertainties around Greecetookcentrestage.
At the time of writing, the outcome of theGreekcrisisremainshighlyuncertain, so we can expect this to be the source of continued volatility in Europeanfinancialmarketsandbeyond.However, with QE and OMT, the ECB does now have the tools to limit contagionfromapossibleGreeceexitfrom the euro to other markets in
Europe and elsewhere. Other Eurozone crisiseconomieslikeSpain,IrelandandPortugal are also in better shape than they were in 2011-12, as is the European banking sector more generally. As a result,while‘Grexit’couldstillleadtoconsiderable short-term turbulence in markets, we do not think its effect would be nearly as severe as if this had happened three or four years ago1.
At the time of writing, there is also concernaboutfinancialcontagioneffects from the sharp falls in the Chinese stock market in recent months. While we assume these can be contained by the Chinese authorities in our main scenario, it remains a downside risk to our international projections that could also have knock-on effects on UK financialmarkets.
1 FormorediscussionofthepotentialimpactofGrexit,seeourEconomicsblog: http://pwc.blogs.com/economics_in_business/2015/07/what-would-grexit-mean-for-the-eurozone-and-uk-economies.html
11UK Economic Outlook July 2015
2.2 Economic growth prospects: national, sectoral and regional
As Table 2.1 shows, our main scenario projectionisforUKGDPgrowthofaround2.6%in2015,moderatingslightlytoaround2.4%in2016.WithUSgrowthdisappointinginearly2015,thereisnowagood chance that the UK could repeat its 2014 success in being the fastest growing G7economyin2015(seeAppendixAforour latest global projections).
Consumer spending is projected to grow atarelativelystrongpaceof2.8%in2015,supportedbystrongerrealwagegrowth and continued increases in employment. These factors may ease a little in 2016, however, so we expect some moderation in consumer spending growthtoaround2.5%nextyear.
Business investment is expected to grow lessstronglyin2015and2016thanitdid in 2014, but still at a reasonably healthyrateofaround5-6%.Thedecisive election outcome should be a positive factor here, though there are clearly also still ongoing sources of uncertaintyrelatingtoGreeceandotherinternationalrisks,aswellasBritain’sown place in Europe, that could have a dampeninginfluence.Higherinterestratesmayalsobeanegativeinfluenceinthe medium term, but not to any significantextentinourviewgiventhatthe absolute level of interest rates will remain very low by historic standards for at least the next few years.
Governmentconsumptionisexpectedtogrow only slowly, with a further deceleration in 2016, though not an absolute decline given the way this is measured in the national accounts.
With the UK growing faster than its major trading partners in the Eurozone andpossiblyalsotheUS,andsterling
Table 2.2: Official and independent forecasts
(% real YoY growth unless stated otherwise)
Latest estimates
OBR forecasts (July 2015)
Average independent forecast (June 2015)
2014 2015 2016 2015 2016
GDP 3.0% 2.4% 2.3% 2.5% 2.3%
Manufacturing output 3.2% N/A N/A 1.7% 1.9%
Consumer spending 2.6% 3.0% 2.5% 2.7% 2.4%
Fixed investment 8.6% 5.6% 5.6% 4.4% 4.9%
Government consumption 1.6% 0.8% -0.7% 0.9% -0.1%
Domestic demand 3.5% 2.6% 2.6% 2.5% 2.3%
Exports 0.5% 3.8% 3.8% 4.0% 3.8%
Imports 2.4% 5.1% 4.6% 4.1% 3.6%
Current account (£bn) -106 -93 -75 -86 -81
Unemployment claimant count (Q4, m) 0.91 0.78 0.73 0.72 0.69
Source: ONS for 2014, OBR Economic and Fiscal Outlook (July 2015), HM Treasury Forecasts for the UK economy: a comparison of independent forecasts (June 2015)
remaining relatively strong (at least against the euro), we expect net trade to continuetohaveanegativeinfluenceonoverallGDPgrowth,buttoasomewhatlesser extent than in 2014.
Table 2.2 shows the OBR and average independentforecastsofGDPandotherkey variables for comparison with our own main scenario. In general, our
growth projections are broadly similar to those of other forecasters, with differencesinGDPgrowthinparticularbeing well within the margin of error of any such projections.
Table 2.1 - PwC main scenario for UK growth and inflation
% real annual growth unless stated otherwise
2014 2015 2016
GDP 3.0% 2.6% 2.4%
Consumer spending 2.6% 2.8% 2.5%
Government consumption 1.6% 1.4% 0.4%
Fixed investment 8.6% 5.2% 5.7%
Domestic demand 3.5% 2.9% 2.8%
Net exports (% of GDP) -0.6% -0.4% -0.4%
CPI inflation (%: annual average) 1.5% 0.3% 1.7%
Source: ONS for 2014, PwC main scenario for 2015-16

12 UK Economic Outlook July 2015
Alternative growth scenarios
We have considered two alternative UK growth scenarios in addition to our mainscenario,asFigure2.7shows:
• Our ‘strong recovery’ scenario projects growth accelerating to around4%in2016.Thisrelativelyoptimistic scenario assumes stronger growth in the Eurozone and other global economies, which would also boost consumer and business confidenceintheUK.Thisin turn would result in businesses undertaking greater investment activity, an increase in consumer spending and greater UK exports.
• Our ‘renewed slowdown’ scenario, bycontrast,seesUKGDPgrowthslowingdowntobelow1%in2016.This is based on the assumption of adverse shocks such as a chaotic GreekexitfromtheEurozone,afurtherintensificationofunrestinthe Middle East and North Africa and significantlyweakereconomicgrowth in key emerging markets including China. These events would have negative implications for UK businesses,damagingconfidenceand
Figure 2.7 – Alternative UK GDP growth scenarios
Source: ONS, PwC scenarios
-8
-6
-4
-2
0
2
4
6
2016 Q1
2015 Q1
2014 Q1
2013 Q1
2012 Q1
2011 Q1
2010 Q1
2009 Q1
2008 Q1
2007 Q1
Projections
% c
hang
e on
a y
ear e
arlie
r
Main scenario Renewed slowdown Strong recovery
UK average this year, but almost all should see positive growth of more than 2%in2015,exceptNorthernIrelandwhichmaybeslightlylowerat1.8%inour main scenario.
At this stage our model projects all regions to show a slight deceleration in growth in 2016 in line with national economic trends, but this is highly uncertain at this stage.
It is important to note here that regional data are much less timely than national data. As a result, the margins of error around these regional projections are even larger than for the national growth projections, so they can only be taken as illustrative of broad directional trends. Smalldifferencesinprojectedgrowthrates between regions are not of any practicalsignificance.
leading to cutbacks in investment and employment, thereby also depressing consumer spending.
We do not believe that these alternative scenarios are the most likely outcomes, but they are certainly well within the bounds of plausibility. Businesses should ensure they have appropriate contingency plans in place to deal with the possibility of these kinds of events and outcomes.
Positive growth expected in all key sectors of the economy, but with some significant variations across sectors and over time
The sector dashboard in Table 2.3 shows the actual growth rates for 2014, alongside our projected growth rates for2015and2016,forfiveofthemainsectors within the UK economy. The table also includes a summary of the key issues affecting each sector.
Regional prospects
LondonandtheSouthEastareexpectedto grow at the fastest pace of all UK regionsataround3%in2015,asFigure2.8 shows. Other regions are expected to expand at a slightly slower rate than the

13UK Economic Outlook July 2015
Table 2.3: UK sector dashboard
Growth
Sector and GVA share 2014 2015p 2016p Key issues/trends
Manufacturing (10%) 3.1% 2.0% 3.1% Manufacturing PMI has remained above 50 for the first 6 months of the year despite official figures showing slow growth.
Low oil prices should help but sluggish Eurozone growth and the Greek crisis remain negative factors for UK goods exporters.
Construction (6%) 9.5% 2.3% 2.0% The construction sector has slowed since mid-2014 when it was growing very rapidly. Output growth rates in residential, commercial and civil engineering activity have all slowed down since then.
However, construction PMI hit its highest level of 2015 in June, perhaps boosted by the decisive election result in May.
Distribution, hotels & restaurants (14%)
4.8% 4.0% 2.6% Retail sales volumes have been growing strongly, but value growth has been lower due to fierce price competition on the high street, particularly for supermarkets.
Real earnings growth have lifted consumer purchasing power recently and should keep spending strong this year, but with some reversion to trend expected next year.
Business services and finance (31%) 3.8% 3.1% 3.2% The business services sector continues to lead the expansion of the UK economy.
However, the financial sector remains exposed to important risks and regulatory constraints that may limit future growth.
Government and other services (23%) 1.1% 0.9% 1.2% Government services output has expanded slowly and is expected to continue to do so given continuing public spending constraint.
Total GDP 3.0 % 2.6% 2.4%
Sources: ONS for 2014, PwC for 2015 and 2016 main scenario projections and key issues. These are only five of the most important sectors of the economy, so their GVA shares only add up to around 84% rather than 100%.
Figure 2.8 – PwC main scenario for output growth by region
Source: PwC analysis
0.0
0.5
1.0
1.5
2.0
2.5
3.0
3.5
UKN IrelandNorth EastWalesScotlandNorthWest
SouthWest
Yorkshire &Humberside
EastAnglia
WestMidlands
EastMidlands
South EastLondon
% g
row
th b
y re
gion
2015 2016
3.1%2.9% 2.9% 2.9%
2.5% 2.5% 2.5% 2.4% 2.5% 2.4% 2.5% 2.4% 2.5% 2.2%2.5%
2.3% 2.4%2.2% 2.2% 2.1% 2.0% 2.0%
1.8% 1.7%
2.6%2.4%
14 UK Economic Outlook July 2015
2.3 Outlook for inflation and real earnings growth Inflation falls to around zero, but likely to be only a temporary dip
Consumerpriceinflation(asmeasured byCPI)hadbeenfluctuatingclosetodeflationarylevelsinthefirstquarter of2015andwasdrivendownto-0.1% in April. The primary causes of this downward trend included falls in costs of imported goods (especially food and energy) over the past year, supermarket price wars and cheaper transport services. The timing of the Easter break in April exacerbated the effect of decreased transport costs, but thiswasreversedinMay.Inflationwaszero in the year to June.
The Bank of England has estimated that around three-quarters of the 2 percentagepointshortfallofinflationfrom its target was attributable to falling prices of energy, food and other imported goods. The other quarter of theshortfallreflectedslowgrowthinearnings and weak upward domestic price pressure. It can be expected that the windfall from the shock of low energy, food and other imported goods will dissipate over the next 12 months, leadingtohigherinflationlaterin2015and through 2016.
Alternative inflation scenarios
AsFigure2.9shows,inourmainscenario, we expect the annual rate of inflationtoaverage0.3%thisyearand1.7%in2016,returningclosetotargetbythe end of next year. Our expectations thatinflationwillincreasein2016areinline with those of the OBR and most independent forecasters. This higher inflationratewillresultnotonlyfrompast international price shocks dissipating but also domestic wage pressures building up as the labour market tightens, which is already evident in the earnings data for recent months.
Figure 2.9 – Alternative UK inflation (CPI) scenarios
Source: ONS, PwC scenarios
Projections
-1.0
0
1.0
2.0
3.0
4.0
5.0
2016Q1
2015Q1
2014Q1
2013Q1
2012Q1
2011Q1
2010Q1
% c
hang
e on
a y
ear e
arlie
r
Main scenario Low inflation High inflation
Inflation target = 2%
This would matter less if higher earnings growth was matched by higher productivity growth, but this has not happenedyetasdiscussedinSection2.1aboveandinmoredetailinSection4.
AswithourGDPscenarios,wehaveconsidered two alternative scenarios forUKinflation:
• In our ‘high inflation’ scenario, which assumes stronger global growth and a marked rebound in oil prices, we project headline inflationtoincreasetojustunder 3%onaveragein2016.
• In our ‘low inflation’ scenario, by contrast, we assume that UK domestic demand growth will be slower, global GDPgrowthrateswilldeteriorateduetoshocksincludingachaoticGreekexit from the Eurozone and commodity prices will remain weak. Here, we projectthataverageannualinflationrateswillremainbelow1%in2016.
AswithGDPgrowth,thesealternativescenarios are not as likely as our main scenario, but businesses should plan for such contingencies.
Figure 2.10 – CPI inflation vs average earnings growth
Source: ONS for data up to 2014, PwC analysis for 2015-17
0
1.0
2.0
3.0
4.0
5.0
20172016201520142013201220112010200920082007200620052004200320022001
Average weekly earnings (excl bonus)CPI
% c
hang
e p.
a.
Projections
Real squeeze
Earnings
CPI
15UK Economic Outlook July 2015
A positive outlook for real earnings growth
After the recession hit in 2008, average UK real earnings fell consecutively for 6years.ThiscanbeseeninFigure2.10,whichshowsthattheinflationrateexceeded nominal earnings growth between 2008 and 2014. This trend has nowreversed.Inflationlevelsfellrapidlybelow their target level in 2014 and early2015,whilstnominalwagegrowthhas picked up markedly this year as past strong employment growth reduced spare capacity in the labour market, despite continued high levels of inward migration of workers.
Goingforward,weexpectrealearningsgrowth to continue, though this may moderate somewhat from 2016 as inflationreturnstowardstarget,even if nominal wage growth continues to risetoover3%.Despitethismorepositive trend, however, the level of real earnings would not be expected to regain itspre-crisis peak until late in this decade.
2.4 – Monetary and fiscal policy
Interest rates likely to start to rise gradually during 2016
SofartheMonetaryPolicyCommittee(MPC) has continued to maintain the BankRateat0.5%andthestockofpurchasedassetsfinancedbycentralbankreserves(i.e.QE)at£375billion.The members of the MPC voted unanimously in favour of both these decisions in June and it seems likely they also did so in July (though we do not know that for sure at the time of writing).
Goingforward,thecurrentlowrateofheadlineinflationandtheuncertaintyaroundGreecemaycausemostMPCmembers to vote against interest rate rises for the next few months, though
a minority vote for an early increase seems quite likely to emerge, perhaps from August onwards.
Our main scenario assumes, however, that the Bank rate will only start to rise from early 2016, with increases proceeding at only a very modest pace after that. In the medium term, however,officialratescouldincreasetoaround3-3.5%by2020sobusinessesand individuals should assume that the cost of borrowing will increase gradually over the next few years and should stress test how such rate rises willaffectthemfinancially.
Budget confirms more fiscal tightening to come over next four years
TherecentSummerBudgetgavemoredetailofthegovernment’splansforfurtherfiscaltighteningtoeliminatetheprojectedoverallbudgetdeficitby2019/20. The pace of spending cuts has been smoothed and extended over an additional year, which will allow affected government departments, local authorities and households more time to adjust.
In general, there will now be smaller cuts to public services spending, though these could still be severe for unprotected departments (i.e. all except health, schools, overseas aid and now defence). We will get further detailsofthisintheSpendingReviewin the autumn.
By contrast, welfare cuts eventually building up to around £12 billion per annum will be phased in over the period to 2020. However, the adverse impact of this will be offset for many low earners by the new National Living Wage, which is set to rise to over £9 per hourby2020forover-25s.TheOBRestimates that this could cost around 60,000 jobs, but this is only around 0.2%oftotalUKemploymentandwould be against a backdrop of
continued expected strong employment growth across the economy as a whole. Sectorswithrelativelylowpaysuchashotels and restaurants, social care and parts of retailing could, however, face some tough choices on how to adapt to these higher minimum wage levels.
On the tax side, there was the usual complex mix of offsetting measures. The biggest giveaways related to cutting corporationtaxto18%by2020,furtherincreases in personal income tax allowances and extending inheritance tax relief for main residences.
These giveaways were more than outweighed, however, by a series of tax increases relating to dividend taxation, insurance premium tax and vehicle excise duty, as well as restrictions in pensions tax relief and a range of anti-avoidance measures. By 2020, the OBR estimates the implied net tax rise to be around £7 billion, although this would onlybearound0.3%ofGDPsoitsmacroeconomic impact is likely to be small compared to over £30 billion of planned real spending cuts by 2019/20.
Whiletheplannedfiscalconsolidationmay dampen growth in the short term, however, there should be some offset from lower long-term interest rates. More importantly, returning to a small budget surplus by 2020 and a clearly declining publicdebttoGDPratioofjustunder70%bythattime(comparedtojustover80%nowandlessthan40%beforethefinancialcrisis)willgivemorescopeforfuture UK governments to respond to major adverse economic shocks.
Theoptimallongertermfiscaltargettoadopt is open to debate, but the need forsomesignificantadditionalfiscalconsolidation seems clear given that the cyclically-adjusted structural budgetdeficitwillstillbearound3.2%ofGDPthisyearaccordingtotheOBR.
16 UK Economic Outlook July 2015
2.5 Summary and conclusionsThe UK economy slowed during the firstquarterof2015fromthe3%average annual rate seen in 2014, but there are signs of a post-election recoverymorerecently.Despitetherelativelyslowstartto2015,weprojectGDPgrowthtobearound2.6%in2015,which could still be the fastest in the G7,withamodestfurtherdecelerationtoaneartrendrateof2.4%in2016inour main scenario.
Thenon-financialprivateservicessector remains relatively buoyant and should continue to lead the UK recovery, helped by steady consumer spending growth supported by continued employment growth and a recent recovery in earnings growth. The construction sector has cooled since mid-2014, but seems now to be enjoying a post-election rebound.
The manufacturing sector has been suffering more from ongoing sluggish growth in the Eurozone, as well as uncertaintiesrelatedtoGreece,thoughtheimpactofpossibleGreekeuroexit(which is less likely, but still possible after the recent proposed deal) should not be overstated for the UK economy as a whole. The ECB and other central banks have better tools now to prevent anyGreekdefaultleadingtowiderfinancialandeconomiccontagionandboth European banks and economies areinbettershapenowthanifGrexithad occurred in 2011-12.
LondonandtheSouthEastareforecastto remain the fastest growing regions inboth2015and2016,withaveragegrowthofcloseto3%perannum,butall UK regions should achieve positive growthofover2%perannumonaveragein2015-16,exceptperhapsNorthern Ireland, where average growth is projected to be slightly lower ataround1.7-1.8%.
Under our main scenario, consumer priceinflationisforecasttoaverage0.3%thisyear,butthisislargelyduetotemporary factors so we would expect ittomovebackuptowardsits2%target rate by the end of 2016. This should eventually cause the MPC to start raising interest rates gradually, although probably not until early 2016 (though a minority of MPC members could well start to vote for a rate rise before that).
The July Budget set out more details of thegovernment’splanstotightenfiscalpolicysignificantlyoverthenextfouryears with a view to eliminating the overallbudgetdeficitby2019/20.Thedirect effect of this may be to dampen growth somewhat, but it should also haveoffsettingbenefitsintermsoflower long-term interest rates than would otherwise be the case and giving morefiscalscapetorespondtoanyfuture adverse economic shocks.
In summary, the UK economic outlook remains positive, but there are still downside risks such as those relating toaGreeceforwhichaffectedbusinesses should make appropriate contingency plans.
In summary, the UK economic outlook remains positive, but there are still downside risks
17UK Economic Outlook July 2015
3 – UK housing market outlook: the continuing rise of Generation Rent
Introduction and summaryIn this section we review recent trends in the UK housing market and present projections for house price growth in the UK and the regions. In addition, this new research looks at trends in tenure (i.e. whether people rent or own the homes theylivein).Thekeyfindingsare:
• House price growth in the UK has decelerated over the past year, especially in London.
• Nonetheless, we project that average UK house prices could rise by around 5% this year. Assuming that the supply of new homes continues to be relatively sluggish, house prices are expected to keep growing at around this rate for the rest of this decade. In our baseline scenario, the average UK house could be worth around £360,000 in cash terms by 2020.
• As house prices have risen and social housing supply remains constrained, the number of households in the private rented sector has more than doubled since 2001, rising from 2.3millionto5.4millionby2014,around20%ofthetotal.Weprojectthat this trend will continue with an additional 1.8 million households becoming private renters by 2025. This would take the total to 7.2 million households – almost one in four of the UK total. The trend is particularly strong in the 20-39 age group where more than half willberentingprivatelyby2025.Theriseof‘GenerationRent’willcontinue.
• Fewer households will have mortgages. The number of households who own their home with a mortgage fell from around 10 million in 2001 to only around 8 million in 2014. We project a further
declineto7.2millionby2025aslimited housing supply, affordability and mortgage availability make it harderforfirsttimebuyerstogetonthe housing ladder.
• The other key tenure trend is that a greater number of people than ever before own their own home outright. This now accounts for 8.4 millionhouseholdsor32%ofthetotal. We expect this to rise to 10.6 millionhouseholds,35%ofthetotal,by2025.Akeydriveristherisingproportion of over 60 year olds in the UK, who are far more likely to have paid off their mortgages.
• For younger generations, renting privately is now the norm and many will only become home owners quite late in their adult lives.Asignificantriseinthesupplyof affordable housing might change this in the long run, but seems unlikely to occur fast enough to stem theriseinGenerationRentbetweennowand2025.
The discussion below begins by reviewing recent housing market developments(Section3.1)and then goes on to consider trends and prospectsforhousingtenureto2025(Section3.2).Section3.3thenconcludesby looking at projected future UK and regionalhousepriceprospects.Furtherdetails of our modelling work are contained in a technical annex at the end of the article.
3. 1 – Recent housing market developments
There has been a marked deceleration in UKhousepricegrowthsofarin2015,following a period of accelerating increases since 2012. A slowdown is not wholly unexpected: average UK house priceinflationwasaround10%in20141, far above the growth in earnings.
GrowthinLondonreachedanevenhigherrateof17.4%.
ByMay2015,incontrast,UKaveragehousepricegrowthhadfallento5.7%.The price slowdown in London has been even more marked, declining to 4.7%.Baseeffects(thesurgeinpricesayear ago) mean that the house price inflationrateinLondoncouldeventurnnegative during the summer, although we would expect this to be only temporary as the election result has removed fears of a possible mansion tax that would have affected London much more than other regions.
House price growth in 2013 and 2014 was accompanied by an expansion in gross mortgage lending, indicating that looser credit conditions helped to release pent up demand. However, the past year has seen lending weaken. Monthly gross mortgage lending peaked at £19 billion in July 2014, but has now stabilised at around £16 billion a month. This is likely to be restricting demand, contributing to the slowdown in house price growth.
Another important and much publicised factor is the limited amount of new housingavailable.Decadesofdeclininghousebuilding continue to bite, whilst population growth has increased markedly.Overthelastfiveyearsonlyaround 140,000 homes a year have been completed, well below average rates over the last four decades.
Rising house prices tend to have an adverse effect on affordability, acting as a natural brake on the market. But unprecedentedly low mortgage rates have meant that some aspects of affordability have been improving, despite house price increases: mortgage payments as a proportion of income are well below their 2007 levels and have followed a general downward trend since then (as shown in Figure3.2).However,aswediscuss
1 AccordingtotheONS’smostrecenthousepricestatistics,whichweusethroughoutthisreportasoursourceofhousepricedata.Butmosthousepriceindiceshaveshownbroadlysimilartrendsovertime,evenifestimatedhousepriceinflationcansometimesvarymateriallyacrossindicesintheshortterm.

18 UK Economic Outlook July 2015
Figure 3.2. Mortgage rates and mortgage interest payments, % of take home pay
0
10
20
30
40
50
60
201420132012201120102009200820072006200520042003200220012000199919981997199619950
1
2
3
4
5
6
7
8
9
20142013201220112010200920082007200620052004200320022001200019991998199719961995Mor
tgag
e pa
ymen
ts a
s %
of m
ean
take
hom
e pa
y
Mor
tgag
e ra
tes
(%)
Mortgage payments as % of mean take home pay Mortgage rates
Source: PwC analysis of Nationwide and Bank of England data
further below, initial deposits have become a bigger affordability problem for manyfirsttimebuyers.
Market commentators tend to focus mostly on house prices, and we have updated our projections for these prices inSection3.3below.Butthereisanother huge change underway in the marketthatwelookatfirst.In2001,just10%ofdwellingswereprivatelyrented,butnowthisfigureisalmost20%.Furthermore,theproportionofhouseholds with a mortgage has fallen fromalmost45%tounder30%.There is a growing dichotomy in the market between those who own a house outright and aspiring buyers.2 At the same time, the ability of people to use the mortgage market to make the transition from renting to owning appears to be diminishing, with younger generations having to wait longer to buy in many cases.3
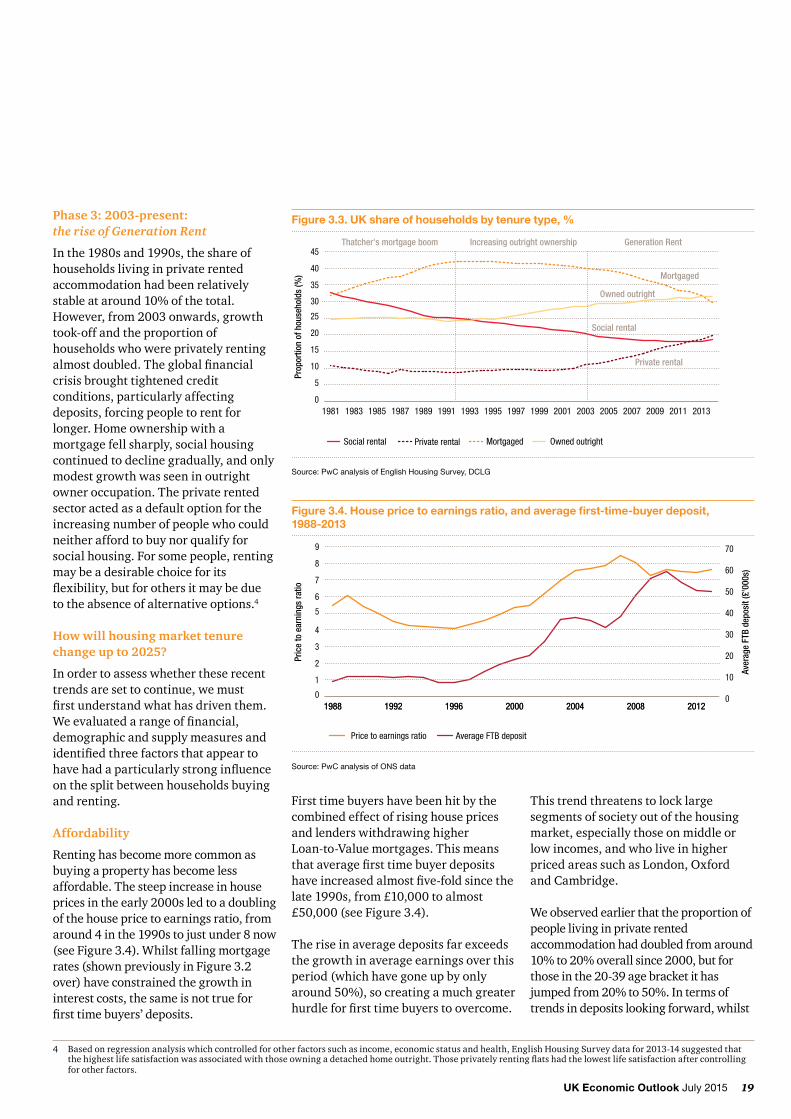
3.2 – Housing tenure in 2025: the continuing rise of Generation Rent?We highlight the recent shifts in UK tenure trends below, which can be summarized into three broad phases.
Phase 1: 1981-1990: Thatcher’s mortgage boom
The 1980s offered many the chance to owntheirownhomesforthefirsttime.The Conservative government under Mrs Thatcher used Right-to-Buy as a tool to fulfilBritain’shousingaspirationsandthiswas supported by extensive liberalisation ofthefinancialsector,whichmademortgages much more widely available. Thissupportedasignificantfallintheshare of people living in socially rented accommodationfrom33%to25%. In their place, the number of home owners withmortgagesgrew,from32%to41% by the end of the decade.
Phase 2: 1991-2002: Increasing outright ownership
At the start of the decade, mortgages ratesweredriventohighsof15%in1990, and the ensuing recession and house price collapse brought a swift end to the mortgage-driven boom of the 1980s. But the following decade saw increasing numbers of people come to own their home outright as the population aged and older mortgagesmatured.Duringthisperiodowner occupied tenure grew from around25%in1990toaround30%by2002, and social rented housing
continued to decline (albeit at a slower pace than in the 1980s) as council homes continued to be sold and fewer replacements were built.
Figure 3.1. House price inflation rate, UK and London (cash terms)
-20
-16
-12
-8
-4
0
4
8
12
16
20
201520142013201220112010200920082007
Hous
e pr
ice
infla
tion
rate
(%)
London UK
London
UK
Source: PwC analysis of ONS data
2 Accordingtothe2013-14EnglishHousingSurvey,61%ofprivaterenters(2.5millionEnglishhouseholds)statedthattheyexpectedtobuyapropertyatsomepointinthefuture.3 26%ofprivaterenterswhoindicatedtheyexpectedtobuysaidthattheyexpectedtobuywithintwoyears,but44%expectedthatitwouldbefiveyearsormorebefore
they could buy a property.
19UK Economic Outlook July 2015
4 Basedonregressionanalysiswhichcontrolledforotherfactorssuchasincome,economicstatusandhealth,EnglishHousingSurveydatafor2013-14suggestedthatthehighestlifesatisfactionwasassociatedwiththoseowningadetachedhomeoutright.Thoseprivatelyrentingflatshadthelowestlifesatisfactionaftercontrollingfor other factors.
Phase 3: 2003-present: the rise of Generation Rent
In the 1980s and 1990s, the share of households living in private rented accommodation had been relatively stableataround10%ofthetotal.However, from 2003 onwards, growth took-off and the proportion of households who were privately renting almostdoubled.Theglobalfinancialcrisis brought tightened credit conditions, particularly affecting deposits, forcing people to rent for longer. Home ownership with a mortgage fell sharply, social housing continued to decline gradually, and only modest growth was seen in outright owner occupation. The private rented sector acted as a default option for the increasing number of people who could neither afford to buy nor qualify for socialhousing.Forsomepeople,rentingmay be a desirable choice for its flexibility,butforothersitmaybedue to the absence of alternative options.4
How will housing market tenure change up to 2025?
In order to assess whether these recent trends are set to continue, we must firstunderstandwhathasdriventhem.Weevaluatedarangeoffinancial,demographic and supply measures and identifiedthreefactorsthatappeartohavehadaparticularlystronginfluenceon the split between households buying and renting.
Affordability
Renting has become more common as buying a property has become less affordable. The steep increase in house prices in the early 2000s led to a doubling of the house price to earnings ratio, from around 4 in the 1990s to just under 8 now (seeFigure3.4).Whilstfallingmortgagerates(shownpreviouslyinFigure3.2over) have constrained the growth in interest costs, the same is not true for firsttimebuyers’deposits.
Firsttimebuyershavebeenhitbythecombined effect of rising house prices and lenders withdrawing higher Loan-to-Value mortgages. This means thataveragefirsttimebuyerdepositshaveincreasedalmostfive-foldsincethelate 1990s, from £10,000 to almost £50,000(seeFigure3.4).
The rise in average deposits far exceeds the growth in average earnings over this period (which have gone up by only around50%),socreatingamuchgreaterhurdleforfirsttimebuyerstoovercome.
This trend threatens to lock large segments of society out of the housing market, especially those on middle or low incomes, and who live in higher priced areas such as London, Oxford and Cambridge.
We observed earlier that the proportion of people living in private rented accommodation had doubled from around 10%to20%overallsince2000,butforthose in the 20-39 age bracket it has jumpedfrom20%to50%.Intermsoftrends in deposits looking forward, whilst
Figure 3.3. UK share of households by tenure type, %
0
5
10
15
20
25
30
35
40
45
Social rental Private rental Mortgaged Owned outright
20132011200920072005200320011999199719951993199119891987198519831981
Prop
ortio
n of
hou
seho
lds
(%)
Thatcher's mortgage boom Increasing outright ownership Generation Rent
Mortgaged
Owned outright
Social rental
Private rental
Source: PwC analysis of English Housing Survey, DCLG
Figure 3.4. House price to earnings ratio, and average first-time-buyer deposit, 1988-2013
0
10
20
30
40
50
60
70
Average FTB deposit
20122008200420001996199219880
1
2
3
4
5
6
7
8
9
Price to earnings ratio
2012200820042000199619921988
Pric
e to
ear
ning
s ra
tio
Aver
age
FTB
depo
sit (
£'00
0s)
Source: PwC analysis of ONS data
20 UK Economic Outlook July 2015
we expect to see some increase in higher Loan-to-Value mortgages, assisted in some cases by the Help to Buy scheme, the continued increase in house prices will ensure that the ratio remains elevated.
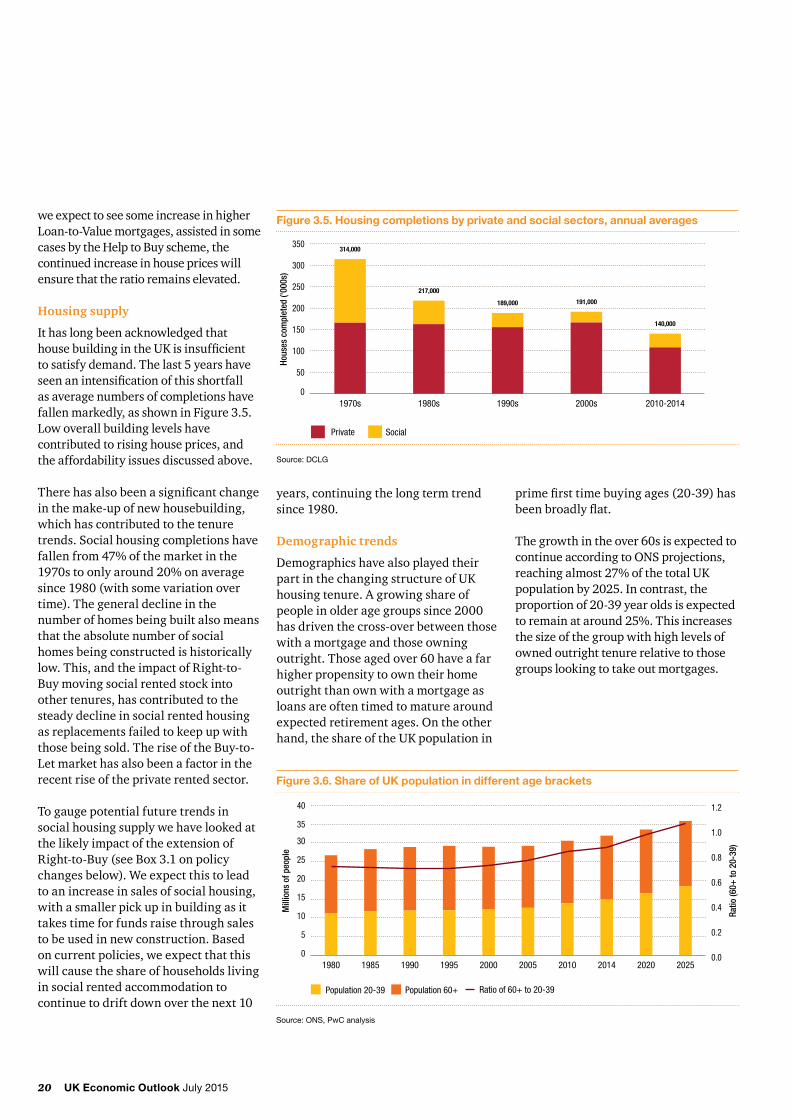
Housing supply
It has long been acknowledged that housebuildingintheUKisinsufficient tosatisfydemand.Thelast5yearshaveseenanintensificationofthisshortfall as average numbers of completions have fallenmarkedly,asshowninFigure3.5.Low overall building levels have contributed to rising house prices, and the affordability issues discussed above.
Therehasalsobeenasignificantchangein the make-up of new housebuilding, which has contributed to the tenure trends.Socialhousingcompletionshavefallenfrom47%ofthemarketinthe1970stoonlyaround20%onaveragesince 1980 (with some variation over time). The general decline in the number of homes being built also means that the absolute number of social homes being constructed is historically low. This, and the impact of Right-to-Buy moving social rented stock into other tenures, has contributed to the steady decline in social rented housing as replacements failed to keep up with those being sold. The rise of the Buy-to-Let market has also been a factor in the recent rise of the private rented sector.
To gauge potential future trends in social housing supply we have looked at the likely impact of the extension of Right-to-Buy (see Box 3.1 on policy changes below). We expect this to lead to an increase in sales of social housing, with a smaller pick up in building as it takes time for funds raise through sales to be used in new construction. Based on current policies, we expect that this will cause the share of households living in social rented accommodation to continue to drift down over the next 10
years, continuing the long term trend since 1980.
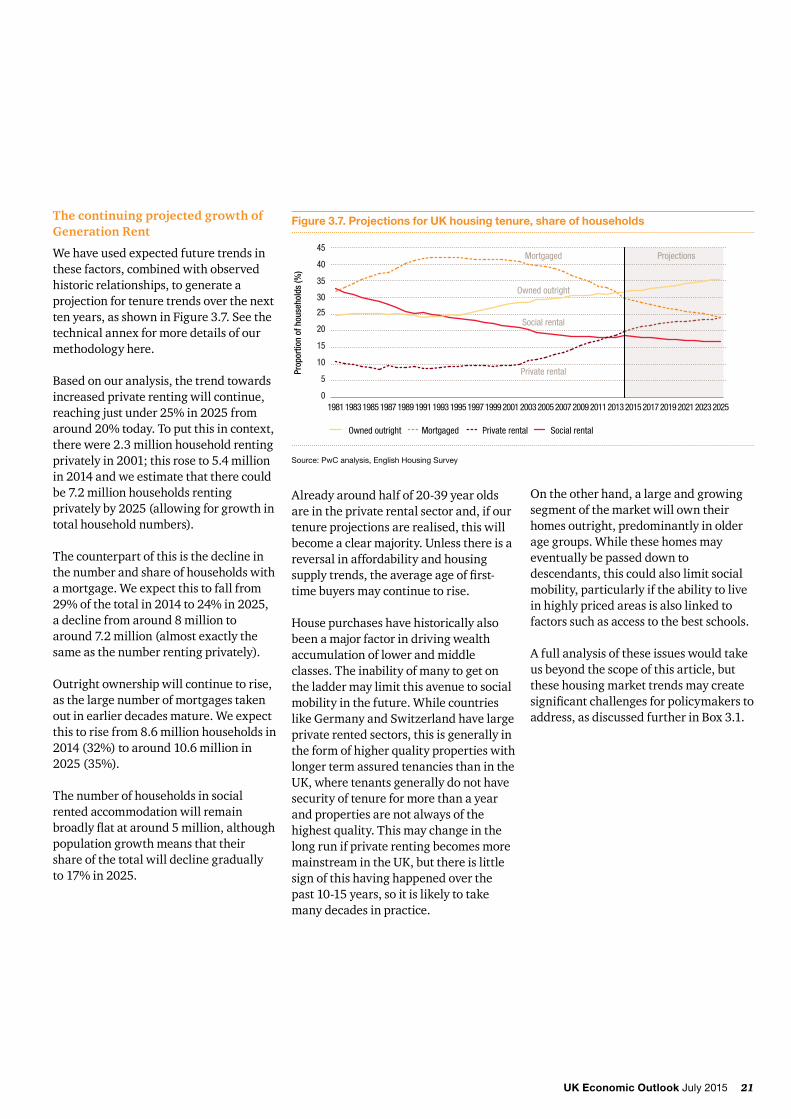
Demographic trends
Demographicshavealsoplayedtheirpart in the changing structure of UK housing tenure. A growing share of people in older age groups since 2000 has driven the cross-over between those with a mortgage and those owning outright. Those aged over 60 have a far higher propensity to own their home outright than own with a mortgage as loans are often timed to mature around expected retirement ages. On the other hand, the share of the UK population in
primefirsttimebuyingages(20-39)hasbeenbroadlyflat.
The growth in the over 60s is expected to continueaccordingtoONSprojections,reachingalmost27%ofthetotalUKpopulationby2025.Incontrast,theproportion of 20-39 year olds is expected toremainataround25%.Thisincreasesthe size of the group with high levels of owned outright tenure relative to those groups looking to take out mortgages.
Figure 3.5. Housing completions by private and social sectors, annual averages
Source: DCLG
0
50
100
150
200
250
300
350
SocialPrivate
2010-20142000s1990s1980s1970s
Hous
es c
ompl
eted
('00
0s)
314,000
217,000
189,000 191,000
140,000
Figure 3.6. Share of UK population in different age brackets
Source: ONS, PwC analysis
0
5
10
15
20
25
30
35
40
Population 20-39 Population 60+
0.0
0.2
0.4
0.6
0.8
1.0
1.2
Ratio of 60+ to 20-39
2025202020142010200520001995199019851980
Ratio
(60+
to 2
0-39
)
Mill
ions
of p
eopl
e
21UK Economic Outlook July 2015
The continuing projected growth of Generation Rent
We have used expected future trends in these factors, combined with observed historic relationships, to generate a projection for tenure trends over the next tenyears,asshowninFigure3.7.Seethetechnical annex for more details of our methodology here.
Based on our analysis, the trend towards increased private renting will continue, reachingjustunder25%in2025fromaround20%today.Toputthisincontext,there were 2.3 million household renting privatelyin2001;thisroseto5.4millionin 2014 and we estimate that there could be 7.2 million households renting privatelyby2025(allowingforgrowthintotal household numbers).
The counterpart of this is the decline in the number and share of households with a mortgage. We expect this to fall from 29%ofthetotalin2014to24%in2025,a decline from around 8 million to around 7.2 million (almost exactly the same as the number renting privately).
Outright ownership will continue to rise, as the large number of mortgages taken out in earlier decades mature. We expect this to rise from 8.6 million households in 2014(32%)toaround10.6millionin2025(35%).
The number of households in social rented accommodation will remain broadlyflatataround5million,althoughpopulation growth means that their share of the total will decline gradually to17%in2025.
Already around half of 20-39 year olds are in the private rental sector and, if our tenure projections are realised, this will become a clear majority. Unless there is a reversal in affordability and housing supplytrends,theaverageageoffirst-time buyers may continue to rise.
House purchases have historically also been a major factor in driving wealth accumulation of lower and middle classes. The inability of many to get on the ladder may limit this avenue to social mobility in the future. While countries likeGermanyandSwitzerlandhavelargeprivate rented sectors, this is generally in the form of higher quality properties with longer term assured tenancies than in the UK, where tenants generally do not have security of tenure for more than a year and properties are not always of the highest quality. This may change in the long run if private renting becomes more mainstream in the UK, but there is little sign of this having happened over the past10-15years,soitislikelytotakemany decades in practice.
On the other hand, a large and growing segment of the market will own their homes outright, predominantly in older age groups. While these homes may eventually be passed down to descendants, this could also limit social mobility, particularly if the ability to live in highly priced areas is also linked to factors such as access to the best schools.
A full analysis of these issues would take us beyond the scope of this article, but these housing market trends may create significantchallengesforpolicymakerstoaddress, as discussed further in Box 3.1.
Figure 3.7. Projections for UK housing tenure, share of households
Source: PwC analysis, English Housing Survey
0
5
10
15
20
25
30
35
40
45
20252023202120192017201520132011200920072005200320011999199719951993199119891987198519831981
Prop
ortio
n of
hou
seho
lds
(%)
ProjectionsMortgaged
Owned outright
Social rental
Private rental
Owned outright Mortgaged Private rental Social rental

22 UK Economic Outlook July 2015
Box 3.1 How will current and planned housing policyimpacttenuretrends?
Governmentpolicyisanimportantinfluenceroftrendsintenureandseveral announced and potential changes may have an impact.
Extending Right-to-Buy:Discountsgiven to local authority tenants to buy their homes are to be extended to tenants of housing associations. The generosity of discounts was also increased in 2012 and the maximum now stands at £77,900 outside London and £103,900 in London. While the government hopes to replace all homes sold, historically this has not been achieved;only46%havebeenreplacedsince 2012 according to the National HousingFederation.Intermsoftheimpact, we expect that total sales of socialhousingmayreach50,000peryear in the short term.
Increased inheritance tax relief for family homes: the July Budget announced a new main residence nil-rate band to be phased in from 2017 that would effectively raise the inheritance tax threshold to £1 million by 2020 for couples with a family home. This could boost house prices at the higher end of the market, particularly inLondonandtheSouthEast.
Impact of pension freedoms and other polices on buy-to-let: New pension freedoms introduced in April 2015makeitmucheasiertowithdrawcash from pension pots and remove the obligation to purchase an annuity. This could cause more pensioners to invest in buy-to-let property. In reality, taxation and fees for fund withdrawal willlimittheseinvestments’appealandfew pension pots are large enough to enable people to buy a property: accordingtoSavillsonlythetop7%have the necessary funds to buy a
property outright. In addition, the July Budget restricted mortgage interest relief to the basic rate for buy-to-let mortgages from 2017, which will tend to dampen growth in this market.
Cuts to housing benefits and social rents: The July Budget announced cuts to the annual welfare budget of around £12 billion by 2020, including to housingbenefit.Inaddition,socialrents will be cut from 2016 onwards, which will reduce the funds that local authorities and housing associations have to build new homes. The OBR estimates a potential cumulative reduction in new social housebuilding overthenextfiveyearsofaround14,000, though this is not a large effect relative to total new build levels.
Help to buy: To combat the growing hurdle posed by deposits, this scheme has enabled buyers to have much higher loan-to-value ratios, through guaranteesandloans.Sofar,around50,000homeshavebeenboughtthrough the scheme, the majority being first-time-buyers.Weexpecttoseethepolicy’srecentextensionto2020workagainst the projected tenure trends, supporting movement from rental to ownership. However, numbers are small in the context of the UK market, so the impact will be limited.
Planning reforms and other supply constraints: The new Conservative government has signalled its intention to reform housing planning further, building on changes introduced under the previous government. One proposed measure is to de-centralise planning, giving more powers to local councils. Planning permission for brownfielddevelopmenthasalsobeenprioritised, such as converting old
officesintoflats.However,uncertainties remain regarding how far these measures can boost housing supply in practice. Housebuilders also point to other key supply constraints here, notably lacked of skilled labour in the construction sector, particularly if more restrictions are put on immigration.
23UK Economic Outlook July 2015
Table 3.1: UK house price inflation scenarios (% per annum)
Year Baseline High Low
2014 Actual 10.0% 10.0% 10.0%
2015 5.3% 6.7% 3.1%
2016 5.3% 6.8% 3.0%
2017 - 2020 Average 5.4% 7.4% 2.6%
Source: PwC analysis using ONS house price data
Table 3.2: UK average house price scenarios (£000s)
Year Baseline High Low
2014 Actual 265 265 265
2015 279 283 271
2016 294 302 273
2020 363 401 311
Source: PwC analysis using ONS house price data
3.3 - House price prospects – UK and regional projections
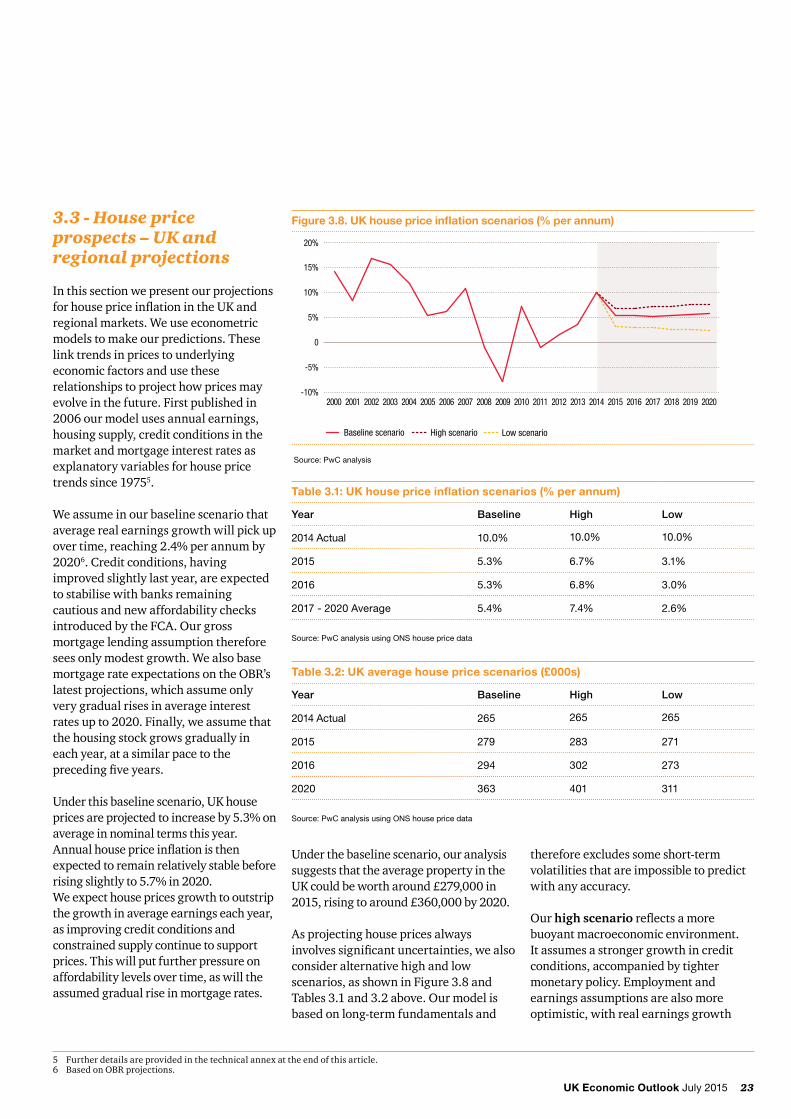
In this section we present our projections forhousepriceinflationintheUKandregional markets. We use econometric models to make our predictions. These link trends in prices to underlying economic factors and use these relationships to project how prices may evolveinthefuture.Firstpublishedin2006 our model uses annual earnings, housing supply, credit conditions in the market and mortgage interest rates as explanatory variables for house price trendssince19755.
We assume in our baseline scenario that average real earnings growth will pick up overtime,reaching2.4%perannumby20206. Credit conditions, having improved slightly last year, are expected to stabilise with banks remaining cautious and new affordability checks introducedbytheFCA.Ourgrossmortgage lending assumption therefore sees only modest growth. We also base mortgagerateexpectationsontheOBR’slatest projections, which assume only very gradual rises in average interest ratesupto2020.Finally,weassumethatthe housing stock grows gradually in each year, at a similar pace to the precedingfiveyears.
Under this baseline scenario, UK house pricesareprojectedtoincreaseby5.3%onaverage in nominal terms this year. Annualhousepriceinflationisthenexpected to remain relatively stable before risingslightlyto5.7%in2020. We expect house prices growth to outstrip the growth in average earnings each year, as improving credit conditions and constrained supply continue to support prices. This will put further pressure on affordability levels over time, as will the assumed gradual rise in mortgage rates.
5Furtherdetailsareprovidedinthetechnicalannexattheendofthisarticle.6 Based on OBR projections.
Figure 3.8. UK house price inflation scenarios (% per annum)
Source: PwC analysis
-10%
-5%
0
5%
10%
15%
20%
Low scenarioHigh scenarioBaseline scenario
202020192018201720162015201420132012201120102009200820072006200520042003200220012000
Under the baseline scenario, our analysis suggests that the average property in the UK could be worth around £279,000 in 2015,risingtoaround£360,000by2020.
As projecting house prices always involvessignificantuncertainties,wealsoconsider alternative high and low scenarios,asshowninFigure3.8andTables 3.1 and 3.2 above. Our model is based on long-term fundamentals and
therefore excludes some short-term volatilities that are impossible to predict with any accuracy.
Our high scenarioreflectsamorebuoyant macroeconomic environment. It assumes a stronger growth in credit conditions, accompanied by tighter monetary policy. Employment and earnings assumptions are also more optimistic, with real earnings growth
24 UK Economic Outlook July 2015
risingtoaround3%inthemediumterm.Housing stock growth in this scenario is more constrained than the baseline.
Our low scenarioreflectsamorechallenging macroeconomic environment. It assumes zero real earnings growth from 2016onwardsasinflationincreasesfromrecord lows. Credit conditions remain relatively weak, which results in stagnant mortgage lending in the medium term in this scenario.
Under our high scenario price growth wouldreacharound7%thisyear,andthenrisefurthertoaround7.5%by2020.In contrast, our low scenario would see average house price growth of only around2.5%in2017-2020.
Regional house price projections
We also develop illustrative house price projections for the key regions across the UK. The projections relate to the baseline scenario set out above, but it should be borne in mind that short-term uncertainties are even greater at the regional than the national level. Table 3.3 showsourprojectionsfor2015,2016and2017-2020 average house price growth across all UK regions.
Followingverystronghouseprice growth in 2014, London is projected to see growth markedly slow to around 7%onaveragethisyear,6.7%nextyear andthenanaverageofaround5.3% from2017to2020.Similarpatternsofslowing growth are also expected in the EastofEnglandandtheSouthEast,asaffordability measures like house price to earnings are already elevated. Those regions currently with weaker growth in recent years, including Wales, the North East and Northern Ireland, are projected to see house price growth rise somewhat over time as part of a general pattern of increased convergence across UK regions.
Table 3.3: Regional house price inflation projections, baseline scenario
Region 2014 2015P 2016P 2017-2020P average
PE ratio (2020)
Wales 5.1% 2.6% 3.5% 5.0% 6.9
Scotland 4.7% 4.9% 4.5% 5.5% 7.4
Northern Ireland 138 146 155 198 6.5
North East 4.9% 2.4% 4.1% 5.3% 6.3
North West 5.4% 3.2% 5.0% 5.4% 7.0
Yorks & Humber 5.6% 3.4% 4.0% 5.2% 7.2
East Midlands 7.1% 5.9% 5.6% 5.5% 7.5
West Midlands 5.9% 3.7% 4.6% 5.5% 7.8
East 9.4% 8.8% 6.2% 5.0% 10.2
London 17.4% 5.5% 5.2% 5.3% 14.9
South East 9.9% 7.9% 6.1% 5.5% 11.5
South West 6.8% 5.6% 5.6% 5.6% 9.7
UK 10.0% 5.3% 5.3% 5.4% 9.1
Source: ONS for 2014, PwC main scenario projection for 2015 to 2020
Table 3.4: Regional nominal house price projections in baseline scenario (£000s)
Region 2014 (actual) 2015 2016 2020
Wales 169 173 179 218
Scotland 191 200 209 259
Northern Ireland 138 146 155 198
North East 151 155 161 198
North West 171 177 186 229
Yorks & Humber 174 180 187 230
East Midlands 184 195 205 255
West Midlands 195 202 211 261
East 277 302 320 390
London 490 518 544 670
South East 327 353 375 464
South West 243 257 272 338
UK 265 279 294 363
Source: PwC analysis

25UK Economic Outlook July 2015
The implication of these house price growth projections for affordability are showninfigure3.9over.Weprojectincreasing house-price to earnings ratios for all regions by 2020. In London the price to earnings ratio has now exceeded its previous peak in 2007 , but all other regions remain below previous highs.
Conclusions
House price growth is slowing down and tending to converge across UK regions. We do not expect that the double digit price growth seen in 2014 can be sustained but a more normal growthrateofjustover5%mightbeseen in the medium term, still implying some further rise in house price to earnings ratios as new housing supply remains constrained.
Drivenbyadecadeofsoaringhouseprices pre-crisis and lower loan-to-value ratios post-crisis, the value of deposits hassoared,creatingabarriertofirsttime buyers. As a result a generation of private renters has emerged and this will increasingly be the norm for the 20-39 age group. There is a rising dichotomy in the market between those own and those who rent, and
increasingly between those (mostly older) households who own outright and those who rent or have a mortgage.
In the long run, if policymakers wish to reverse these trends, a large and sustained increase in affordable housing supply would be required. This could involve a range of measures including further planning reform, action to address skills shortages in the housebuilding sector and enhancedfinancialincentivestobuildmore homes. But cuts to social rents announced in the Budget will tend to work against this for local authorities and housing associations, while private developers may be cautious about expandingtoorapidly.Soweexpecthousing supply shortages to persist for at least the next decade. Realistically, we wouldthereforeseetheriseinGenerationRentcontinuinguntilatleast2025.
Figure 3.9. Regional average house price to individual full-time earnings ratios
Source: ONS for 2014, PwC main scenario projections for 2020
0
2
4
6
8
10
12
14
16
South WestSouth EastLondonEastWestMidlands
EastMidlands
Yorkshire &the Humber
NorthWest
North EastNorthernIreland
ScotlandWales
2014 2020
6.5 6.9 6.77.5
5.76.4 6.1 6.3 6.4
7.0 6.7 7.2 6.97.6 7.3
7.99.1
10.3
13.514.5
9.8
11.5
8.5
9.8
A generation of private renters has emerged and this will increasingly be the norm for the 20-39 age group
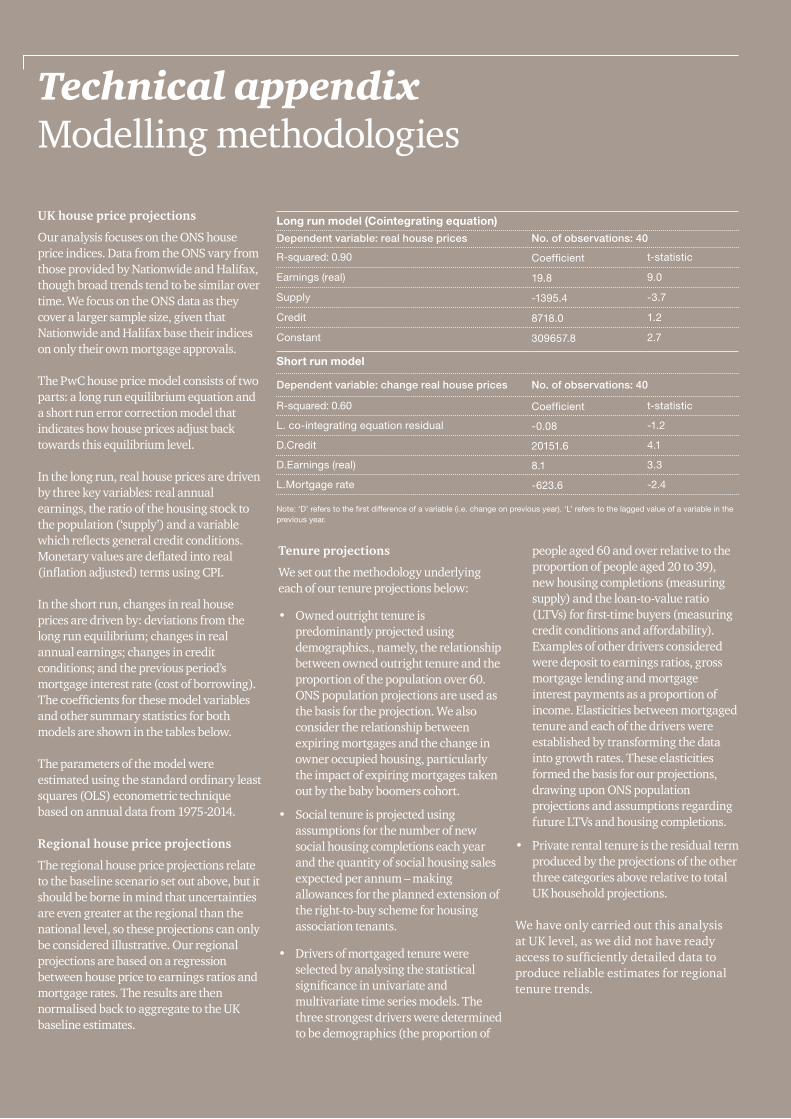
26 UK Economic Outlook July 2015
Technical appendix Modelling methodologies
UK house price projections
OuranalysisfocusesontheONShousepriceindices.DatafromtheONSvaryfromthose provided by Nationwide and Halifax, though broad trends tend to be similar over time.WefocusontheONSdataastheycover a larger sample size, given that Nationwide and Halifax base their indices on only their own mortgage approvals.
The PwC house price model consists of two parts: a long run equilibrium equation and a short run error correction model that indicates how house prices adjust back towards this equilibrium level.
In the long run, real house prices are driven by three key variables: real annual earnings, the ratio of the housing stock to thepopulation(‘supply’)andavariablewhichreflectsgeneralcreditconditions.Monetaryvaluesaredeflatedintoreal(inflationadjusted)termsusingCPI.
In the short run, changes in real house prices are driven by: deviations from the long run equilibrium; changes in real annual earnings; changes in credit conditions;andthepreviousperiod’smortgage interest rate (cost of borrowing). Thecoefficientsforthesemodelvariablesand other summary statistics for both models are shown in the tables below.
The parameters of the model were estimated using the standard ordinary least squares(OLS)econometrictechniquebasedonannualdatafrom1975-2014.
Regional house price projections
The regional house price projections relate to the baseline scenario set out above, but it should be borne in mind that uncertainties are even greater at the regional than the national level, so these projections can only be considered illustrative. Our regional projections are based on a regression between house price to earnings ratios and mortgage rates. The results are then normalised back to aggregate to the UK baseline estimates.
Tenure projections
We set out the methodology underlying each of our tenure projections below:
• Owned outright tenure is predominantly projected using demographics., namely, the relationship between owned outright tenure and the proportion of the population over 60. ONSpopulationprojectionsareusedasthe basis for the projection. We also consider the relationship between expiring mortgages and the change in owner occupied housing, particularly the impact of expiring mortgages taken out by the baby boomers cohort.
• Socialtenureisprojectedusingassumptions for the number of new social housing completions each year and the quantity of social housing sales expected per annum – making allowances for the planned extension of the right-to-buy scheme for housing association tenants.
• Driversofmortgagedtenurewereselected by analysing the statistical significanceinunivariateandmultivariate time series models. The three strongest drivers were determined to be demographics (the proportion of
people aged 60 and over relative to the proportion of people aged 20 to 39), new housing completions (measuring supply) and the loan-to-value ratio (LTVs)forfirst-timebuyers(measuringcredit conditions and affordability). Examples of other drivers considered were deposit to earnings ratios, gross mortgage lending and mortgage interest payments as a proportion of income. Elasticities between mortgaged tenure and each of the drivers were established by transforming the data into growth rates. These elasticities formed the basis for our projections, drawinguponONSpopulationprojections and assumptions regarding future LTVs and housing completions.
• Private rental tenure is the residual term produced by the projections of the other three categories above relative to total UK household projections.
We have only carried out this analysis at UK level, as we did not have ready accesstosufficientlydetaileddatatoproduce reliable estimates for regional tenure trends.
Long run model (Cointegrating equation)
Dependent variable: real house prices No. of observations: 40
R-squared: 0.90 Coefficient t-statistic
Earnings (real) 19.8 9.0
Supply -1395.4 -3.7
Credit 8718.0 1.2
Constant 309657.8 2.7
Short run model
Dependent variable: change real house prices No. of observations: 40
R-squared: 0.60 Coefficient t-statistic
L. co-integrating equation residual -0.08 -1.2
D.Credit 20151.6 4.1
D.Earnings (real) 8.1 3.3
L.Mortgage rate -623.6 -2.4
Note: ‘D’ refers to the first difference of a variable (i.e. change on previous year). ‘L’ refers to the lagged value of a variable in the previous year.

28 UK Economic Outlook July 2015
4 – Does trade hold the key to the UK services productivity puzzle?1
Introduction and summaryThe UK economy is a highly services-orientedeconomy.Servicesmake upoverthree-quartersofGDPand over80%oftotalemployment.Sounderstanding the services sector is critical to analysing the performance of the British economy as a whole.
Recent economic debate has focussed on a “productivity puzzle” surrounding the recent growth performance of the UK and other economies. Output per person employed has not grown as stronglysincethefinancialcrisisasbefore.Thebulkofthispuzzlereflectsthe performance of the services sector. Inthedecade1995-2005servicessectorproductivitygrewby2%perannum,onaverage.Since2005,ithasincreasedbyanaverageof0.6%peryear-lessthan a third of the previous rate.2
This article analyses and seeks to explain this productivity slowdown. Three factorsappeartohavecontributed.First,a number of highly tradeable services activities provided a boost to productivity beforethefinancialcrisis.Thesesectorsbenefitedfromtheglobalisationoftheworld economy, providing a temporary increase in the pre-crisis productivity trend, so productivity growth before the crisiswasinflatedbythisone-offshift.Second,thefinancialandpropertysectors have been a serious drag on productivity since the crisis, as the pre-2007 credit boom has unwound, banks have restructured and had to deal with increased regulation. Third, public sector productivity has also been disappointing – at least according to the officialGDPestimates.
Once we allow for these three factors, the core productivity rate in UK private non-financialserviceshasbeenonamoreconsistent trend since the mid-1990s. We estimatethatnon-financialprivatesectorservices productivity has been growing at around1.7%since1995.
This analysis also highlights the potential role of trade in boosting productivity within UK services. In general, services activities are less open to trade than the production of goods. But the UK appears to have a strong comparative advantage in many tradeable services sector activities and this has contributed to a substantial trade surplus in services of around5%ofGDP–offsettingtheUK’sdeficitinmanufacturedtrade.OpeningupoverseasmarketstoUKservicesfirmsthrough new agreements or other initiatives to reduce trade barriers could behighlybeneficialtothefuturegrowthof the UK economy.
The analysis in this article is developed in threesections.First,wediscusstheUKproductivity puzzle and the contribution of services sectors to poor UK productivity performance(Section4.1).Second,weanalyse the link between trade and productivity growth in UK services (Section4.2).Andthird,welookaheadtothe prospects for UK productivity growth and point to some policy conclusions from ouranalysis(Section4.3).
4.1 - The productivity puzzleProductivity growth has been sluggish in many western economies since the financialcrisis.Figure4.1showsoutputper worker3intheG7economiessince2005,usingIMFdataandforecasts. TheUK’sproductivitygrowthisinthemiddle of the pack, roughly in line with
1 ThisarticlehasbeenwrittenbyAndrewSentance,senioreconomicadviseratPwC.2 2005isusedforcomparisonasitisamid-cycleyear,ratherthan2007-thepeakofthecycle.Itisabetterbasisforcomparisonwiththelatestdataandassessing
longer-term productivity performance 3 Output per worker is used as the measure of productivity in this article. Output per hour worked is an alternative measure, but shows a similar trend.
FranceandaheadofGermany.Italyisthe most noticeable underperformer, whiletheUS,CanadaandJapanhaveseen stronger productivity growth than the major European nations. However, evenintheUS–thebestperformeramongtheG7–productivitygrowthhasbeenjust1%perannumoverthepastdecade. This is still disappointing in relationtothe1.5-2%productivitygrowth trend that major economies appeared to be able to achieve before thefinancialcrisis.
Disappointingproductivityintheservices sector is at the heart of this puzzle. In the UK, services sectors make upabout78%ofGDPand83%ofemployment.Figure4.2showsthatUKmanufacturing productivity has risen stronglysince1995,growingonaverageby2.7%ayear.Afteradipduringtherecession, manufacturing output per workerhasgrownby2.3%ayearbetween 2009 and 2014 – not quite as strongly as before the crisis, but still increasing at a respectable rate. Construction productivity has been very volatile, as we might expect, and shows little upward trend. Meanwhile, declining productivity in energy related sectors(includingNorthSeaoilandgas)has exerted a drag on national productivity performance over the past decade.Servicesproductivityhasalsobeen sluggish over the past decade: since2005,ithasincreasedatanaveragerateofjust0.6%perannum,comparedwith2%ayearaveragegrowth between the mid-90s and mid-2000s.
The services sector encompasses a very varied range of activities, which can be divided into three broad clusters. The largestcluster–accountingfor38%oftotal services output - is business,
29UK Economic Outlook July 2015
Figure 4.3: UK services productivity since 1995
Source: ONS Labour Productivity Analysis, July 2015 . See text for definitions.
90
100
110
120
130
140
150
160
170
180
20142013201220112010200920082007200620052004200320022001200019991998199719961995
Outp
ut p
er jo
b in
maj
or s
ervi
ces
clus
ters
, 199
5=10
0
Tradeable services Local services Government services
professionalandfinancialservices,including IT and communications. Most of these services are traded internationally and contribute quite significantlytothe5%ofGDPtradesurplus in services on the UK balance of payments. A second cluster is a set of private services, which mainly support the functioning of local economies and link them to markets at home and abroad. These include retailing, wholesale distribution, hotels and catering, property services and transport,whichmakeupabout36%oftotal services activity. The third cluster is government services, including public administration, education and health – which account for just over a quarter of services output.
Someaspectsoflocalservicesandgovernment services are tradeable. Transport includes international transport links to other countries around the world and foreign students contribute income to the UK education system.Shops,hotelsandrestaurantswill provide services to foreign visitors as well as local residents. But it is business,professional,financialandIT/communications services which are the most tradeable – accounting for about two-thirds of UK services exports.
AsFigure4.3shows,productivitygrowthacross these three clusters has been very different since the mid-1990s. Tradeable services have achieved by far the best productivity performance, particularly intheperiodbeforethefinancialcrisis. Local services have performed less well, and here productivity has only just recovered from the sharp drop during the recession. Meanwhile, the productivity of government services has effectively flat-linedshowinglittlegrowthsincethemid-1990s.Thismaypartlyreflectthedifficultyofmeasuringproductivityinthepublic sector, where there are not easily identifiablemarketpriceswhichcanbeused to measure the real value of output.
Figure 4.1: G7 productivity since 2005
Source: IMF World Economic Outlook, April 2015
90
95
100
105
110
115
20152014201320122011201020092008200720062015
GDP
per p
erso
n em
ploy
ed in
G7
eco
nom
ies,
200
5=10
0
USUK
JapanItaly
GermanyFrance
Canada
Figure 4.2: UK productivity since 1995
Source: ONS Labour Productivity Analysis, July 2015
90
100
110
120
130
140
150
160
170
180
20142013201220112010200920082007200620052004200320022001200019991998199719961995
Outp
ut p
er jo
b in
maj
or s
ecto
rs o
f the
UK
eco
nom
y, 1
995=
100
Manufacturing Construction Services
30 UK Economic Outlook July 2015
across these three clusters has been very different since the mid-1990s. Tradeable services have achieved by far the best productivity performance, particularly in theperiodbeforethefinancialcrisis.Localservices have performed less well, and here productivity has only just recovered from the sharp drop during the recession. Meanwhile, the productivity of government services has effectively flat-linedshowinglittlegrowthsincethemid-1990s.Thismaypartlyreflectthedifficultyofmeasuringproductivityinthepublic sector, where there are not easily identifiablemarketpriceswhichcanbeused to measure the real value of output.
Tradeable services: exceptional pre-crisis performance but now facing headwinds
How do we explain this pattern of productivity growth before, during and sincethefinancialcrisis?Thesuperiorperformance in the tradeable services sectorsbeforethefinancialcrisisisverystriking. Economists have recognised for a long time that trade can be a spur to productivity growth. This is partly because it allows greater specialisation in activitieswhereacountryorafirmhasacomparativeadvantage–asDavidRicardo argued nearly 200 years ago. It is also because access to a larger market allowsfirmstobenefitfromeconomiesofscale, generating larger volumes of activity without increasing the number of people employed or other inputs in the sameproportion.Andfirmswhicharemore heavily exposed to international competition will have a stronger incentivetoinnovateandfindefficiencyimprovements than businesses which are moreshelteredinadomesticmarket.Soit should be no surprise that the more tradeable services within the UK have been able to grow productivity more rapidly than other activities more dependent on local markets.
But it also appears that UK business, professionalandfinancialservices
Figure 4.4: UK services productivity since 2007
Source: ONS Labour Productivity Analysis, July 2015
80
85
90
95
100
105
110
115
120
2015Q1
2014Q1
2013Q1
2012Q1
2011Q1
2010Q1
2009Q1
2008Q1
2007Q1
Financial Professional Admin/support IT/communications
benefitedfromaparticularlystrongsurgein productivity between the mid-90s and mid-2000s. Average productivity in the major UK tradeable services rose by over 4%perannumbetween1995and2007,increasing even more rapidly than in manufacturing industry. A number of factors came together to create a particularly strong boost to productivity in these services over this period.
First,therapidgrowthofthefinancialsector in the global credit boom allowed banks and other institutions to increase their levels of activity rapidly creating economies of scale.
Second,overseasmarketsforfinancial,professional and business services becamemoreaccessibletoUKfirmsfrom the mid-1990s onwards. This reflectedthereductionintradebarrierswithintheSingleEuropeanMarketandthe increasing globalisation of the world trading system under the supervision of the World Trade Organisation (WTO), which came into being at the beginning of1995.Theimpactoftheexpansionofthe global trading system to include the large populations of China, India, the formerSovietblocandmanyotheremerging market economies should not be underestimated. Currently, member
countries of the WTO are home to around94%oftheworld’spopulation.
The third ingredient was the development of the internet and other IT and communications systems. This provided a direct productivity boost in technology-related sectors and also indirectly in business,professionalandfinancialservices, which are major users of IT and communications technology.
Since2007,theseproductivitytailwindshave been less favourable and have been replaced by headwinds in some sectors. AsFigure4.4shows,productivityhasdeclinedinthefinancialservicesindustry, as the banking sector has had to makesignificantstructuraladjustmentsandtheburdenoffinancialregulationhas increased. Productivity in a wide range of sectors took a hit following the shocksofthefinancialcrisisandtherecession and is taking a while to recover. The information and communications sector is no longer making the strong productivity gains achieved when the internet and mobile communications networks were expanding rapidly.

31UK Economic Outlook July 2015
4 See“OECDTradeandValue-AddedIndicatorsfortheUK”-http://www.oecd.org/sti/ind/TiVA_UNITEDKINGDOM_MAY_2013.pdf
Looking back, we should see the decade from the mid-1990s to the mid-2000s as a rather exceptional period when productivity was boosted by the tailwindsoffinancialliberalisation,globalisation and technology. There has beenacorrectionoverthefinancialcrisis, but as the economy recovers from recession, we should be able to form a picture of the New Normal for UK services productivity growth. We will returntothisissueinthefinalsectionofthearticle.Butfirstithelpstolookmoreclosely at UK trade performance in services, which has been a key ingredient in the productivity story described in this article.
4.2 - UK trade performance in servicesThe UK economy is a very successful exporter of services. According to the WTO, it is the second largest exporter of commercial services behind the United States,andhada6.3%shareofworldtrade in 2013. That compares to the UK economy’sshareoflessthan3%inworldgoodstradeandaGDPoflessthan4%of the world total. In other words, the UK economy punches above its economic weight in terms of trade performance in services.
Other statistics tell a similar story. UK exportsofservicesaccountfor12%ofGDP,muchhigherthanothermajorEuropeancountriesandtheUS.TheequivalentfiguresforFranceandGermanyarearound8%andfortheUSjust4%.Inearly2015,thetotalvalueofservices exports was very close to the value of manufacturing exports, as Figure4.5shows.By2020,itislikelythat the UK economy will be exporting more services than manufactures.
In addition, the contribution of services exportstoUKGDPishigherthantheheadlinefiguressuggest.ResearchbytheOECDandWTOshowsthatforevery
Figure 4.5: UK exports of manufactures and services
Sources: ONS Balance of Payments Statistics; 2015 data is Q1 only
0
2.0
4.0
6.0
8.0
10.0
12.0
14.0
16.0
18.0
2015201020052000199519091985190819741970
% o
f GDP
at c
urre
nt p
rices
Services Manufactures
£1ofUKservicesexports,90-95%remains within the domestic economy, withonly5-10%boostingothereconomies through imports. The equivalentfiguresaremuchlowerformanufactured exports, with around 70-75%beingretainedvs25-30%imported. Using this value-added basis for calculation, services exports already contribute more to value-added in the UKeconomythanmanufactures–60%accordingtotheOECD/WTOestimates.4
ThisstrongcontributiontoGDPfromservices exports is, however, a relatively recent feature of the UK economy. As Figure4.5shows,between1970and2000, the value of UK services accounted foronlyaround6-8%ofGDPandsteadilyincreasedtheircontributionto12%onlyfrom the mid-1990s onwards - the very same period in which productivity performance in UK tradeable services was so strong. This evidence reinforces the link between trade and services productivity suggested earlier in this article.And,asFigure4.6shows,itisthecontribution from the sectors which provided such a strong productivity boost which was responsible for this increase in exports – business and professional services,financialservicesandIT/communications.
Overthesameperiod,theUK’stradesurplus in services has grown from 1.5-2%ofGDPinthelate1990sto5%ofGDPnow.Despitefearsintheaftermathofthefinancialcrisis,theUK’stradesurplusinfinancialserviceshasbeensustained and the surplus in business services has increased. The build-up of a substantial surplus in services trade since the mid-1990s has offset the widening deficitinUKmanufacturingtradeoverthesameperiod,fromadeficitofaround1%ofGDPtoashortfallof4.5%ofGDP.
These developments suggest that as markets have opened up in Europe and globally, the UK has been able to exploit its competitive advantage in a range of business,financialandrelatedservices,and this advantage has not been significantlyerodedbythefinancialcrisis. However, our trade performance in some sectors of manufacturing has deteriorated as producers in Asia and lower wage countries in Europe have expanded their markets at the expense of UK and other western producers. UK manufacturers have been more successful in maintaining their market share in high-technology, high-skill and leading edge sectors like aerospace and high-value engineering and the production of high quality branded goods. At the same time, the boundary
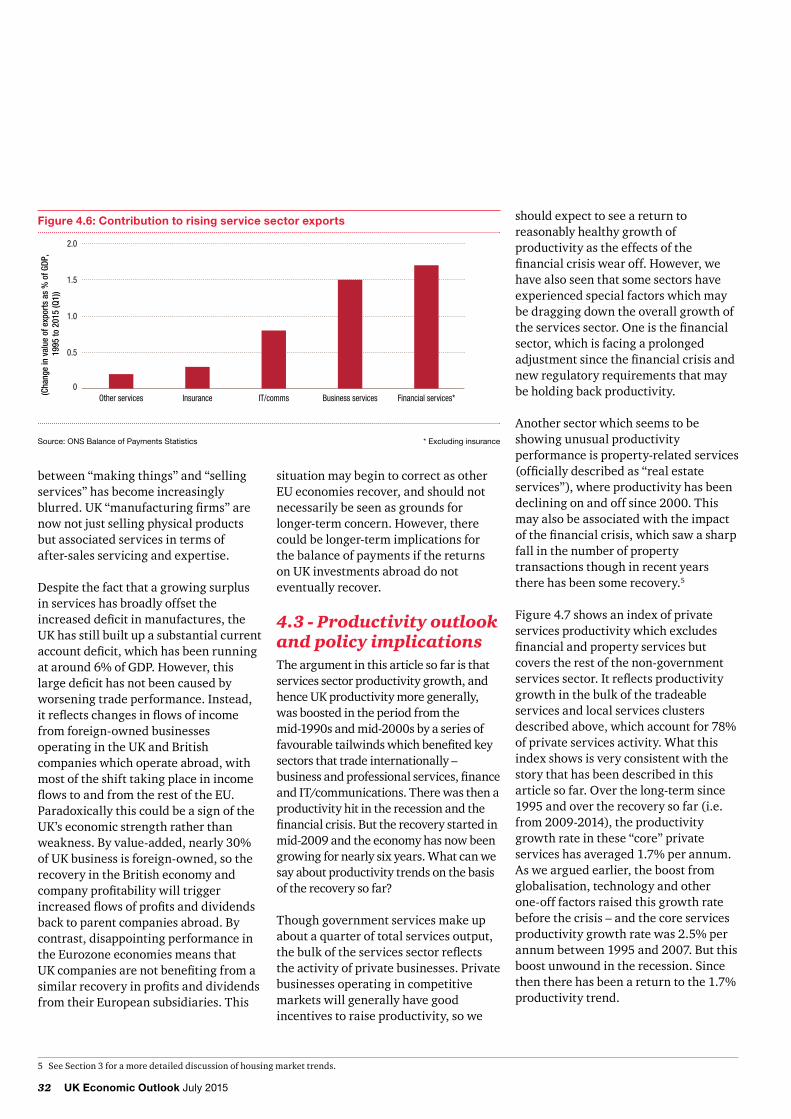
32 UK Economic Outlook July 2015
between “making things” and “selling services” has become increasingly blurred.UK“manufacturingfirms”arenow not just selling physical products but associated services in terms of after-sales servicing and expertise.
Despitethefactthatagrowingsurplusin services has broadly offset the increaseddeficitinmanufactures,theUK has still built up a substantial current accountdeficit,whichhasbeenrunningataround6%ofGDP.However,thislargedeficithasnotbeencausedbyworsening trade performance. Instead, itreflectschangesinflowsofincomefrom foreign-owned businesses operating in the UK and British companies which operate abroad, with most of the shift taking place in income flowstoandfromtherestoftheEU.Paradoxically this could be a sign of the UK’seconomicstrengthratherthanweakness.Byvalue-added,nearly30%of UK business is foreign-owned, so the recovery in the British economy and companyprofitabilitywilltriggerincreasedflowsofprofitsanddividendsback to parent companies abroad. By contrast, disappointing performance in the Eurozone economies means that UKcompaniesarenotbenefitingfromasimilarrecoveryinprofitsanddividendsfrom their European subsidiaries. This
situation may begin to correct as other EU economies recover, and should not necessarily be seen as grounds for longer-term concern. However, there could be longer-term implications for the balance of payments if the returns on UK investments abroad do not eventually recover.
4.3 - Productivity outlook and policy implicationsThe argument in this article so far is that services sector productivity growth, and hence UK productivity more generally, was boosted in the period from the mid-1990s and mid-2000s by a series of favourabletailwindswhichbenefitedkeysectors that trade internationally – businessandprofessionalservices,financeand IT/communications. There was then a productivity hit in the recession and the financialcrisis.Buttherecoverystartedinmid-2009 and the economy has now been growing for nearly six years. What can we say about productivity trends on the basis oftherecoverysofar?
Though government services make up about a quarter of total services output, thebulkoftheservicessectorreflectsthe activity of private businesses. Private businesses operating in competitive markets will generally have good incentives to raise productivity, so we
should expect to see a return to reasonably healthy growth of productivity as the effects of the financialcrisiswearoff.However,wehave also seen that some sectors have experienced special factors which may be dragging down the overall growth of theservicessector.Oneisthefinancialsector, which is facing a prolonged adjustmentsincethefinancialcrisisandnew regulatory requirements that may be holding back productivity.
Another sector which seems to be showing unusual productivity performance is property-related services (officiallydescribedas“realestateservices”), where productivity has been declining on and off since 2000. This may also be associated with the impact ofthefinancialcrisis,whichsawasharpfall in the number of property transactions though in recent years there has been some recovery.5
Figure4.7showsanindexofprivateservices productivity which excludes financialandpropertyservicesbutcovers the rest of the non-government servicessector.Itreflectsproductivitygrowth in the bulk of the tradeable services and local services clusters describedabove,whichaccountfor78%of private services activity. What this index shows is very consistent with the story that has been described in this article so far. Over the long-term since 1995andovertherecoverysofar(i.e.from 2009-2014), the productivity growth rate in these “core” private serviceshasaveraged1.7%perannum.As we argued earlier, the boost from globalisation, technology and other one-off factors raised this growth rate before the crisis – and the core services productivitygrowthratewas2.5%perannumbetween1995and2007.Butthisboostunwoundintherecession.Sincethentherehasbeenareturntothe1.7%productivity trend.
Figure 4.6: Contribution to rising service sector exports
Source: ONS Balance of Payments Statistics * Excluding insurance
0
0.5
1.0
1.5
2.0
Financial services*Business servicesIT/commsInsuranceOther services
(Cha
nge
in v
alue
of e
xpor
ts a
s %
of G
DP,
1995
to 2
015
(Q1)
)
5 SeeSection3foramoredetaileddiscussionofhousingmarkettrends.
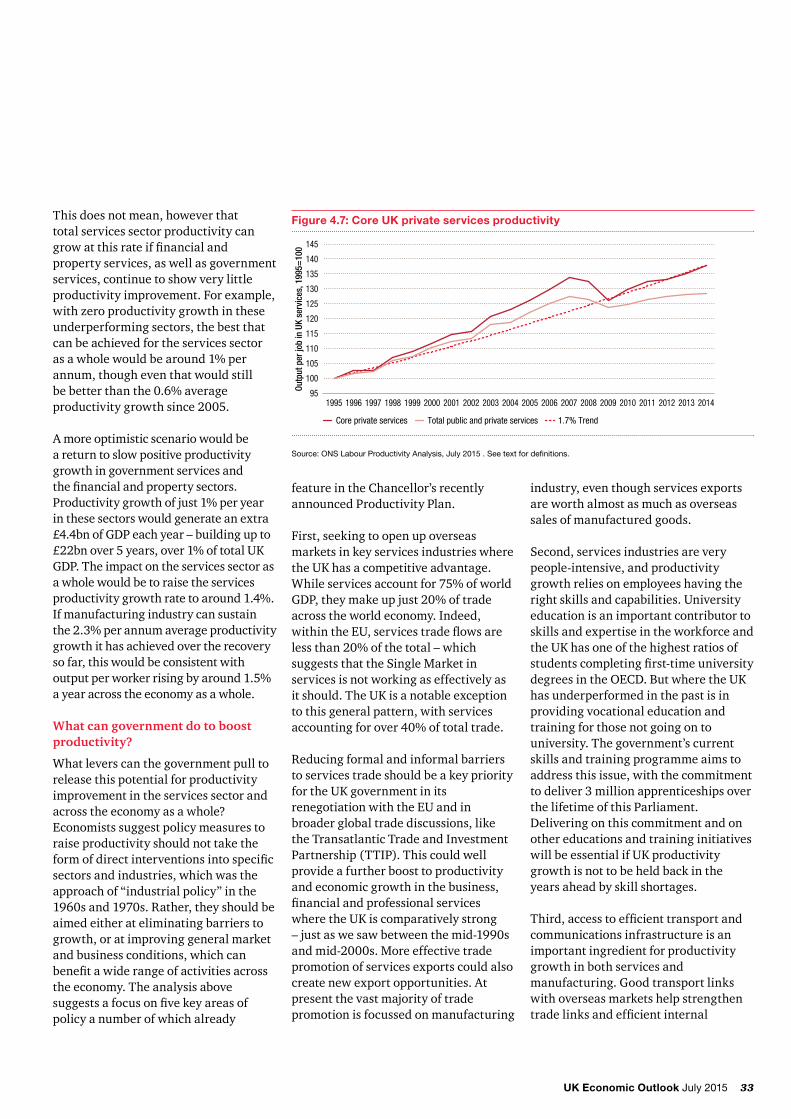
33UK Economic Outlook July 2015
This does not mean, however that total services sector productivity can growatthisrateiffinancialandproperty services, as well as government services, continue to show very little productivityimprovement.Forexample,with zero productivity growth in these underperforming sectors, the best that can be achieved for the services sector asawholewouldbearound1%perannum, though even that would still bebetterthanthe0.6%averageproductivitygrowthsince2005.
A more optimistic scenario would be a return to slow positive productivity growth in government services and thefinancialandpropertysectors.Productivitygrowthofjust1%peryearin these sectors would generate an extra £4.4bnofGDPeachyear–buildingupto£22bnover5years,over1%oftotalUKGDP.Theimpactontheservicessectorasa whole would be to raise the services productivitygrowthratetoaround1.4%.If manufacturing industry can sustain the2.3%perannumaverageproductivitygrowth it has achieved over the recovery so far, this would be consistent with outputperworkerrisingbyaround1.5%a year across the economy as a whole.
What can government do to boost productivity?
What levers can the government pull to release this potential for productivity improvement in the services sector and acrosstheeconomyasawhole?Economists suggest policy measures to raise productivity should not take the formofdirectinterventionsintospecificsectors and industries, which was the approach of “industrial policy” in the 1960s and 1970s. Rather, they should be aimed either at eliminating barriers to growth, or at improving general market and business conditions, which can benefitawiderangeofactivitiesacrossthe economy. The analysis above suggestsafocusonfivekeyareasofpolicy a number of which already
featureintheChancellor’srecentlyannounced Productivity Plan.
First,seekingtoopenupoverseasmarkets in key services industries where the UK has a competitive advantage. Whileservicesaccountfor75%ofworldGDP,theymakeupjust20%oftradeacross the world economy. Indeed, withintheEU,servicestradeflowsarelessthan20%ofthetotal–whichsuggeststhattheSingleMarketinservices is not working as effectively as it should. The UK is a notable exception to this general pattern, with services accountingforover40%oftotaltrade.
Reducing formal and informal barriers to services trade should be a key priority for the UK government in its renegotiation with the EU and in broader global trade discussions, like the Transatlantic Trade and Investment Partnership (TTIP). This could well provide a further boost to productivity and economic growth in the business, financialandprofessionalserviceswhere the UK is comparatively strong – just as we saw between the mid-1990s and mid-2000s. More effective trade promotion of services exports could also create new export opportunities. At present the vast majority of trade promotion is focussed on manufacturing
industry, even though services exports are worth almost as much as overseas sales of manufactured goods.
Second,servicesindustriesareverypeople-intensive, and productivity growth relies on employees having the right skills and capabilities. University education is an important contributor to skills and expertise in the workforce and the UK has one of the highest ratios of studentscompletingfirst-timeuniversitydegreesintheOECD.ButwheretheUKhas underperformed in the past is in providing vocational education and training for those not going on to university.Thegovernment’scurrentskills and training programme aims to address this issue, with the commitment to deliver 3 million apprenticeships over the lifetime of this Parliament. Deliveringonthiscommitmentandonother educations and training initiatives will be essential if UK productivity growth is not to be held back in the years ahead by skill shortages.
Third,accesstoefficienttransportandcommunications infrastructure is an important ingredient for productivity growth in both services and manufacturing.Goodtransportlinkswith overseas markets help strengthen tradelinksandefficientinternal
Figure 4.7: Core UK private services productivity
Source: ONS Labour Productivity Analysis, July 2015 . See text for definitions.
95
100
105
110
115
120
125
130
135
140
145
20142013201220112010200920082007200620052004200320022001200019991998199719961995
Outp
ut p
er jo
b in
UK
serv
ices
, 199
5=10
0
Total public and private servicesCore private services 1.7% Trend

34 UK Economic Outlook July 2015
transport links support the clustering of services activities around cities, towns and universities which can make them more productive. An important issue for the UK in this context will be the delivery of additional airport capacity in theSouth-EastofEngland,whichhasbeendebatedforfifteenyearssincetheLabourgovernmentissueditsFuture of Aviation consultation in 2000. We are still awaiting a government decision on the AirportsCommission recommendation that a new runway should be built at Heathrow as long as environmental conditions can be met.6 The new Conservative government has ambitious plans for new road and rail links, including upgrading the transport infrastructure which supports the “Northern Powerhouse”. But past experience shows that it has been easier for governments to talk about transport improvements than to build new roads andraillinks.Deliveringontheseambitious infrastructure plans in the years ahead will be a key challenge.
Fourth,ouranalysishasshowedthatgovernment services appear to be an area of weak productivity growth – at leastaccordingtotheofficialGDPfigures.Thismaypartlyreflectthedifficultyofmeasuringproductivityinservices which are not marketed, but it also highlights the importance of reforming public services to improve the efficiencyofdelivery,aspartofthewider productivity growth agenda.7
Finally,financialserviceshavebecomean area of relatively weak productivity growth after very strong y performance beforethefinancialcrisis.Thisprobablyreflectsthescaleoftheshocktothefinancialsystemandtheimpactofnewregulation. But it is important for regulators to ensure that the systems they are putting in place are
proportionateandallowfinancialservicesfirmstooperateefficiently.Also, ensuring the UK remains a competitivebaseforfinancialservicesrelative to other EU and global centres is necessarytounderpinBritain’spositionasamajorexporteroffinancialservices,which is also crucial to sustaining productivity growth in this sector.
4.4 - ConclusionRecent UK poor productivity performance in the UK services industries becomes less of a puzzle when we recognise that a cluster of tradeable services provided a big boost to productivity in the decade or so before thefinancialcrisis.Thoughsomeofthetailwinds which provided that boost are no longer present, underlying private sector services productivity is now growingat1.7%-inlinewiththelong-run trend since the mid-1990s. With policy action to remedy UK weaknesses that hold back growth potential in skills, transport, government services and finance,thereisscopefortheUK’sproductivity performance to recover in the years ahead. Across the economy as a whole, growth of output per worker of 1.5%ayearcouldbeachievable,agreatimprovementonthevirtuallyflatnational productivity trend since the financialcrisis.
Meanwhile, UK productivity should receive a further boost if we are successful in gaining new opportunities to expand trade in services, by opening up markets inside and outside the EU. The UK has become a very successful exporter of services – the second largest in the world - and it is quite likely that we will be selling more services overseas than manufactures by the end of this decade.
6 ThefinalreportoftheAirportsCommissionchairedbySirHowardDavieswaspublishedon1July2015:https://www.gov.uk/government/organisations/airports-commission7 ArecentanalysisbytheOfficeofNationalStatisticsshowshigherproductivitygrowthinpublicservicessince2007.Seehttp://www.ons.gov.uk/ons/guide-method/method-quality/specific/economy/productivity-measures/productivity-articles/comparing-public-service-productivity-estimates.pdf
Understanding the services sector is critical to analysing the performance of the UK economy as a whole.

35UK Economic Outlook July 2015

36 UK Economic Outlook July 2015
Appendix A Outlook for the global economy
Table A.1 presents our latest main scenario projections for a selection of economies across the world.
Positive but relatively modest growth is projected across the leading developed economiesin2015-16,withtheUKactually estimated to have the highest G7growthrateagainthisyeardespitethisonlybeing2.6%inourmainscenario.ThisreflectsdisappointingUSgrowthinearly2015,whichhascausedustorevisedownsignificantlyourUSprojections for the year as a whole since March. The overall Eurozone growth rate is an improvement on recent years, but still modest in absolute terms. It is also particularly uncertain at present due to the ongoing problems faced by Greece.
Emerging market performance is projected to vary considerably, with ChinaandIndiagrowingataround7%this year, but with China being subject tomuchfinancialvolatilityrecently,while Brazil and Russia are in recession.Globalgrowthisprojectedtopick up in 2016, but this remains subject to considerable uncertainties at thisearlystage.Inflationremainsrelatively subdued at the global level.
These projections (including those for the UK) are updated monthly in our GlobalEconomyWatchpublication,which can be found at www.pwc.com/gew
Table A.1: Global economic prospects
Share of world GDP
Real GDP growth (%) Inflation (%)
2014 at MERs 2015p 2016p 2015p 2016p
United States 22.5% 2.3 2.7 0.2 1.8
China 13.4% 7.0 7.0 1.9 1.8
Japan 6.0% 1.1 1.7 1.4 1.5
UK 3.8% 2.6 2.4 0.3 1.7
France 3.7% 1.3 1.4 0.1 1.1
Germany 5.0% 1.7 1.9 0.2 1.8
Greece 0.3% -1.5 0.7 -0.8 0.3
Ireland 0.3% 3.4 3.4 0.2 1.1
Italy 2.8% 0.6 1.2 -0.1 1.8
Netherlands 1.1% 1.4 1.6 1.2 1.1
Portugal 0.3% 1.5 1.7 0.1 0.8
Spain 1.8% 3.0 2.4 -0.8 1.0
Poland 0.7% 3.4 3.5 -0.1 1.7
Russia 2.4% -5.0 -0.5 15.0 8.0
Turkey 1.0% 2.8 3.5 7.7 6.8
Australia 1.9% 2.9 2.0 2.5 2.6
India 2.7% 7.5 7.9 -2.2 3.9
Indonesia 1.1% 4.9 5.0 6.8 5.8
South Korea 1.8% 3.1 3.5 1.0 2.0
Argentina 0.7% 0.8 1.8 25.0 25.0
Brazil 3.0% -0.9 0.7 8.0 6.0
Canada 2.3% 1.4 2.2 0.9 1.9
Mexico 1.7% 2.7 3.3 3.0 3.3
South Africa 0.5% 1.8 2.0 4.8 5.6
Nigeria 0.7% 4.0 4.5 10.5 10.0
Saudi Arabia 1.0% 2.6 3.0 2.3 3.0
World (PPP) 3.3 3.8
World (Market Exchange Rates) 100% 2.7 3.2 1.8 2.6
Eurozone 17.4% 1.5 1.7 0.1 1.4
Source: PwC main scenario for 2015 and 2016; IMF for GDP shares in 2014 at market exchange rates (MERs).

37UK Economic Outlook July 2015
Appendix B UK economic trends: 1979 – 2014
Annual averages GDP growth Household expenditure growth
Manufacturing output growth*
Inflation (CPI**)
3 month interest rate (% annual average)
Current account balance (% of GDP)
PSNB*** (% of GDP)
1979 3.7 4.8 13.7 -0.6 4.5
1980 -2.2 0.1 16.6 0.6 4.1
1981 -0.8 0.3 13.9 1.7 3.3
1982 2.1 1.2 12.2 0.7 2.5
1983 4.2 4.4 10.1 0.3 3.3
1984 2.3 2.5 10.0 -0.5 3.6
1985 3.5 4.1 12.2 -0.2 2.8
1986 3.2 6.5 10.9 -1 2.2
1987 5.5 5.3 9.7 -1.6 1.4
1988 5.9 7.8 10.4 -3.8 -0.7
1989 2.5 4.0 5.2 13.9 -4.3 -0.7
1990 0.5 0.7 7.0 14.8 -3.3 0.7
1991 -1.2 -0.7 7.5 11.5 -1.4 2.8
1992 0.4 1.2 4.3 9.6 -1.6 6.0
1993 2.6 3.1 2.5 5.9 -1.4 7.3
1994 4.0 3.3 2.0 5.5 -0.5 6.2
1995 2.5 2.1 2.6 6.7 -0.7 5.0
1996 2.7 4.2 2.5 6.0 -0.6 3.6
1997 2.6 4.6 1.8 6.8 -0.1 1.8
1998 3.5 4.4 0.4 1.6 7.3 -0.4 -0.1
1999 3.2 5.0 0.6 1.3 5.4 -2.6 -1.2
2000 3.8 5.3 2.2 0.8 6.1 -2.4 -1.5
2001 2.7 3.7 -1.5 1.2 5.0 -2.1 -0.7
2002 2.5 4.0 -2.6 1.3 4.0 -2 1.8
2003 4.3 4.0 -0.6 1.4 3.7 -1.6 2.8
2004 2.5 3.6 1.9 1.3 4.6 -2 3.1
2005 2.8 3.0 -0.1 2.1 4.7 -1.3 3.5
2006 3.0 2.2 2.2 2.3 4.8 -2.2 2.6
2007 2.6 2.8 0.8 2.3 6.0 -2.7 2.7
2008 -0.3 -0.5 -2.9 3.6 5.5 -3.7 4.9
2009 -4.3 -3.3 -9.4 2.2 1.2 -2.8 10.3
2010 1.9 0.5 4.7 3.3 0.7 -2.6 9.1
2011 1.6 -0.1 1.8 4.5 0.9 -1.7 7.0
2012 0.7 1.5 -1.3 2.8 0.8 -3.7 7.6
2013 1.7 1.7 -0.7 2.6 0.5 -4.5 5.9
2014 3.0 2.6 3.2 1.5 0.5 -5.9 5.4
Average over economic cycles****
1979 - 1989 2.7 3.7 12.0 -0.4 2.7
1989 - 2000 2.1 2.9 0.5 3.5 8.5 -1.5 2.9
2000 - 2007 3.1 3.7 0.2 1.5 4.7 -1.9 1.7
* After the revisions to the national accounts data, pre-1998 data is not currently available ** Pre-1997 data estimated *** Public Sector Net Borrowing (calendar years excluding public sector banks) **** Peak-to-peak for GDP relative to trend Sources: ONS, Bank of England

38 UK Economic Outlook July 2015
Contacts and services
Economics and policyOur macroeconomics team produce the UK Economic Outlook three times a year.
The present report was written by JohnHawksworth,AndrewSentance,RichardSnook,ThomasFisher,RebeccaMcDonald,ConorLambe andVishalSinghal.
Formoreinformationaboutthetechnicalcontent of this report please contact:
John Hawksworth [email protected] or02072131650
In addition, we provide a range of macroeconomic consulting services for clients, including:
• Revenue forecasting
• Stresstesting
• Economic impact analysis
Forenquiriesconcerningthese services, please contact Richard Boxshall on 020 7213 2079 or Richard Snookon02072121195.
Our UK economics and policy team is partofStrategy&PwC’sstrategyconsultingpractice.Strategy&isaglobal team of practical strategists committed to helping you seize essential advantage.
Our economics and policy practice offers a wider range of services, covering competition and regulation issues, litigation support, bids and business cases, public policy and project appraisals,financialeconomics,theeconomics of sustainability and macroeconomics.
Formoreinformationaboutthese services please visit our website (www.pwc.co.uk/economics) or contact the relevant person from the list to the right.
Disputes and investigations Tim Ogier +44 (0)20 7804 5207
Daniel Hanson +44 (0)20 7804 5774
Luisa Affuso +44 (0)20 7212 1832
Grant Saggers +44 (0)20 7212 1102
Market reform David Armstrong +44 (0)28 9041 5716
Dan Burke +44 (0)20 7212 6494
Alastair Macpherson +44 (0)20 7213 4463
Stuart Cook +44 (0)20 7804 7167
Growth Nick Forrest +44 (0)20 7804 5695
Richard Boxshall +44 (0)20 7213 2079
Andrew Sentance +44 (0)20 7213 2068
Total impact measurement and management
Mark Ambler +44 (0)20 7213 1591
Mark Graham +44 (0)131 260 4054
Sustainabilty and climate change Andrew Thurley +44 (0)20 7212 6503
Health industries Tim Wilson +44 (0)20 7213 2147
Kalee Talvite-Brown +44 (0)20 7213 4372
Dan Burke +44 (0)20 7212 6494
Andy Statham +44 (0)20 7213 1486
Education and skills Michael Kane +44 (0)28 9041 5303
Sean Hughes +44 (0)20 7212 4194
International development David Armstrong +44 (0)28 9041 5716
Sheetal Vyas +44 (0)7730 146352
Zlatina Loudjeva +44 (0)20 7213 4815
Financial services Nick Forrest +44 (0)20 7804 5695
Darren Pigg +44 (0)20 7774 9989
Telecommunications Alastair Macpherson +44 (0)20 7213 4463
Media and entertainment David Lancefield +44 (0)20 7213 2263
Water Richard Laikin +44 (0)20 7212 1204
Power and utilities Stuart Cook +44 (0)20 7804 7167
Transport Daniel Hanson +44 (0)20 7804 5774
In response to reader feedback and our own sustainability drive, this updated version will not be available in hard copy. This will enable us to improve the functionality of the report as well as reduce our impact on global resources.
To receive future editions by e-mail please sign up on our website www.pwc.co.uk/economy or e-mail [email protected]

PwC UK helps organisations and individuals create the value they’re looking for. We’re a member of the PwC network of firms in 158 countries with more than 180,000 people committed to delivering quality in assurance, tax and advisory services. Tell us what matters to you and find out more by visiting us at www.pwc.com/uk.
This publication has been prepared for general guidance on matters of interest only, and does not constitute professional advice. You should not act upon the information contained in this publication without obtaining specific professional advice. No representation or warranty (express or implied) is given as to the accuracy or completeness of the information contained in this publication, and, to the extent permitted by law, PricewaterhouseCoopers LLP, its members, employees and agents do not accept or assume any liability, responsibility or duty of care for any consequences of you or anyone else acting, or refraining to act, in reliance on the information contained in this publication or for any decision based on it.
© 2015 PricewaterhouseCoopers LLP. All rights reserved. In this document, “PwC” refers to the UK member firm, and may sometimes refer to the PwC network. Each member firm is a separate legal entity. Please see www.pwc.com/structure for further details.
Design Group 22291 (07/15)

www.pwc.co.uk/economics