UK Economic Outlook · UK Economic Outlook November 2019 16 1 UK economic growth has slowed since...
34
November 2019 UK Economic Outlook
Transcript of UK Economic Outlook · UK Economic Outlook November 2019 16 1 UK economic growth has slowed since...
November 2019
UK Economic Outlook
PwC
Contents
1. Global growth trends and prospects2. UK economic trends and prospects3. The Productivity Puzzle revisited: why has UK productivity lagged behind other advanced economies?4. What drives regional productivity gaps across the UK and how can these be closed?
2November 2019UK Economic Outlook

Global growth trends and prospects
PwC
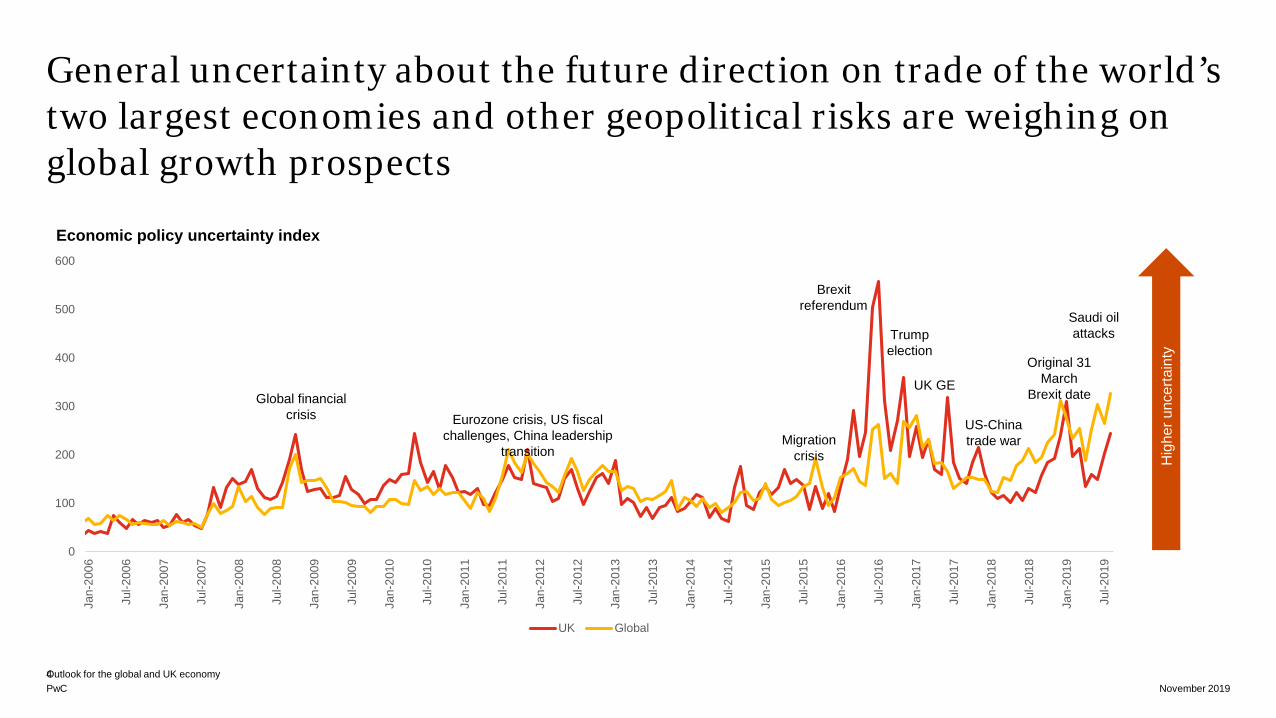
General uncertainty about the future direction on trade of the world’s two largest economies and other geopolitical risks are weighing on global growth prospects
Outlook for the global and UK economyNovember 2019
4
0
100
200
300
400
500
600
Jan-
2006
Jul-2
006
Jan-
2007
Jul-2
007
Jan-
2008
Jul-2
008
Jan-
2009
Jul-2
009
Jan-
2010
Jul-2
010
Jan-
2011
Jul-2
011
Jan-
2012
Jul-2
012
Jan-
2013
Jul-2
013
Jan-
2014
Jul-2
014
Jan-
2015
Jul-2
015
Jan-
2016
Jul-2
016
Jan-
2017
Jul-2
017
Jan-
2018
Jul-2
018
Jan-
2019
Jul-2
019
UK Global
Global financial crisis Eurozone crisis, US fiscal
challenges, China leadership transition
Migration crisis
Brexit referendum
Trump election
UK GE
Original 31 March
Brexit date
US-China trade war
Saudi oil attacks
Economic policy uncertainty index
Hig
her u
ncer
tain
ty
PwC
6.6
3.1
1.8 1.71.4 1.4
0.7 0.6
6.2
2.5
1.61.3 1.2
0.6
0.1
0.9
5.2
1.8 1.81.4
11.3
0.60.3
China US Canada France UK Germany Italy Japan
2018 2019p 2020p
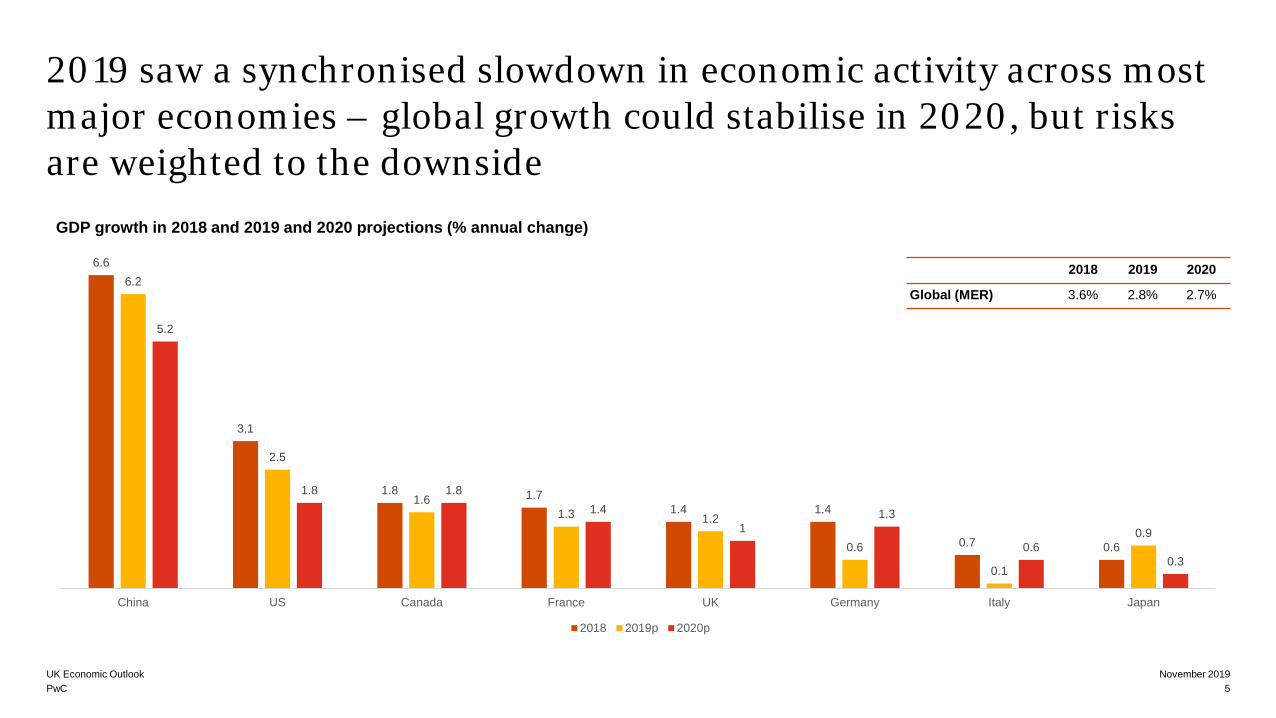
2019 saw a synchronised slowdown in economic activity across most major economies – global growth could stabilise in 2020, but risks are weighted to the downside
GDP growth in 2018 and 2019 and 2020 projections (% annual change)
2018 2019 2020
Global (MER) 3.6% 2.8% 2.7%
5November 2019UK Economic Outlook
UK economic trends and prospects
PwC
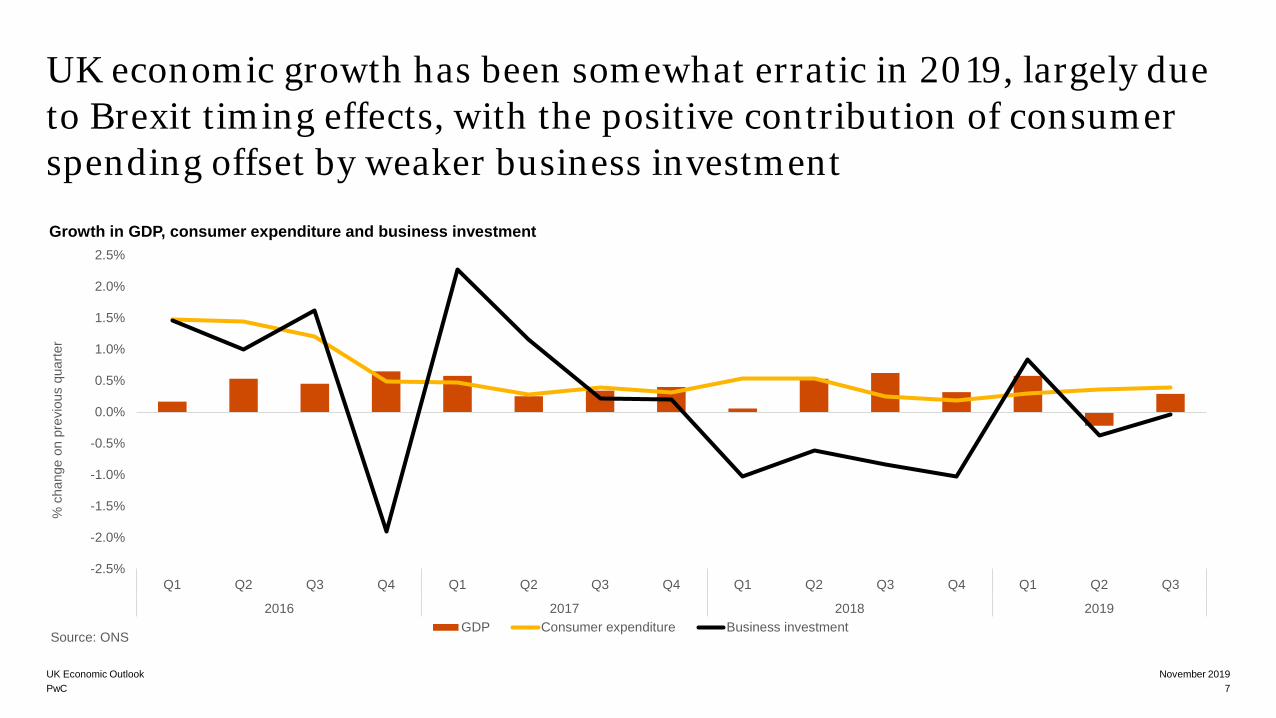
UK economic growth has been somewhat erratic in 2019, largely due to Brexit timing effects, with the positive contribution of consumer spending offset by weaker business investment
-2.5%
-2.0%
-1.5%
-1.0%
-0.5%
0.0%
0.5%
1.0%
1.5%
2.0%
2.5%
Q1 Q2 Q3 Q4 Q1 Q2 Q3 Q4 Q1 Q2 Q3 Q4 Q1 Q2 Q3
2016 2017 2018 2019
% c
hang
e on
pre
viou
s qu
arte
r
Source: ONSGDP Consumer expenditure Business investment
November 2019UK Economic Outlook7
Growth in GDP, consumer expenditure and business investment
PwC
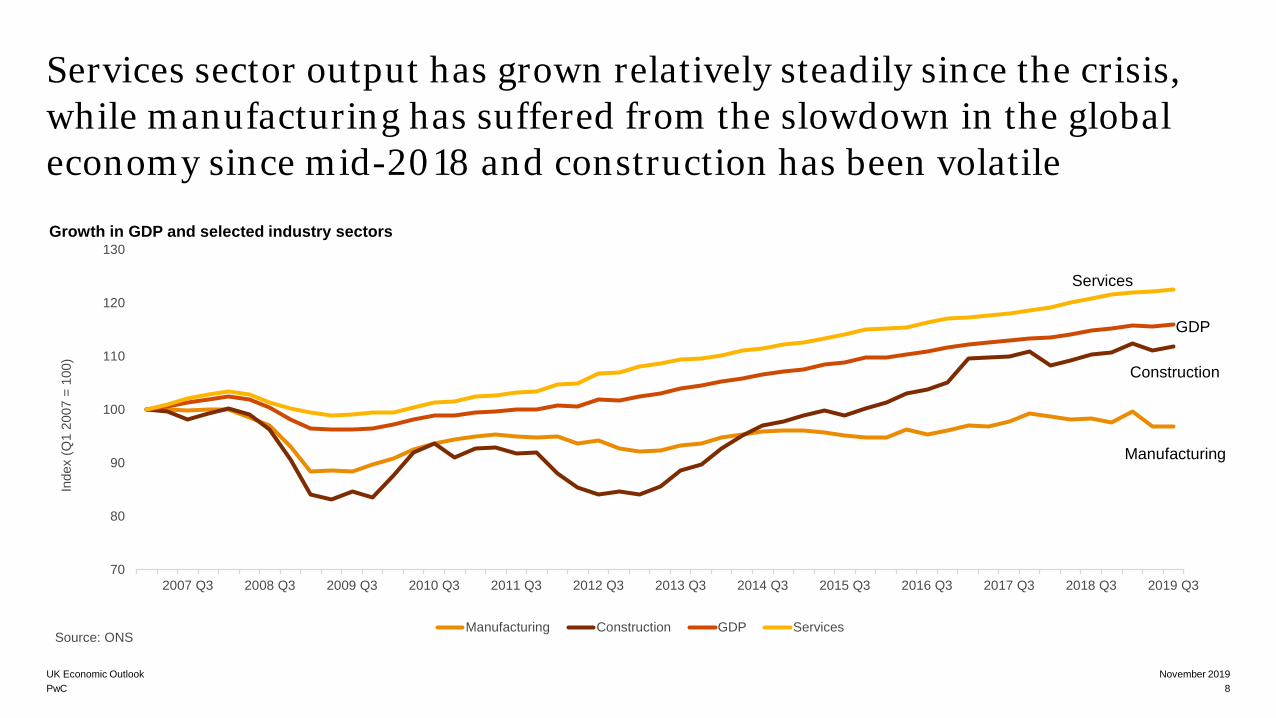
Services sector output has grown relatively steadily since the crisis, while manufacturing has suffered from the slowdown in the global economy since mid-2018 and construction has been volatile
70
80
90
100
110
120
130
2007 Q3 2008 Q3 2009 Q3 2010 Q3 2011 Q3 2012 Q3 2013 Q3 2014 Q3 2015 Q3 2016 Q3 2017 Q3 2018 Q3 2019 Q3
Inde
x (Q
1 20
07 =
100
)
Source: ONSManufacturing Construction GDP Services
Services
GDP
Manufacturing
Construction
November 2019UK Economic Outlook8
Growth in GDP and selected industry sectors
PwC
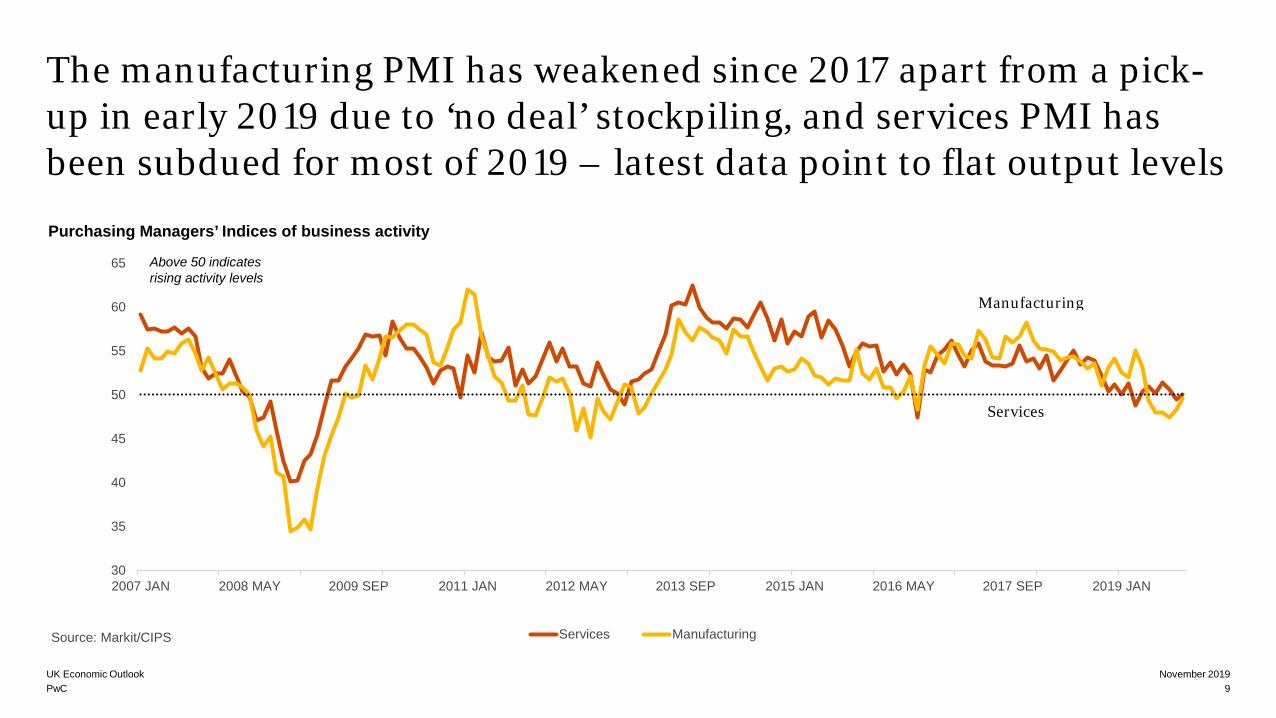
The manufacturing PMI has weakened since 2017 apart from a pick-up in early 2019 due to ‘no deal’ stockpiling, and services PMI has been subdued for most of 2019 – latest data point to flat output levels
November 2019UK Economic Outlook9
Purchasing Managers’ Indices of business activity
30
35
40
45
50
55
60
65
2007 JAN 2008 MAY 2009 SEP 2011 JAN 2012 MAY 2013 SEP 2015 JAN 2016 MAY 2017 SEP 2019 JAN
Source: Markit/CIPS Services Manufacturing
Above 50 indicates rising activity levels
Services
Manufacturing
PwC
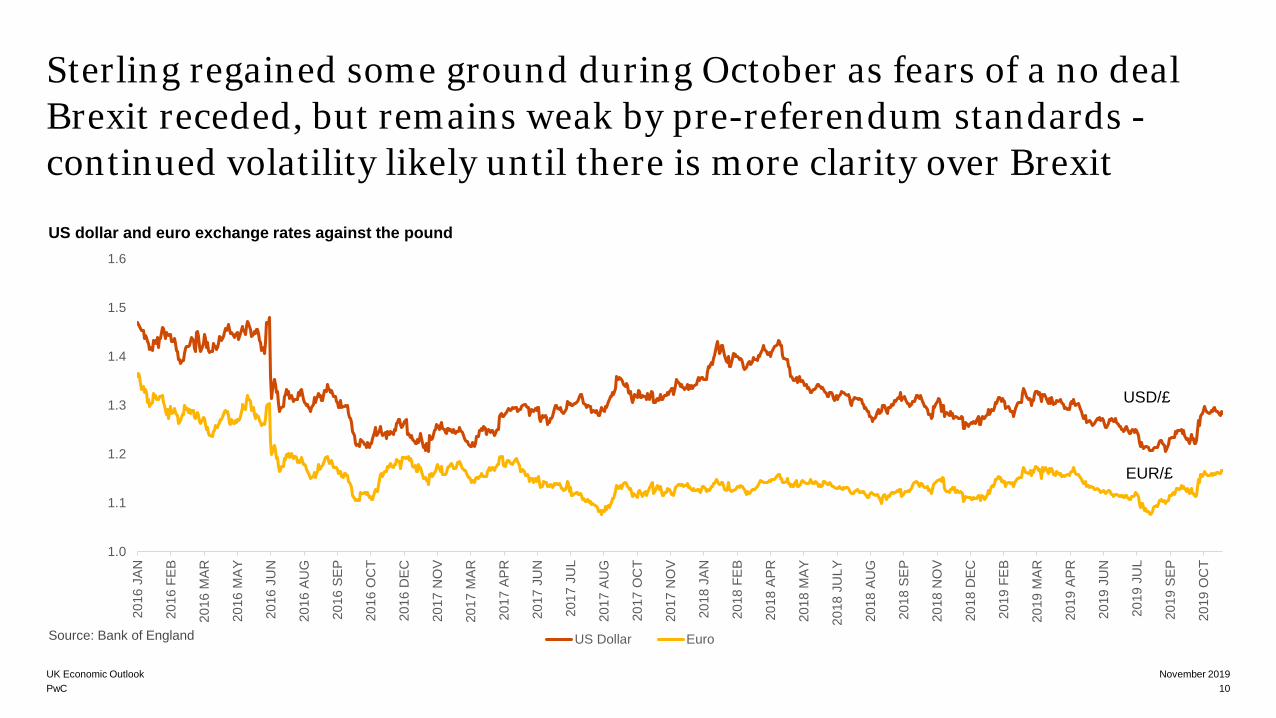
Sterling regained some ground during October as fears of a no deal Brexit receded, but remains weak by pre-referendum standards -continued volatility likely until there is more clarity over Brexit
November 2019UK Economic Outlook10
US dollar and euro exchange rates against the pound
1.0
1.1
1.2
1.3
1.4
1.5
1.6
2016
JAN
2016
FEB
2016
MAR
2016
MAY
2016
JU
N
2016
AU
G
2016
SEP
2016
OC
T
2016
DEC
2017
NO
V
2017
MAR
2017
APR
2017
JU
N
2017
JU
L
2017
AU
G
2017
OC
T
2017
NO
V
2018
JAN
2018
FEB
2018
APR
2018
MAY
2018
JU
LY
2018
AU
G
2018
SEP
2018
NO
V
2018
DEC
2019
FEB
2019
MAR
2019
APR
2019
JU
N
2019
JU
L
2019
SEP
2019
OC
T
US Dollar Euro
USD/£
EUR/£
Source: Bank of England
PwC
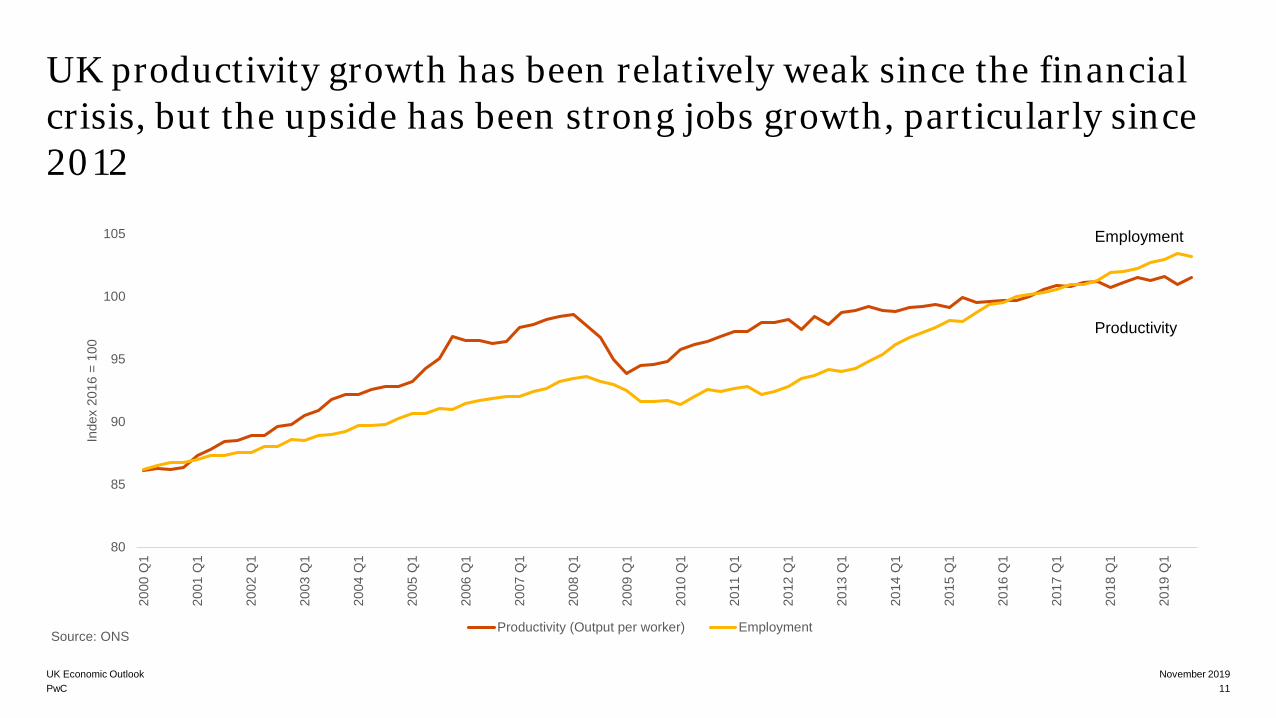
UK productivity growth has been relatively weak since the financial crisis, but the upside has been strong jobs growth, particularly since 2012
November 2019UK Economic Outlook11
Employment
Productivity
80
85
90
95
100
105
2000
Q1
2001
Q1
2002
Q1
2003
Q1
2004
Q1
2005
Q1
2006
Q1
2007
Q1
2008
Q1
2009
Q1
2010
Q1
2011
Q1
2012
Q1
2013
Q1
2014
Q1
2015
Q1
2016
Q1
2017
Q1
2018
Q1
2019
Q1
Inde
x 20
16 =
100
Source: ONSProductivity (Output per worker) Employment
PwC
Projections
-8%
-6%
-4%
-2%
0%
2%
4%
2007 Q1 2008 Q1 2009 Q1 2010 Q1 2011 Q1 2012 Q1 2013 Q1 2014 Q1 2015 Q1 2016 Q1 2017 Q1 2018 Q1 2019 Q1 2020 Q1
Main scenario Downside Strong growthSource: ONS, PwC scenarios
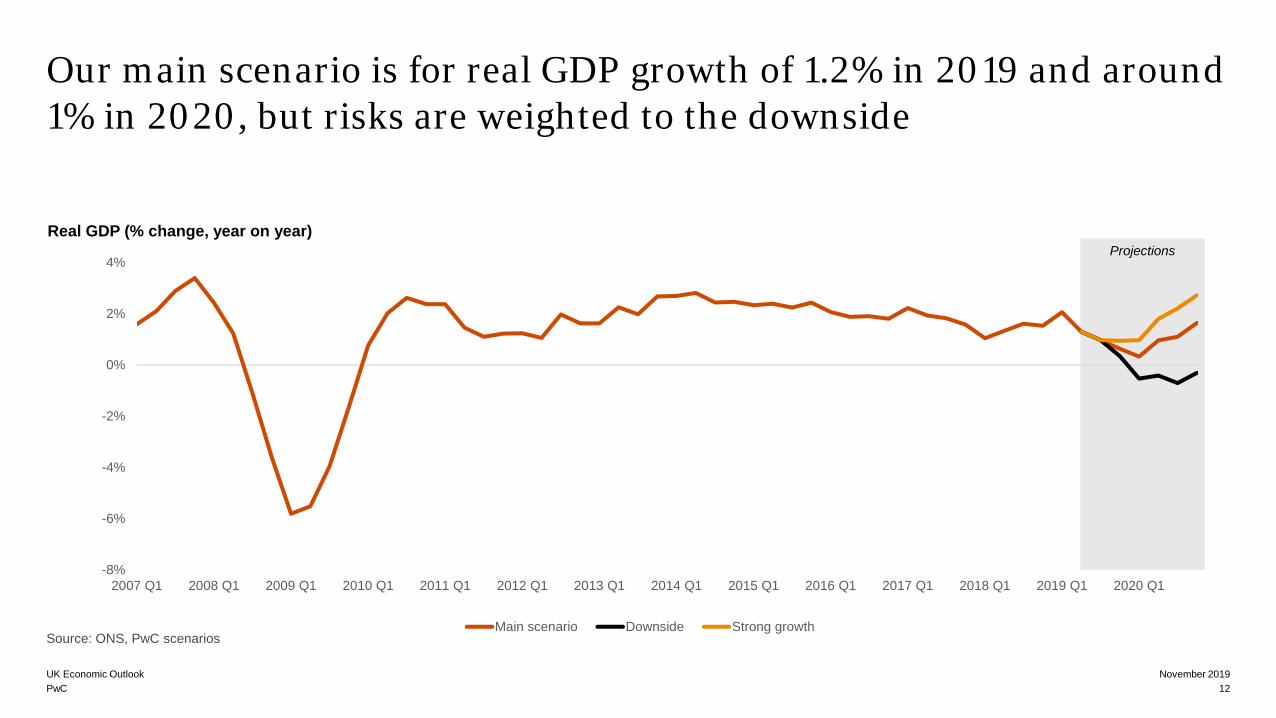
Our main scenario is for real GDP growth of 1.2% in 2019 and around 1% in 2020, but risks are weighted to the downside
November 2019UK Economic Outlook12
Real GDP (% change, year on year)
PwC
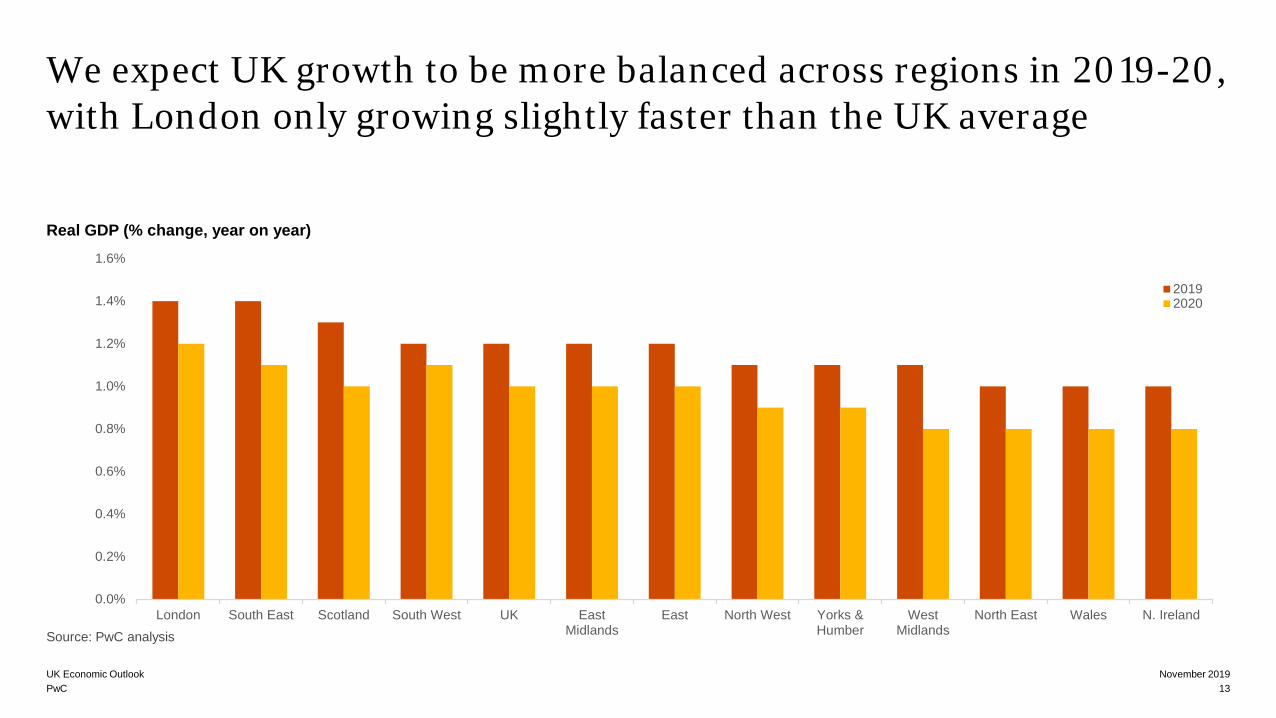
We expect UK growth to be more balanced across regions in 2019-20, with London only growing slightly faster than the UK average
November 2019UK Economic Outlook13
Real GDP (% change, year on year)
0.0%
0.2%
0.4%
0.6%
0.8%
1.0%
1.2%
1.4%
1.6%
London South East Scotland South West UK EastMidlands
East North West Yorks &Humber
WestMidlands
North East Wales N. Ireland
20192020
Source: PwC analysis
PwC
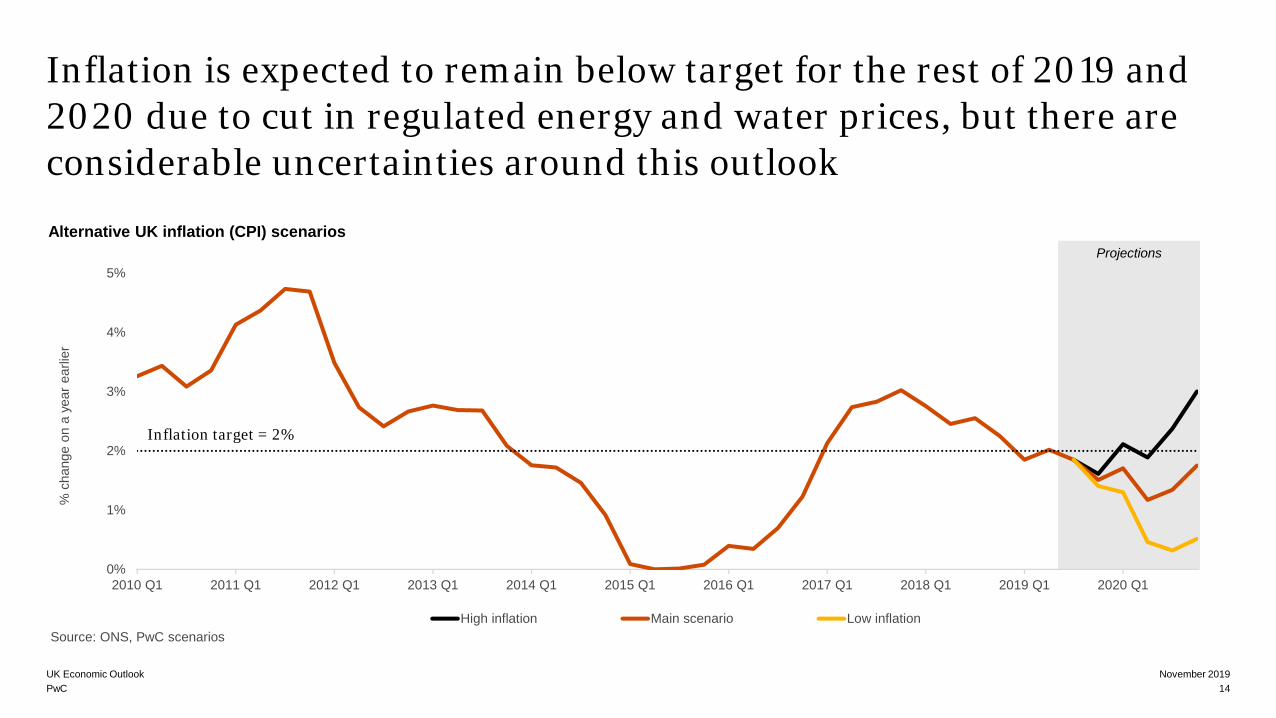
Projections
0%
1%
2%
3%
4%
5%
2010 Q1 2011 Q1 2012 Q1 2013 Q1 2014 Q1 2015 Q1 2016 Q1 2017 Q1 2018 Q1 2019 Q1 2020 Q1
% c
hang
e on
a y
ear e
arlie
r
Source: ONS, PwC scenariosHigh inflation Main scenario Low inflation
Inflation target = 2%
Inflation is expected to remain below target for the rest of 2019 and 2020 due to cut in regulated energy and water prices, but there are considerable uncertainties around this outlook
November 2019UK Economic Outlook14
Alternative UK inflation (CPI) scenarios
PwC
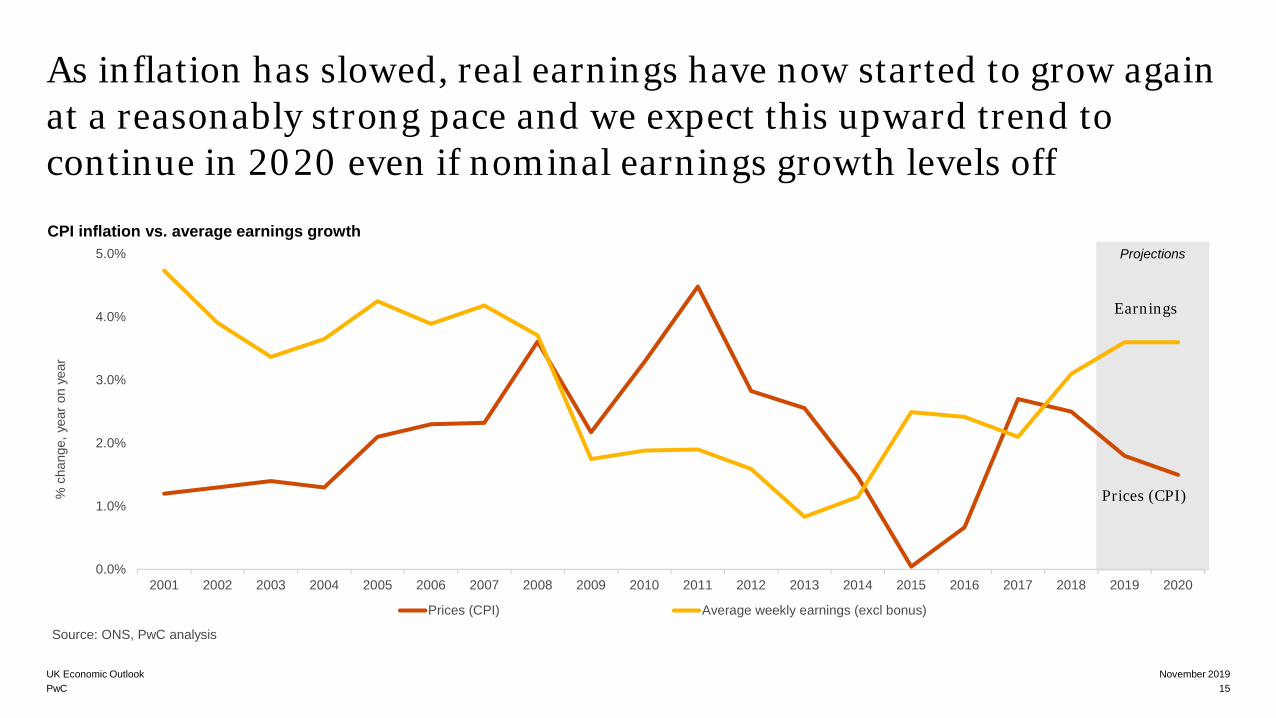
Projections
0.0%
1.0%
2.0%
3.0%
4.0%
5.0%
2001 2002 2003 2004 2005 2006 2007 2008 2009 2010 2011 2012 2013 2014 2015 2016 2017 2018 2019 2020
% c
hang
e, y
ear o
n ye
ar
Source: ONS, PwC analysis
Prices (CPI) Average weekly earnings (excl bonus)
Prices (CPI)
Earnings
As inflation has slowed, real earnings have now started to grow again at a reasonably strong pace and we expect this upward trend to continue in 2020 even if nominal earnings growth levels off
November 2019UK Economic Outlook15
CPI inflation vs. average earnings growth
PwC
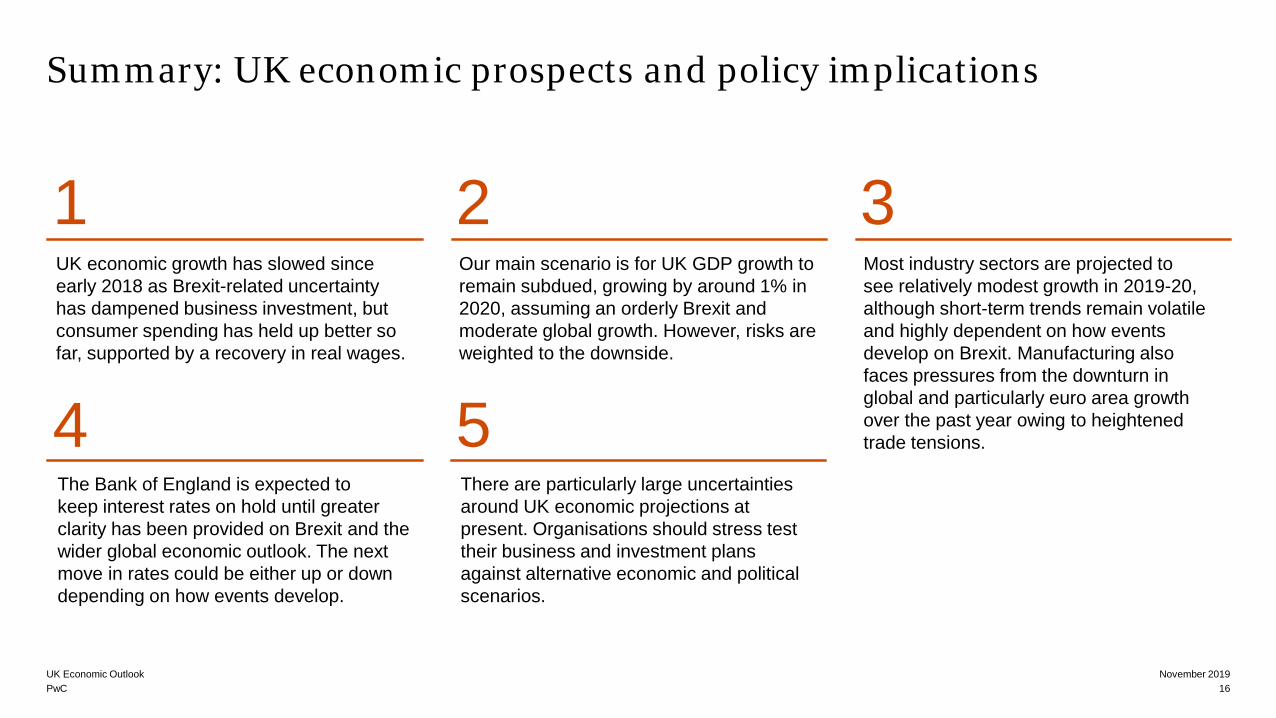
Summary: UK economic prospects and policy implications
November 2019UK Economic Outlook16
1UK economic growth has slowed since early 2018 as Brexit-related uncertainty has dampened business investment, but consumer spending has held up better so far, supported by a recovery in real wages.
4The Bank of England is expected tokeep interest rates on hold until greater clarity has been provided on Brexit and the wider global economic outlook. The next move in rates could be either up or down depending on how events develop.
2Our main scenario is for UK GDP growth to remain subdued, growing by around 1% in 2020, assuming an orderly Brexit and moderate global growth. However, risks are weighted to the downside.
5There are particularly large uncertainties around UK economic projections at present. Organisations should stress test their business and investment plans against alternative economic and political scenarios.
3Most industry sectors are projected tosee relatively modest growth in 2019-20, although short-term trends remain volatile and highly dependent on how events develop on Brexit. Manufacturing also faces pressures from the downturn in global and particularly euro area growth over the past year owing to heightened trade tensions.

The Productivity Puzzle revisited: why has UK productivity lagged behind other advanced economies?
PwC
-6.0
-5.0
-4.0
-3.0
-2.0
-1.0
0.0
1.0
2.0
3.0
4.0
5.0
1997 1998 1999 2000 2001 2002 2003 2004 2005 2006 2007 2008 2009 2010 2011 2012 2013 2014 2015 2016 2017 2018 2019
Year
-on-
year
cha
nge
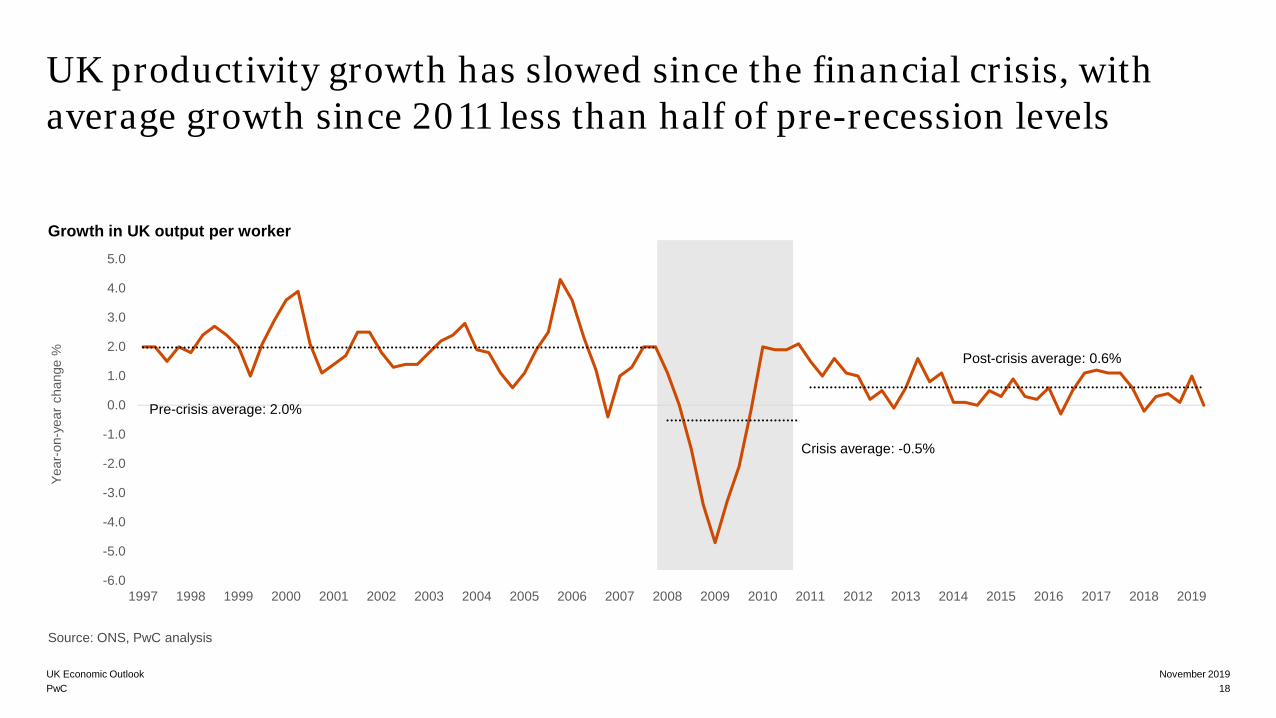
% Post-crisis average: 0.6%
Crisis average: -0.5%
UK productivity growth has slowed since the financial crisis, with average growth since 2011 less than half of pre-recession levels
November 2019UK Economic Outlook18
Source: ONS, PwC analysis
Pre-crisis average: 2.0%
Growth in UK output per worker
PwC
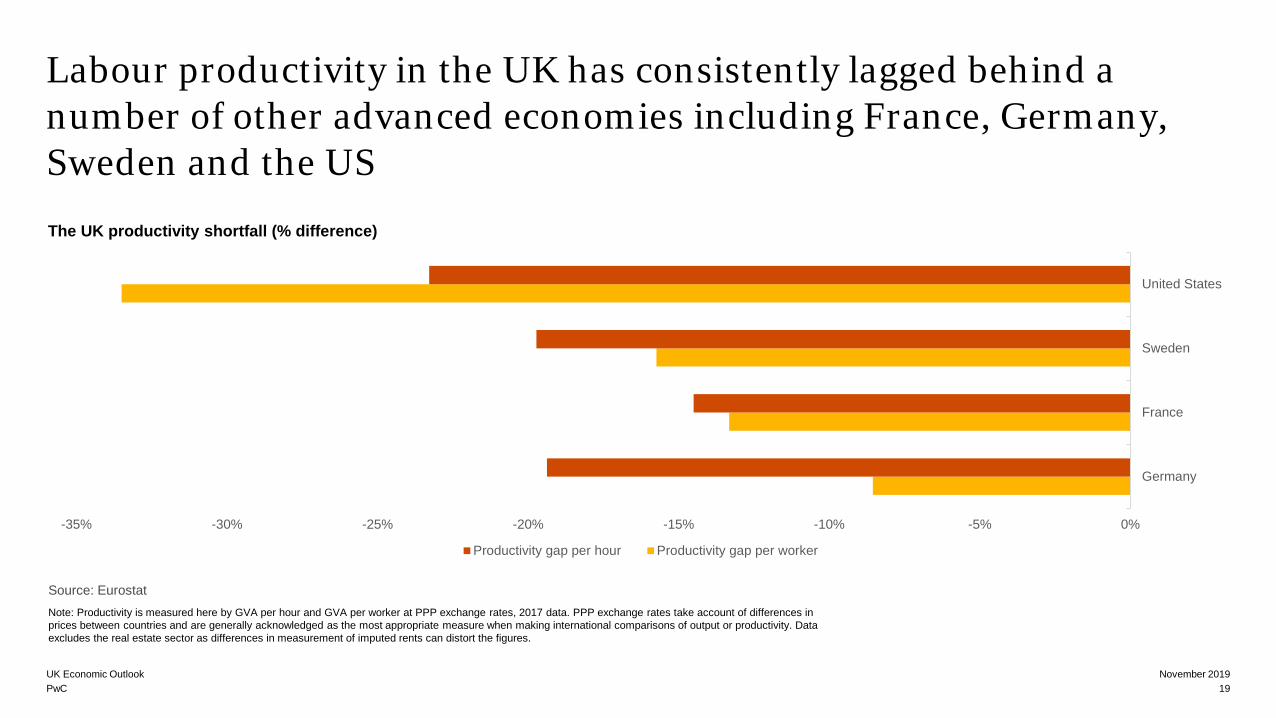
Labour productivity in the UK has consistently lagged behind a number of other advanced economies including France, Germany, Sweden and the US
November 2019UK Economic Outlook19
Source: EurostatNote: Productivity is measured here by GVA per hour and GVA per worker at PPP exchange rates, 2017 data. PPP exchange rates take account of differences in prices between countries and are generally acknowledged as the most appropriate measure when making international comparisons of output or productivity. Data excludes the real estate sector as differences in measurement of imputed rents can distort the figures.
The UK productivity shortfall (% difference)
-35% -30% -25% -20% -15% -10% -5% 0%
Germany
France
Sweden
United States
Productivity gap per hour Productivity gap per worker
PwC
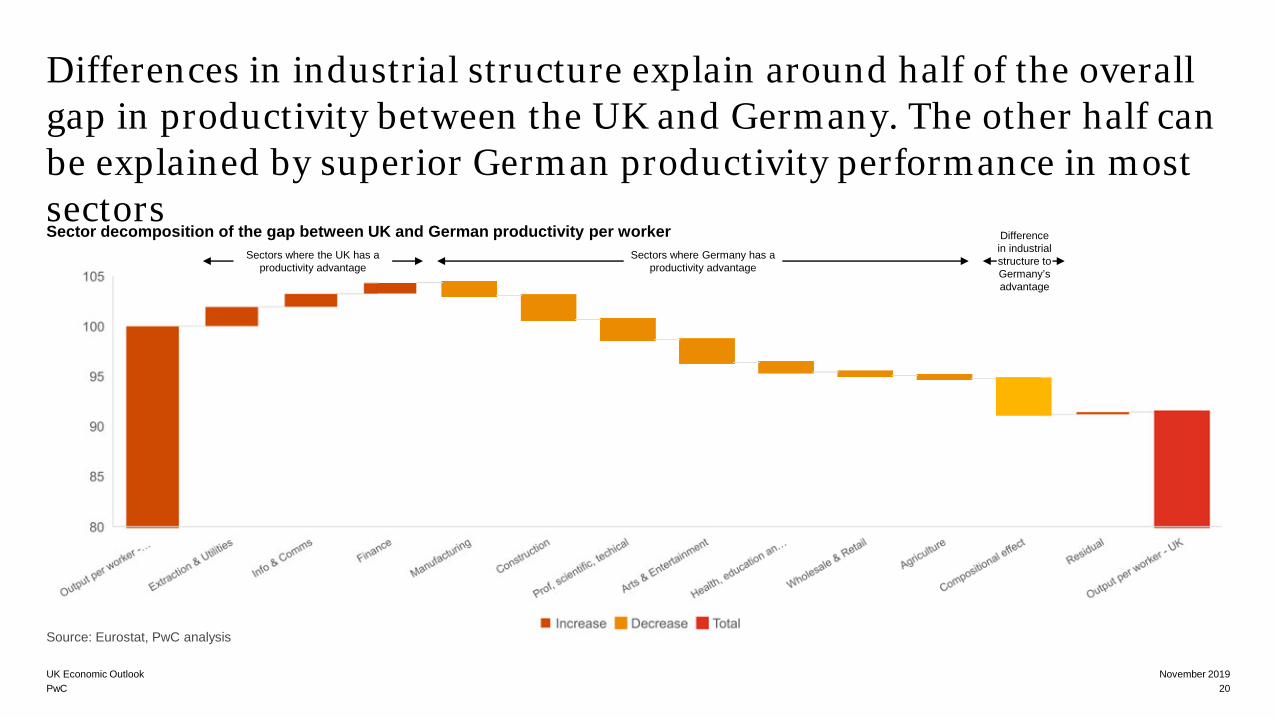
Differences in industrial structure explain around half of the overall gap in productivity between the UK and Germany. The other half can be explained by superior German productivity performance in most sectors
November 2019UK Economic Outlook20
Source: Eurostat, PwC analysis
Sector decomposition of the gap between UK and German productivity per worker Sectors where the UK has a
productivity advantageSectors where Germany has a
productivity advantage
Difference in industrial structure to Germany’s advantage
PwC
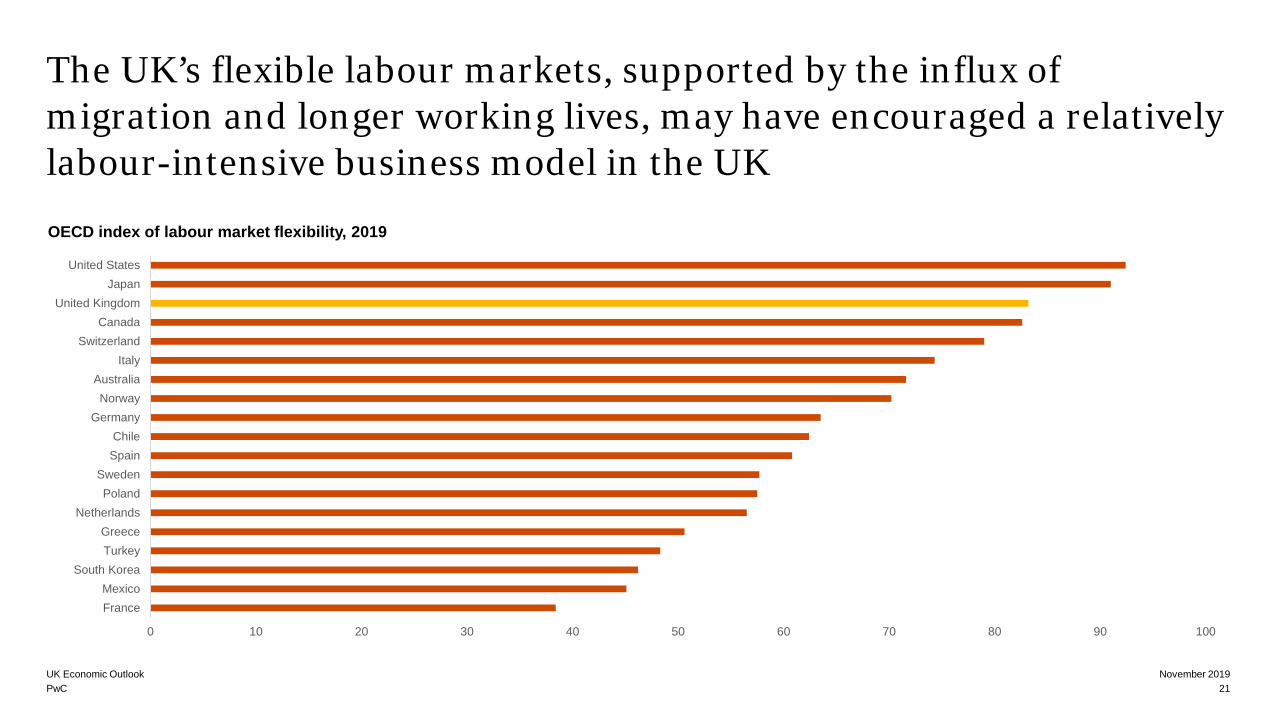
The UK’s flexible labour markets, supported by the influx of migration and longer working lives, may have encouraged a relatively labour-intensive business model in the UK
November 2019UK Economic Outlook21
0 10 20 30 40 50 60 70 80 90 100
United StatesJapan
United KingdomCanada
SwitzerlandItaly
AustraliaNorway
GermanyChile
SpainSwedenPoland
NetherlandsGreeceTurkey
South KoreaMexicoFrance
OECD index of labour market flexibility, 2019
PwC
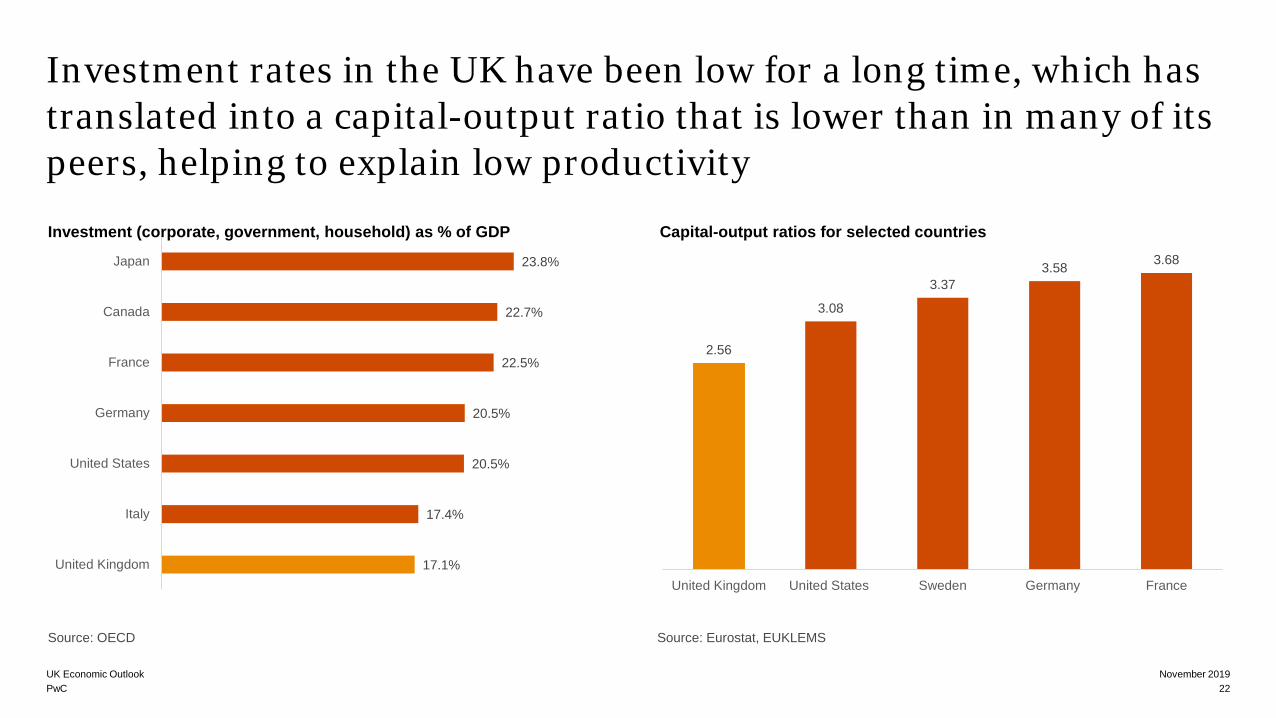
Investment rates in the UK have been low for a long time, which has translated into a capital-output ratio that is lower than in many of its peers, helping to explain low productivity
23.8%
22.7%
22.5%
20.5%
20.5%
17.4%
17.1%
Japan
Canada
France
Germany
United States
Italy
United Kingdom
2.56
3.08
3.373.58 3.68
United Kingdom United States Sweden Germany France
November 2019UK Economic Outlook22
Source: OECD
Capital-output ratios for selected countriesInvestment (corporate, government, household) as % of GDP
Source: Eurostat, EUKLEMS
PwC
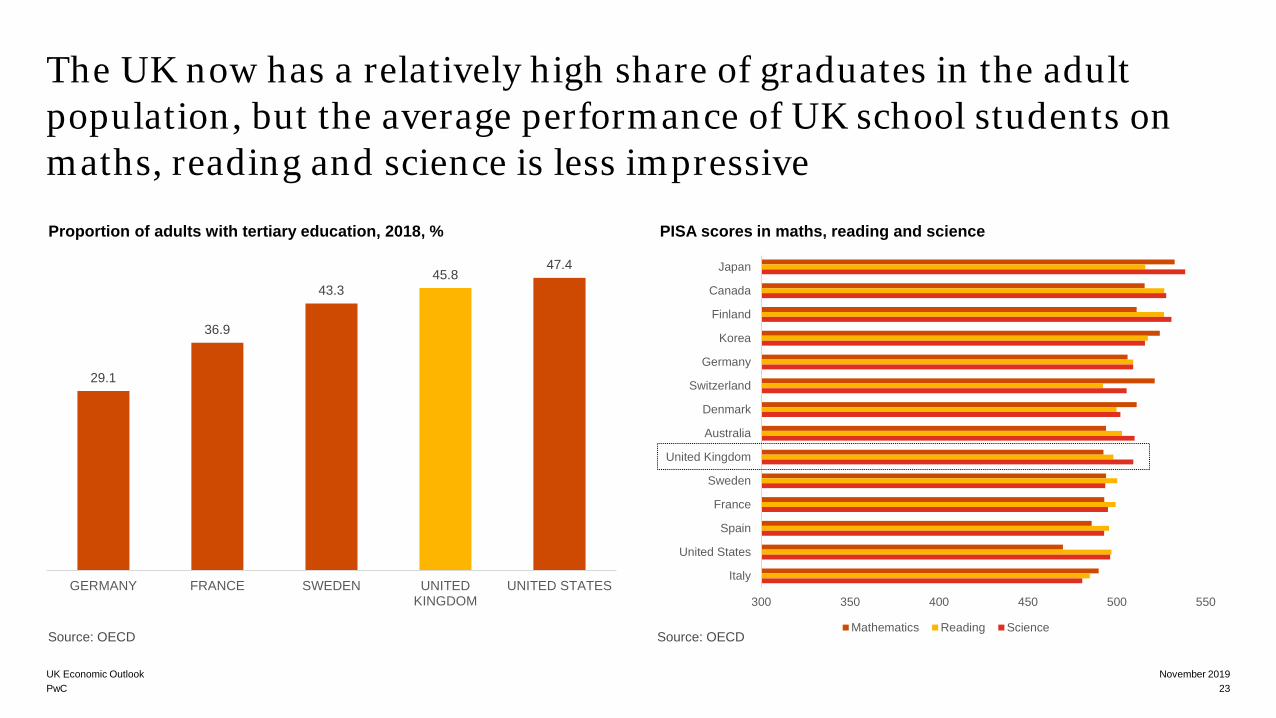
300 350 400 450 500 550
Japan
Canada
Finland
Korea
Germany
Switzerland
Denmark
Australia
United Kingdom
Sweden
France
Spain
United States
Italy
Mathematics Reading Science
The UK now has a relatively high share of graduates in the adult population, but the average performance of UK school students on maths, reading and science is less impressive
29.1
36.9
43.345.8
47.4
GERMANY FRANCE SWEDEN UNITEDKINGDOM
UNITED STATES
November 2019UK Economic Outlook23
Source: OECD
Proportion of adults with tertiary education, 2018, % PISA scores in maths, reading and science
Source: OECD
PwC
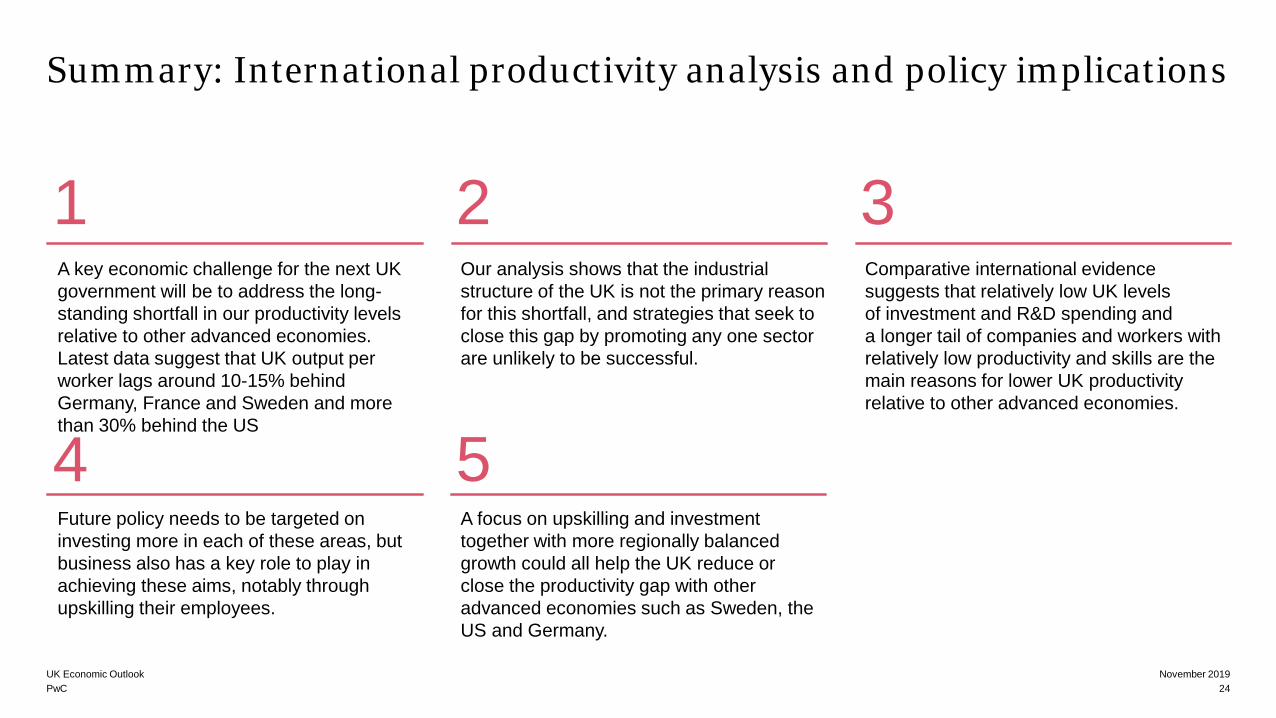
Summary: International productivity analysis and policy implications
November 2019UK Economic Outlook24
1A key economic challenge for the next UK government will be to address the long-standing shortfall in our productivity levels relative to other advanced economies. Latest data suggest that UK output per worker lags around 10-15% behind Germany, France and Sweden and more than 30% behind the US
4Future policy needs to be targeted on investing more in each of these areas, but business also has a key role to play in achieving these aims, notably through upskilling their employees.
2Our analysis shows that the industrial structure of the UK is not the primary reason for this shortfall, and strategies that seek to close this gap by promoting any one sector are unlikely to be successful.
5A focus on upskilling and investmenttogether with more regionally balanced growth could all help the UK reduce or close the productivity gap with other advanced economies such as Sweden, the US and Germany.
3Comparative international evidencesuggests that relatively low UK levelsof investment and R&D spending anda longer tail of companies and workers with relatively low productivity and skills are the main reasons for lower UK productivity relative to other advanced economies.
What drives regional productivity gaps across the UK and how can these be closed?
PwC
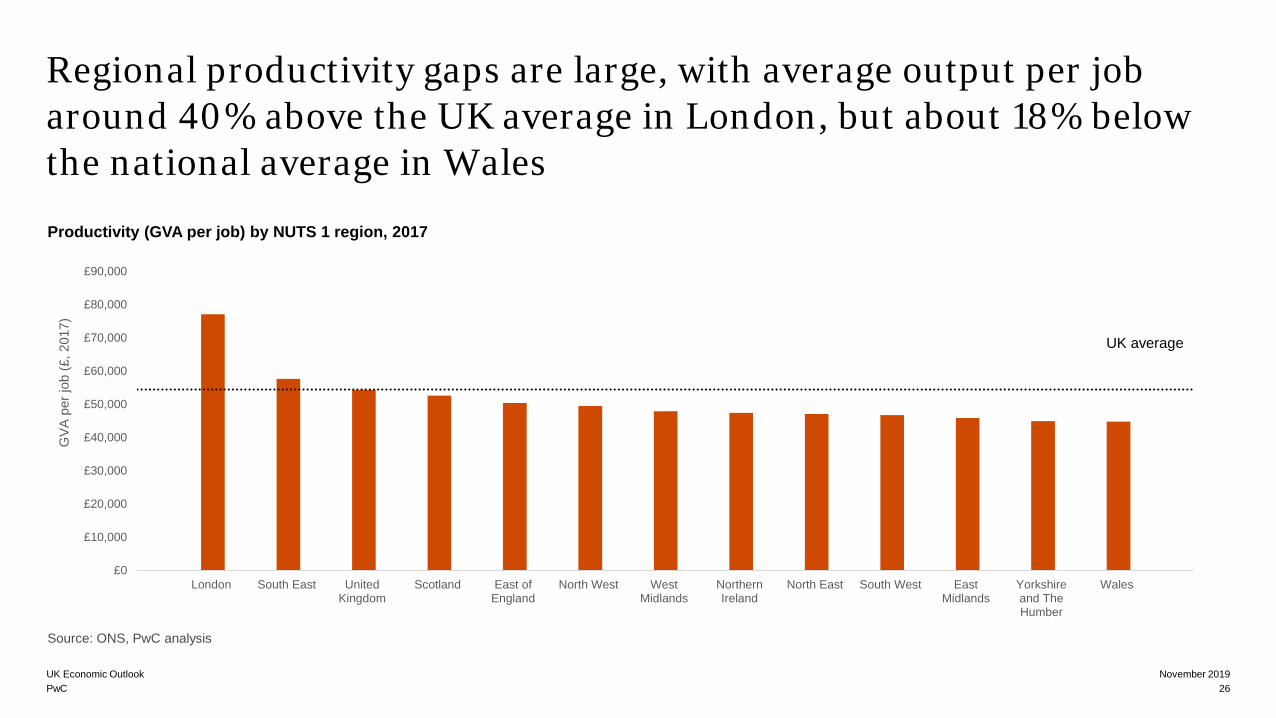
Regional productivity gaps are large, with average output per job around 40% above the UK average in London, but about 18% below the national average in Wales
November 2019UK Economic Outlook26
£0
£10,000
£20,000
£30,000
£40,000
£50,000
£60,000
£70,000
£80,000
£90,000
London South East UnitedKingdom
Scotland East ofEngland
North West WestMidlands
NorthernIreland
North East South West EastMidlands
Yorkshireand TheHumber
Wales
GVA
per
job
(£, 2
017)
Productivity (GVA per job) by NUTS 1 region, 2017
UK average
Source: ONS, PwC analysis
PwC
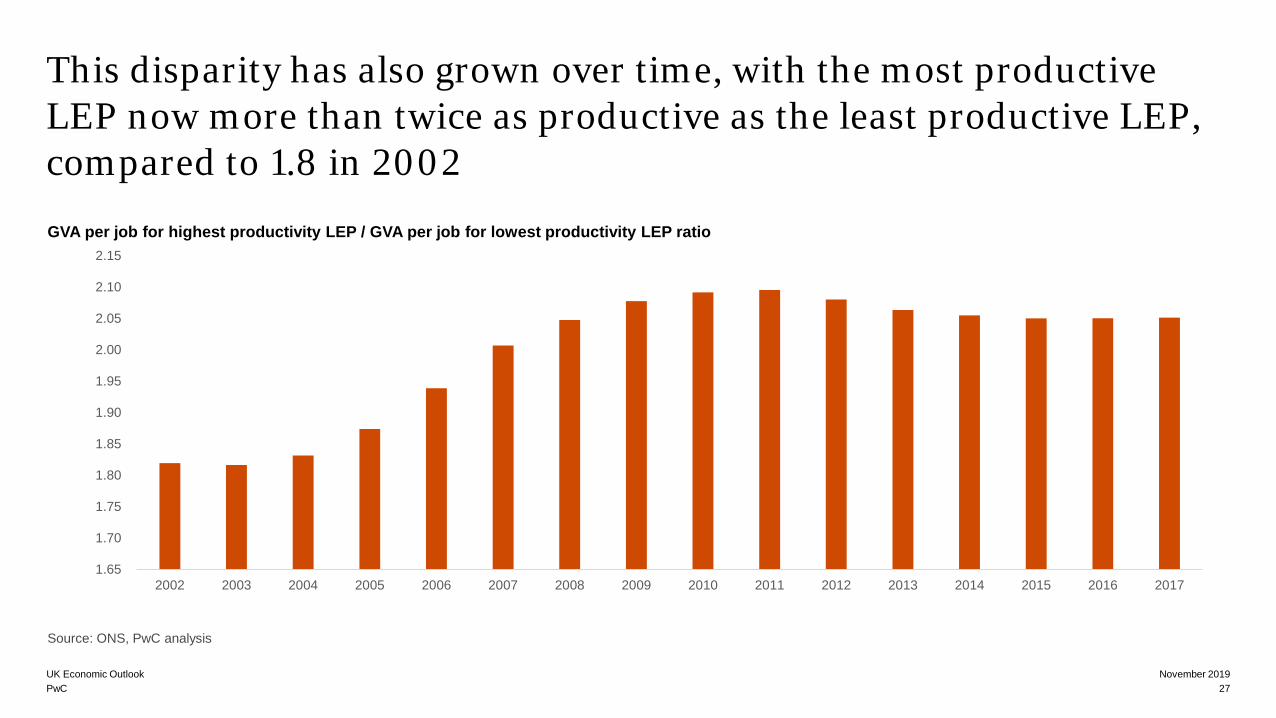
This disparity has also grown over time, with the most productive LEP now more than twice as productive as the least productive LEP, compared to 1.8 in 2002
November 2019UK Economic Outlook27
1.65
1.70
1.75
1.80
1.85
1.90
1.95
2.00
2.05
2.10
2.15
2002 2003 2004 2005 2006 2007 2008 2009 2010 2011 2012 2013 2014 2015 2016 2017
GVA per job for highest productivity LEP / GVA per job for lowest productivity LEP ratio
Source: ONS, PwC analysis
PwC
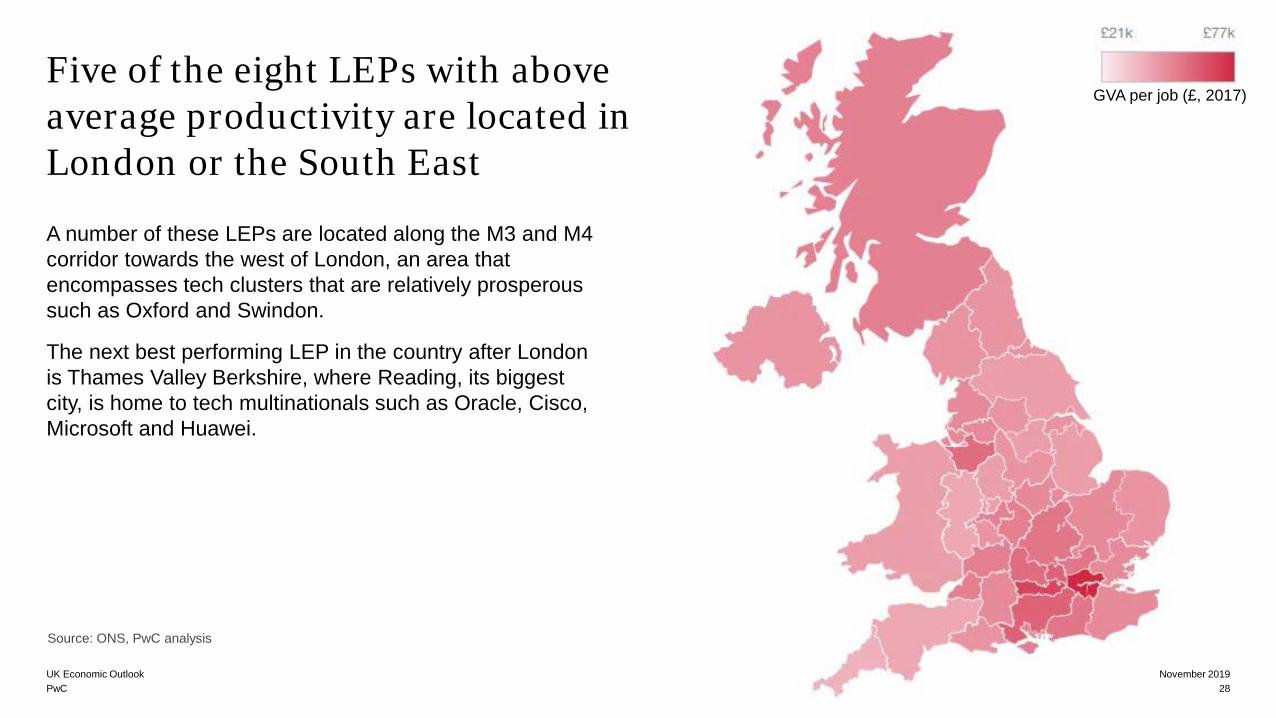
Five of the eight LEPs with above average productivity are located in London or the South East
A number of these LEPs are located along the M3 and M4 corridor towards the west of London, an area that encompasses tech clusters that are relatively prosperous such as Oxford and Swindon.
The next best performing LEP in the country after London is Thames Valley Berkshire, where Reading, its biggest city, is home to tech multinationals such as Oracle, Cisco, Microsoft and Huawei.
November 2019UK Economic Outlook28
GVA per job (£, 2017)
Source: ONS, PwC analysis
PwC
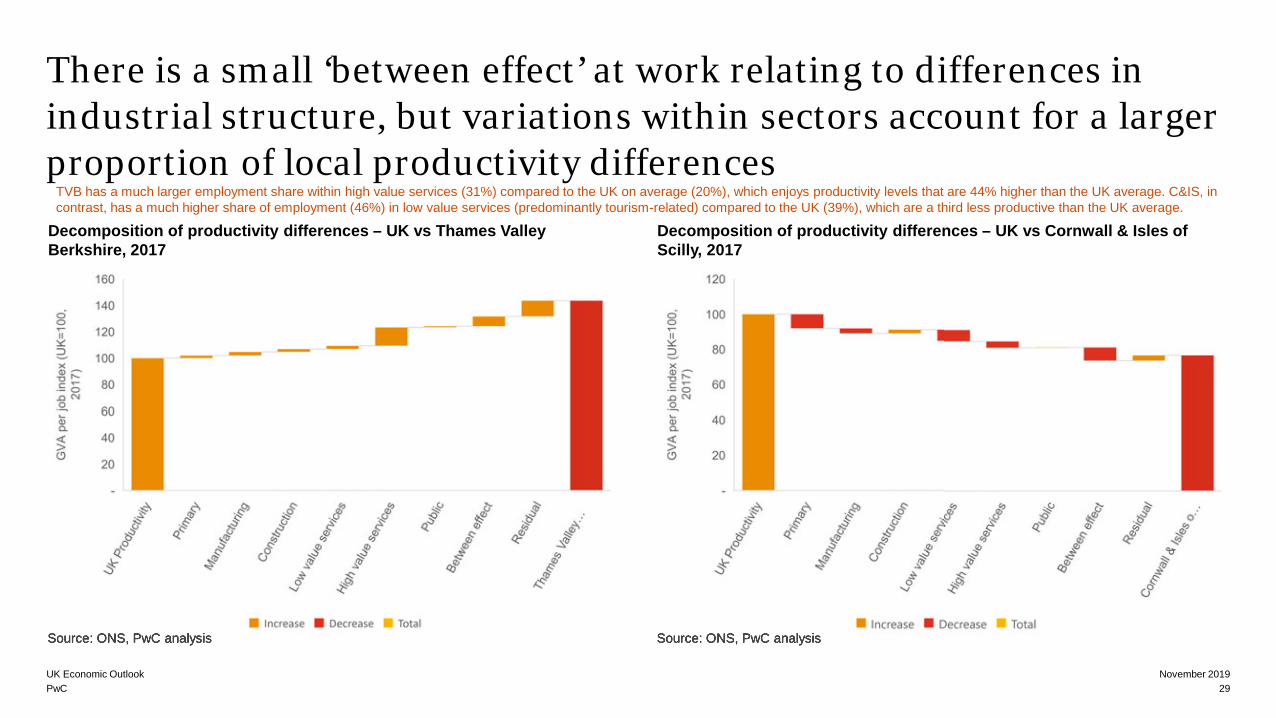
There is a small ‘between effect’ at work relating to differences in industrial structure, but variations within sectors account for a larger proportion of local productivity differences
November 2019UK Economic Outlook29
Decomposition of productivity differences – UK vs Thames Valley Berkshire, 2017
Source: ONS, PwC analysis Source: ONS, PwC analysis
Decomposition of productivity differences – UK vs Cornwall & Isles of Scilly, 2017
Source: ONS, PwC analysisSource: ONS, PwC analysis
TVB has a much larger employment share within high value services (31%) compared to the UK on average (20%), which enjoys productivity levels that are 44% higher than the UK average. C&IS, in contrast, has a much higher share of employment (46%) in low value services (predominantly tourism-related) compared to the UK (39%), which are a third less productive than the UK average.
PwC
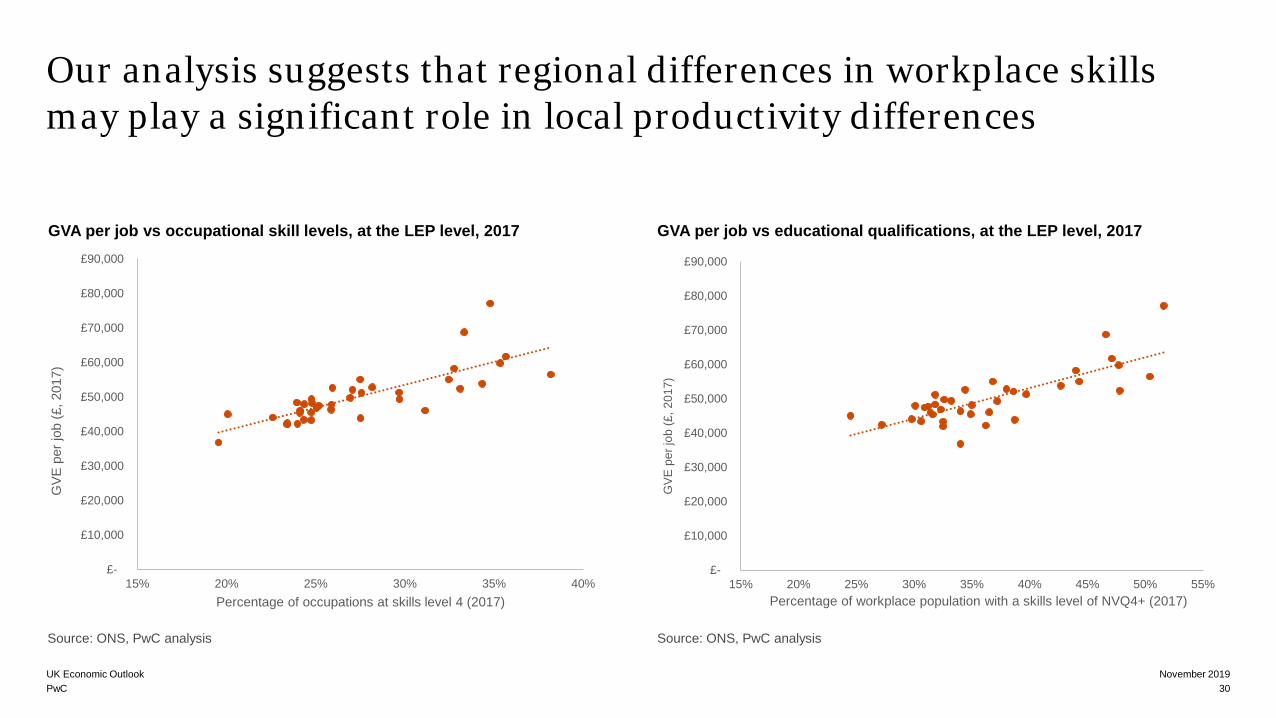
Our analysis suggests that regional differences in workplace skills may play a significant role in local productivity differences
November 2019UK Economic Outlook30
£-
£10,000
£20,000
£30,000
£40,000
£50,000
£60,000
£70,000
£80,000
£90,000
15% 20% 25% 30% 35% 40%
GVE
per
job
(£, 2
017)
Percentage of occupations at skills level 4 (2017)
£-
£10,000
£20,000
£30,000
£40,000
£50,000
£60,000
£70,000
£80,000
£90,000
15% 20% 25% 30% 35% 40% 45% 50% 55%
GVE
per
job
(£, 2
017)
Percentage of workplace population with a skills level of NVQ4+ (2017)
GVA per job vs occupational skill levels, at the LEP level, 2017 GVA per job vs educational qualifications, at the LEP level, 2017
Source: ONS, PwC analysis Source: ONS, PwC analysis
PwC
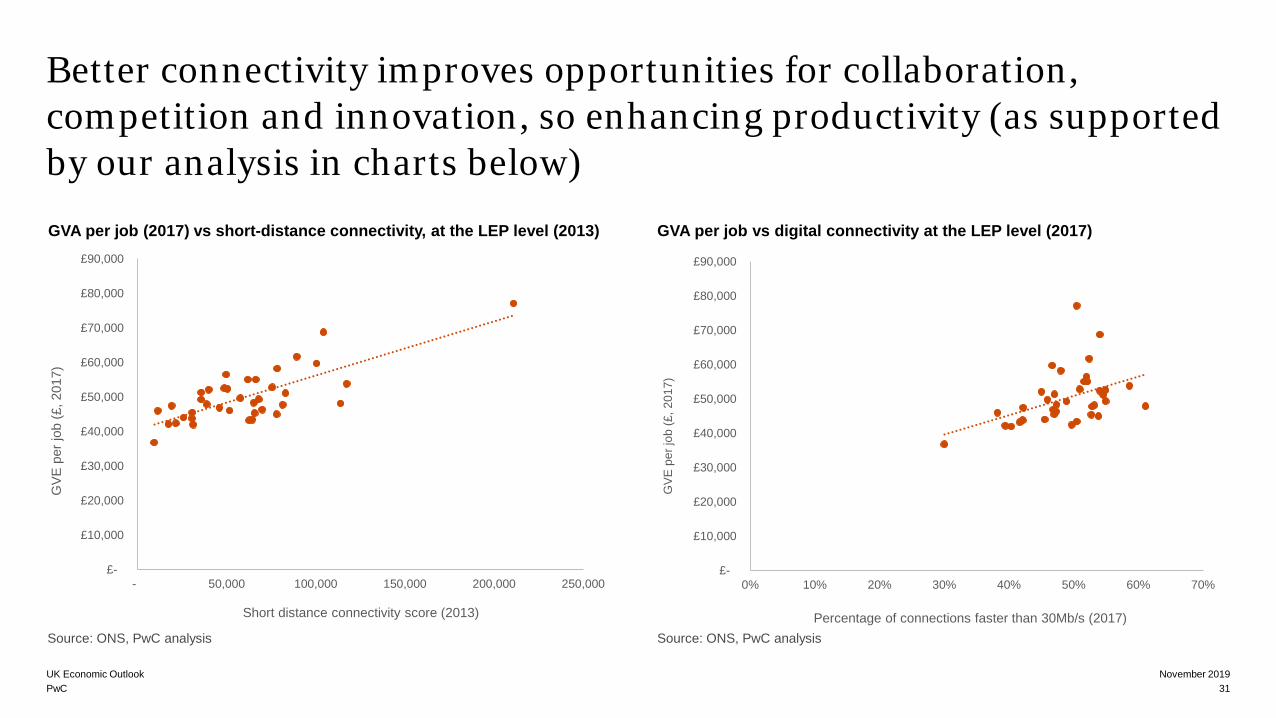
Better connectivity improves opportunities for collaboration, competition and innovation, so enhancing productivity (as supported by our analysis in charts below)
November 2019UK Economic Outlook31
£-
£10,000
£20,000
£30,000
£40,000
£50,000
£60,000
£70,000
£80,000
£90,000
- 50,000 100,000 150,000 200,000 250,000
GVE
per
job
(£, 2
017)
Short distance connectivity score (2013)
£-
£10,000
£20,000
£30,000
£40,000
£50,000
£60,000
£70,000
£80,000
£90,000
0% 10% 20% 30% 40% 50% 60% 70%
GVE
per
job
(£, 2
017)
Percentage of connections faster than 30Mb/s (2017)
GVA per job (2017) vs short-distance connectivity, at the LEP level (2013) GVA per job vs digital connectivity at the LEP level (2017)
Source: ONS, PwC analysis Source: ONS, PwC analysis
PwC
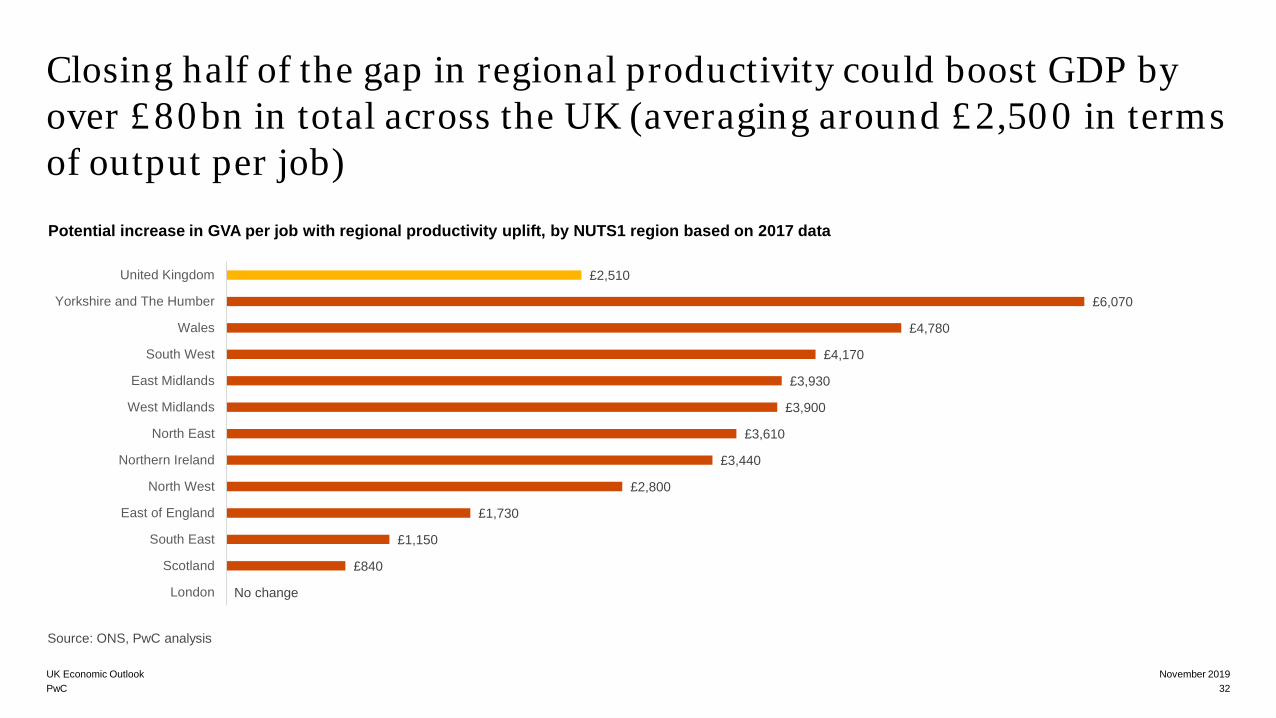
Closing half of the gap in regional productivity could boost GDP by over £80bn in total across the UK (averaging around £2,500 in terms of output per job)
November 2019UK Economic Outlook32
£2,510
£6,070
£4,780
£4,170
£3,930
£3,900
£3,610
£3,440
£2,800
£1,730
£1,150
£840
No change
United Kingdom
Yorkshire and The Humber
Wales
South West
East Midlands
West Midlands
North East
Northern Ireland
North West
East of England
South East
Scotland
London
Potential increase in GVA per job with regional productivity uplift, by NUTS1 region based on 2017 data
Source: ONS, PwC analysis
PwC
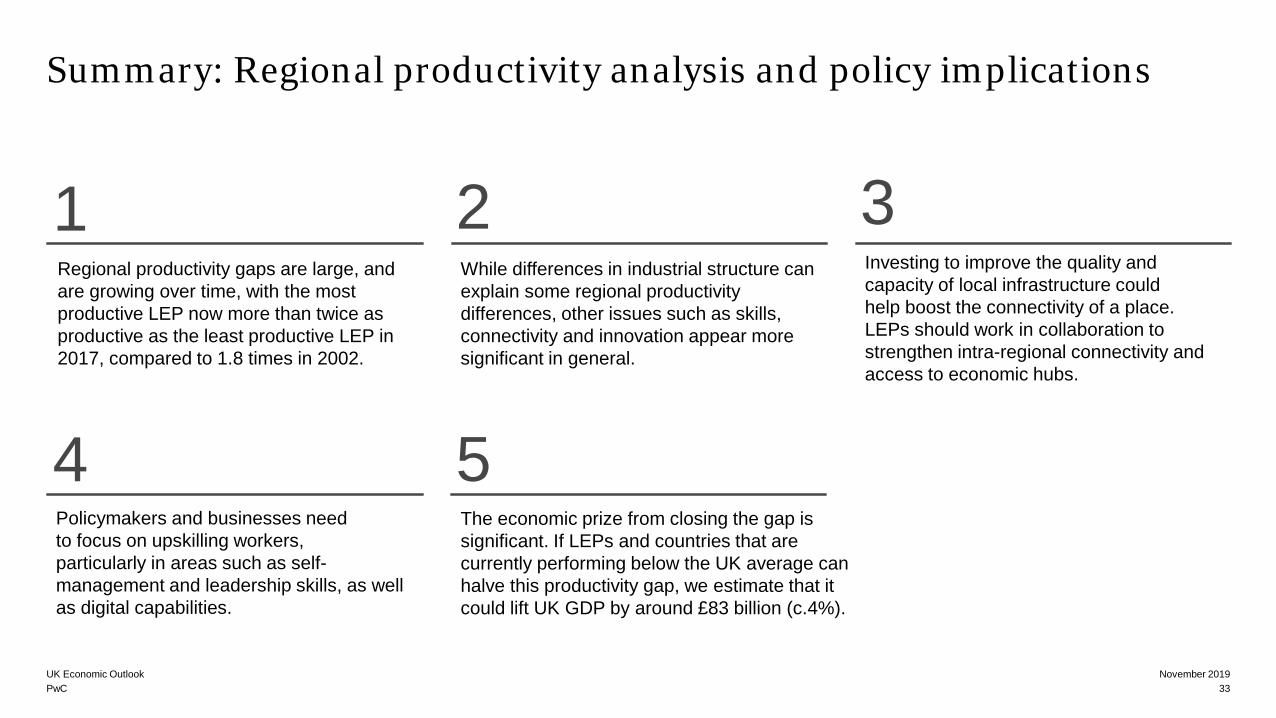
Summary: Regional productivity analysis and policy implications
November 2019UK Economic Outlook33
1Regional productivity gaps are large, and are growing over time, with the most productive LEP now more than twice as productive as the least productive LEP in 2017, compared to 1.8 times in 2002.
4
Investing to improve the quality andcapacity of local infrastructure couldhelp boost the connectivity of a place. LEPs should work in collaboration to strengthen intra-regional connectivity and access to economic hubs.
2While differences in industrial structure can explain some regional productivity differences, other issues such as skills, connectivity and innovation appear more significant in general.
5The economic prize from closing the gap is significant. If LEPs and countries that are currently performing below the UK average can halve this productivity gap, we estimate that it could lift UK GDP by around £83 billion (c.4%).
3
Policymakers and businesses needto focus on upskilling workers,particularly in areas such as self-management and leadership skills, as well as digital capabilities.
PwC
Contacts for more information about this report
John HawksworthChief [email protected]
Thanh DinhEconomistHoai.thanh.dinh @pwc.com
Alex TuckettSenior [email protected]
Natasha [email protected]
This content is for general information purposes only, and should not be used as a substitute for consultation with professional advisors.© 2019 PricewaterhouseCoopers LLP. All rights reserved. PwC refers to the UK member firm, and may sometimes refer to the PwC network. Each member firm is a separate legal entity. Please see www.pwc.com/structure for further details.
pwc.co.uk/economics
Jing TeowSenior Economistyong.jing.teow @pwc.com
For more information about our Economics services, or to access the full report, please see our website at:http://www.pwc.co.uk/economics http://www.pwc.co.uk/ukeo
34November 2019UK Economic Outlook