Making the Most of Analytical Data in Decision Making · recovery Claims IT Infrastructure »...
12
ENTERPRISE RISK SOLUTIONS Making the Most of Analytical Data in Decision Making In this paper, Brian Heale discusses the many ways in which insurers can use analytical data to support their strategic risk and capital decision-making processes and how this can be integrated with the Own Risk Solvency Assessment (ORSA) and Use Test processes. Introduction In a highly competitive market, characterized by an increasing drive for cost reductions and better returns, insurers need to have a high degree of confidence in the decisions they make. Indeed, informed business decisions are at the heart of the ORSA and Use Test processes and key to this is having access to reliable and intelligent analytical data to support the decision making process. In this paper we discuss the ways in which insurers can utilize and “view” their analytical and operational data in order to measure performance and identify emerging behavioral trends in support of their business decision-making methodologies. Decision-making in Insurance Although some insurers focus on their core functions and outsource others such as policy administration and investment management, the vast majority undertake the full range of activities as illustrated below. And while we recognize the importance of having accurate data attached to all functions within the organization, we confine the scope of this paper to exploring the information an insurer will need to source for use in strategic capital and risk planning, metrics and measurement. RESEARCH/ WHITEPAPER Author Brian Heale Senior Director, Business Developement Contact Us For further information please contact: [email protected] Alternatively, you may contact our customer service team: Americas +1.212.553.1653 Europe +44.20.7772.5454 Asia-Pacific +85.2.3551.3077 Japan +81.3.5408.4100
Transcript of Making the Most of Analytical Data in Decision Making · recovery Claims IT Infrastructure »...
EntErprisE risk solutions
Making the Most of Analytical Data in Decision Making
In this paper, Brian Heale discusses the many ways in which insurers can use analytical data to support their strategic risk and capital decision-making processes and how this can be integrated with the Own Risk Solvency Assessment (ORSA) and Use Test processes.
Introduction
In a highly competitive market, characterized by an increasing drive for cost reductions and better returns, insurers need to have a high degree of confidence in the decisions they make. Indeed, informed business decisions are at the heart of the ORSA and Use Test processes and key to this is having access to reliable and intelligent analytical data to support the decision making process. In this paper we discuss the ways in which insurers can utilize and “view” their analytical and operational data in order to measure performance and identify emerging behavioral trends in support of their business decision-making methodologies.
Decision-making in Insurance
Although some insurers focus on their core functions and outsource others such as policy administration and investment management, the vast majority undertake the full range of activities as illustrated below. And while we recognize the importance of having accurate data attached to all functions within the organization, we confine the scope of this paper to exploring the information an insurer will need to source for use in strategic capital and risk planning, metrics and measurement.
ReseaRch/WhitepapeR
Author
Brian Heale Senior Director, Business Developement
Contact Us
For further information please contact:[email protected]
Alternatively, you may contact our customer service team:
Americas +1.212.553.1653
Europe +44.20.7772.5454
Asia-Pacific +85.2.3551.3077
Japan +81.3.5408.4100
2 november 2013 making the most of analytical Data in Decision making
MOODY’S ANALYTICS
» Product Design » Profit Testing » Regulatory
Approval » Policy Terms » Documentation
Design Products
» Finance » Investment » Fund Management
Accounting &Investment
» Direct Sales » Brokers » Website » Affinity Groups » Banks » Resellers
Distribute Products
» Claims Underwriting » Claims Management » Claims Payment » Fraud » Reinsurance
recovery
Claims
IT Infrastructure
» Underwrite » Rate » Reinsure » Approve » Issue
New Business &Underwriting
» Strategic Planning » Legal & Compliance » Risk Management » Capital Management
& Solvency II » IFRS » RDR » Sarbanes Oxley
Risk/Regulatory/Compliance
» Premium Collection
» Policy Changes » Claims
Identification » Maturities » Queries
Administration
» Regulatory Reporting
» Management Reporting
» Shareholder Management
» Market Expectations (Rating Agencies)
Reporting
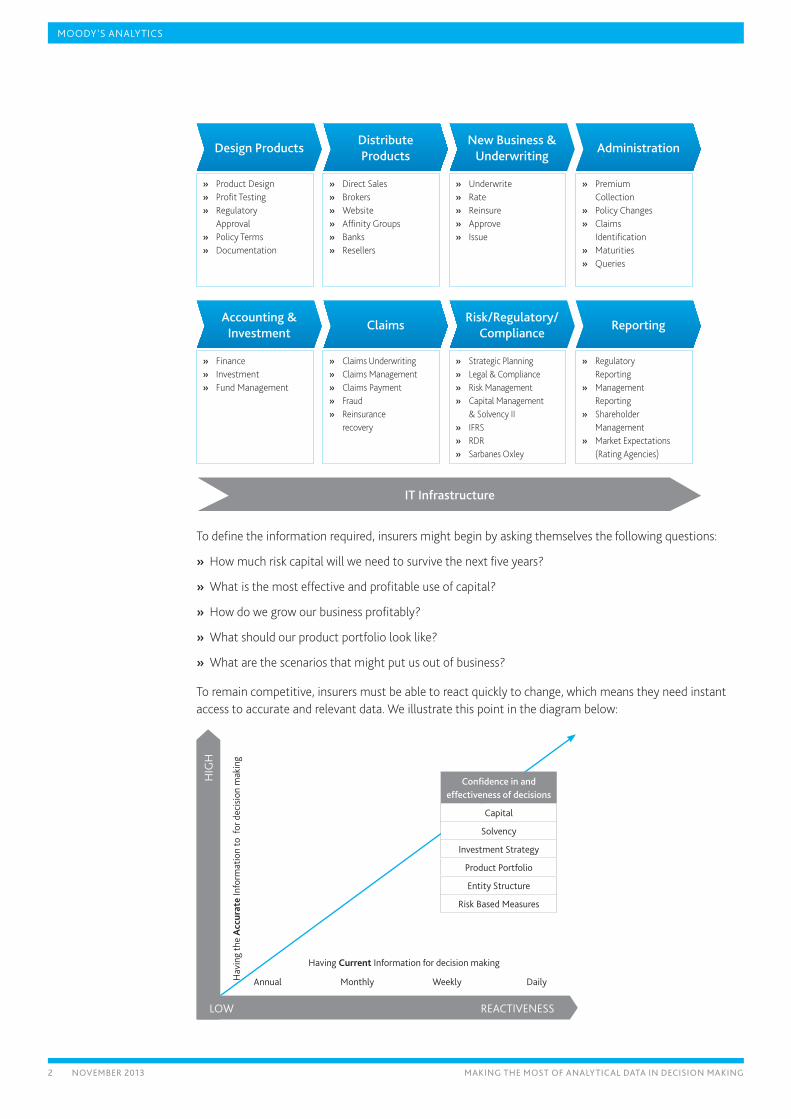
To define the information required, insurers might begin by asking themselves the following questions:
» How much risk capital will we need to survive the next five years?
» What is the most effective and profitable use of capital?
» How do we grow our business profitably?
» What should our product portfolio look like?
» What are the scenarios that might put us out of business?
To remain competitive, insurers must be able to react quickly to change, which means they need instant access to accurate and relevant data. We illustrate this point in the diagram below:
HIG
H
Hav
ing
the
acc
urat
e In
form
atio
n to
for
dec
isio
n m
akin
g
Having current Information for decision making
Annual Monthly Weekly Daily
LOW ReActIveneSS
Confidence in and effectiveness of decisions
capital
Solvency
Investment Strategy
Product Portfolio
entity Structure
Risk Based Measures
3 november 2013 making the most of analytical Data in Decision making
MOODY’S ANALYTICS
Increasing use of Artificial Intelligence and Neural Networks
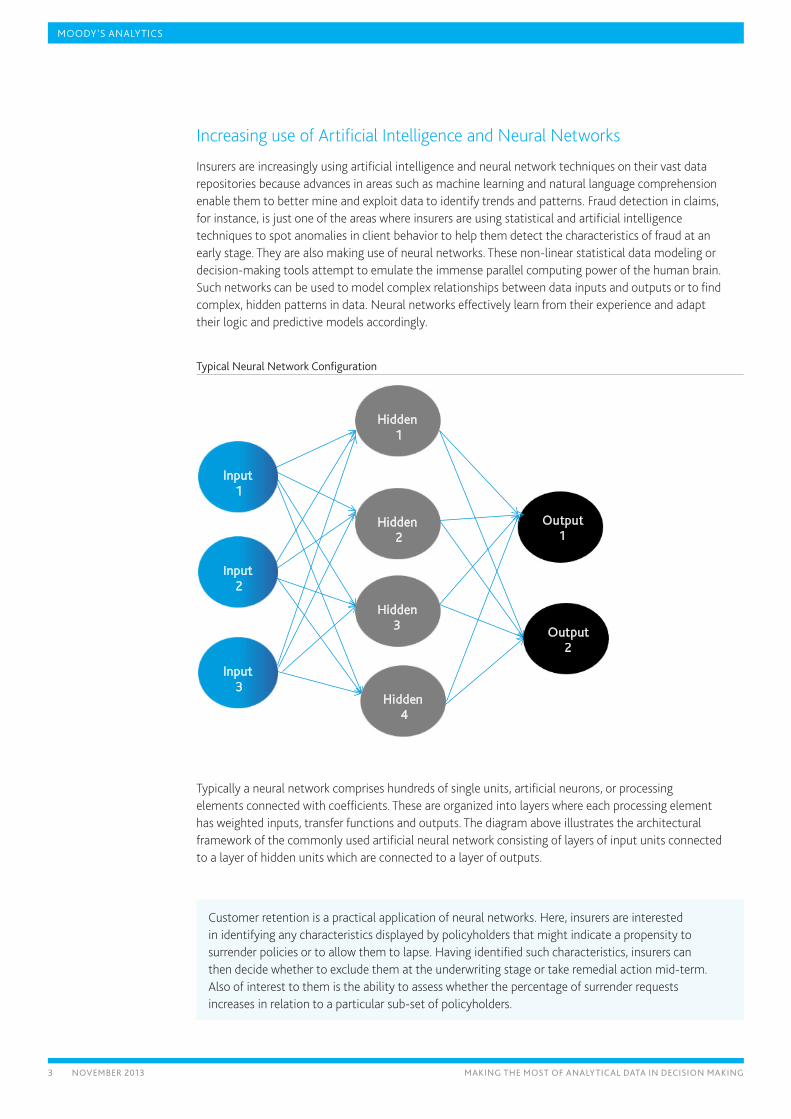
Insurers are increasingly using artificial intelligence and neural network techniques on their vast data repositories because advances in areas such as machine learning and natural language comprehension enable them to better mine and exploit data to identify trends and patterns. Fraud detection in claims, for instance, is just one of the areas where insurers are using statistical and artificial intelligence techniques to spot anomalies in client behavior to help them detect the characteristics of fraud at an early stage. They are also making use of neural networks. These non-linear statistical data modeling or decision-making tools attempt to emulate the immense parallel computing power of the human brain. Such networks can be used to model complex relationships between data inputs and outputs or to find complex, hidden patterns in data. Neural networks effectively learn from their experience and adapt their logic and predictive models accordingly.
typical neural network configuration
Hidden1
Output 1
Input1
Input2
Input3
Hidden2
Hidden3
Hidden4
Output 2
Typically a neural network comprises hundreds of single units, artificial neurons, or processing elements connected with coefficients. These are organized into layers where each processing element has weighted inputs, transfer functions and outputs. The diagram above illustrates the architectural framework of the commonly used artificial neural network consisting of layers of input units connected to a layer of hidden units which are connected to a layer of outputs.
Customer retention is a practical application of neural networks. Here, insurers are interested in identifying any characteristics displayed by policyholders that might indicate a propensity to surrender policies or to allow them to lapse. Having identified such characteristics, insurers can then decide whether to exclude them at the underwriting stage or take remedial action mid-term. Also of interest to them is the ability to assess whether the percentage of surrender requests increases in relation to a particular sub-set of policyholders.
4 november 2013 making the most of analytical Data in Decision making
MOODY’S ANALYTICS
Additionally, some insurers are using artificial intelligence/neural networks to:
» Develop insolvency prediction models.
» Predict car insurance losses using the information available to the underwriters when a policy is accepted.
» Underwrite policies where the insurer wants to identify what the propensity to claim is, or the likely level of a claim. This can be used as a model for the basis of accepting or rejecting a proposal.
» Balance pricing to match claims in a manner that retains good clients and attracts new clients.
Embedded Value versus Economic Capital
As a metric of performance, some insurers, particularly property and casualty (P&C) insurers, are turning away from embedded value reporting1. Partially driven by Solvency II, many insurers are now adopting Economic Capital as the most critical measure. The reasons for this are clear:
1. Economic capital enables an insurer to develop a range of consistent risk metrics across the entire business.
2. It provides a transparent view of risks across the business and allows for correlation between and across risks.
3. It enables the effective testing of business initiatives from a risk management perspective.
In order to be successful however, economic capital metrics need to be included into incentive plans for senior executives to ensure risk-based decision making is pursued as standard practice.
Economic capital, however, is not the only measure being used by insurers. In particular Risk-Adjusted Return on Capital (RAROC) is also viewed by many insurers as a key metric. This is because it enables insurers to connect financial performance to capital attribution in relation to risks assumed and value created.
RAROC consistently measures the performance of different business activities and can be utilized, for example in:
» Allocating capital to business units
» Scorecards which measure shareholder value
» Compensation plans for executives based on performance
» Evaluating potential acquisitions and sell-offs
» Accurate product pricing
The use of RAROC increases focus on risks versus return in the decision-making process. Consequently it stimulates the use of scarce capital in the most efficient way. Risk-adjusted pricing tools are also used as a basis for the pricing of certain transactions and as an important determinant in credit-approval procedures.
1 Market consistent embedded value (Mcev) is still widely used in the life sector.
...economic capital metrics need to be included into incentive plans for senior executives to ensure risk-based decision making is pursued as standard practice.
5 november 2013 making the most of analytical Data in Decision making
MOODY’S ANALYTICS
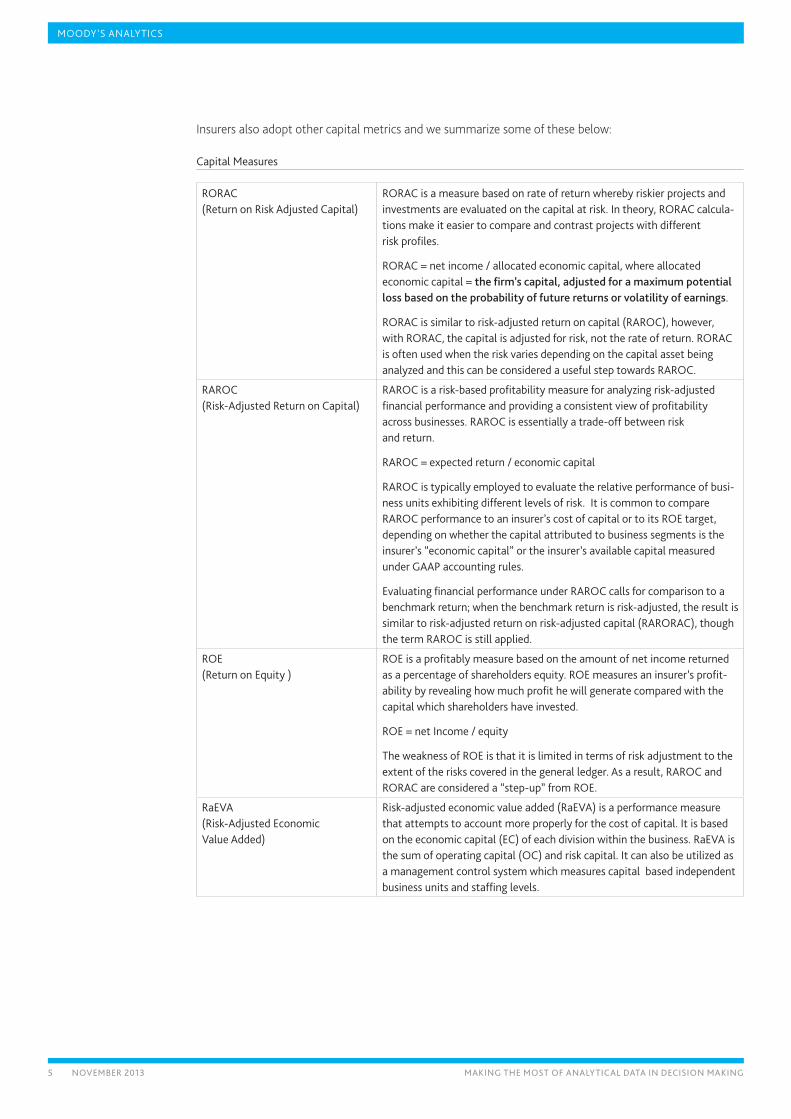
Insurers also adopt other capital metrics and we summarize some of these below:
capital Measures
RORAc (Return on Risk Adjusted capital)
RORAc is a measure based on rate of return whereby riskier projects and investments are evaluated on the capital at risk. In theory, RORAc calcula-tions make it easier to compare and contrast projects with different risk profiles.
RORAc = net income / allocated economic capital, where allocated economic capital = the firm’s capital, adjusted for a maximum potential loss based on the probability of future returns or volatility of earnings.
RORAc is similar to risk-adjusted return on capital (RAROc), however, with RORAc, the capital is adjusted for risk, not the rate of return. RORAc is often used when the risk varies depending on the capital asset being analyzed and this can be considered a useful step towards RAROc.
RAROc (Risk-Adjusted Return on capital)
RAROc is a risk-based profitability measure for analyzing risk-adjusted financial performance and providing a consistent view of profitability across businesses. RAROc is essentially a trade-off between risk and return.
RAROc = expected return / economic capital
RAROc is typically employed to evaluate the relative performance of busi-ness units exhibiting different levels of risk. It is common to compare RAROc performance to an insurer’s cost of capital or to its ROe target, depending on whether the capital attributed to business segments is the insurer’s “economic capital” or the insurer’s available capital measured under GAAP accounting rules.
evaluating financial performance under RAROc calls for comparison to a benchmark return; when the benchmark return is risk-adjusted, the result is similar to risk-adjusted return on risk-adjusted capital (RARORAc), though the term RAROc is still applied.
ROe (Return on equity )
ROe is a profitably measure based on the amount of net income returned as a percentage of shareholders equity. ROe measures an insurer’s profit-ability by revealing how much profit he will generate compared with the capital which shareholders have invested.
ROe = net Income / equity
the weakness of ROe is that it is limited in terms of risk adjustment to the extent of the risks covered in the general ledger. As a result, RAROc and RORAc are considered a “step-up” from ROe.
RaevA (Risk-Adjusted economic value Added)
Risk-adjusted economic value added (RaevA) is a performance measure that attempts to account more properly for the cost of capital. It is based on the economic capital (ec) of each division within the business. RaevA is the sum of operating capital (Oc) and risk capital. It can also be utilized as a management control system which measures capital based independent business units and staffing levels.
6 november 2013 making the most of analytical Data in Decision making
MOODY’S ANALYTICS
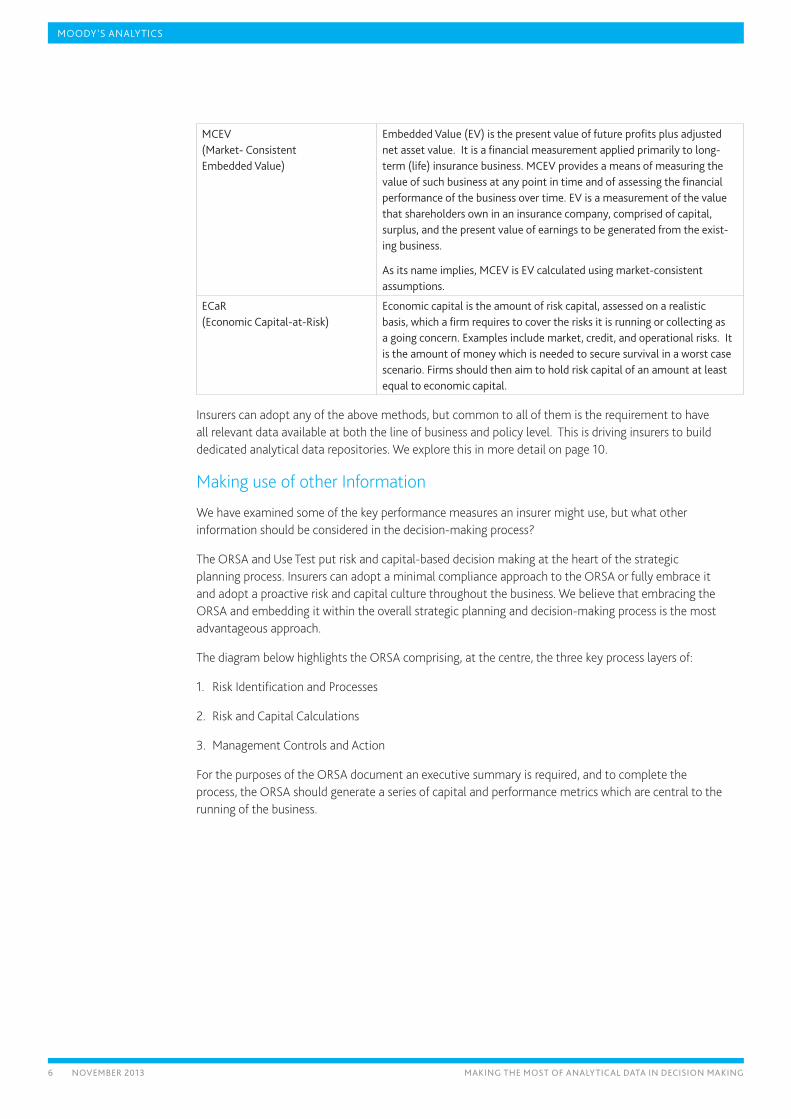
Mcev (Market- consistent embedded value)
embedded value (ev) is the present value of future profits plus adjusted net asset value. It is a financial measurement applied primarily to long-term (life) insurance business. Mcev provides a means of measuring the value of such business at any point in time and of assessing the financial performance of the business over time. ev is a measurement of the value that shareholders own in an insurance company, comprised of capital, surplus, and the present value of earnings to be generated from the exist-ing business.
As its name implies, Mcev is ev calculated using market-consistent assumptions.
ecaR (economic capital-at-Risk)
economic capital is the amount of risk capital, assessed on a realistic basis, which a firm requires to cover the risks it is running or collecting as a going concern. examples include market, credit, and operational risks. It is the amount of money which is needed to secure survival in a worst case scenario. Firms should then aim to hold risk capital of an amount at least equal to economic capital.
Insurers can adopt any of the above methods, but common to all of them is the requirement to have all relevant data available at both the line of business and policy level. This is driving insurers to build dedicated analytical data repositories. We explore this in more detail on page 10.
Making use of other Information
We have examined some of the key performance measures an insurer might use, but what other information should be considered in the decision-making process?
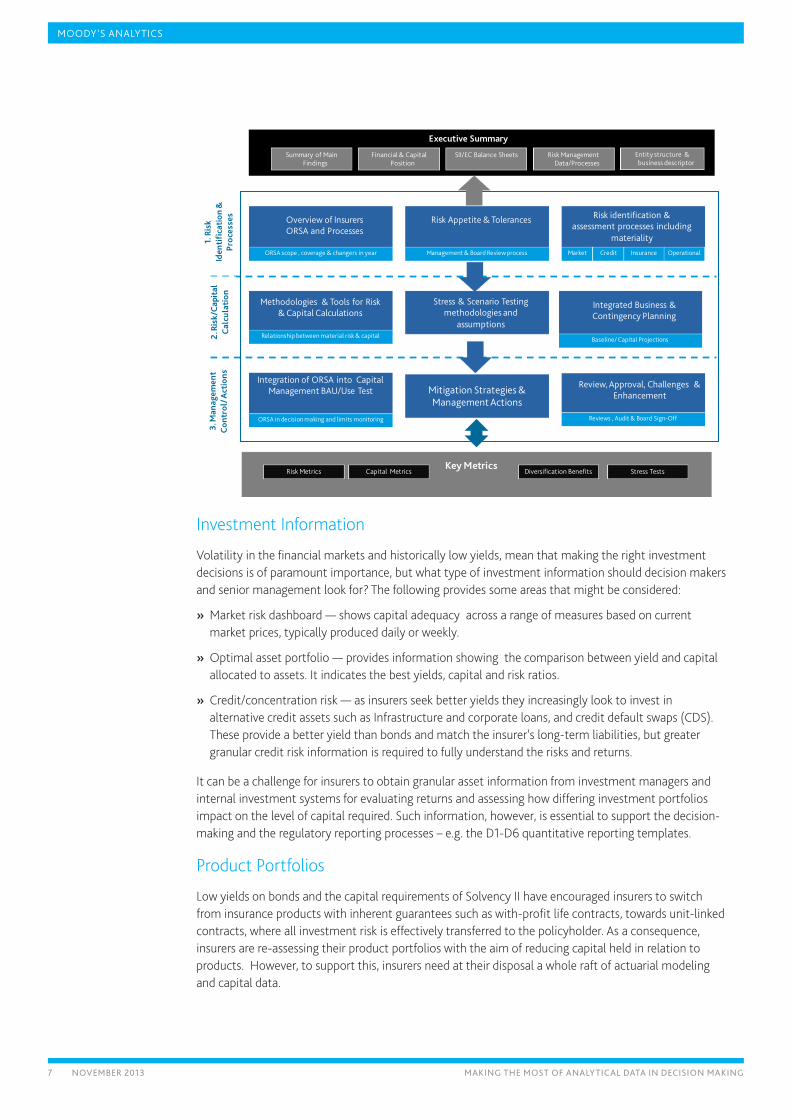
The ORSA and Use Test put risk and capital-based decision making at the heart of the strategic planning process. Insurers can adopt a minimal compliance approach to the ORSA or fully embrace it and adopt a proactive risk and capital culture throughout the business. We believe that embracing the ORSA and embedding it within the overall strategic planning and decision-making process is the most advantageous approach.
The diagram below highlights the ORSA comprising, at the centre, the three key process layers of:
1. Risk Identification and Processes
2. Risk and Capital Calculations
3. Management Controls and Action
For the purposes of the ORSA document an executive summary is required, and to complete the process, the ORSA should generate a series of capital and performance metrics which are central to the running of the business.
7 november 2013 making the most of analytical Data in Decision making
MOODY’S ANALYTICS
executive summary
Risk Management Data/Processes
Financial & capital Position
SII/ec Balance Sheets entity structure & business descriptor
Summary of Main Findings
Key Metrics Risk Metrics capital Metrics Diversification Benefits Stress tests
Methodologies & tools for Risk & capital calculations
Integrated Business & contingency Planning
Stress & Scenario testing methodologies and
assumptions
Baseline/ capital ProjectionsRelationship between material risk & capital
Overview of Insurers ORSA and Processes
Risk Appetite & tolerances Risk identification & assessment processes including
materiality Market credit Insurance OperationalORSA scope , coverage & changers in year Management & Board Review process
Integration of ORSA into capital Management BAU/Use test
Review, Approval, challenges & enhancement
ORSA in decision making and limits monitoring Reviews , Audit & Board Sign-Off
Mitigation & Management Actions
1. R
isk
iden
tifi
cati
on &
pr
oces
ses
2. R
isk/
cap
ital
c
alcu
lati
on
3. M
anag
emen
t c
ontr
ol/ a
ctio
ns
Mitigation Strategies & Management Actions
Investment Information
Volatility in the financial markets and historically low yields, mean that making the right investment decisions is of paramount importance, but what type of investment information should decision makers and senior management look for? The following provides some areas that might be considered:
» Market risk dashboard — shows capital adequacy across a range of measures based on current market prices, typically produced daily or weekly.
» Optimal asset portfolio — provides information showing the comparison between yield and capital allocated to assets. It indicates the best yields, capital and risk ratios.
» Credit/concentration risk — as insurers seek better yields they increasingly look to invest in alternative credit assets such as Infrastructure and corporate loans, and credit default swaps (CDS). These provide a better yield than bonds and match the insurer’s long-term liabilities, but greater granular credit risk information is required to fully understand the risks and returns.
It can be a challenge for insurers to obtain granular asset information from investment managers and internal investment systems for evaluating returns and assessing how differing investment portfolios impact on the level of capital required. Such information, however, is essential to support the decision-making and the regulatory reporting processes – e.g. the D1-D6 quantitative reporting templates.
Product Portfolios
Low yields on bonds and the capital requirements of Solvency II have encouraged insurers to switch from insurance products with inherent guarantees such as with-profit life contracts, towards unit-linked contracts, where all investment risk is effectively transferred to the policyholder. As a consequence, insurers are re-assessing their product portfolios with the aim of reducing capital held in relation to products. However, to support this, insurers need at their disposal a whole raft of actuarial modeling and capital data.
8 november 2013 making the most of analytical Data in Decision making
MOODY’S ANALYTICS
Legal Entity Structure and Diversification
Solvency II is also driving insurers to closely examine their legal entity structures and the impact that their structure has on capital. For instance, some multi-national insurers have re-structured their legal entities to different groupings or converted subsidiary companies into branches, whereas to obtain regulatory and capital advantages, others have sought to relocate the group geographically. Clearly tax and fungibility rules come into play, but there is a definite trend towards legal entity simplification, and for this to happen, analysis, granular finance, actuarial, asset and risk data at entity levels are required.
The advantages of seeking diversification benefit are widely endorsed, and this has led many insurers to carefully consider what businesses and books of business to acquire or divest. The traditional approach of just valuing books of business on an embedded value basis is now influenced by its impact on diversified capital
What-if Analysis
The interaction of investment portfolio, product portfolio, legal entity structure and the potential effect of diversification benefits is heightening interest in conducting what-if analysis. The scope of any what-if analysis might include:
» Economic capital/ solvency capital requirement projections under multiple scenarios
» Hedging strategy analysis
» Changes in product portfolio
» Strategic asset allocation
» Acquisitions and sales
» Changes in entity structures
» Interim balance sheet valuation
Each of the above analyses and the performance measures previously discussed require a high volume of analytical data. And, whilst the data is critical, many insurers will also have to review their actuarial models and develop new ones – e.g. for International Financial Reporting Standard (IFRS) figures. They will also need to look for new tools and techniques such as economic capital calculators and proxy modeling, particularly for large complex liability portfolios, where full stochastic modeling is required for internal model solvency capital calculations.
9 november 2013 making the most of analytical Data in Decision making
MOODY’S ANALYTICS
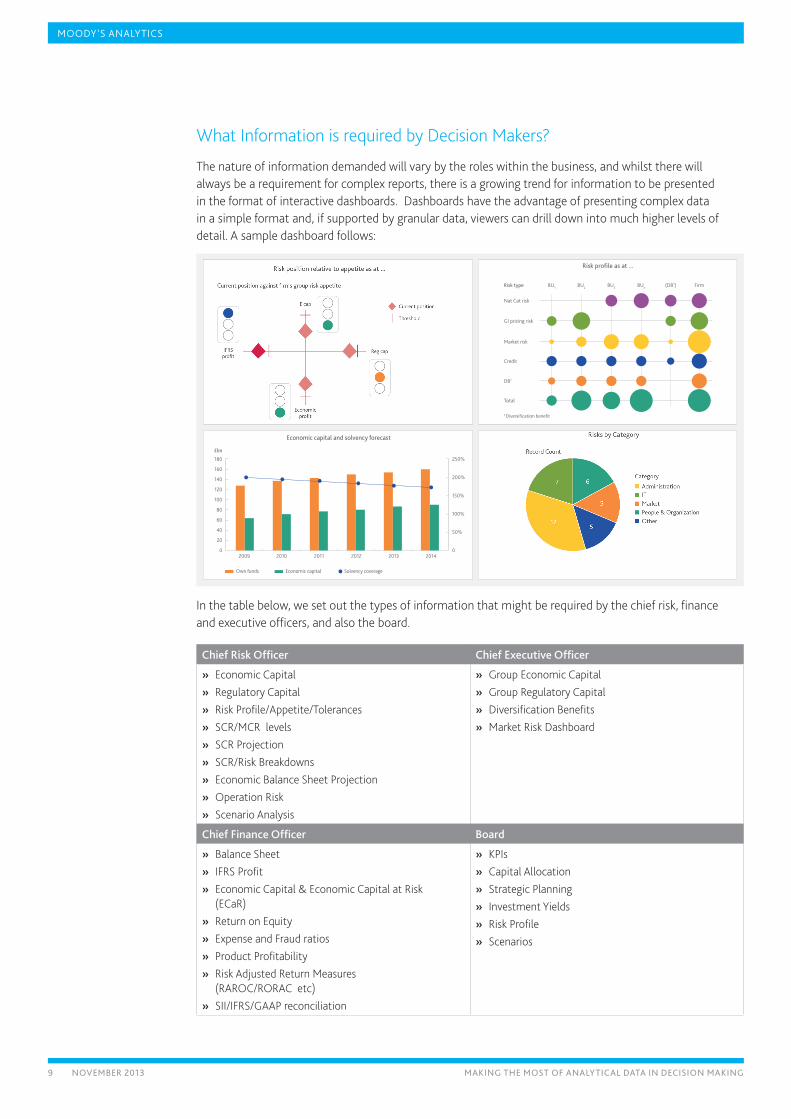
What Information is required by Decision Makers?
The nature of information demanded will vary by the roles within the business, and whilst there will always be a requirement for complex reports, there is a growing trend for information to be presented in the format of interactive dashboards. Dashboards have the advantage of presenting complex data in a simple format and, if supported by granular data, viewers can drill down into much higher levels of detail. A sample dashboard follows:
Risk type
Nat Cat risk
GI pricing risk
Market risk
Credit
DB1
Total
Risk profile as at ...
BU1 BU3 BUnBU2 (DB1) Firm
1 Diversification benefit
180 250%
200%
150%
100%
50%
0
140
160
120
100
60
40
20
0
Economic capital and solvency forecast
2009 2010 20122011
80
20142013
£bn
Own funds Economic capital Solvency coverage
In the table below, we set out the types of information that might be required by the chief risk, finance and executive officers, and also the board.
Chief Risk Officer Chief Executive Officer
» Economic Capital » Regulatory Capital » Risk Profile/Appetite/Tolerances » SCR/MCR levels » SCR Projection » SCR/Risk Breakdowns » Economic Balance Sheet Projection » Operation Risk » Scenario Analysis
» Group Economic Capital » Group Regulatory Capital » Diversification Benefits » Market Risk Dashboard
Chief Finance Officer Board
» Balance Sheet » IFRS Profit » Economic Capital & Economic Capital at Risk
(ECaR) » Return on Equity » Expense and Fraud ratios » Product Profitability » Risk Adjusted Return Measures
(RAROC/RORAC etc) » SII/IFRS/GAAP reconciliation
» KPIs » Capital Allocation » Strategic Planning » Investment Yields » Risk Profile » Scenarios
10 november 2013 making the most of analytical Data in Decision making
MOODY’S ANALYTICS
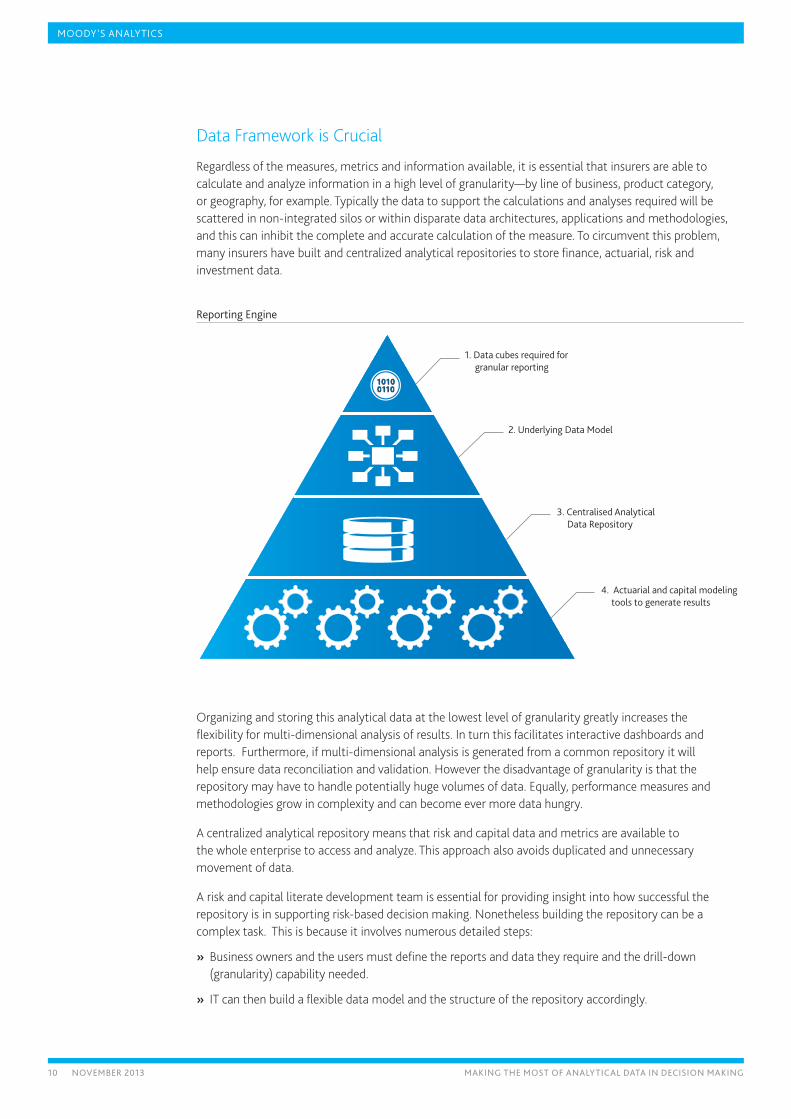
Data Framework is Crucial
Regardless of the measures, metrics and information available, it is essential that insurers are able to calculate and analyze information in a high level of granularity—by line of business, product category, or geography, for example. Typically the data to support the calculations and analyses required will be scattered in non-integrated silos or within disparate data architectures, applications and methodologies, and this can inhibit the complete and accurate calculation of the measure. To circumvent this problem, many insurers have built and centralized analytical repositories to store finance, actuarial, risk and investment data.
Reporting engine
1. Data cubes required for granular reporting
2. Underlying Data Model
3. Centralised Analytical Data Repository
4. Actuarial and capital modeling tools to generate results
Organizing and storing this analytical data at the lowest level of granularity greatly increases the flexibility for multi-dimensional analysis of results. In turn this facilitates interactive dashboards and reports. Furthermore, if multi-dimensional analysis is generated from a common repository it will help ensure data reconciliation and validation. However the disadvantage of granularity is that the repository may have to handle potentially huge volumes of data. Equally, performance measures and methodologies grow in complexity and can become ever more data hungry.
A centralized analytical repository means that risk and capital data and metrics are available to the whole enterprise to access and analyze. This approach also avoids duplicated and unnecessary movement of data.
A risk and capital literate development team is essential for providing insight into how successful the repository is in supporting risk-based decision making. Nonetheless building the repository can be a complex task. This is because it involves numerous detailed steps:
» Business owners and the users must define the reports and data they require and the drill-down (granularity) capability needed.
» IT can then build a flexible data model and the structure of the repository accordingly.
11 november 2013 making the most of analytical Data in Decision making
MOODY’S ANALYTICS
» IT will have to build the data integration and transformation processes required to load the data into the repository.
» Finally IT will have to construct the online analytical processing (OLAP) cubes necessary to support the generation of reports and dashboards specified by the business.
The Importance of Management Actions
Generating correct and meaningful reports and dashboards is undoubtedly an important part of the decision-making process, but so too is the willingness of management to take action on the basis of the information provided. In some situations management actions can be pre-built into certain scenarios, so that in the event of the scenario materializing, a series of pre-planned actions are triggered. In other circumstances actions will have to be much more reactive.
One example of where pre-determined actions might be triggered is where the stress testing shows that there are scenarios where the solvency ratio falls below desired levels. To cover such an eventuality, plausible management actions such as hedging risk to reduce market risk exposure, transferring risk via reinsurance, reviewing product mix and potentially exiting specific products or lines of business, or of raising new capital in extreme cases, could be developed. Any such plans would need to be documented and regularly reviewed and approved by the board.
Whilst there will always be a focus on strategic management actions, insurers should also consider more tactical information. For example, if there is an increase in the number of quotes for surrender values, the insurer should set in motion actions to try to avoid a series of actual surrenders. This can only happen if the insurer is storing all the relevant data and conducting the relevant pattern and trends analyses.
Conclusion
The quest by insurers for better informed decision-making processes and resources is increasing for both strategic and tactical reasons. In order to achieve this goal, there must be a good risk culture and system of governance in place which supports the ORSA, decision making and action taking. The board must have a holistic view of risk and capital within the business and this means that they have to be provided with a stream of precise and accessible information.
Actuarial and capital modeling engines are a prerequisite for producing the capital and risk metrics and measures. Supporting complex what-if analysis may require new techniques such as proxy functions due to limitations of current technologies. Finally there has to be an ERM technology platform to provide the analytic data, workflow and data management, quality and validation tools that underpin the whole process.
12 november 2013 making the most of analytical Data in Decision making
MOODY’S ANALYTICS
© 2013 Moody’s Analytics, Inc. and/or its licensors and affiliates (collectively, “MOODY’S”). All rights reserved. ALL INFORMATION CONTAINED HEREIN IS PROTECTED BY LAW, INCLUDING BUT NOT LIMITED TO, COPYRIGHT LAW, AND NONE OF SUCH INFORMATION MAY BE COPIED OR OTHERWISE REPRODUCED, REPACKAGED, FURTHER TRANSMITTED, TRANSFERRED, DISSEMINATED, REDISTRIBUTED OR RESOLD, OR STORED FOR SUBSEQUENT USE FOR ANY SUCH PURPOSE, IN WHOLE OR IN PART, IN ANY FORM OR MANNER OR BY ANY MEANS WHATSOEVER, BY ANY PERSON WITHOUT MOODY’S PRIOR WRITTEN CONSENT. All information contained herein is obtained by MOODY’S from sources believed by it to be accurate and reliable. Because of the possibility of human or mechanical error as well as other factors, however, all information contained herein is provided “AS IS” without warranty of any kind. Under no circumstances shall MOODY’S have any liability to any person or en-tity for (a) any loss or damage in whole or in part caused by, resulting from, or relating to, any error (negligent or otherwise) or other circumstance or contingency within or outside the control of MOODY’S or any of its directors, officers, employees or agents in connection with the procurement, collection, compilation, analysis, interpreta-tion, communication, publication or delivery of any such information, or (b) any direct, indirect, special, consequential, compensatory or incidental damages whatsoever (including without limitation, lost profits), even if MOODY’S is advised in advance of the possibility of such damages, resulting from the use of or inability to use, any such information. The ratings, financial reporting analysis, projections, and other observations, if any, constituting part of the information contained herein are, and must be construed solely as, statements of opinion and not statements of fact or recommendations to purchase, sell or hold any securities. NO WARRANTY, EXPRESS OR IMPLIED, AS TO THE ACCURACY, TIMELINESS, COMPLETENESS, MERCHANTABILITY OR FITNESS FOR ANY PARTICULAR PURPOSE OF ANY SUCH RATING OR OTHER OPINION OR INFORMATION IS GIVEN OR MADE BY MOODY’S IN ANY FORM OR MANNER WHATSOEVER. Each rating or other opinion must be weighed solely as one factor in any investment decision made by or on behalf of any user of the information contained herein, and each such user must accordingly make its own study and evaluation of each security and of each issuer and guarantor of, and each provider of credit support for, each security that it may consider purchasing, holding, or selling.
SP26172
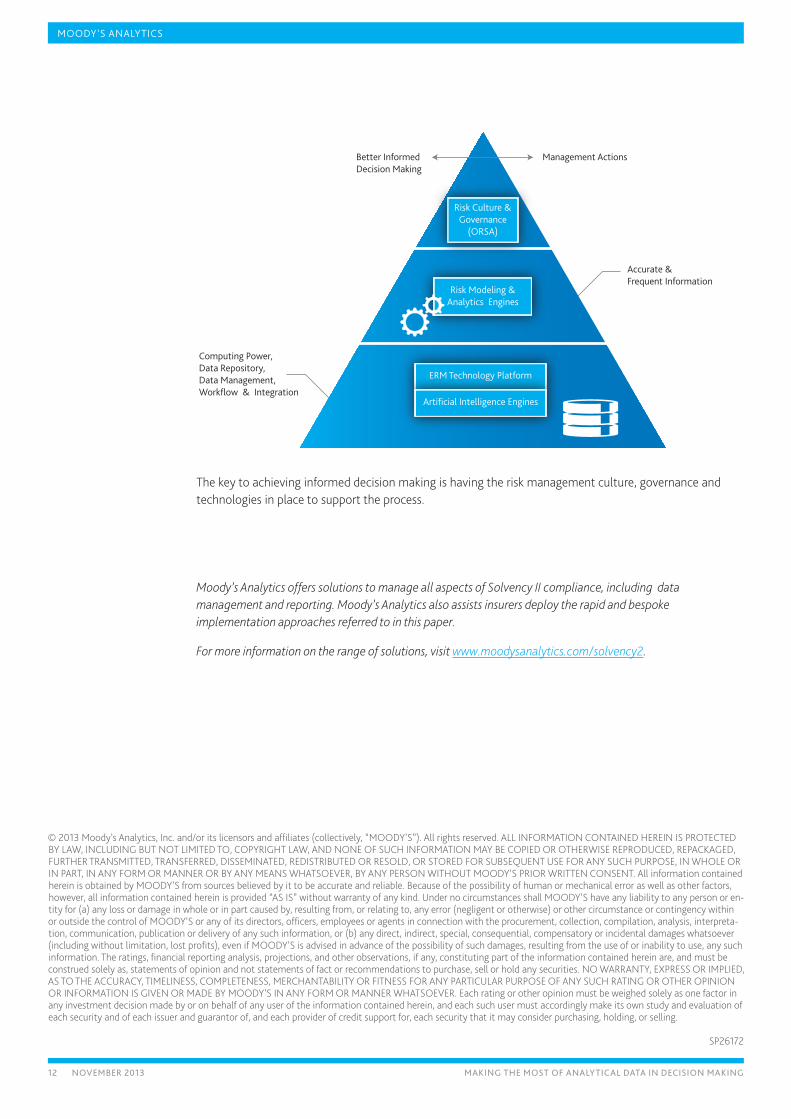
Accurate & Frequent Information
Management ActionsBetter Informed Decision Making
Computing Power, Data Repository, Data Management, Workflow & Integration
Risk Modeling & Analytics Engines
Risk Culture & Governance
(ORSA)
ERM Technology Platform
Artificial Intelligence Engines
The key to achieving informed decision making is having the risk management culture, governance and technologies in place to support the process.
Moody’s Analytics offers solutions to manage all aspects of Solvency II compliance, including data management and reporting. Moody’s Analytics also assists insurers deploy the rapid and bespoke implementation approaches referred to in this paper.
For more information on the range of solutions, visit www.moodysanalytics.com/solvency2.