Fortum investor presentation July...
53
FORTUM – For a cleaner world Investor / Analyst material July 2017
-
Upload
truongcong -
Category
Documents
-
view
218 -
download
0
Transcript of Fortum investor presentation July...

FORTUM – For a cleaner world
Investor / Analyst material
July 2017

Disclaimer
This presentation does not constitute an invitation to underwrite, subscribe
for, or otherwise acquire or dispose of any Fortum shares.
Past performance is no guide to future performance, and persons needing
advice should consult an independent financial adviser.
Any references to the future represent the management’s current best
understanding. However the final outcome may differ from them.
2
Fortum today pages 4 – 17
European and Nordic power markets pages 18 – 27
Fortum’s nuclear fleet pages 28 – 31
Russia pages 32 – 34
Power capacity split in Russia page 34
Historical achieved prices page 35
Half-Year Financial Report Jan-Jun ’17 pages 36 – 52
IR contacts pages 53
Content
3

Appr. 135,000 shareholders
• Power and heat company in the Nordic countries, Russia, Poland and the Baltics
• Listed at the Helsinki Stock Exchange since 1998
• Among the most traded shares on the Nasdaq Helsinki stock exchange
• Market cap ~13 billion euros
4
30 June 2017
Foreign investors 27.9%
Finnish State 50.8%
Other Finnish investors 8.2%
Finnish households 11.4%
Financial and insurance institutions 1.8%

Capital returns: 2016 EUR 1.10 per share ~ EUR 1 billion
• Fortum’s dividend policy is based on the following preconditions:
– The dividend policy ensures that shareholders receive a fair remuneration for their entrusted capital, supported by the
company’s long-term strategy that aims at increasing earnings per share and thereby the dividend.
– When proposing the dividend, the Board of Directors looks at a range of factors, including the macro environment,
balance sheet strength as well as future investment plans.
5
Fortum's target is to pay a stable,
sustainable and over time increasing
dividend of 50-80% of earnings per share
excluding one-off items
Fortum has since 1998 annually paid dividends
in total ~13,603 MEUR2012
63%
2013
81%2014
37%
2015
24%
1.01.1 1.1 1.1
1.3
5 year dividend per share (EUR) history
1.1
2016
196%
0.2

Fortum – For a cleaner world
6

Our strategic route
7
Birka Energi
50% → 100%
Gullspång
Neste
Divestment of
non-strategic
heat business
Skandinaviska
Elverk
Länsivoima
45% → 65%
Birka Energi
50% Fortum
50% StockholmGullspång merged
with Stockholm Energi
Divestment of
Fingrid shares
Divestment of
heat operations
outside of
Stockholm
Divestment
of Lenenergo shares
1996
IVO Fortum
Divestment of
small scale
hydro
2012
TGC-10
2008
1997
Lenenergo
shares →
Stora Kraft
Länsivoima
→100%
2000
Elnova
50% → 100%
Østfold
Shares in
Lenenergo
Shares in
Hafslund
District heating
in Poland →
2003
Oil business
spin-off
TGC-1
established
2005
2011
1998 2002 2006
E.ON
Finland
2015
Divestment of
electricity
distribution
businessDivestment of electricity
distribution and heat
businesses
Divestment of electricity
distribution business
Divestment of
Grangemouth power plant
2014
Divestment
of Gasum
shares
Nordkraft
wind power
DUON
Ekokem
2016
Turebergs
Recycling
2017
Restructuring
ownership in
Hafslund
(pending)
2007
Russian wind
power JV

Our current geographical presence
8
OAO Fortum
Power generation 25.5 TWh
Heat sales 20.7 TWh
Russia
Nordic countries
Power generation 46.2 TWh
Heat sales 3.7 TWh
Electricity customers 1.3 million
Power
generation
Electricity
sales
Heat
PolandPower generation 0.6 TWh
Heat sales 3.6 TWh
Baltic countriesPower generation 0.7 TWh
Heat sales 1.3 TWh
IndiaPower generation 29 GWh
Key figures 2016Sales EUR 3.6 bn
Comparable operating profit EUR 0.6 bn
Balance sheet EUR 22 bn
Personnel 8,100
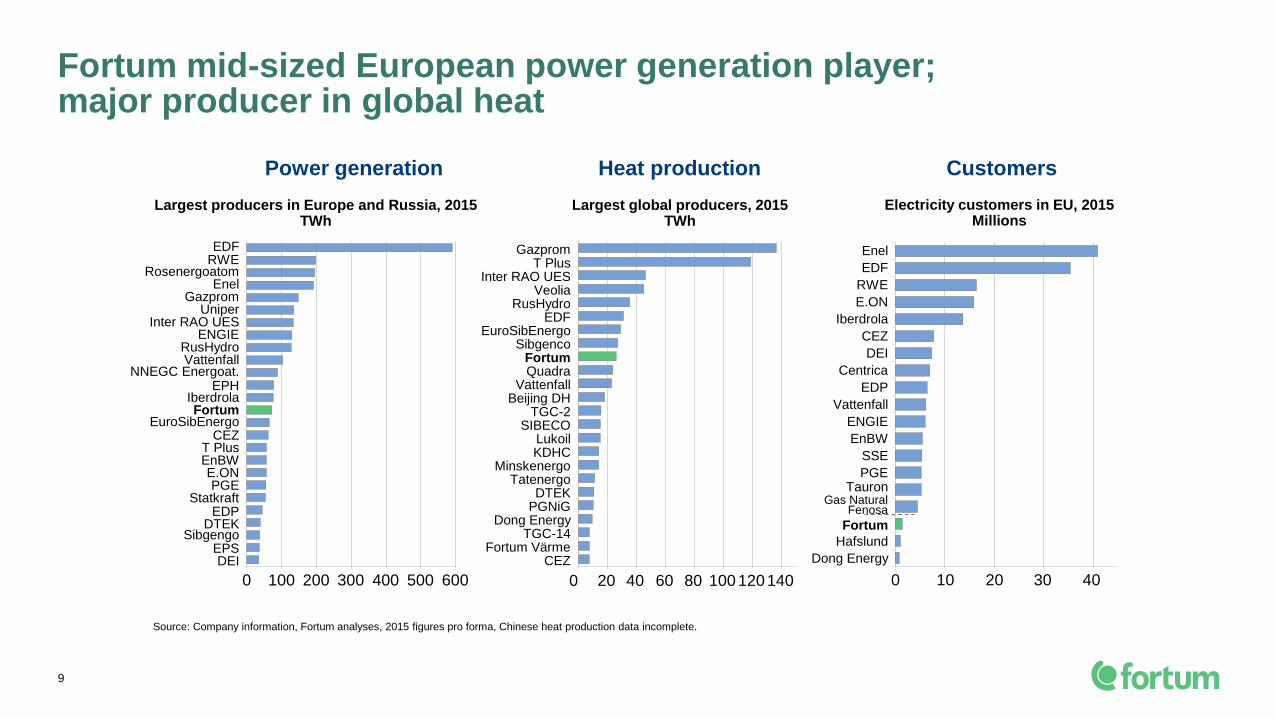
Fortum mid-sized European power generation player; major producer in global heat
9
Source: Company information, Fortum analyses, 2015 figures pro forma, Chinese heat production data incomplete.
Largest global producers, 2015 TWh
Largest producers in Europe and Russia, 2015TWh
Power generation Heat production
Electricity customers in EU, 2015Millions
Customers
TGC-2
KDHC
Quadra
TatenergoMinskenergo
DTEK
EuroSibEnergo
Fortum
Dong EnergyTGC-14
Lukoil
0 20 40 60 80 100 120140
Sibgenco
T Plus
Vattenfall
PGNiG
Inter RAO UES
EDFRusHydro
Veolia
Gazprom
Fortum Värme
Beijing DH
SIBECO
CEZ
EnBW
Rosenergoatom
Uniper
DEI
EuroSibEnergo
IberdrolaFortum
Inter RAO UES
CEZ
Enel
T Plus
Sibgengo
PGE
Gazprom
NNEGC Energoat.
RWEEDF
0 100 200 300 400 500 600
RusHydro
Statkraft
ENGIE
Vattenfall
EPS
EDPDTEK
E.ON
EPH
Gas NaturalFenosa
PGE
ENGIE
E.ON
DEI
CEZ
Enel
Centrica
EDP
Iberdrola
SSE
EnBW
Fortum
EDF
RWE
Tauron
Hafslund
Dong Energy
0 20 4010 30
Vattenfall

Biggest nuclear and hydro generators in Europe and Russia
101) Formerly GDF SUEZ
Source: Company information, Fortum analyses, 2013 figures pro forma
0
50
100
150
200
250
300
350
400
450
500
550
600
ED
F
Rosenerg
oato
m
RusH
ydro
NN
EG
C E
nerg
oato
m
Enel
E.O
N
Vatt
enfa
ll
Euro
Sib
Energ
o
EN
GIE
Sta
tkra
ft
Fort
um
Ibe
rdro
la
RW
E
CE
Z
EnB
W
Axpo
Verb
und
ED
P
Hid
roele
ctr
ica
Ukrh
ydro
energ
o
Centr
ica
Gazpro
m
Alp
iq
EP
S, S
erb
ia
Nors
k H
ydro
E-C
O E
nerg
i
Gas N
atu
ral F
enosa
Agder
Energ
i
BK
K
Lyse
Ene
rgi
DE
I
SS
E
Inte
r R
AO
UE
S
PG
E
DT
EK
IES
Other
Nuclear
Hydro
TWh
Total generation
1)

Fortum in the Nordic electricity value chain
11
Power generation
Nordic wholesale market
Power exchange and
bilateral agreements
Large customers
Retail customers
Private customers,small businesses

Fortum's power and heat production by source
12
Total production 27.8 TWh
(Production capacity 13,738 MW)
Fortum's heat production
in 2016
Waste 3%
Heat pumps, electricity 1%
Biomass 7%
Natural gas
71%
Coal 17%
Peat 1%
Nuclear power
33%
Natural gas 33%
Coal 4%Biomass 1%
Total generation 73.1 TWh
(Generation capacity 13,334 MW)
Hydro power 28%
Fortum's power generation
in 2016
Others 1%

Fortum's European power and heat production
13
Nuclear power
51%
Coal 3%
Hydro power 44%
Biomass 1%
European generation 47.5 TWh
(Generation capacity 8,837 MW)
Fortum's European
power generation in 2016
Other 1% Biomass
27%
Fortum's European
heat production in 2016
Peat 5%
Waste 12% Natural gas 12%
Heat pumps, electricity 4%
Coal 39%
European production 7.1 TWh
(Production capacity 3,818 MW)
Others 1%

Fortum’s Nordic, Baltic and Polish generation capacity
14
376
4 652
Other thermal
Hydro
Nuclear
CHP
3 011
Wind 38
Nordic, Baltic and Polish
generation capacity 8 837
760
Generation capacity MW MWFinland
Hydro 1 535
Nuclear 1 472
CHP 456
Other thermal 376
3 839Generation capacity
in Finland
MWBaltics and Poland
Generation capacity, CHP
26in Latvia
18in Lithuania
49in Estonia
186in Poland
Figures 31 December 2016
Associated companies’ plants
(not included in the MWs)
Fortum Värme, Stockholm; TSE, Naantali
*Fortum acquired the 32 MW Nygårdsfjellet
wind farm in Norway in January 2017
(not included in the total 2016 MW figures)
NO2
NO5 NO1
NO3
NO4 SE1
SE2
SE4
EE
LV
LT
PL
FI
SE3
DK1
DK2
Generation capacity, wind
in Norway 32*
Norway, NO4 MW
MW
38
9
Price areas
SE2
Hydro 1 550
Wind
SE3
Hydro 1 567
Nuclear 1 539
Sweden
4 703
Generation capacity
in Sweden
CHP
16
Generation capacity, CHP
in Denmark
Denmark, DK2 MW

We engage our customers and society to drive the change towards a cleaner
world. Our role is to accelerate this change by reshaping the energy system,
improving resource efficiency and providing smart solutions. This way we
deliver excellent shareholder value.
Fortum is listed in several sustainability indexes:
• CDP Nordic rating
• STOXX® Global ESG Leaders indices
• ECPI® Indices
• oekom
• OMX GES Sustainability Finland index
• Euronext Vigeo Eurozone 120 index
Fortum a forerunner in sustainability
15

0
200
400
600
800
1 000
DE
I
RW
E
Dra
x
SS
E
CE
Z
E.O
N
Vattenfa
ll
ED
P
Enel
Edip
ow
er
EnB
W
Gas N
atu
ral F
enosa
EN
GIE
Do
ng
Ene
rgy
Iberd
rola
Fort
um
tota
l
PV
O
ED
F
Verb
und
Fort
um
EU
Sta
tkra
ft
21
g CO2/kWh electricity, 2015
2016
62% of Fortum's total power generation CO2-free
96% of Fortum’s power generation in the EU CO2-free
Average 311 g/kWh
166
Fortum's carbon exposure among the lowest in Europe
16
Note:
Only European generation except “Fortum total“ which includes Russia. In 2016 most of E.ON’s generation was transferred to Uniper.
Fortum’s specific emissions of the power generation in 2016 in the EU were 28 g/kWh and in total 173 g/kWh.
Source: PWC, November 2016, Climate Change and Electricity, Fortum

Fortum’s renewables investment is already ramping up
Hydro, MW Power Year
Maintenance/upgrade ~10 Annually
Wind, MW Power Year
Uljanovsk, Russia 35 Q1 2018
Solberg, Sweden 75 Q4 2017
Ånstadblåheia, Norway 50 2018
Sørfjord, Norway 90 2019
Solar, India, MW Power Year
Bhadla, Rajasthan 70 Q1 2017
Pavagada, Karnataka 100 Q3 2017
Bio, MW Power Heat Year
Zabrze, Poland, wast/coal CHP 75 145 2018
Associated companies,
MWPower Heat Year
Naantali, Finland, bio-CHP
(49.5% share)142 244 2017
Kaunas, Lithuania, waste-CHP
(49% share)24 ~70 2020
17
Total: ~ 580 MW power and ~ 300 MW heat capacity (Fortum’s share)

• Market coupling between NL, BE and FR since 2006
• Germany – Nord Pool coupling started 11/2009
• Market coupling for Central Western Europe (DE, FR, NL, BE) since 11/2010 with a
continued coupling with Nord Pool. NorNed (NO-NL) and BritNed (UK-NL) included in
2011
• Nord Pool price area for Estonia in 2010, Lithuania in 2012 and Latvia in 2013. Poland
coupled with Nord Pool since 2010
• Czech, Slovakia and Hungary coupled together since 2012. Romania joined in 2014
• A common day-ahead market coupling for the whole north-western Europe (incl. Spain
& Portugal) was started in 2014. Italy and Slovenia joined in 2015
• Flow-based cross-border capacity allocation for further trade optimisation taken into use
in May 2015 for the CWE region. Nordic flow-based implementation planned by 2020
• CEE (Central Eastern Europe) market coupling region due to join latest in 2019 with
flow-based capacity allocation. Switzerland waiting for agreement with the EU
• In addition to day-ahead coupling, European-wide intraday market coupling is due to be
implemented in 2018
• Balancing market integration under development as well, based on both regional
projects and the EU Guideline on Electricity Balancing, approved in comitology 3/2017
Market coupling milestones- Cross-border power flows optimised by power exchanges
2009
2015
2012-2014
2010-
2013
2018-2019
2014
18

Current transmission capacity from Nordic area is over 6,000 MW
19
• Theoretical maximum in transmission capacity ~40 TWh
per annum, but restrictions especially between DK & DE
• Net export from the Nordic area to Continental Europe
and Baltics during year 2016 was 10 TWh
• During 2015 the net export was 18 TWh
• Approximately 25 TWh of net export is now reachable
Countries Transmission capacity MW
From Nordics To Nordics
Denmark - Germany 2,225 2,100
Sweden - Germany 615 615
Sweden - Poland 600 600
Sweden - Lithuania 700 700
Norway - Netherlands 723 723
Finland - Estonia 1,016 1,016
Finland - Russia 320 1,300
Total 6,199 7,054
723
2,225 615 600
1,016
320
700

Nordic, Baltic, Continental and UK markets are integrating– Interconnection capacity will double by 2023
20
Two 1,400 MW NO-UK links as EU Projects
of Common Interest: NSL to England due to
be ready in 2021, NorthConnect to Scotland
still requiring Norwegian permission
1,400 MW NordLink as first direct NO-DE link
is being built by end-2019
700 MW COBRAcable from DK to NL due to
be ready in March 2019
Jutland – DE capacity planned to grow by
860 MW in 2020, with further 1,000 MW
increase in 2022
New 400 MW Zealand – DE connection via
Kriegers Flak offshore wind area by end-2018
The Northern Seas Offshore Grid and the Baltic
Energy Market Integration Plan are included as
priority electricity corridors in EU’s Infrastructure
Guidelines, approved in April 2013
New interconnections will
double the export capacity
to over 12,000 MW by 2023
New internal Nordic grid investments
provide for increased available capacity
for export to the Continent and Baltics
EU’s Connecting Europe Facility
co-financing 3rd EE-LV transmission
line, due to be ready by 2020
New 1,400 MW DK-UK Viking Link not yet
decided, but planned to be built by end-2022
New interconnectors
New Nordic lines
Existing interconnectors
Svenska Kraftnät and 50Hertz signed
1/2017 a cooperation agreement on building
the 700 MW Hansa PowerBridge DC link
between Sweden and Germany by 2025/26

Nordic water reservoirs
Q1 Q2 Q3 Q4
20
40
60
80
100
120re
se
rvo
ir c
on
ten
t (T
Wh
)
0
2000 2003 20162015 reference level2017
21
Source: Nord Pool

Nordic year forwards
22 Source: Nasdaq Commodities, Bloomberg
Year 20 Year 19 Year 10 Year 11 Year 12 Year 13 Year 14 Year 15 Year 16 Year 17 Year 18Year15 Year17 Year19Year10 Year11 Year12 Year13 Year14 Year16 Year18 Year20
0
10
20
30
40
50
60
70
€/MWh 18 July 2017
2014
Q1
2008
Q2 Q3 Q4 Q1
2009
Q2 Q3 Q4 Q1
2010
Q2 Q3 Q4 Q1
2011
Q2 Q3 Q4 Q1
2012
Q2 Q3 Q4 Q1
2013
Q2 Q3 Q4 Q1 Q2 Q3 Q4
2015
Q1 Q2 Q3 Q4
2016
Q1 Q2 Q3 Q4 Q1
2017
Q2 Q3

Wholesale power price
23 Source: Nord Pool, Nasdaq Commodities
0
10
20
30
40
50
60
70
80
90
100
110
EUR/MWh Nord Pool System Price Futures
17 July 2017
1995 1997 1999 2001 2003 2005 2007 2009 2011 2013 2015 2017 2019 2021 2023 2025 2027

Wholesale power prices
24
0
10
20
30
40
50
60
70
80
90
100
German
Nordic
Russian*
Spot prices Forward pricesEUR/MWh
10
20
30
40
50
60
70
80
90
100
018 July 2017
2009 2010 2011 2012 2013 2014 2015 2016 2017 2018
* Including weighted average capacity price
Source: Nord Pool, Nasdaq Commodities, Bloomberg Finance LP, ATS, NP “Market Council”, Fortum

0
30
60
90
120
150
US
D /
bb
l
Crude oil price (ICE Brent)
2008 2009 20122010 2011 20142013 2015 2016 2017 20180
7
14
21
28
35
EU
R /
tC
O2
CO2 price (ICE EUA)
2008 2009 20122010 2011 20142013 2015 2016 2017 2018
0
50
100
150
200
250
US
D /
t
Coal price (ICE Rotterdam)
2008 2009 20122010 2011 20142013 2015 2016 2017 2018
0
20
40
60
80
100
GB
p /
th
erm
Gas price (ICE NBP)
2008 2009 20122010 2011 20142013 2015 2016 2017 2018
25
Fuel and CO2 allowance prices
Source: ICE, Thomson Reuters
Market prices 17 July 2017; 2017-2018 future quotations

Power Generation in the Baltic Rim in 2016 (2015)
26
Others
Hydro
Nuclear
Solar
Conventional thermal
Wind
Source: Eurostat figures
Graph sizes are illustrative.
Germany
612 TWh
(610)
Lithuania
4 (5) TWh
Estonia
10 (9) TWh
Latvia
6 (5) TWh
Denmark
29 TWh
(28)
Poland
151 TWh
(151)
Norway
145 TWh
(144)
Sweden
152 TWh
(159)
Finland
66 TWh
(66)
*) Normal annual Nordic hydro generation
200 TWh, variation +/- 40 TWh.
Net export Net import
4 TWh 7 TWh
TWh %
Hydro
Nuclear
Conv. thermal
Wind
Solar
Others
Total generation
* 217
83
58
33
0.8
0
392
55
21
15
9
0.2
0
Nordics
2016 TWh %
4
-
15
2
0.1
0.3
21
18
-
72
9
0.2
1
Baltics

Wholesale electricity price too low to attract investments
27
NOTE: The presented figures are calculated based on data from recent public reports and do not represent Fortum’s view. Average achieved price (€/MWh) for the production
type depends on availability and flexibility. There are large variations in the cost of hydro, wind and solar depending on location and conditions.
0
10
20
30
40
50
60
70
80
90
100
110
Source: Nord Pool, Nasdaq Commodities
EUR/MWh
Futures
17 July 2017
1995 2017 20270
10
20
30
40
50
60
70
80
90
100
110
Commodity prices are forward prices as of April 2017, extended with inflation
EUR/MWh
Average levelised costs of new electricity generation
Coalcondensing
Onshorewind
Gascondensing
Nuclear Largehydro
Solar PVIn Spain
Offshorewind

Overview of Fortum’s nuclear fleet
28
LOVIISA OLKILUOTO OSKARSHAMN FORSMARK
Commercial operation started
Unit 1: 1977
Unit 2: 1981
Unit 1: 1978
Unit 2: 1980
Unit 3: (Under construction)
Unit 1: 1972 (out of oper.)
Unit 2: 1974 (out of oper.)
Unit 3: 1985
Unit 1: 1980
Unit 2: 1981
Unit 3: 1985
Generation Capacity
Fortum’s share
Unit 1: 502 MW
Unit 2: 502 MW
Total: 1004 MW
Unit 1: 880 MW
Unit 2: 880 MW
(Unit 3: 1,600 MW)
Total: 1,760 MW (3,360)
27% 468 MW
Unit 1: 473 MW
Unit 2: 638 MW
Unit 3: 1,400 MW
Total: 1,873 MW
43% 812 MW
Unit 1: 984 MW
Unit 2: 1,120 MW
Unit 3: 1,167 MW
Total: 3,271 MW
22% 727 MW
Yearly production
Fortum’s share of
production
8 TWh
8 TWh
14 TWh
4 TWh
12 TWh
5 TWh
26 TWh
6 TWh
Share of Fortum’s
Nordic production18% 9% 12% 13%
Majority owner
Fortum’s share
Fortum Pohjolan Voima
26.6%
Uniper
43.4%
Vattenfall
22.2%
Operated by FortumTeollisuuden Voima(TVO)
OKG Aktiebolag Forsmarks Kraftgrupp
ResponsibilitiesLoviisa: Fortum is the owner, licensee and operator with all the responsibilities specified in the Nuclear Energy Act, Nuclear Liability Act, and other relevant nuclear legislation
Other units: Fortum is solely an owner with none of the responsibilities assigned to the licensee in the nuclear legislation. Other responsibilities are specified in the
Companies Act and the Articles of Association and are mostly financial.
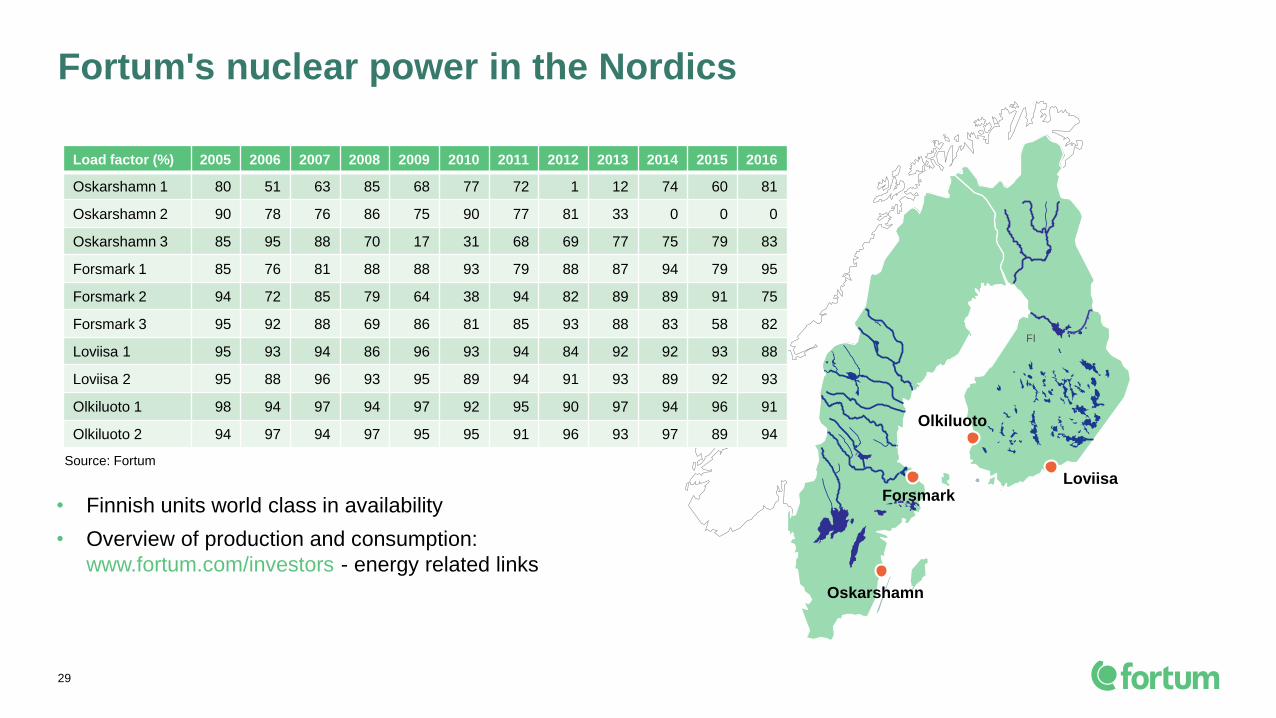
Fortum's nuclear power in the Nordics
29
• Finnish units world class in availability
• Overview of production and consumption:
www.fortum.com/investors - energy related links
Source: Fortum
FI
Olkiluoto
Loviisa
Oskarshamn
Forsmark
Load factor (%) 2005 2006 2007 2008 2009 2010 2011 2012 2013 2014 2015 2016
Oskarshamn 1 80 51 63 85 68 77 72 1 12 74 60 81
Oskarshamn 2 90 78 76 86 75 90 77 81 33 0 0 0
Oskarshamn 3 85 95 88 70 17 31 68 69 77 75 79 83
Forsmark 1 85 76 81 88 88 93 79 88 87 94 79 95
Forsmark 2 94 72 85 79 64 38 94 82 89 89 91 75
Forsmark 3 95 92 88 69 86 81 85 93 88 83 58 82
Loviisa 1 95 93 94 86 96 93 94 84 92 92 93 88
Loviisa 2 95 88 96 93 95 89 94 91 93 89 92 93
Olkiluoto 1 98 94 97 94 97 92 95 90 97 94 96 91
Olkiluoto 2 94 97 94 97 95 95 91 96 93 97 89 94

Variety of technologies and ages
30
Planned capacity increase:
• Forsmark 1, potential capacity increase of total ~110 MW in 2017-2020.
Closing of the units:
• OKG AB's Extraordinary shareholders' meeting decided on 14 October 2015 on the closure of Oskarshamn nuclear power plant units
1 and 2 in Sweden.
• Unit 1 was be taken out of operation on June 17, 2017. Unit 2 has been out of operation since June 2013 due to an extensive safety
modernisation, and it will not be put back into operation. The closing process for both units is estimated to take several years.
PWR = (Pressurized Water Reactor) The most common reactor type in the world (e.g. all French units, most US units). Also the Loviisa units are PWRs, but based on Russian design. High pressure
prevents water from boiling n the reactor. The steam rotating the turbine is generated in separate steam generators.
BWR = (Boiling Water Reactor) Similar to the PWR in many ways, but the steam is generated directly in the reactor. Popular reactor type e.g. in Sweden, the US and Japan.
1) Generation refers to technical resemblence based on KSU classification and not to reactor design generations. All reactors are of Generation II except Olkiluoto-3 (EPR) which is of Generation III.
Unit MWe
(Net)
Share
(%)
Share
(MWe)
Commercial
operation
Age Type/
Generation 1)
Supplier
Loviisa 1
Loviisa 2
498
500
100,0
100,0
498
500
1977-05-09
1981-01-05
38
35
PWR / 1
PWR / 1
AEE (Atomenergoexport)
AEE (Atomenergoexport)
Olkiluoto 1
Olkiluoto 2
Olkiluoto 3
880
880
(1,600)
26,6
26,6
25,0
234
234
(400)
1979-10-10
1982-07-10
(end of 2018)
37
35
BWR / 3
BWR / 3
PWR / 3
Asea-Atom / Stal-Laval
Asea-Atom / Stal-Laval
Areva / Siemens
Oskarshamn 1
Oskarshamn 2
Oskarshamn 3
473
638
1,400
43,4
43,4
43,4
205
277
607
1972-02-06
1975-01-01
1985-08-15
43
41
30
BWR / 1
BWR / 2
BWR / 4
Asea-Atom / Stal-Laval
Asea-Atom / Stal-Laval
Asea-Atom / Stal-Laval
Forsmark 1
Forsmark 2
Forsmark 3
984
1,120
1,167
23,4
23,4
20,1
230
262
236
1980-12-10
1981-07-07
1985-08-18
35
34
30
BWR / 3
BWR / 3
BWR / 4
Asea-Atom / Stal-Laval
Asea-Atom / Stal-Laval
Asea-Atom / Stal-Laval

Third party nuclear liability in case of severe accident
31
In force since 1 January 2012
Law approved by Parliament
in 2010, requires separate
decision from Government to
come into force.
Sweden
(new, not
in force)
Finland,
temporary
legislation
Current,
Sweden
700 M€
200 M€360 M€
500 M€Responsibility of company
(insurance or guarantee)
Unlimited
company
responsibility
Convention
parties 300 M€
State
responsibility
300 M€
500 M€
700 M€
New Paris
convention
700 M€
145 M€
145 M€
Old,
Finland
240 M€
145 M€Requires ratification by 2/3
of member states to come
into force. In Finland
approved by Parliament in
2005

OAO Fortum (former TGC-10)
• Operates in the heart of Russia’s oil and gas producing region, fleet mainly gas-fired CHP capacity
• 25 TWh power generation, 21 TWh heat production in 2016 Investment programme to add 85%,
almost 2,200 MW to power generation capacity
TGC-1
• 29.5% of territorial generating company TGC-1 operating in north-west Russia
• ~7,000 MW electricity production capacity (more than 40% hydro),
~26 TWh electricity, ~28 TWh heat in 2016
In December 2014, Fortum and Gazprom Energoholding signed a protocol to start a restructuring
process of TGC-1. Currently Gazprom Energoholding owns 51.8% of the TGC-1 shares and Fortum
29.5%. As part of the restructuring, Fortum will establish a joint venture together with Rosatom to own
the hydro assets of TGC-1, while Gazprom Energoholding continues with the heat and thermal power
businesses of TGC-1. By utilising its present stake in TGC-1, Fortum would obtain a 75-plus-percent
ownership in the new hydro power company, and Rosatom a 25-minus-percent minority holding.
In October 2015, Fortum announced that the discussions related to the potential restructuring of TGC-1
will continue, and it is not possible to estimate the time schedule or outcome of the discussions.
Fortum - a major player in Russia
OAO Fortum
Tyumen
Chelyabinsk
Nyagan
TGC-1
St. Petersburg
Moscow
32

0
200
400
600
800
1 000
1 200
1 400
RU
B /
MW
h
0
5
10
15
20
25
30
35
40
€/
MW
h
2009 2010 2011 2012 2013 2014 2015 2016 2017In addition to the power price generators receive a capacity payment. Source: ATS
Day ahead power market prices for Urals
2009 2010 2011 2012 2013 2014 2015 2016 2017
Day ahead wholesale market prices in Russia
33
II/17 II/16 I-II/17 I-II/16 2016 LTM
Electricity spot price (market price),
Urals hub, RUB/MWh1,012 1,011 1,023 1,015 1,055 1,059
Average regulated gas price, Urals
region, RUB 1000 m3 3,614 3,614 3,614 3,614 3,614 3,614
Average capacity price for CCS ”old
capacity”, tRUB/MW/month138 129 148 139 140 145
Average capacity price for CSA ”new
capacity”, tRUB/MW/month 819 737 901 804 815 864
Average capacity price,
tRUB/MW/month492 434 539 467 481 517
Achieved power price for Fortum in
Russia, RUB/MWh1,738 1,663 1,807 1,665 1,734 1,808
Achieved power price for Fortum in
Russia, EUR/MWh 27.0 22.6 28.5 21.5 23.5 27.0
Key electricity, capacity and gas prices in the OAO Fortum area

Power generation capacity in Russia at 30.6.2017
Year Supply
starts
Power plant Fuel type Existing
capacity
New
investments
Production type Total
capacity
< 2011 Tyumen CHP-2 Gas 755 CHP/Condensing 755
Chelyabinsk CHP-2 Gas, coal 320 CHP/Condensing 320
Argayash CHP Gas, coal 195 CHP/Condensing 195
Chelyabinsk CHP-1 Gas, coal 134 CHP/Condensing 134
2011 Feb/2011 Tyumen CHP-1 Gas 450 210 CHP/Condensing 660
June/2011 Chelyabinsk CHP-3 Gas 360 233 CHP/Condensing 593
Oct/2011 Tobolsk CHP* Gas 452 213 CHP/Condensing 665*
2013 April/2013 Nyagan 1 GRES Gas 453 Condensing 453
Dec/2013 Nyagan 2 GRES Gas 453 Condensing 453
2015 Jan/2015 Nyagan 3 GRES Gas 455 Condensing 455
Dec/2015 Chelyabinsk GRES Gas 247 CHP/Condensing 247
2016 March/2016 Chelyabinsk GRES Gas 248 CHP/Condensing 248
2,214 MW 2,298 MW 4,512 MW
34
*Tobolsk power plant was sold in Q1/2016

Hedging improves stability and predictability
35 2009 onwards thermal and import from Russia excluded

Half-Year Financial ReportJanuary-June 2017Fortum Corporation
20 July 2017

Strategy implementation and capital redeployment continued
10
TÄHÄN KUVA
70 MW solar powerin India
Hafslund deal
Charge & Drive network expanded
Nuclear services in Germany
Wind power in Nordics and Russia
Digitalising our
customer interface;
MyFortum app
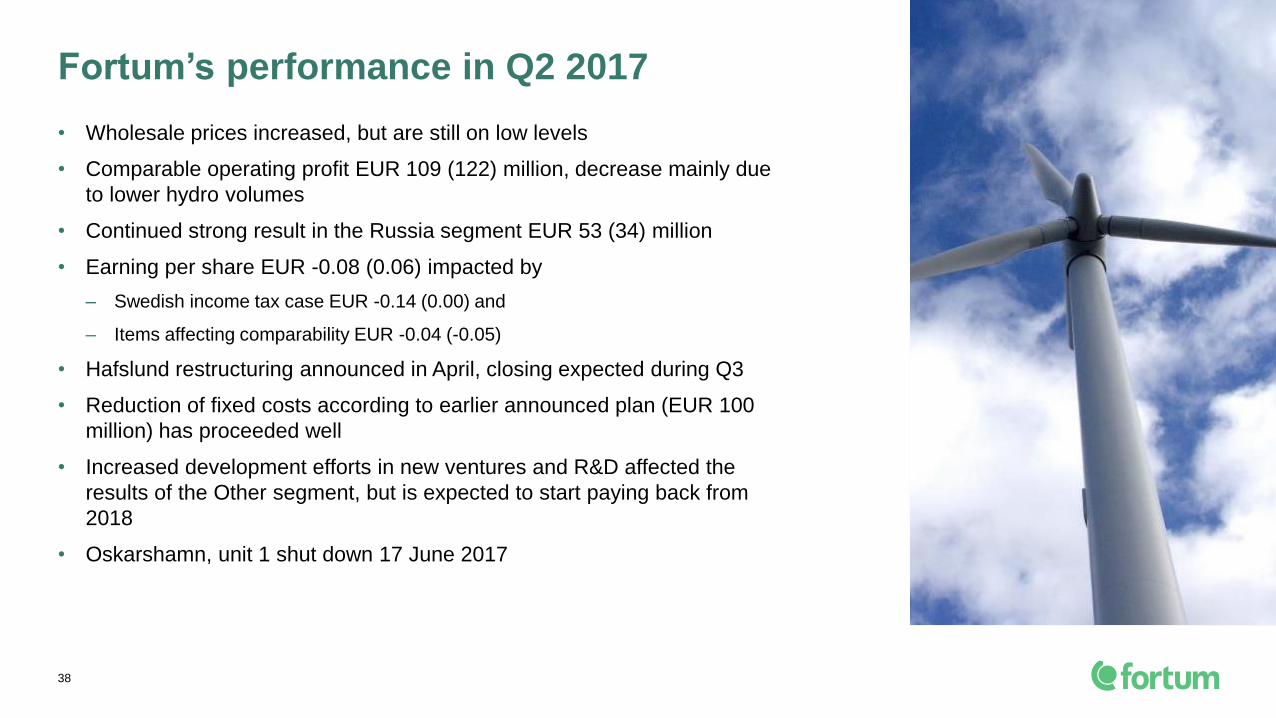
• Wholesale prices increased, but are still on low levels
• Comparable operating profit EUR 109 (122) million, decrease mainly due
to lower hydro volumes
• Continued strong result in the Russia segment EUR 53 (34) million
• Earning per share EUR -0.08 (0.06) impacted by
– Swedish income tax case EUR -0.14 (0.00) and
– Items affecting comparability EUR -0.04 (-0.05)
• Hafslund restructuring announced in April, closing expected during Q3
• Reduction of fixed costs according to earlier announced plan (EUR 100
million) has proceeded well
• Increased development efforts in new ventures and R&D affected the
results of the Other segment, but is expected to start paying back from
2018
• Oskarshamn, unit 1 shut down 17 June 2017
Fortum’s performance in Q2 2017
38
Nordic countries
• Electricity consumption totalled 88 (86) TWh in Q2 2017. Colder weather in Q2
2017 than in Q2 2016. January-June consumption 202 (203) TWh
• System spot price 27.4 (23.9) EUR/MWh, Finnish area price was 30.9 (30.2)
EUR/MWh and Swedish (SE3) area price 28.5 (26.5) EUR/MWh
• Market price of CO2 emission allowances (EUA) was EUR 6.5 per tonne at the
beginning of the year and EUR 5.0 per tonne at the end of the second quarter
of 2017
Russia
• Electricity consumption was 238 (230) TWh in Q2 2017. In Fortum’s operating
area in the First price zone 184 (176) TWh in Q2 2017
• Average electricity spot price, excluding capacity price, in Urals hub remained
at the same level as in the second quarter of 2016
Market conditions in Q2 2017
39

Price development in the Nordic region and Russia
40
+15%
Includes capacity income
+19%
NOTE: Achieved power price in roubles increased appr.5%
-2%
+0%

Key figures Q2 2017
41
MEUR II/17 II/16 I-II/17 I-II/16 2016 LTM
Sales 937 768 2,169 1,757 3,632 4,044
Comparable EBITDA 219 209 642 566 1,015 1,091
Operating profit 66 67 456 437 633 652
Comparable operating profit 109 122 421 397 644 668
Share of profits of associates and joint ventures 35 38 94 105 131 120
Profit before taxes 49 61 461 451 595 605
Earnings per share, EUR -0.08 0.06 0.30 0.43 0.56 0.43
Net cash from operating activities 232 -5 514 370 621 765

• Lower hydro production volumes and lower achieved power
price burdened the results
• Excellent nuclear availability and higher thermal volumes
partly offset the result effect
• Nordic hydro reservoirs 2 TWh lower than a year ago
Generation
42
MEUR II/17 II/16 I-II/17 I-II/16 2016 LTM
Sales 402 384 876 851 1,657 1,682
Comparable EBITDA 111 124 277 306 527 498
Comparable operating profit 78 98 214 253 417 378
Comparable net assets 5,724 5,832 5,815
Comparable RONA % 6.9 6.0
Gross investments 42 50 67 77 203 193

• Colder weather positively impacted the heat sales 5.4 (4.7) TWh
• Strong sales and EBITDA improvement mainly due to Ekokem
• Comparable operating profit also positively impacted by
favourable fuel mix
City Solutions
43
MEUR II/17 II/16 I-II/17 I-II/16 2016 LTM
Sales 205 121 495 349 782 928
Comparable EBITDA 37 20 131 90 186 227
Comparable operating profit 1 -5 57 39 64 82
Comparable net assets 2,889 2,020 2,873
Comparable RONA % 5.9 5.8
Gross investments 43 17 63 37 807 833

• Sales increased, mainly due to the increased Nordic prices and the higher trading
activity in Poland
• Lower average margins in electricity products and increased focus and spend on
development of new digital services impacted the result negatively
• Strong competition in the Nordics is expected to continue challenging, putting
pressure on sales margins
• Announced Hafslund deal will almost double the Nordic customer base to 2.4
million customers
Consumer Solutions
44
MEUR II/17 II/16 I-II/17 I-II/16 2016 LTM
Sales 164 146 406 321 668 753
Comparable EBITDA 8 15 22 29 55 48
Comparable operating profit 6 13 18 26 48 40
Comparable net assets 129 125 154
Customer base, million 1.36 1.35 1.36
Gross investments 1 3 3 117 120 6

* Excluding the net release of CSA provision
• Sales increased due to strengthening RUB, higher CSA
payments and heat sales
• Lower fuel costs and improved bad-debt collection also
improved the results
• 1,000 MW of 50/50 owned Fortum-RUSNANO wind
investment fund bids selected in Russian CSA auction
Russia
45
MEUR II/17 II/16 I-II/17 I-II/16 2016 LTM
Sales 238 182 586 431 896 1,051
Comparable EBITDA* 88 64 256 169 312 399
Comparable operating profit 53 34 185 113 191 263
Comparable net assets 3,156 2,871 3,284
Comparable RONA % 8.0 9.3
Gross investments 42 53 73 93 201 181

Q2/2017: Lower hydro volumes – Russia results improved
Comparable operating profit, EUR million
• 0.8 TWh lower hydro volumes
• 0.5 EUR/MWh lower achieved price
• New capacity, higher CSA income,
electricity spread, higher heat volume
and bad-debt collection
• EUR 4 million positive effect on RUB
46
• Increased heat sales due
to colder weather

I-II/2017: Lower hydro volumes – Russia results improved
Comparable operating profit, EUR million
• 2.1 TWh lower hydro volumes
• 0.7 EUR/MWh higher achieved price
• New capacity, higher CSA income,
electricity spread, higher heat volume
and bad-debt collection
• EUR 33 million positive effect on RUB
47
• Higher heat sales due to
colder weather
• Favourable fuel mix
• Consolidation of Ekokem

Income statement
MEUR II/17 II/16 I-II/17 I-II/16 2016 LTM
Sales 937 768 2,169 1,757 3,632 4,044
Other income and expenses -828 -646 -1,748 -1,360 -2,988 -3,376
Comparable operating profit 109 122 421 397 644 668
Items affecting comparability -42 -54 34 40 -11 -17
Operating profit 66 67 456 437 633 652
Share of profit of associates and joint ventures 35 38 94 105 131 120
Finance costs, net -52 -44 -88 -91 -169 -166
Profit before taxes 49 61 461 451 595 605
Income tax expense -118 -4 -190 -62 -90 -218
Net profit -69 57 271 389 504 386
EPS (EUR) -0.08 0.06 0.30 0.43 0.56 0.43
48

Cash flow statement
MEUR II/17 II/16 I-II/17 I-II/16 2016 LTM
Cash from operating activities:
Comparable EBITDA 219 209 642 566 1,015 1,091
Realised FX gains/losses -6 -1 -63 128 110 -81
Paid net financial costs, income taxes and other -35 -191* -130 -331* -402* -201
Change in working capital 54 -22 65 7 -102 -44
Cash from operating activities 232 -5 514 370 621 765
Cash used in investing activities:
Paid capital expenditures -128 -130 -308 -244 -599 -663
Acquisitions of shares -25 -9 -51 -113 -695 -633
Change in cash collaterals -110 -93 72 -269 -359 -18
Other investing activities 65 -30 88 -15 -48 55
Total investing activities -198 -262 -199 -641 -1,701 -1,259
Cash flow before financing activities 34 -266 315 -271 -1,080 -494
49
* Includes the payment of income taxes EUR 127 million regarding Swedish income tax case

Debt portfolio and average interest rate on the balance sheet date30 June 2017
50
Maturity profile
1)
0
250
500
750
1 000
1 250
1 500
2017 2018 2019 2020 2021 2022 2023 2024 2025 20262027+
Bonds Financial institutions Other long-term debt Other short-term debt
1) In addition Fortum has received EUR 116 million based on Credit Support Annex agreements with several counterparties.
This amount has been booked as a short term liability.
• Total interest-bearing debt EUR 4,711
million
– Average interest 3.4% (2016: 3.5%)
– Portfolio mainly in EUR and SEK with
average interest cost 2.0% (2016: 2.1%)
– EUR 761 million (2016: 805) swapped to
RUB, average interest cost including cost
for hedging 10,7% (2016: 11.4%)

Fortum has significant financial headroom available for market consolidation
MEUR LTM 2016 Target
Comparable EBITDA 1,091 1,015
Interest-bearing net debt 605 -48
Comparable net debt/EBITDA 0.6 0.0 Around 2.5
ROCE % Return on capital employed 4.3 4.0 At least 10%
51
Liquid funds totalled EUR 4.1 billion
Committed credit lines total EUR 1.9 billion

Outlook
52
Nordic markets
• Fortum continues to expect that the annual electricity demand growth will be approximately
0.5% on average
• Electricity is expected to continue to gain share of total energy consumption
2017 Annual capex estimate, excluding acquisitions• Approximately EUR 800 million (maintenance capex below EUR 300 million)
Hedging• Rest of 2017 approximately 45% hedged at EUR 30/MWh
• 2018 approximately 45% hedged at EUR 28/MWh
Taxation• Effective tax rate for 2017 for the Group 19-21% *
• In Sweden
– Nuclear taxes reduced from 1 July 2017 and abolished by 2018
– Hydro assets’ real estate tax rate decreased from 2.8% to 0.5% over a four-year period
• Swedish Administrative Court ruled (on 30 June 2017) in Fortum Sverige AB’s favour
regarding hydro real-estate tax for 2009-2014 (EUR 53 million). The tax authority may still
appeal.
* Excluding the impact of the share of profits of associated companies and joint ventures, non-taxable capital
gains, and a Swedish income tax case.

Fortum Investor Relations and Financial CommunicationsFor more information, please visit www.fortum.com/investors
53
Follow us on:
www.twitter.com/Fortum www.linkedin.com/company/fortum
Fortum ForEnergy blog at
http://fortumforenergyblog.wordpress.com www.youtube.com/user/fortum
Måns Holmberg
Acting head of
Investor Relations and
Financial Communications
+358 (0)44 518 1518
Next events:
Q3/2017 results on 26 October 2017
Meeting requests:
Marja MattilaExecutive Assistant
+358 (0)10 452 8301
Pirjo LifländerIR Specialist
+358 (0)40 643 3317
Rauno Tiihonen
Manager
+358 (0)10 453 6150