Making effective powerpoint-based presentations
55
1 Making effective powerpoint-based presentations Bruce E. Logan Penn State University Engineering Environmental Institute
Transcript of Making effective powerpoint-based presentations
1
Making effective powerpoint-based presentations
Bruce E. LoganPenn State University
EngineeringEnvironmental
Institute

2
Consider first the slide background…
33
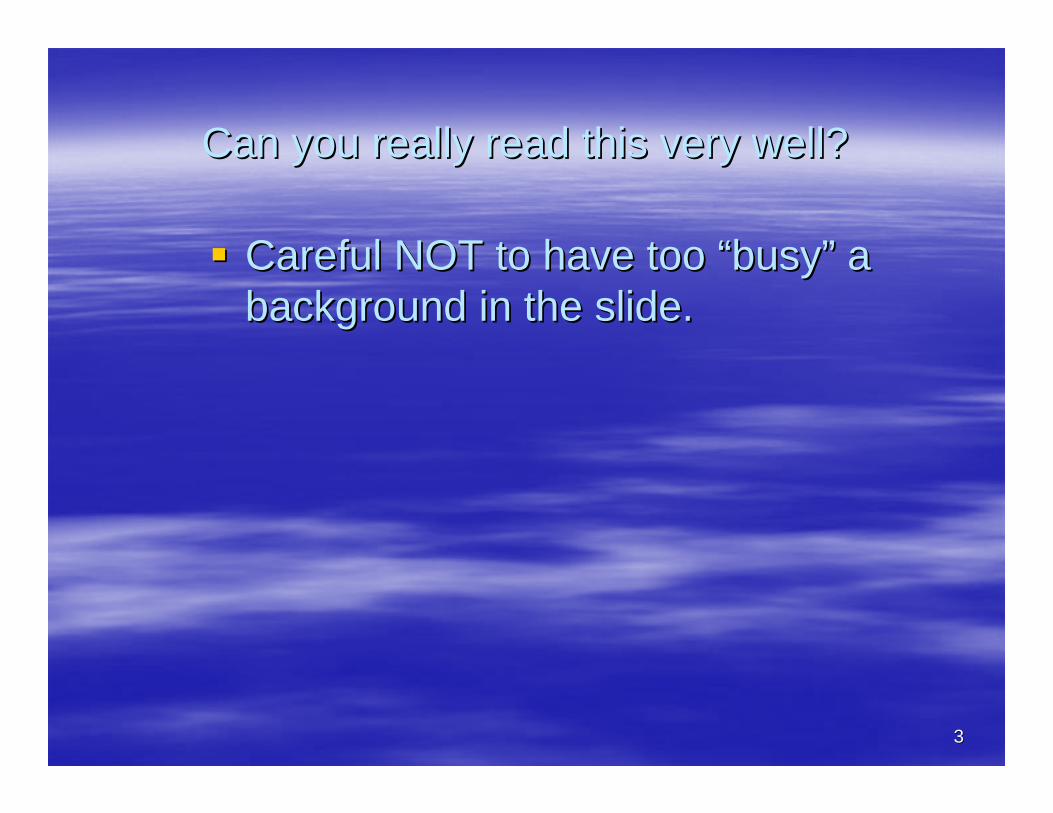
Can you really read this very well?Can you really read this very well?
Careful NOT to have too Careful NOT to have too ““busybusy”” a a background in the slide.background in the slide.
4
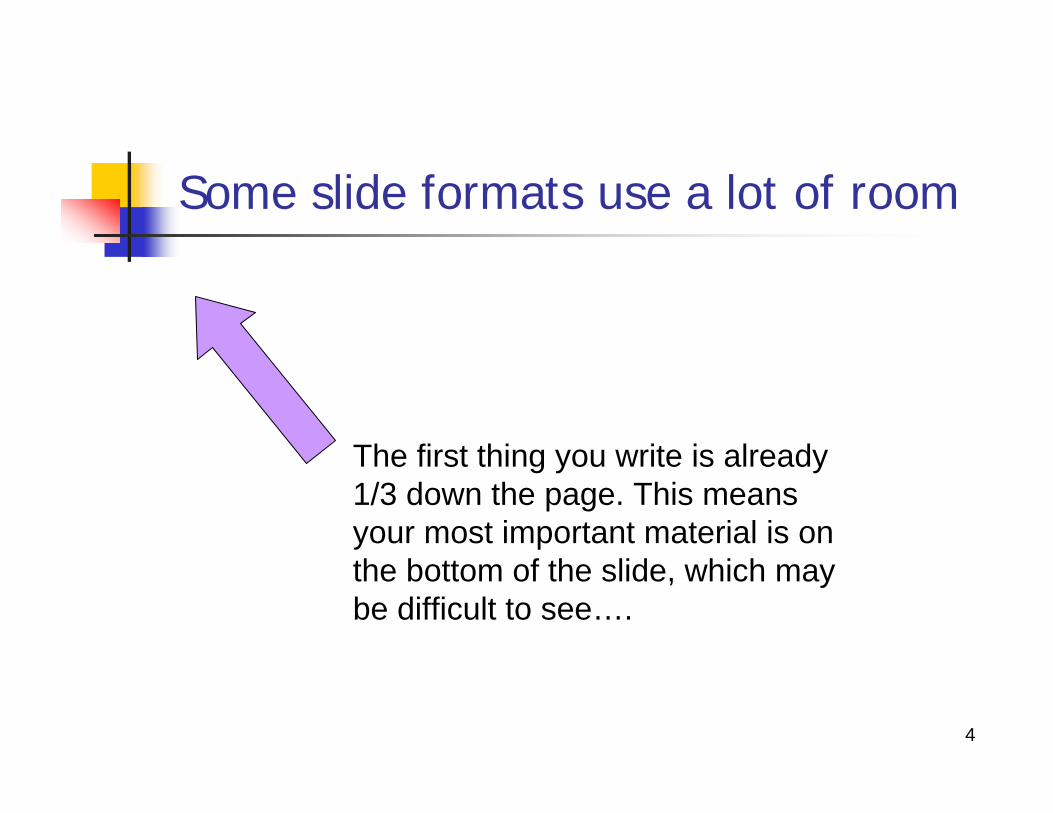
Some slide formats use a lot of room
The first thing you write is already 1/3 down the page. This means your most important material is on the bottom of the slide, which may be difficult to see….

5
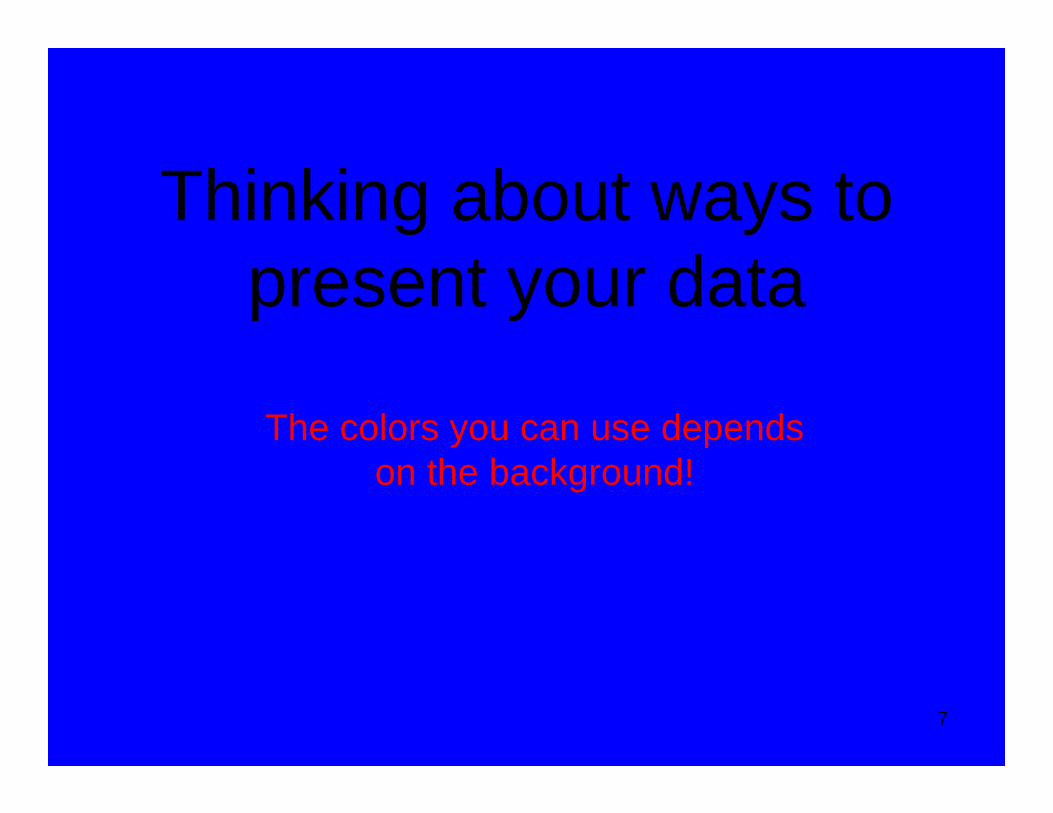
Thinking about ways to present your data
The colors you can use depends on the background!

6
Thinking about ways to present your data
The colors you can use depends on the background!
7
Thinking about ways to present your data
The colors you can use depends on the background!

8
Thinking about ways to present your data
The colors you can use depends on the background!

99
Thinking about ways to Thinking about ways to present your datapresent your data
The colors you can use depends on the background!
1010
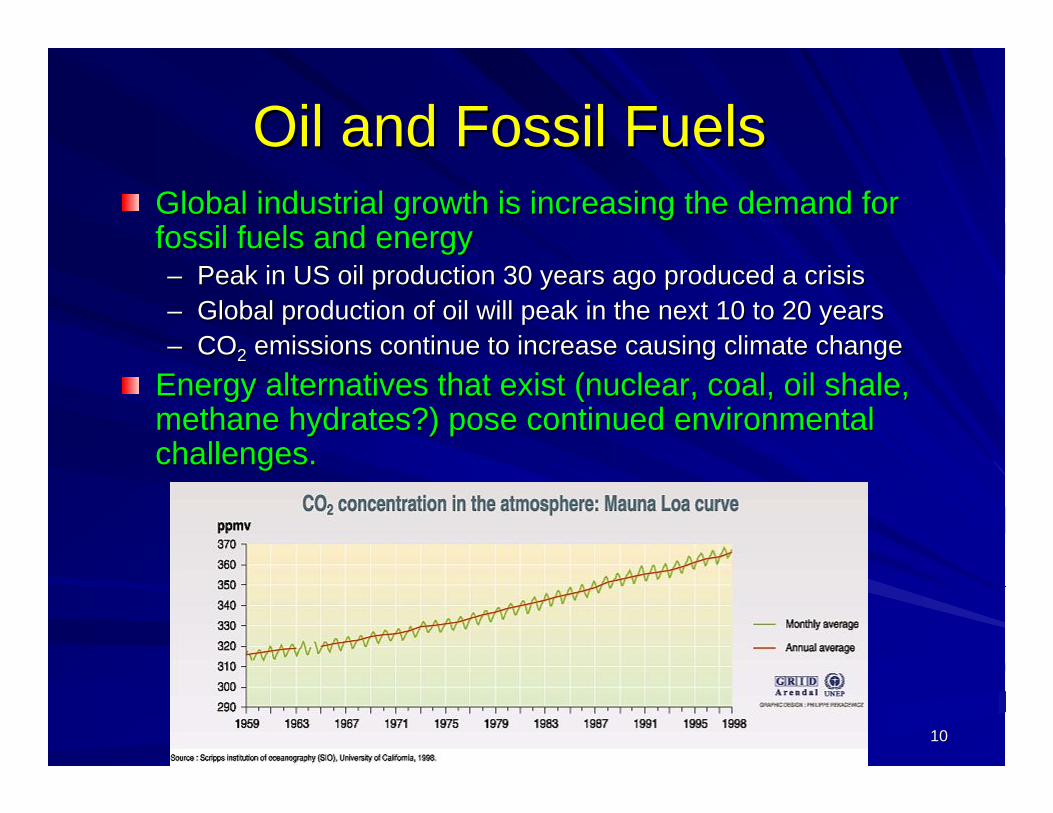
Oil and Fossil FuelsOil and Fossil FuelsGlobal industrial growth is increasing the demand for Global industrial growth is increasing the demand for fossil fuels and energyfossil fuels and energy–– Peak in US oil production 30 years ago produced a crisisPeak in US oil production 30 years ago produced a crisis–– Global production of oil will peak in the next 10 to 20 yearsGlobal production of oil will peak in the next 10 to 20 years–– COCO22 emissions continue to increase causing climate changeemissions continue to increase causing climate change
Energy alternatives that exist (nuclear, coal, oil shale, Energy alternatives that exist (nuclear, coal, oil shale, methane hydrates?) pose continued environmental methane hydrates?) pose continued environmental challenges.challenges.
11
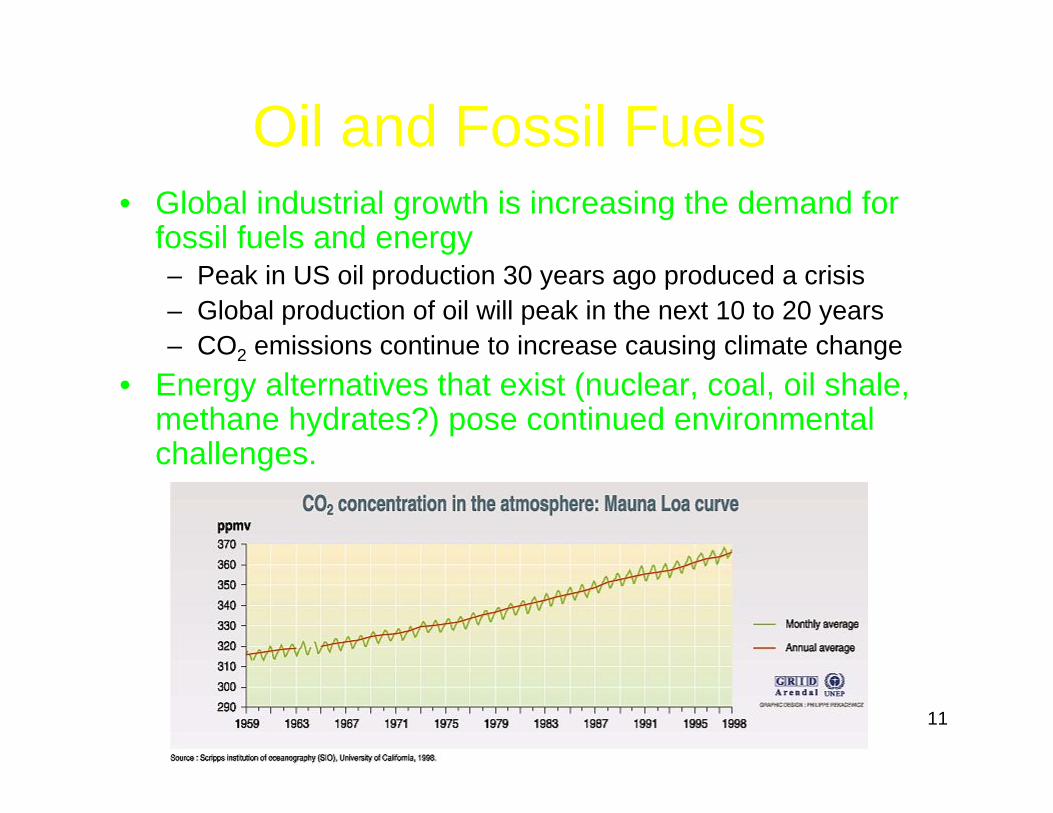
Oil and Fossil Fuels• Global industrial growth is increasing the demand for
fossil fuels and energy– Peak in US oil production 30 years ago produced a crisis– Global production of oil will peak in the next 10 to 20 years– CO2 emissions continue to increase causing climate change
• Energy alternatives that exist (nuclear, coal, oil shale, methane hydrates?) pose continued environmental challenges.
1212
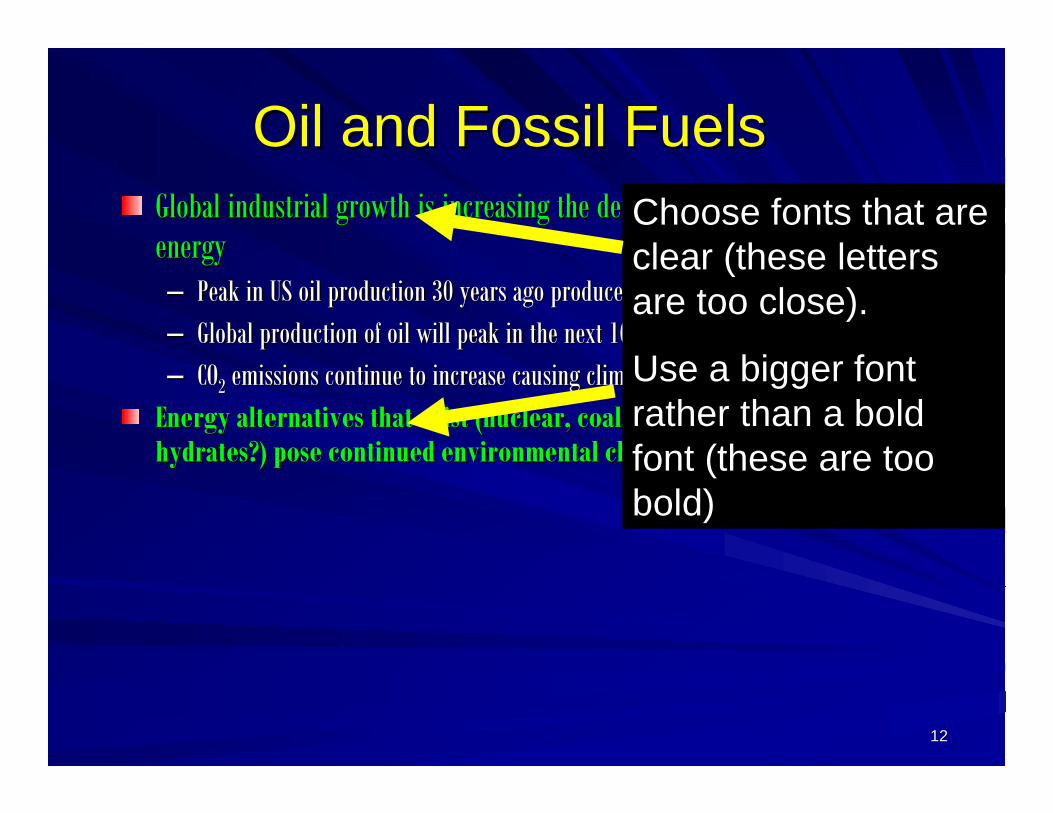
Oil and Fossil FuelsOil and Fossil FuelsGlobal industrial growth is increasing the demand for fossil fueGlobal industrial growth is increasing the demand for fossil fuels and ls and energyenergy–– Peak in US oil production 30 years ago produced a crisisPeak in US oil production 30 years ago produced a crisis–– Global production of oil will peak in the next 10 to 20 yearsGlobal production of oil will peak in the next 10 to 20 years–– COCO22 emissions continue to increase causing climate changeemissions continue to increase causing climate change
Energy alternatives that exist (nuclear, coal, oil shale, methanEnergy alternatives that exist (nuclear, coal, oil shale, methane e hydrates?) pose continued environmental challenges.hydrates?) pose continued environmental challenges.
Choose fonts that are clear (these letters are too close).
Use a bigger font rather than a bold font (these are too bold)
13
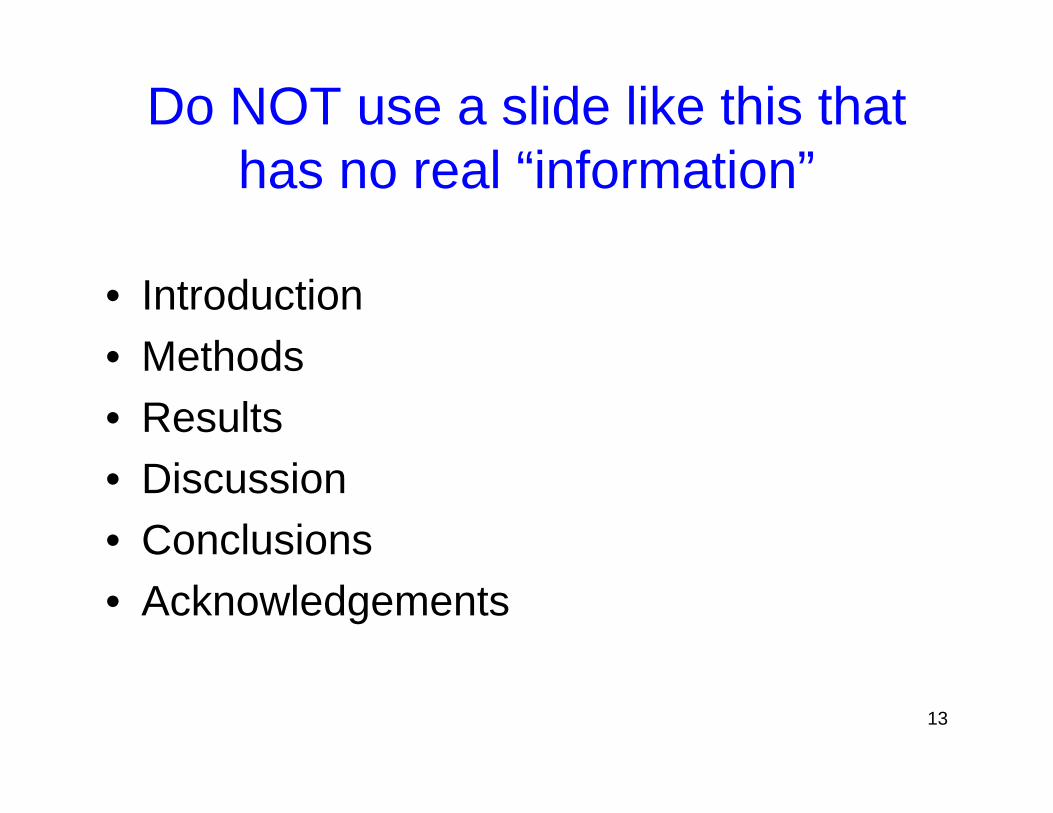
Do NOT use a slide like this that has no real “information”
• Introduction• Methods• Results• Discussion• Conclusions• Acknowledgements
14
Do indicate different subjects that you might cover
• How an MFC works• Laboratory tests using a single substrate• Pilot scale tests using industrial
wastewaters
15
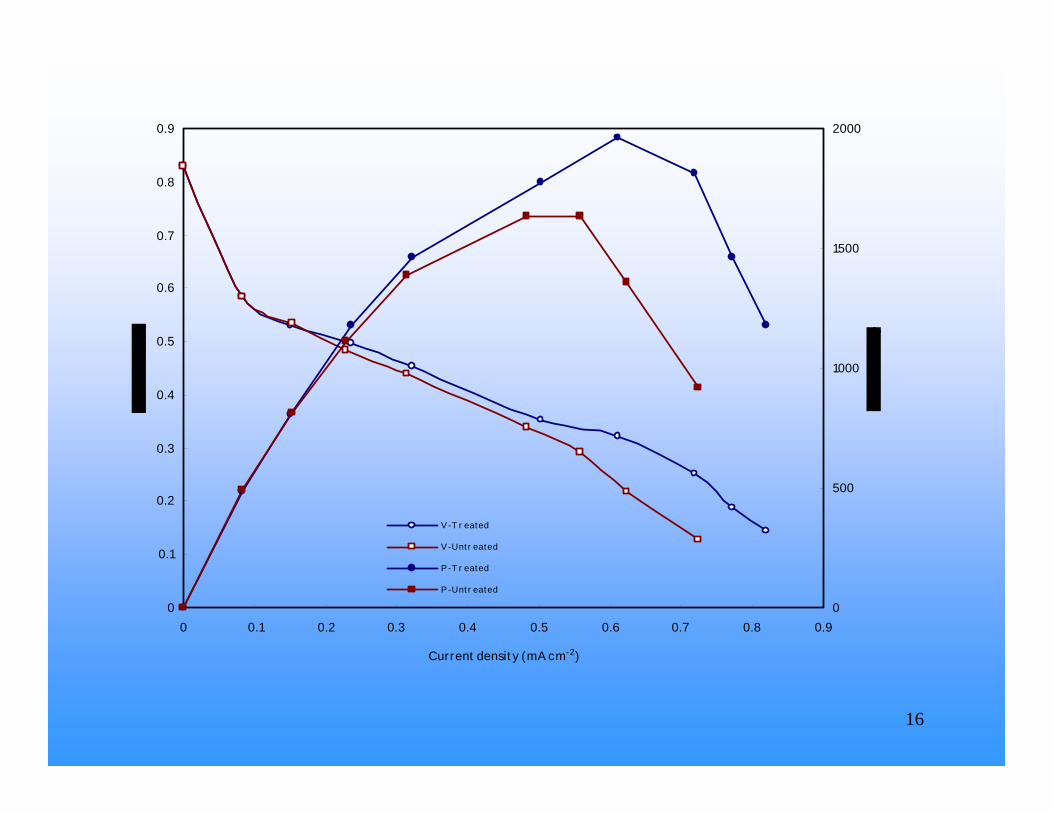
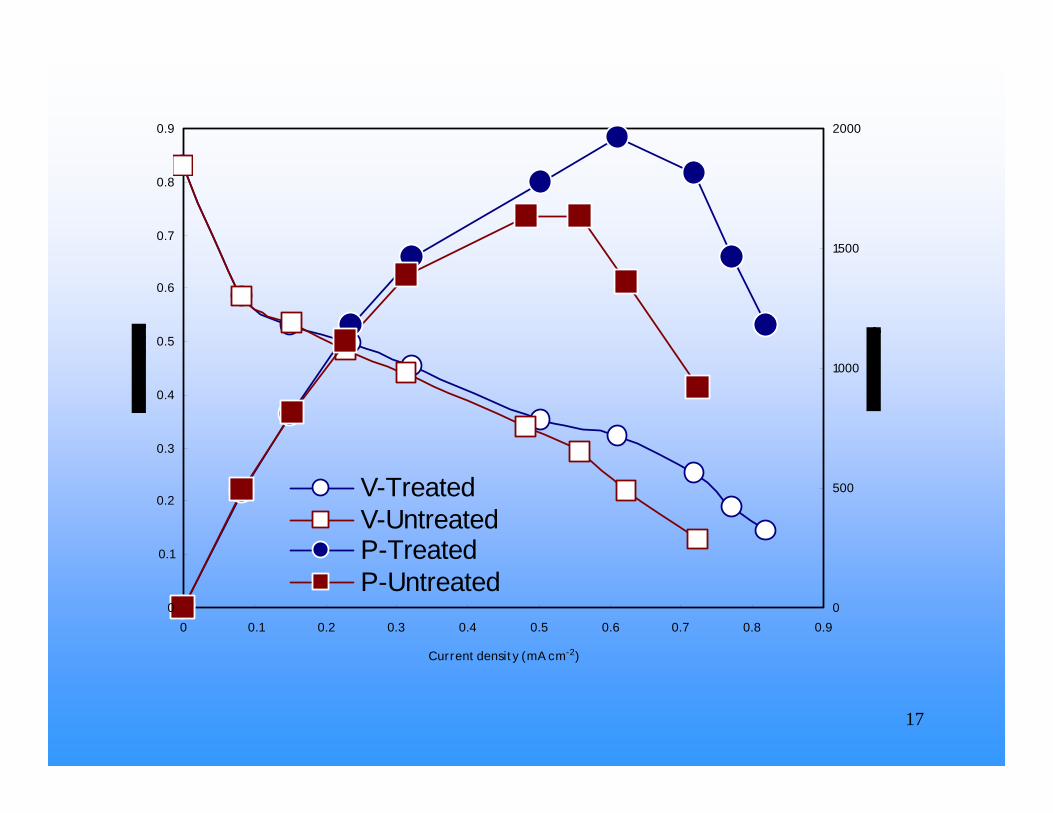
Graphs:
If you use the Excel default font size, it is probably too small!
16
0
0.1
0.2
0.3
0.4
0.5
0.6
0.7
0.8
0.9
0 0.1 0.2 0.3 0.4 0.5 0.6 0.7 0.8 0.9
Current densit y (mA cm-2)
0
500
1000
1500
2000
V-T r eated
V-Unt r eated
P-T r eated
P-Unt r eated
17
0
0.1
0.2
0.3
0.4
0.5
0.6
0.7
0.8
0.9
0 0.1 0.2 0.3 0.4 0.5 0.6 0.7 0.8 0.9
Current densit y (mA cm-2)
0
500
1000
1500
2000
V-TreatedV-UntreatedP-TreatedP-Untreated
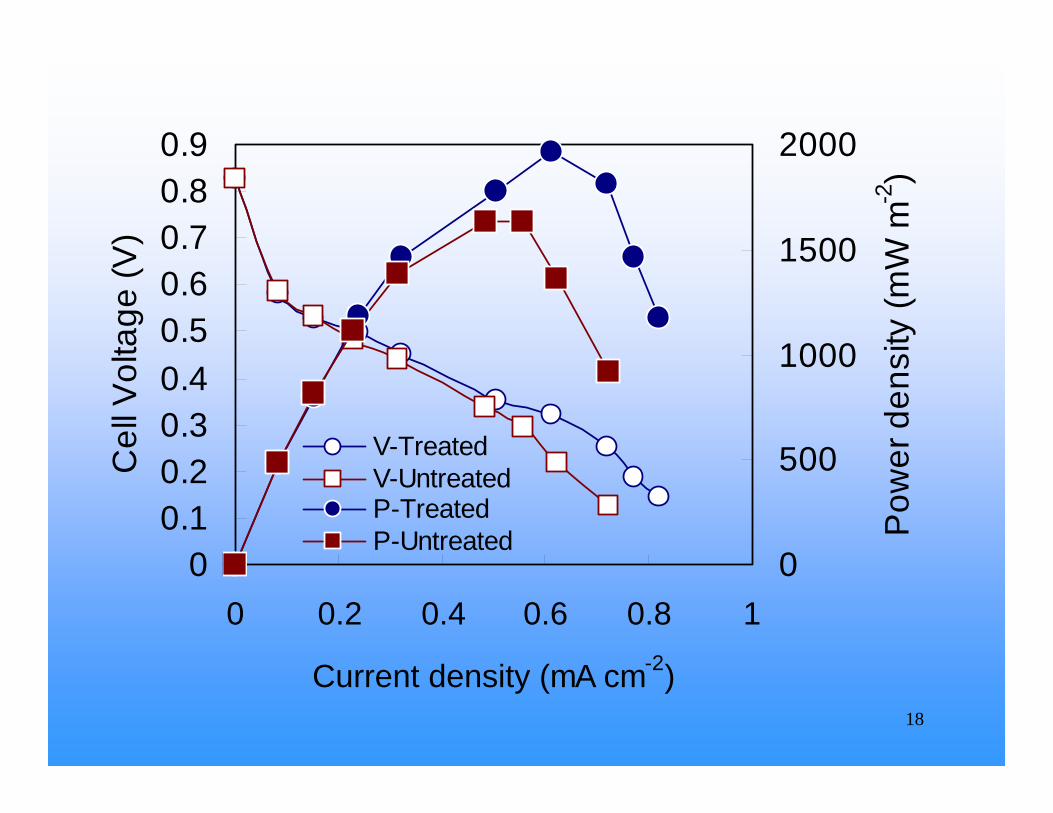
18
00.10.20.30.40.50.60.70.80.9
0 0.2 0.4 0.6 0.8 1
Current density (mA cm-2)
Cel
l Vol
tage
(V)
0
500
1000
1500
2000
Pow
er d
ensi
ty (m
W m
-2)
V-TreatedV-UntreatedP-TreatedP-Untreated
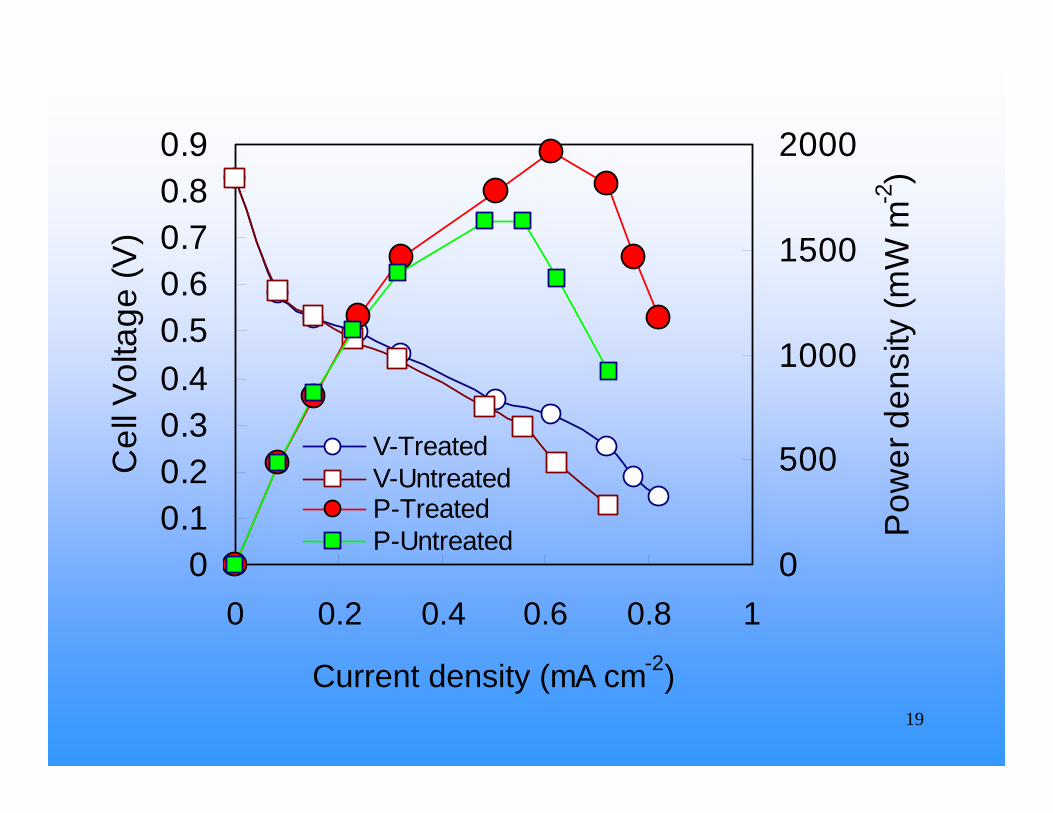
19
00.10.20.30.40.50.60.70.80.9
0 0.2 0.4 0.6 0.8 1
Current density (mA cm-2)
Cel
l Vol
tage
(V)
0
500
1000
1500
2000
Pow
er d
ensi
ty (m
W m
-2)
V-TreatedV-UntreatedP-TreatedP-Untreated
20
0.00000.10000.20000.30000.40000.50000.60000.70000.80000.9000
0.00 0.20 0.40 0.60 0.80 1.00
Current density (mA cm-2)
Cel
l Vol
tage
(V)
0.00
500.00
1000.00
1500.00
2000.00
Pow
er d
ensi
ty (m
W m
-2)
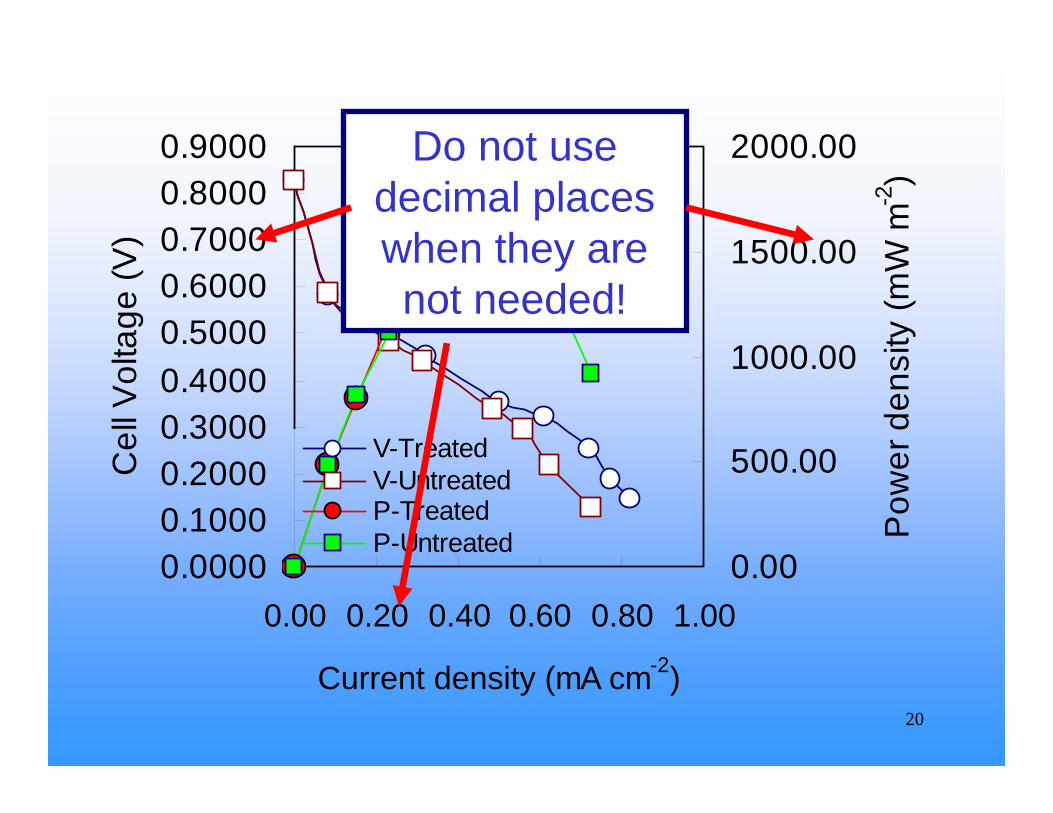
V-TreatedV-UntreatedP-TreatedP-Untreated
Do not use decimal places when they are not needed!
21
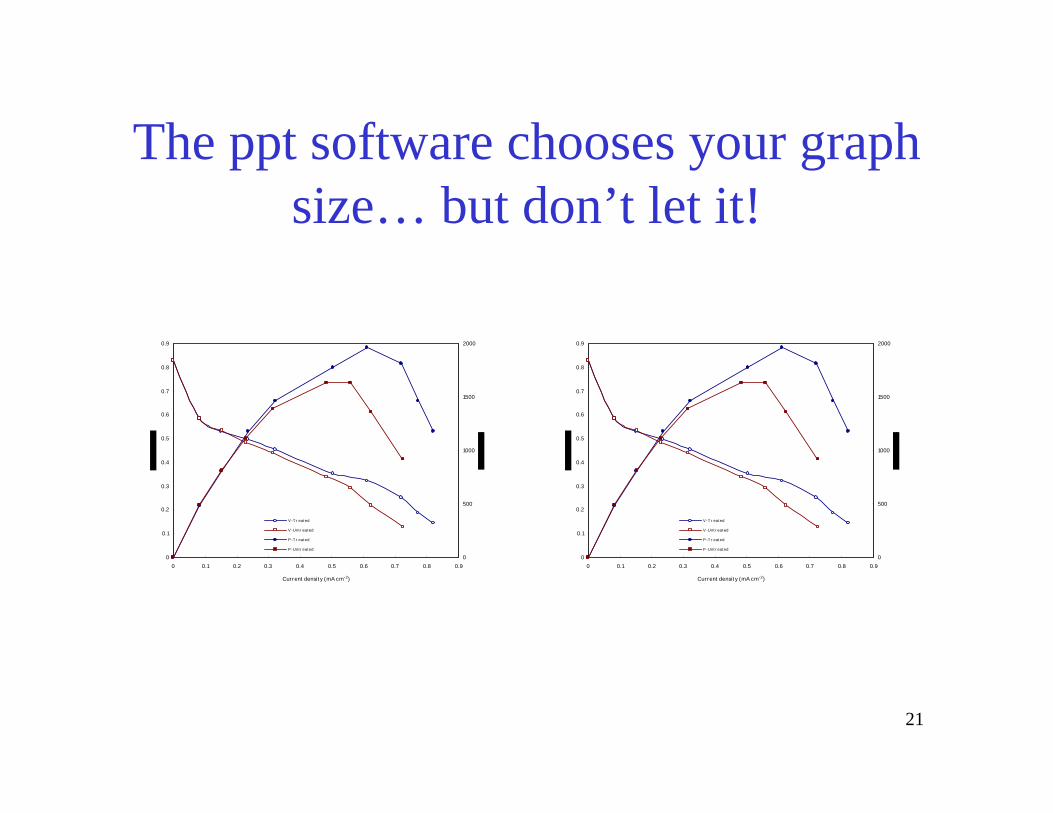
The ppt software chooses your graph size… but don’t let it!
0
0.1
0.2
0.3
0.4
0.5
0.6
0.7
0.8
0.9
0 0.1 0.2 0.3 0.4 0.5 0.6 0.7 0.8 0.9
Current densit y (mA cm-2)
0
500
1000
1500
2000
V-T r eated
V-Unt r eated
P-T r eated
P-Unt r eated
0
0.1
0.2
0.3
0.4
0.5
0.6
0.7
0.8
0.9
0 0.1 0.2 0.3 0.4 0.5 0.6 0.7 0.8 0.9
Current densit y (mA cm-2)
0
500
1000
1500
2000
V-T r eated
V-Unt r eated
P-T r eated
P-Unt r eated
22
00.10.20.30.40.50.60.70.80.9
0 0.2 0.4 0.6 0.8 1
Current density (mA cm-2)
Cel
l Vol
tage
(V)
0
500
1000
1500
2000
Pow
er d
ensi
ty (m
W m
-2)
V-TreatedV-UntreatedP-TreatedP-Untreated
00.10.20.30.40.50.60.70.80.9
0 0.2 0.4 0.6 0.8 1
Current density (mA cm-2)
Cel
l Vol
tage
(V)
0
500
1000
1500
2000
Pow
er d
ensi
ty (m
W m
-2)
V-TreatedV-UntreatedP-TreatedP-Untreated
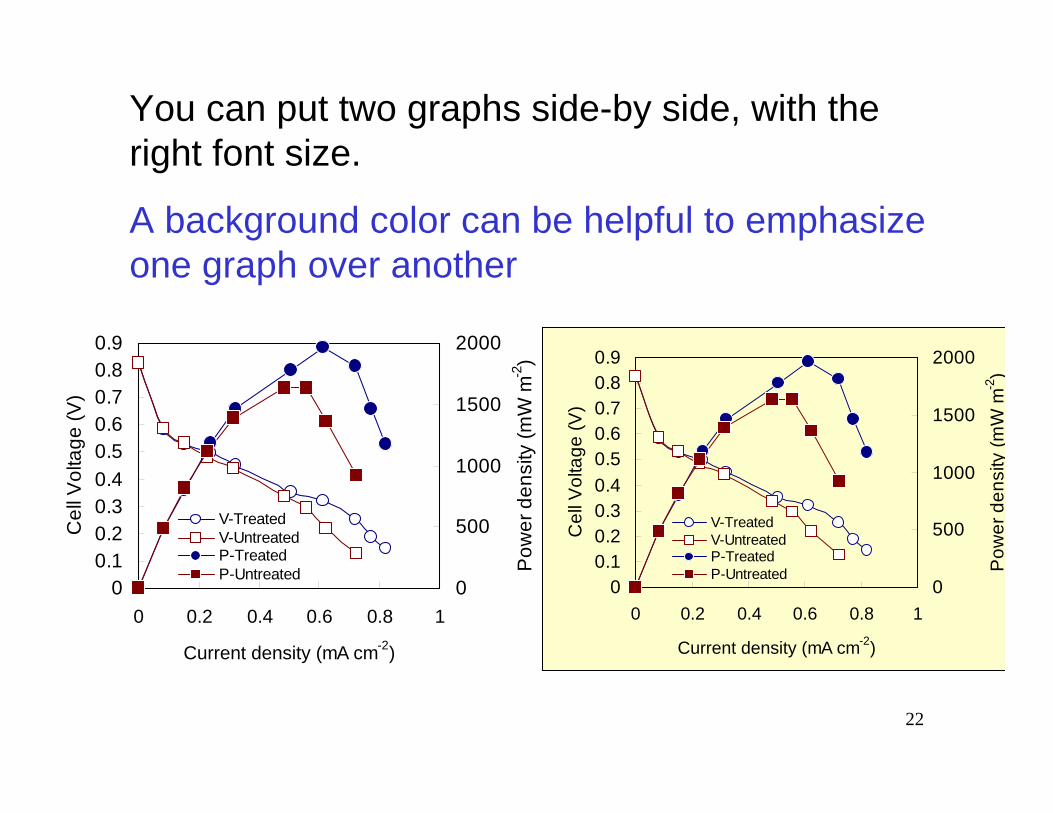
You can put two graphs side-by side, with the right font size.
A background color can be helpful to emphasize one graph over another
23
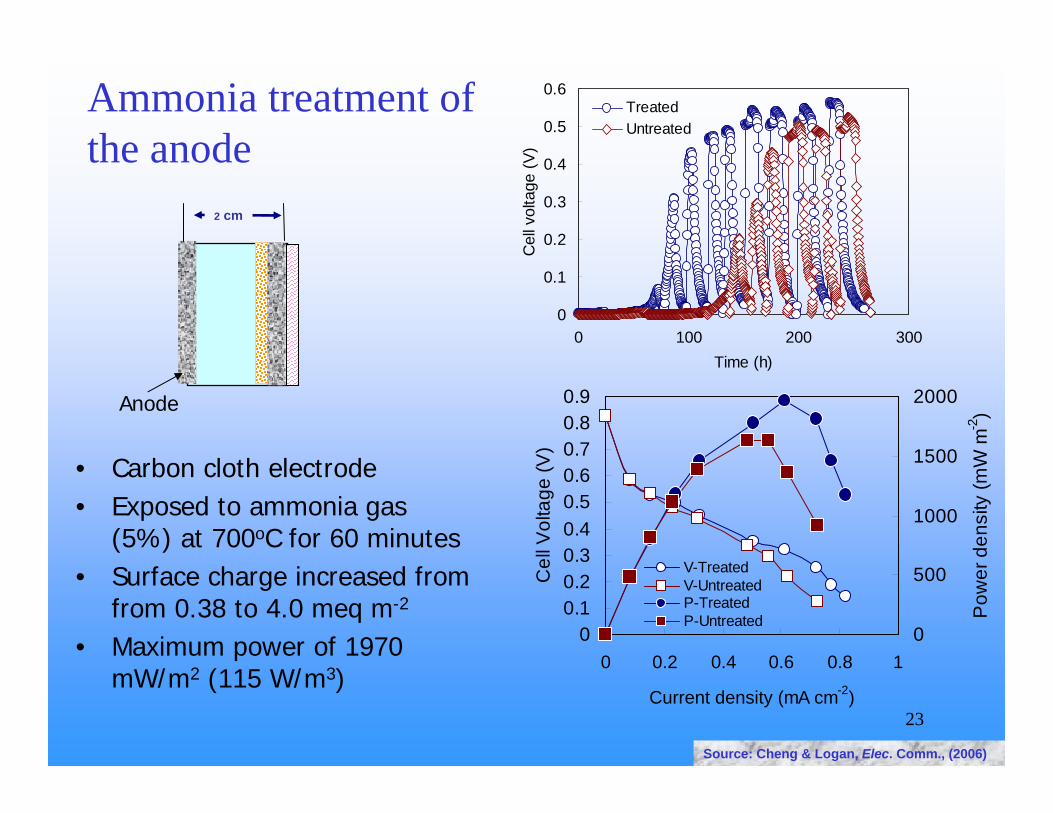
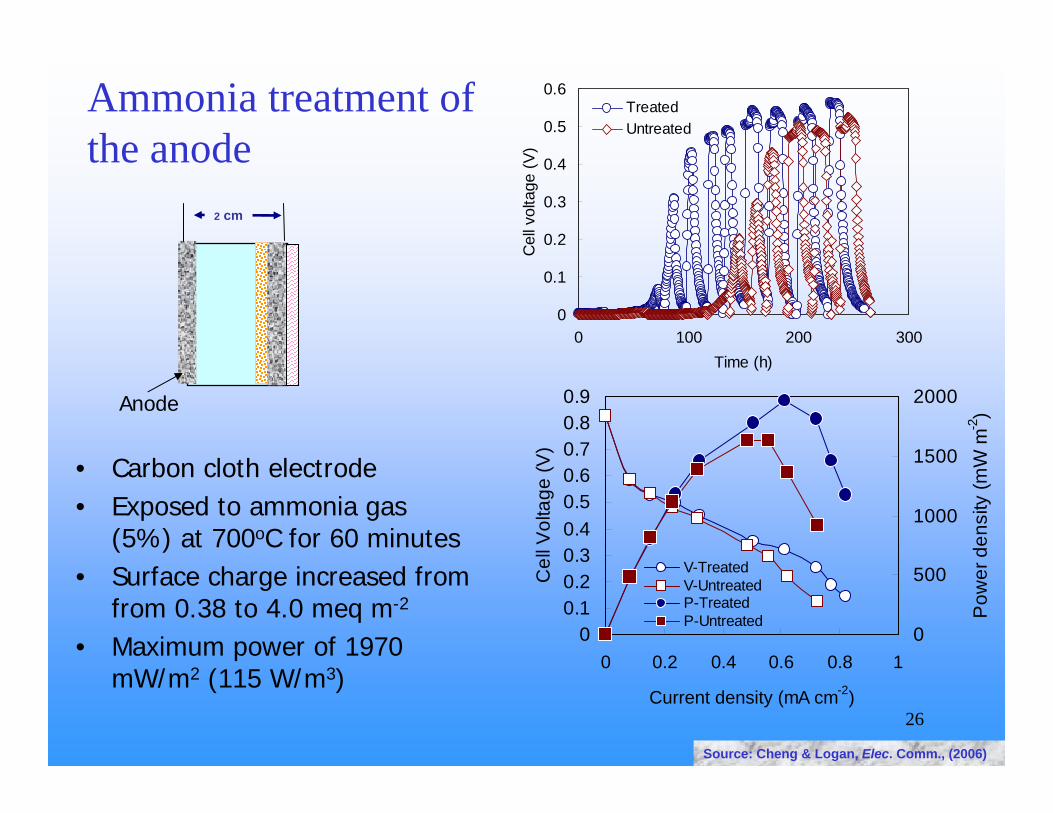
Ammonia treatment of the anode
0
0.1
0.2
0.3
0.4
0.5
0.6
0 100 200 300Time (h)
Cel
l vol
tage
(V)
TreatedUntreated
• Carbon cloth electrode• Exposed to ammonia gas
(5%) at 700oC for 60 minutes• Surface charge increased from
from 0.38 to 4.0 meq m-2
• Maximum power of 1970 mW/m2 (115 W/m3)
Anode
2 cm
Source: Cheng & Logan, Elec. Comm., (2006)
00.10.20.30.40.50.60.70.80.9
0 0.2 0.4 0.6 0.8 1
Current density (mA cm-2)
Cel
l Vol
tage
(V)
0
500
1000
1500
2000
Pow
er d
ensi
ty (m
W m
-2)
V-TreatedV-UntreatedP-TreatedP-Untreated
24
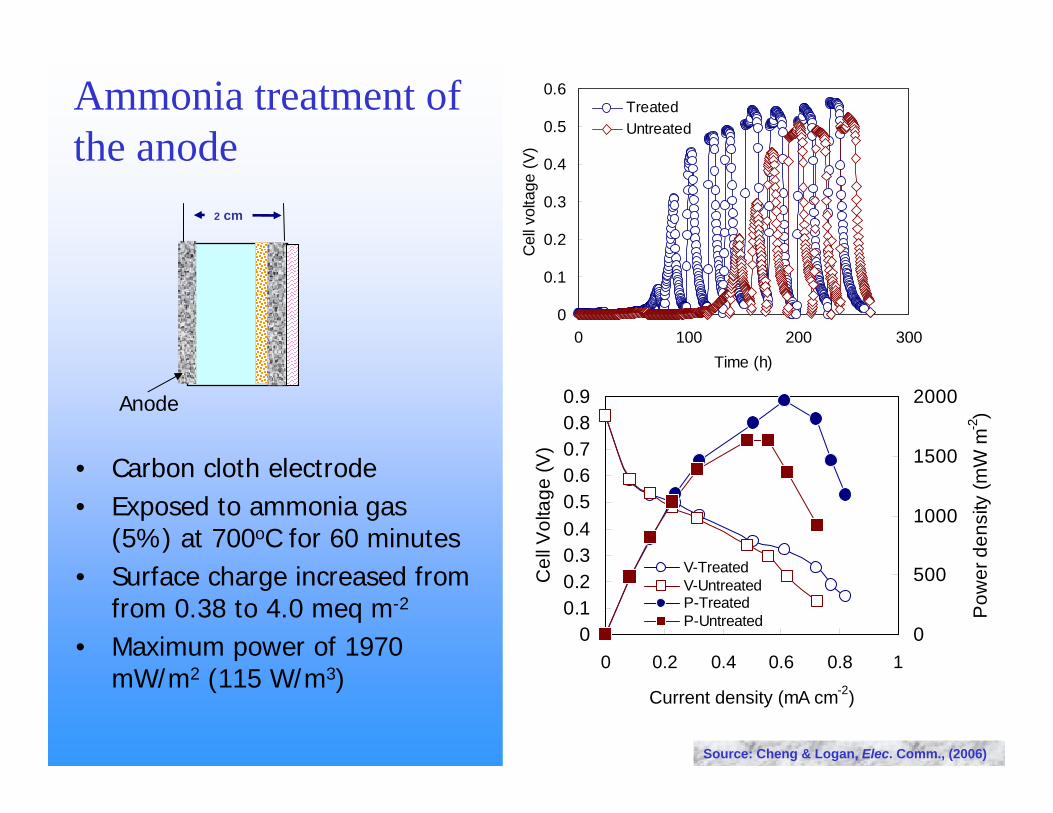
Ammonia treatment of the anode
0
0.1
0.2
0.3
0.4
0.5
0.6
0 100 200 300Time (h)
Cel
l vol
tage
(V)
TreatedUntreated
• Carbon cloth electrode• Exposed to ammonia gas
(5%) at 700oC for 60 minutes• Surface charge increased from
from 0.38 to 4.0 meq m-2
• Maximum power of 1970 mW/m2 (115 W/m3)
Anode
2 cm
Source: Cheng & Logan, Elec. Comm., (2006)
00.10.20.30.40.50.60.70.80.9
0 0.2 0.4 0.6 0.8 1
Current density (mA cm-2)
Cel
l Vol
tage
(V)
0
500
1000
1500
2000
Pow
er d
ensi
ty (m
W m
-2)
V-TreatedV-UntreatedP-TreatedP-Untreated
25
You can use “appear” to emphasize specific graphs during
your talk
26
Ammonia treatment of the anode
0
0.1
0.2
0.3
0.4
0.5
0.6
0 100 200 300Time (h)
Cel
l vol
tage
(V)
TreatedUntreated
• Carbon cloth electrode• Exposed to ammonia gas
(5%) at 700oC for 60 minutes• Surface charge increased from
from 0.38 to 4.0 meq m-2
• Maximum power of 1970 mW/m2 (115 W/m3)
Anode
2 cm
Source: Cheng & Logan, Elec. Comm., (2006)
00.10.20.30.40.50.60.70.80.9
0 0.2 0.4 0.6 0.8 1
Current density (mA cm-2)
Cel
l Vol
tage
(V)
0
500
1000
1500
2000
Pow
er d
ensi
ty (m
W m
-2)
V-TreatedV-UntreatedP-TreatedP-Untreated
27
Use motion paths and animation to help reinforce your point…
but don’t overdo it!
28
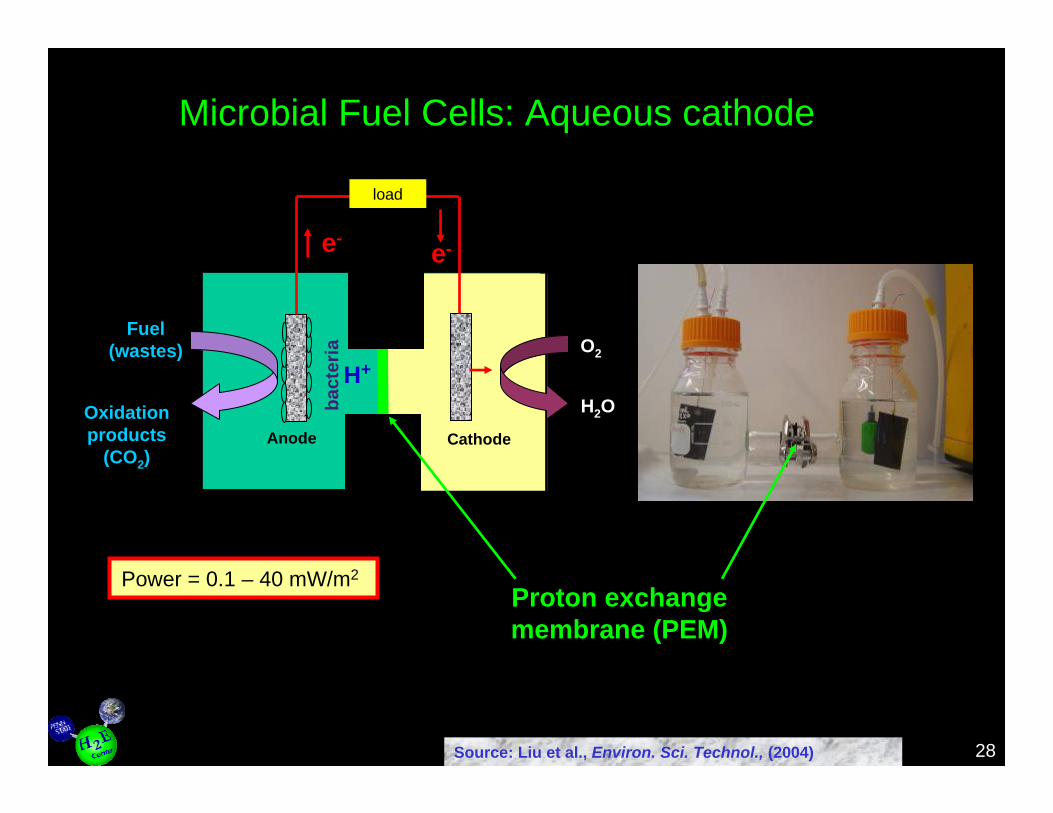
Microbial Fuel Cells: Aqueous cathode
Anode Cathode
bact
eria
Oxidation products
(CO2)
Fuel (wastes)
e-e-
O2
H2OH+
Source: Liu et al., Environ. Sci. Technol., (2004)
load
Proton exchange membrane (PEM)
Power = 0.1 – 40 mW/m2
29
load
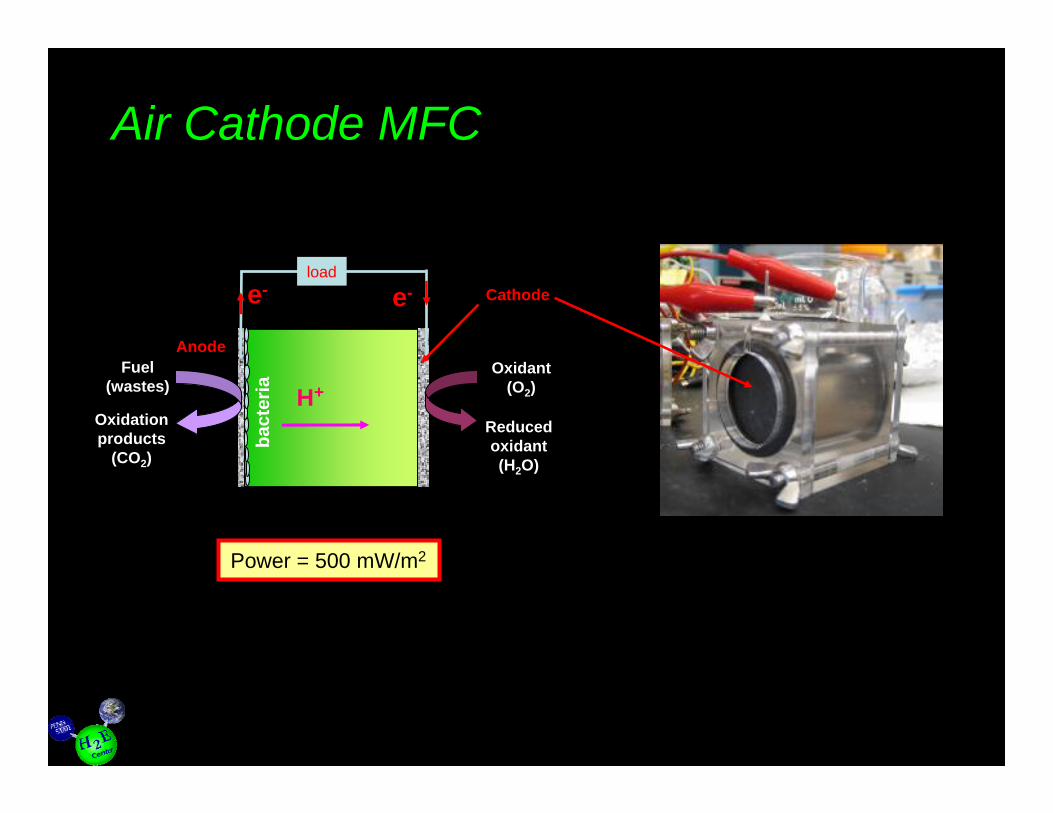
Anode
Cathode
bact
eria
Oxidation products
(CO2)
Fuel (wastes)
e-
Oxidant (O2)
Reduced oxidant (H2O)
H+
e-
Air Cathode MFC
Power = 500 mW/m2
30
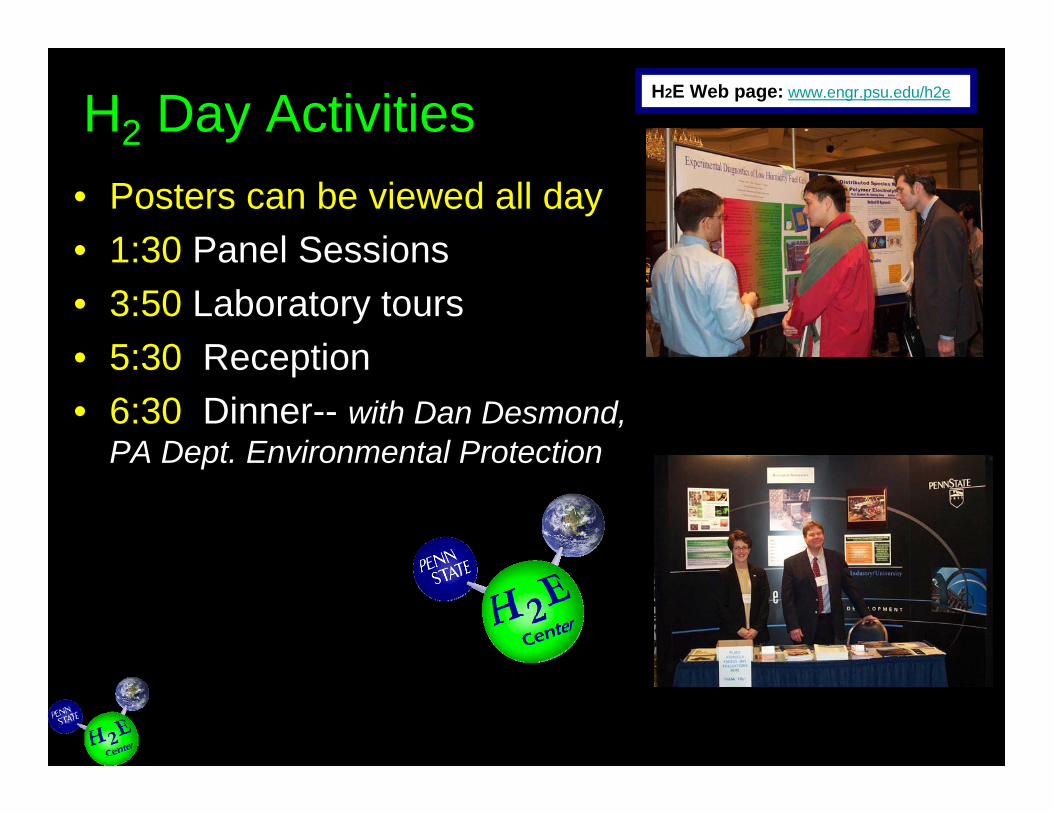
H2 Day Activities• Posters can be viewed all day• 1:30 Panel Sessions • 3:50 Laboratory tours• 5:30 Reception• 6:30 Dinner-- with Dan Desmond,
PA Dept. Environmental Protection
Posters on H2 Research
Booths and Displays
(Industrial Research Office)Congressman Peterson
H2E Web page: www.engr.psu.edu/h2e

31
H2 Day Activities• Posters can be viewed all day• 1:30 Panel Sessions • 3:50 Laboratory tours• 5:30 Reception• 6:30 Dinner-- with Dan Desmond,
PA Dept. Environmental Protection
Posters on H2 Research
Booths and Displays
(Industrial Research Office)Congressman Peterson
H2E Web page: www.engr.psu.edu/h2e
3232
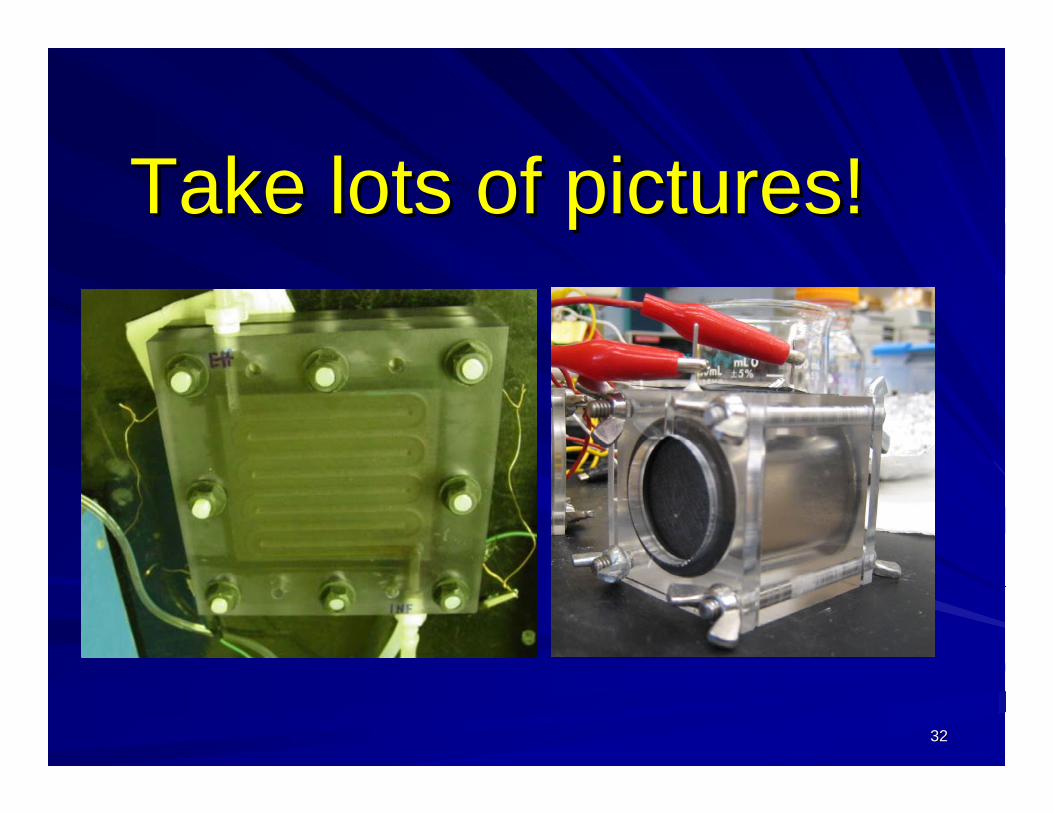
Take lots of pictures!Take lots of pictures!
33
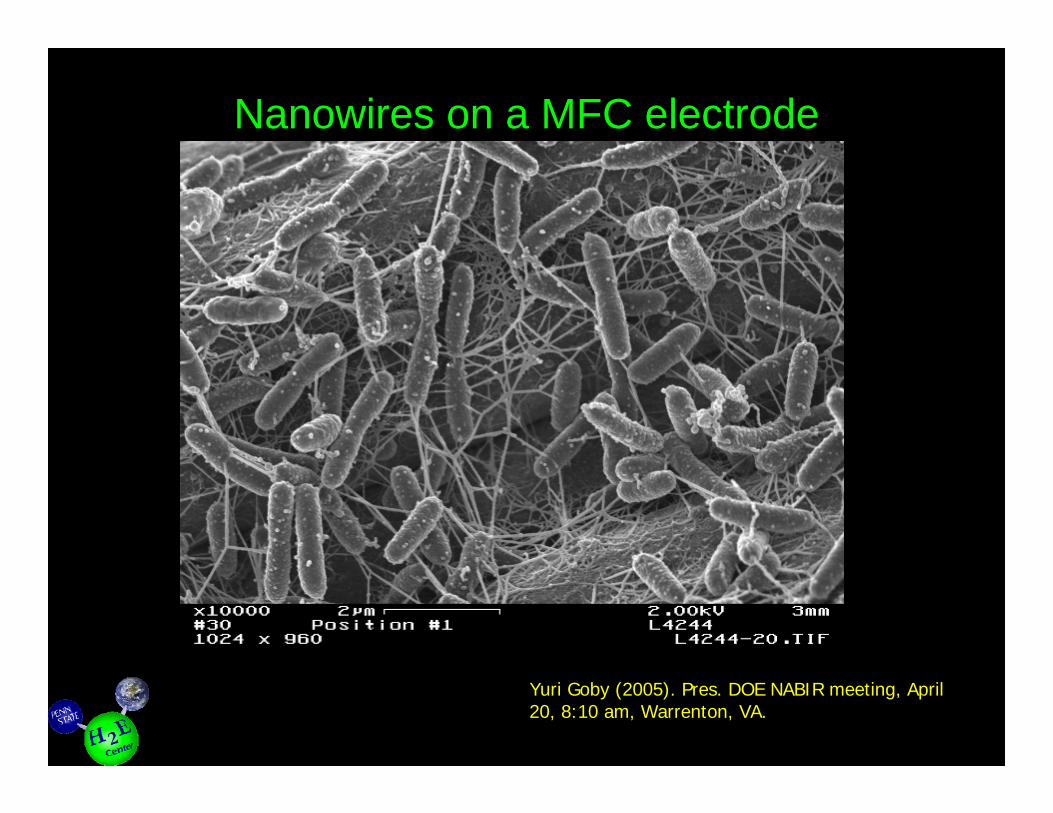
Nanowires on a MFC electrode
Yuri Goby (2005). Pres. DOE NABIR meeting, April 20, 8:10 am, Warrenton, VA.
www.lbl.gov/NABIR/generalinfo/annualmtg/05_ann_mtg.html.
34
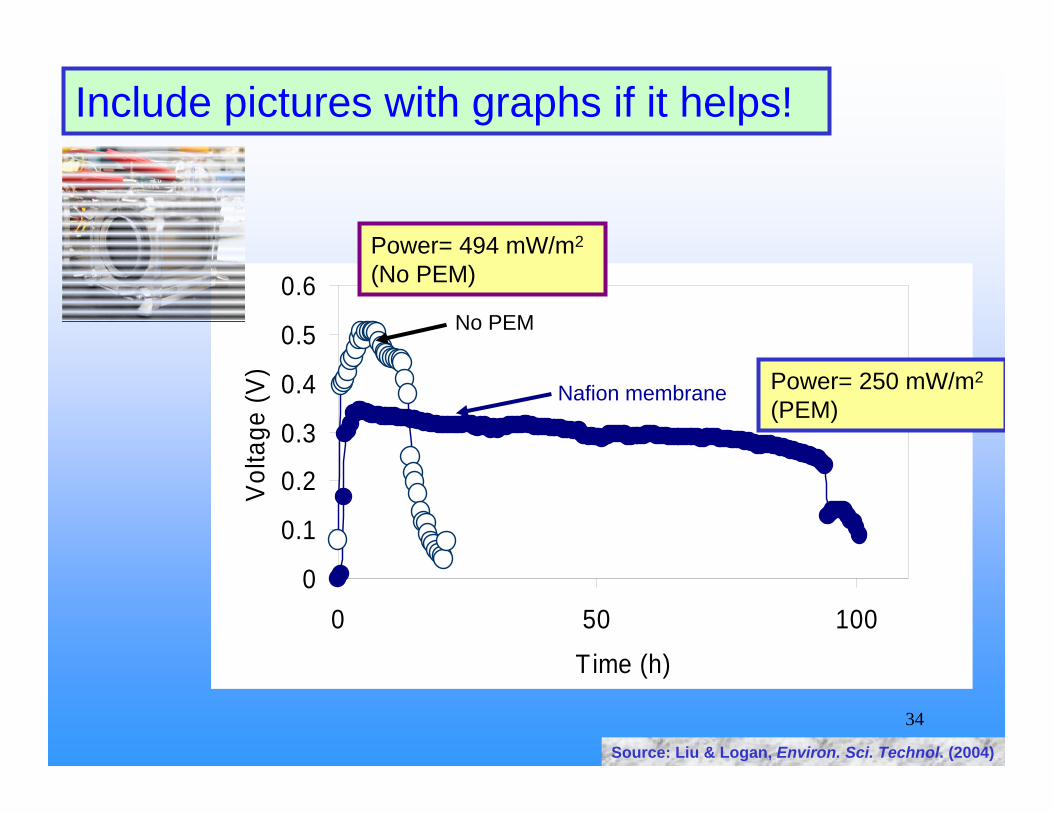
0
0.1
0.2
0.3
0.4
0.5
0.6
0 50 100
Time (h)
Vol
tage
(V)
Nafion membrane
No PEM
Power= 250 mW/m2
(PEM)
Power= 494 mW/m2
(No PEM)
Source: Liu & Logan, Environ. Sci. Technol. (2004)
Include pictures with graphs if it helps!
35
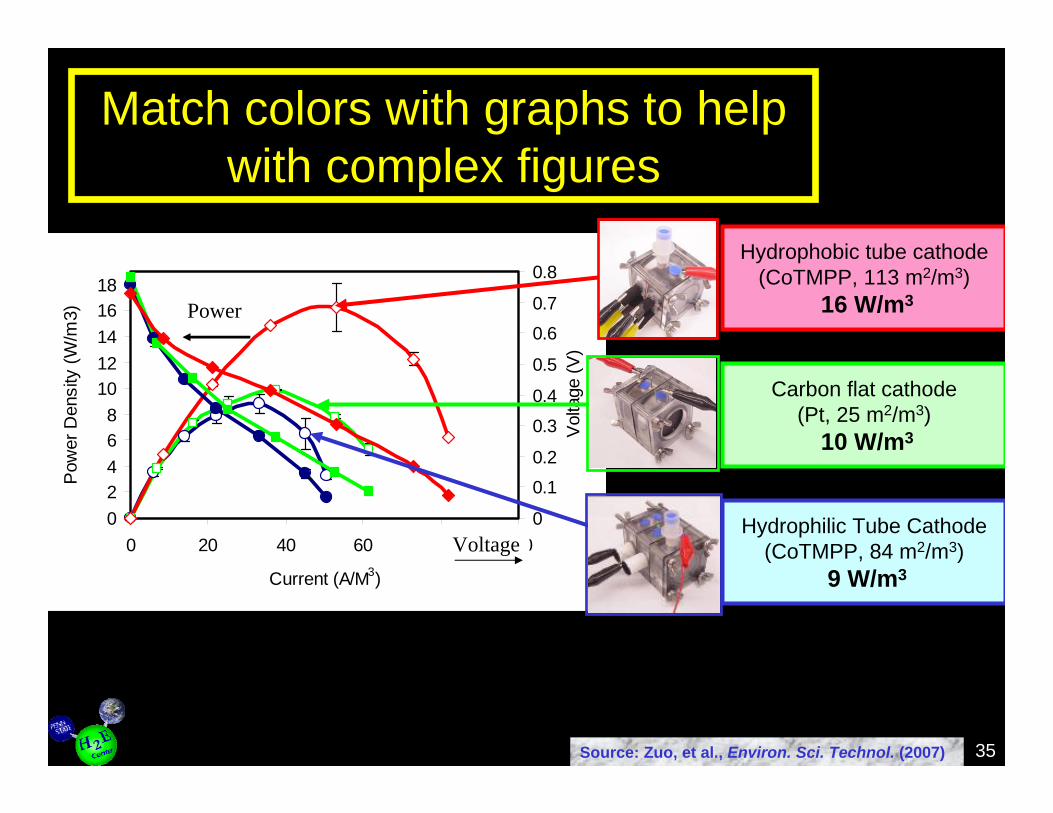
02468
1012141618
0 20 40 60 80 100
Current (A/M3)
Pow
er D
ensi
ty (W
/m3)
0
0.10.2
0.3
0.4
0.5
0.60.7
0.8
Vol
tage
(V)
Power
Voltage
Match colors with graphs to help with complex figures
Hydrophilic Tube Cathode(CoTMPP, 84 m2/m3)
9 W/m3
Carbon flat cathode(Pt, 25 m2/m3)
10 W/m3
Hydrophobic tube cathode(CoTMPP, 113 m2/m3)
16 W/m3
Source: Zuo, et al., Environ. Sci. Technol. (2007)
36
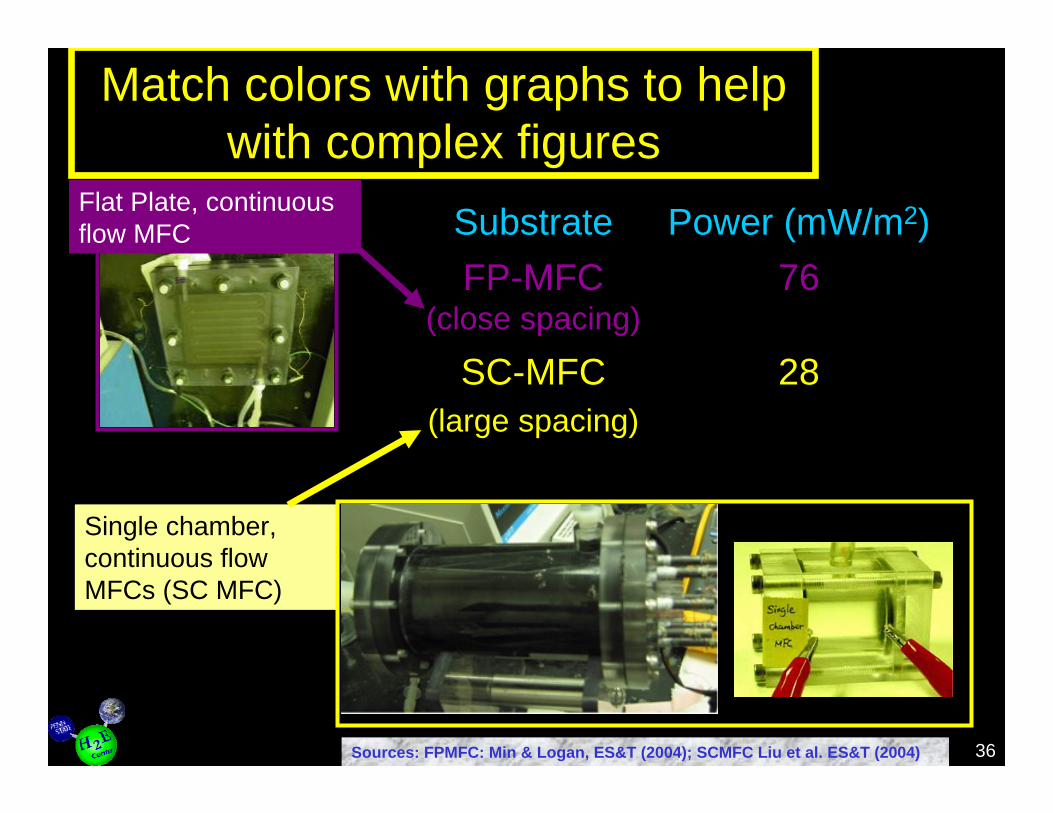
Single chamber, continuous flow MFCs (SC MFC)
76FP-MFC (close spacing)
28SC-MFC(large spacing)
Power (mW/m2)Substrate
Sources: FPMFC: Min & Logan, ES&T (2004); SCMFC Liu et al. ES&T (2004)
Flat Plate, continuous flow MFC
Match colors with graphs to help with complex figures
37
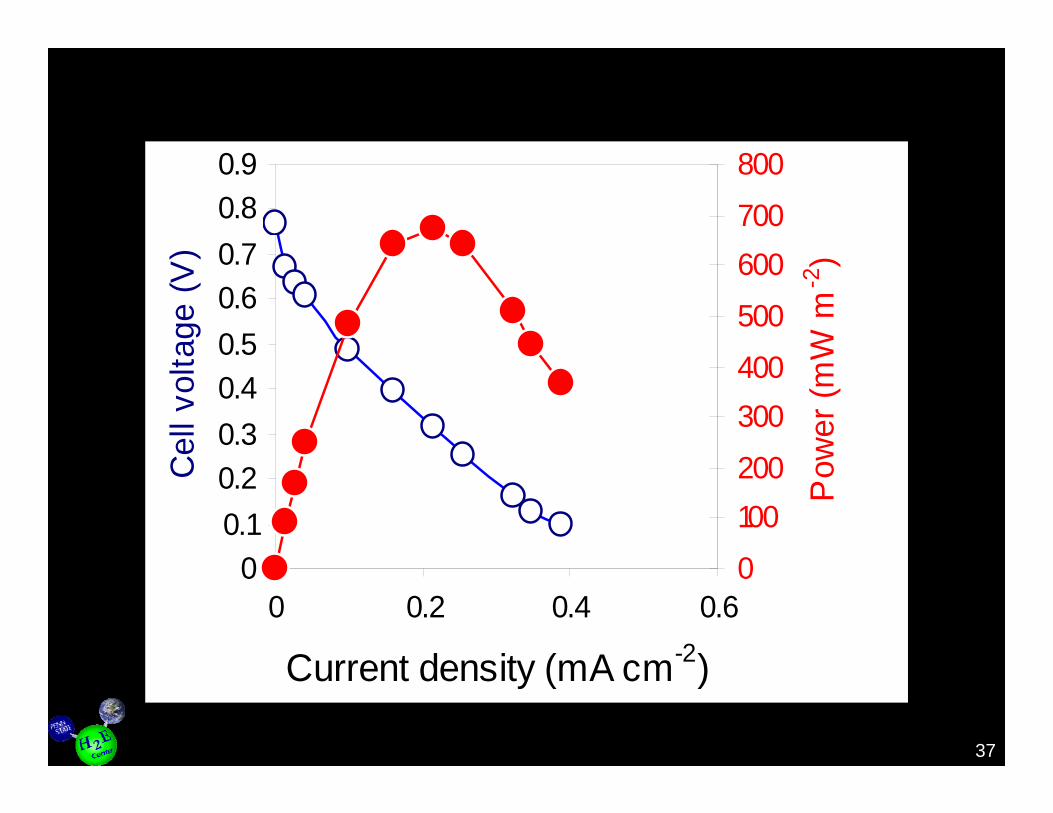
00.10.20.30.40.50.60.70.80.9
0 0.2 0.4 0.6
Current density (mA cm-2)
Cel
l vol
tage
(V)
0
100200
300400
500
600700
800
Pow
er (m
W m
-2)
38
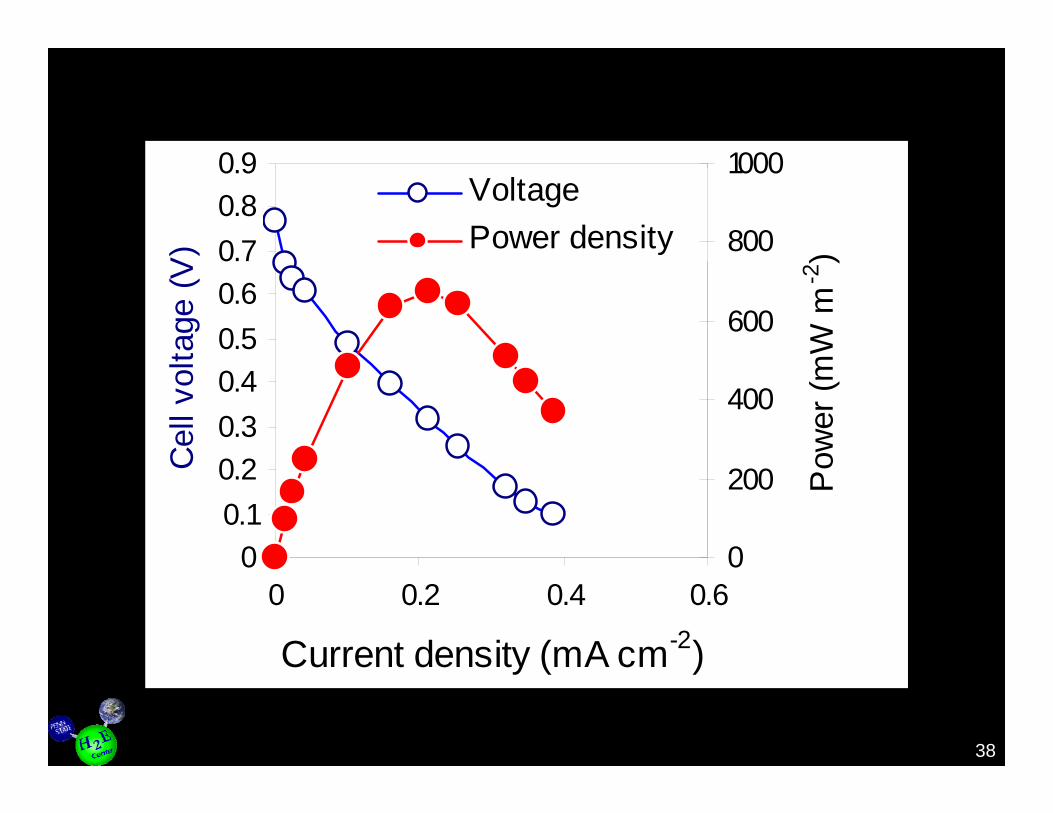
00.10.20.30.40.50.60.70.80.9
0 0.2 0.4 0.6
Current density (mA cm-2)
Cel
l vol
tage
(V)
0
200
400
600
800
1000
Pow
er (m
W m
-2)
VoltagePower density
39
Use a “screen capture” to obtain graphs or pictures from other
documents
40
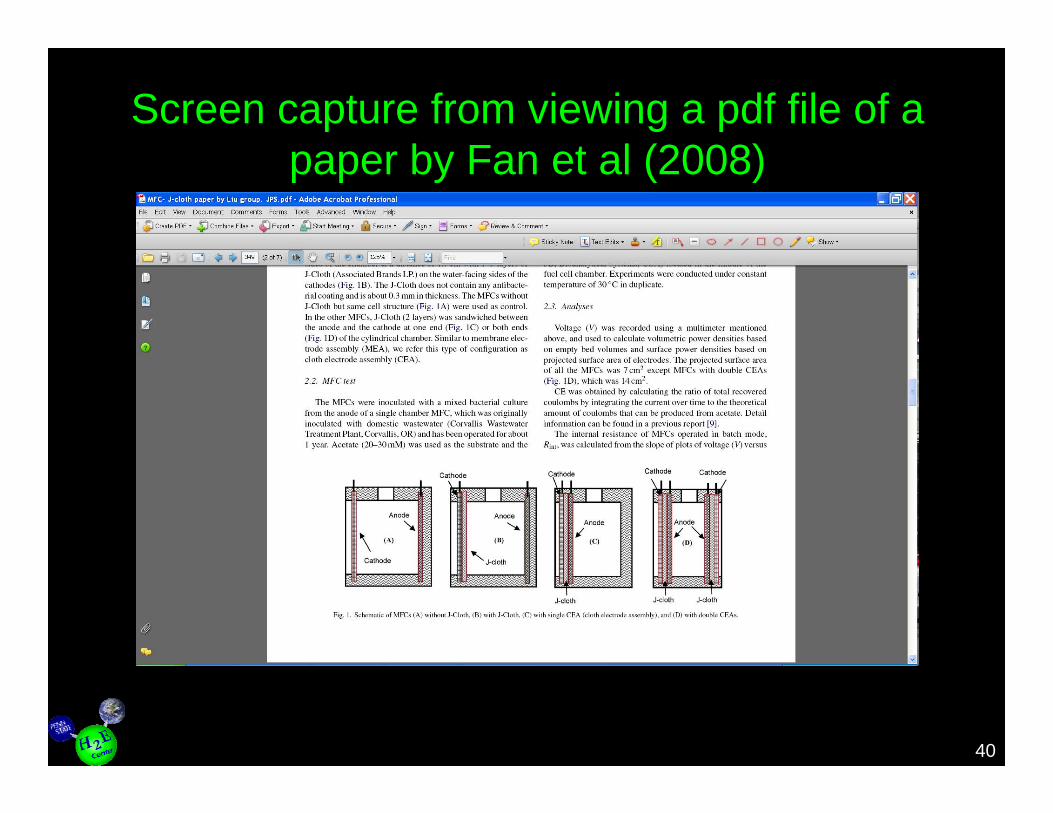
Screen capture from viewing a pdf file of a paper by Fan et al (2008)
41
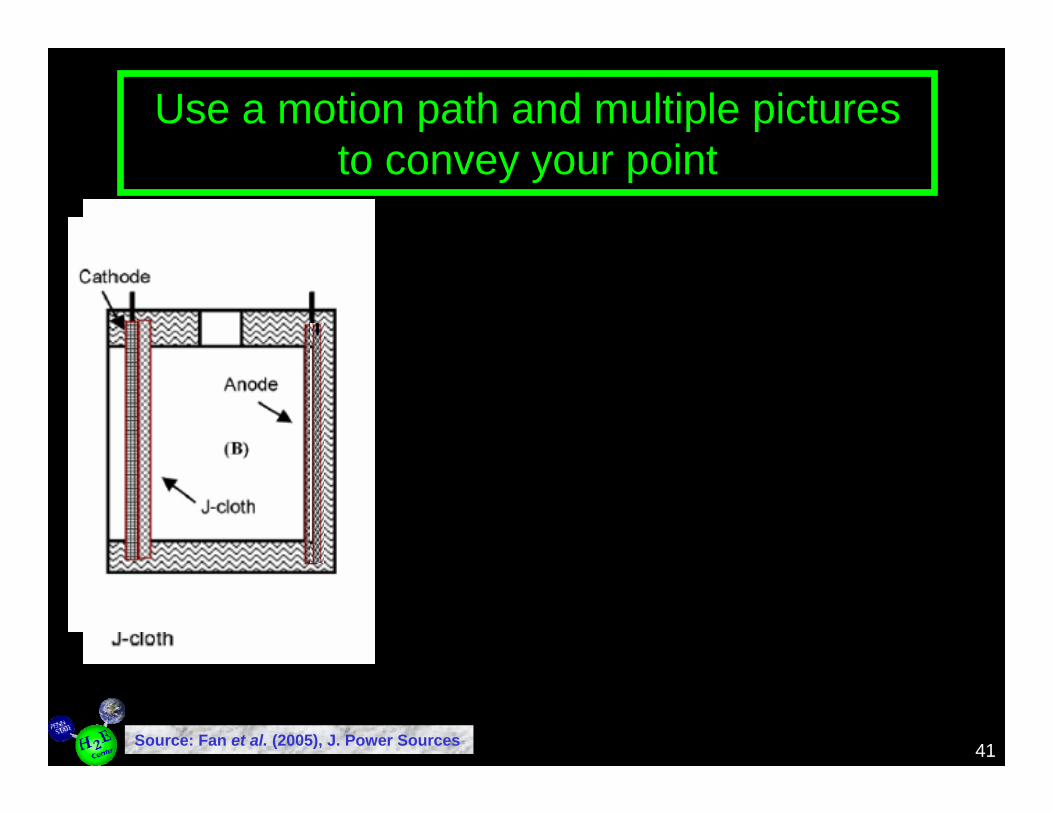
Use a motion path and multiple pictures to convey your point
Source: Fan et al. (2005), J. Power Sources
42
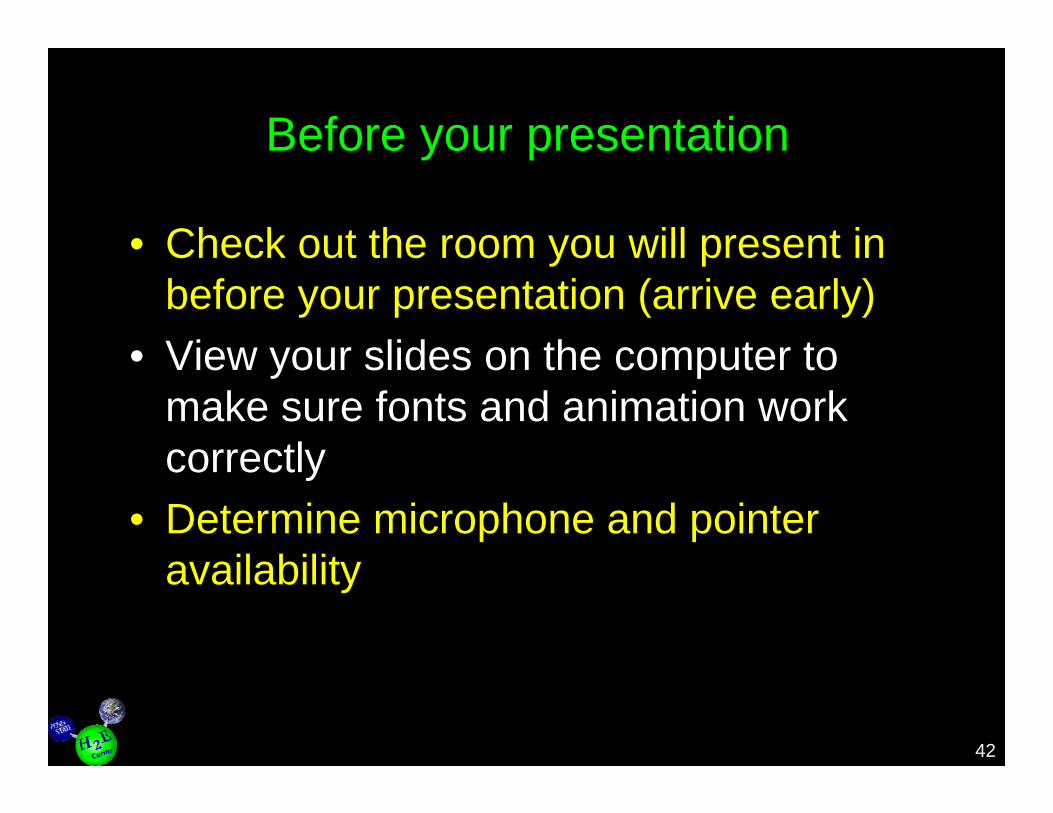
Before your presentation
• Check out the room you will present in before your presentation (arrive early)
• View your slides on the computer to make sure fonts and animation work correctly
• Determine microphone and pointer availability
43
Starting your presentation
• If your name and presentation title have just been given, don’t repeat them (unless they are incorrect)
• If you are nervous, memorize your first two sentences… after that, it gets easier.
• Adjust your explanation of material based on previous presenters (if they just explained how an MFC works, don’t spend much time on it)
44
Speaking pointers
• Look at your audience• Talk to the audience, not the projector
screen behind you.• Use the laptop screen as your
“teleprompter” as it is in front of you.• Consider using the mouse as a pointer
instead of a laser pointer so you don’t have to turn around
45
When using a microphone
• Keep a constant distance to the podium microphone
• If using a mobile microphone, don’t change your voice direction relative to the location of the microphone
• Put the microphone on the side that is closest to the projector screen

46
Make the point of your slide clear, so that the slide is understood even if
the audience has trouble understanding your accent
47
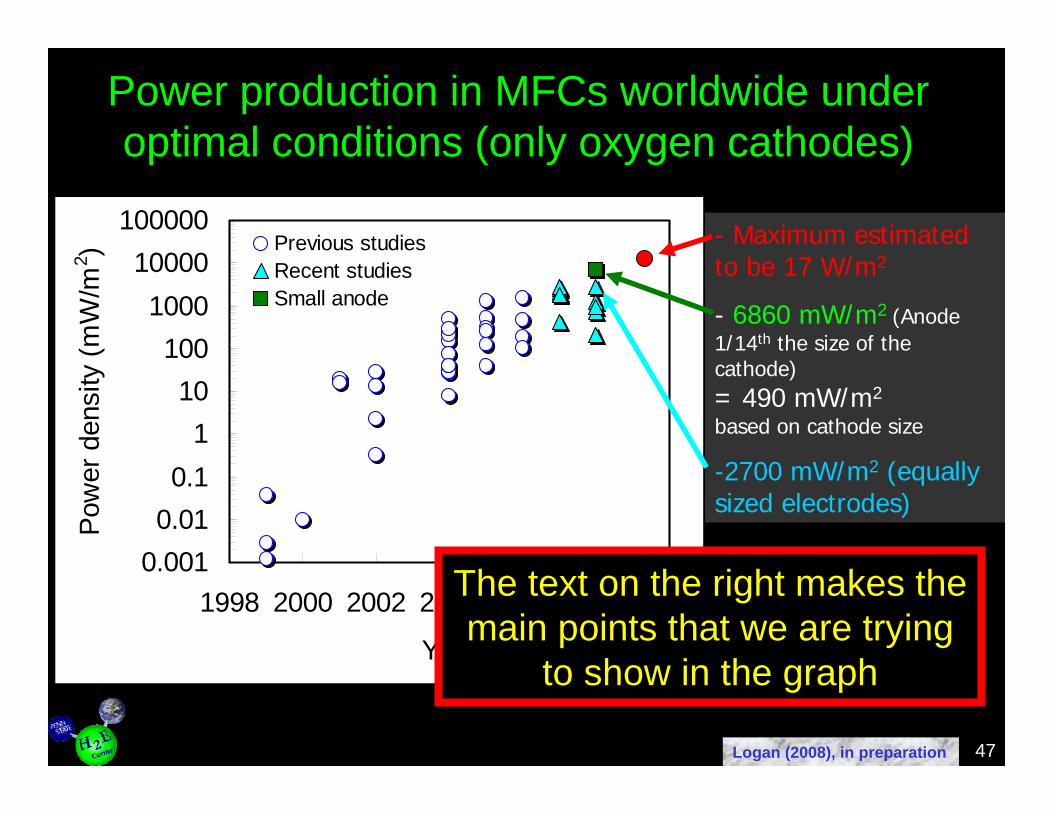
- Maximum estimated to be 17 W/m2
- 6860 mW/m2 (Anode 1/14th the size of the cathode)= 490 mW/m2
based on cathode size
-2700 mW/m2 (equally sized electrodes)
0.0010.010.1
110
1001000
10000100000
1998 2000 2002 2004 2006 2008 2010
Year
Pow
er d
ensi
ty (m
W/m
2 ) Previous studiesRecent studiesSmall anode
Power production in MFCs worldwide under optimal conditions (only oxygen cathodes)
Logan (2008), in preparation
The text on the right makes the main points that we are trying
to show in the graph
48
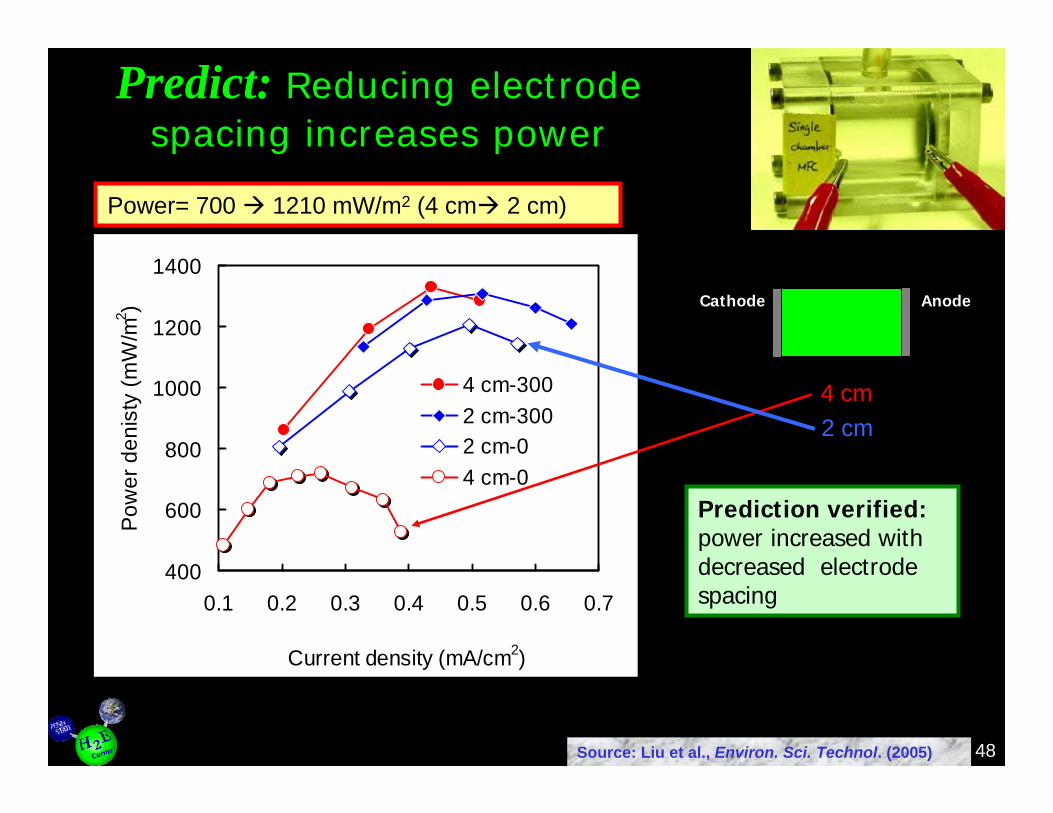
Predict: Reducing electrode spacing increases power
400
600
800
1000
1200
1400
0.1 0.2 0.3 0.4 0.5 0.6 0.7
Current density (mA/cm2)
Pow
er d
enis
ty (m
W/m
2 )
4 cm-3002 cm-3002 cm-04 cm-0
4 cm2 cm
Power= 700 1210 mW/m2 (4 cm 2 cm)
Prediction verified:power increased with decreased electrode spacing
Source: Liu et al., Environ. Sci. Technol. (2005)
Cathode Anode

49
When answering questions
• Don’t rush into an explanation… think for a few moments. It is okay.
• If the questions may not be clear to others, restate the question. This can also help you to focus on the main points.
• Putting slide numbers on your slides helps people to ask about specific slidess
50
Sometimes it is useful to vary spacing in a set of bulleted items
• Lets use the previous slide as an example…

51
When answering questions
• Don’t rush into an explanation… think for a few moments. It is okay.
• If the questions may not be clear to others, restate the question. This can also help you to focus on the main points.
• Putting slide numbers on your slides helps people to ask about specific slides
52
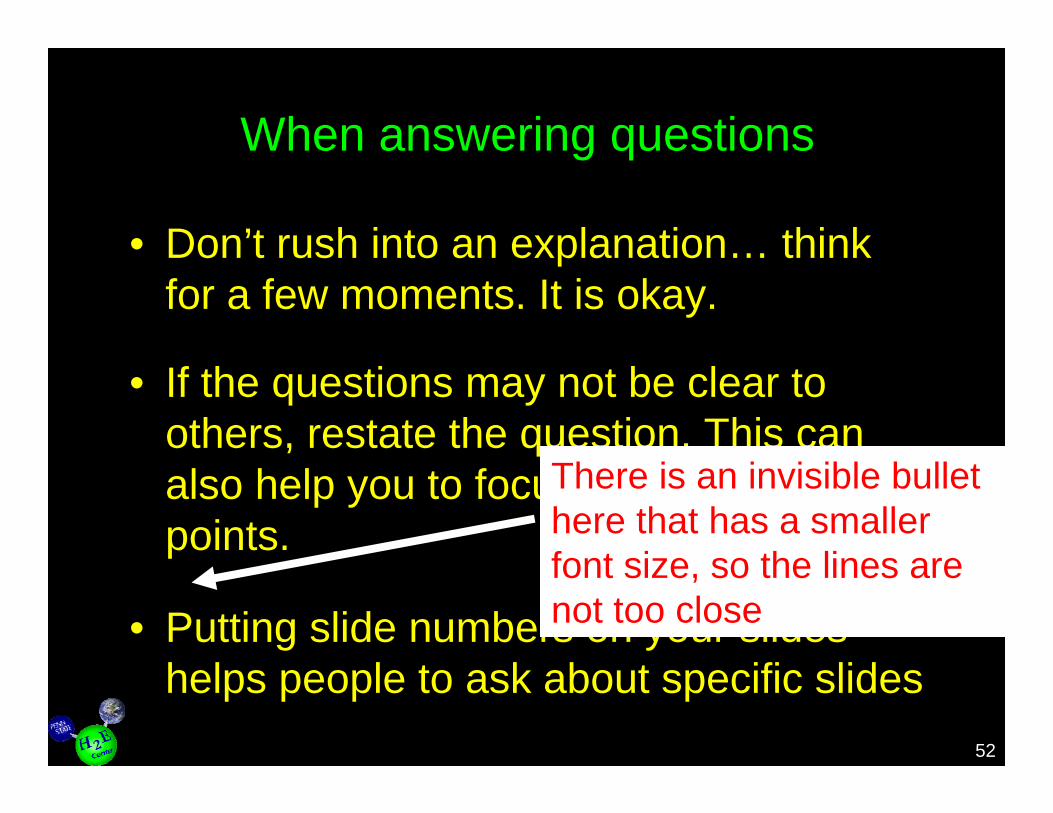
When answering questions
• Don’t rush into an explanation… think for a few moments. It is okay.
• If the questions may not be clear to others, restate the question. This can also help you to focus on the main points.
• Putting slide numbers on your slides helps people to ask about specific slides
There is an invisible bullet here that has a smaller font size, so the lines are not too close

53
Be sure to acknowledge colleagues and funding sources
Use your last slide to provide contact information (email address or
websites)
54
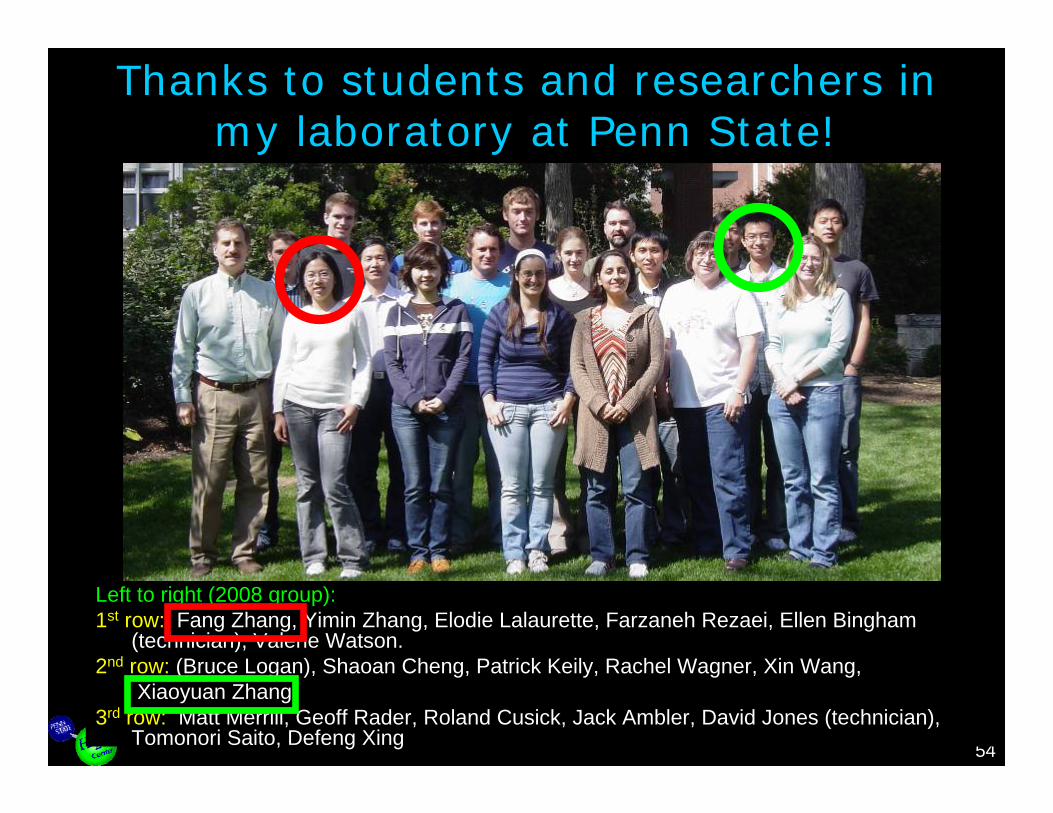
Thanks to students and researchers in my laboratory at Penn State!
Left to right (2008 group):1st row: Fang Zhang, Yimin Zhang, Elodie Lalaurette, Farzaneh Rezaei, Ellen Bingham
(technician), Valerie Watson.2nd row: (Bruce Logan), Shaoan Cheng, Patrick Keily, Rachel Wagner, Xin Wang,
Xiaoyuan Zhang3rd row: Matt Merrill, Geoff Rader, Roland Cusick, Jack Ambler, David Jones (technician),
Tomonori Saito, Defeng Xing
55
Questions ?Email: [email protected]
Logan web page: www.engr.psu.edu/ce/enve/logan.htm
International MFC site:www.microbialfuelcell.org
MFC webcam (live video of an MFC running a fan)
www.engr.psu.edu/mfccam