Mahindra & Mahindra Financial Services · PDF file1 Mahindra & Mahindra Financial Services...
43
1 Mahindra & Mahindra Financial Services Limited Quarter Result Update DECEMBER - 2015 Corporate Office: Mahindra Towers, 4 th Floor, Dr. G. M. Bhosale Marg, Worli, Mumbai 400 018 India Tel: +91 22 66526000 Fax: +91 22 24953608 Email: [email protected] Regd. Office: Gateway Building, Apollo Bunder, Mumbai 400 001 India Tel: +91 22 2289 5500 Fax: +91 22 2287 5485 www.mahindrafinance.com CIN - L65921MH1991PLC059642
Transcript of Mahindra & Mahindra Financial Services · PDF file1 Mahindra & Mahindra Financial Services...
1
Mahindra & Mahindra Financial
Services Limited
Quarter Result Update
DECEMBER - 2015
Corporate Office: Mahindra Towers, 4th Floor, Dr. G. M. Bhosale Marg, Worli, Mumbai 400 018 India Tel: +91 22 66526000 Fax: +91 22 24953608 Email: [email protected]
Regd. Office: Gateway Building, Apollo Bunder, Mumbai 400 001 India Tel: +91 22 2289 5500 Fax: +91 22 2287 5485 www.mahindrafinance.com CIN - L65921MH1991PLC059642
2
Company overview
Transforming rural lives
across the country

3
Background
• Mahindra & Mahindra Financial Services Limited (“MMFSL”) is a subsidiary of Mahindra and Mahindra Limited (Mcap: Rs 715 billion)*, one of India’s leading tractor and utility vehicle manufacturers
• MMFSL (Mcap: Rs 125 billion)* is one of India’s leading non-banking finance companies focused in the rural and semi-urban sector
• Primarily in the business of financing purchase of new and pre-owned auto and utility vehicles, tractors, cars, commercial vehicles, construction equipments and SME Financing
• MMFSL’s vision is to be a leading provider of financial services in the rural and semi-urban areas of India
• Has 1179 offices covering 25 states and 5 union territories in India, with over 4.0 million customer contracts since inception, as of December 31, 2015
• India Ratings has assigned AAA(ind)/Stable, CARE Ratings has assigned AAA, Brickwork has assigned AAA/Stable and CRISIL has assigned AA+/Stable rating to the Company’s long term and subordinated debt
*Source: Market capitalisation as of January 20, 2016 from BSE website

4
MMFSL Group structure
Note:
1. Balance 15% with Inclusion Resources Pvt. Ltd.,a subsidiary of Leapfrog Financial Inclusion Fund, incorporated in Singapore.
2. Balance 12.5% with National Housing Bank (NHB)
3. Pursuant to the scheme of amalgamation of erstwhile Mahindra Business & Consulting Services Private Ltd. (MBCSPL), a wholly owned subsidiary,
with the Company, all the assets and liabilities, including reserves, of MBCSPL were transferred and vested in the Company effective from appointed
date 01st April, 2014. The Scheme became effective upon filing with the Registrar of Companies on 18th April, 2015
85%(1)
87.5%(2)
100%
51.20%
49%
Mahindra Insurance
Brokers Limited
(“MIBL”)
Mahindra Rural
Housing Finance
Limited (“MRHFL”)
Mahindra Finance
USA LLC
(Joint venture with
Rabobank group
subsidiary)
Mahindra & Mahindra
Financial Services Limited Mahindra Asset
Management
Company Pvt. Ltd
100%
Mahindra Trustee
Company Pvt. Ltd
Mahindra & Mahindra Limited
5
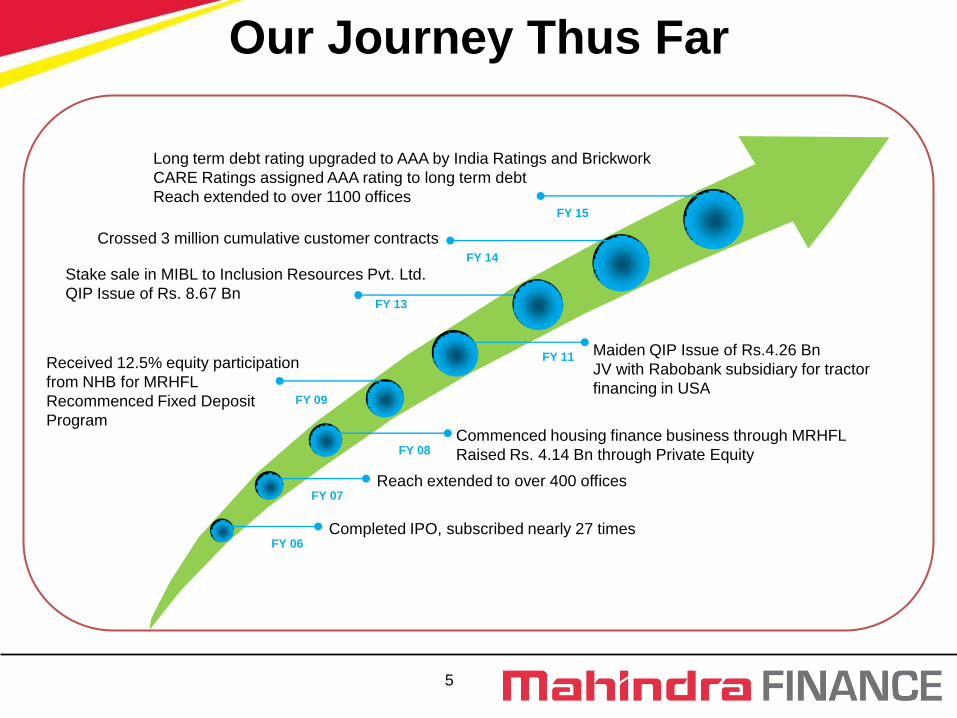
Our Journey Thus Far
FY 07
FY 08
FY 09
FY 11
FY 13
Completed IPO, subscribed nearly 27 times
Reach extended to over 400 offices
Commenced housing finance business through MRHFL
Raised Rs. 4.14 Bn through Private Equity
Received 12.5% equity participation
from NHB for MRHFL
Recommenced Fixed Deposit
Program
Maiden QIP Issue of Rs.4.26 Bn
JV with Rabobank subsidiary for tractor
financing in USA
FY 06
FY 14
Crossed 3 million cumulative customer contracts
FY 15
Long term debt rating upgraded to AAA by India Ratings and Brickwork
CARE Ratings assigned AAA rating to long term debt
Reach extended to over 1100 offices
Stake sale in MIBL to Inclusion Resources Pvt. Ltd.
QIP Issue of Rs. 8.67 Bn

6
Shareholding pattern (as on December 31, 2015)
Top 10 Shareholders
Amansa Holdings Private Limited
Franklin Templeton Investment Funds
Aranda Investments (Mauritius) PTE Ltd
JP Morgan Sicav Investment Company (Mauritius)
Life Insurance Corporation Of India
Bank Muscat S A O G A/C Bankmuscat India Fund
FIL Investments (Mauritius) Ltd
JP Morgan India Fund
Stichting Depositary Apg Emerging Markets Equity
Vanguard Emerging Markets Stock Index Fund,
Aserie
Mahindra &
Mahindra51.2%
FIIs33.7%
Mutual Funds &
DII9.7%
Non Institutions
4.6%
ESOP Trust0.8%
7
Industry overview
Transforming rural lives
across the country
8
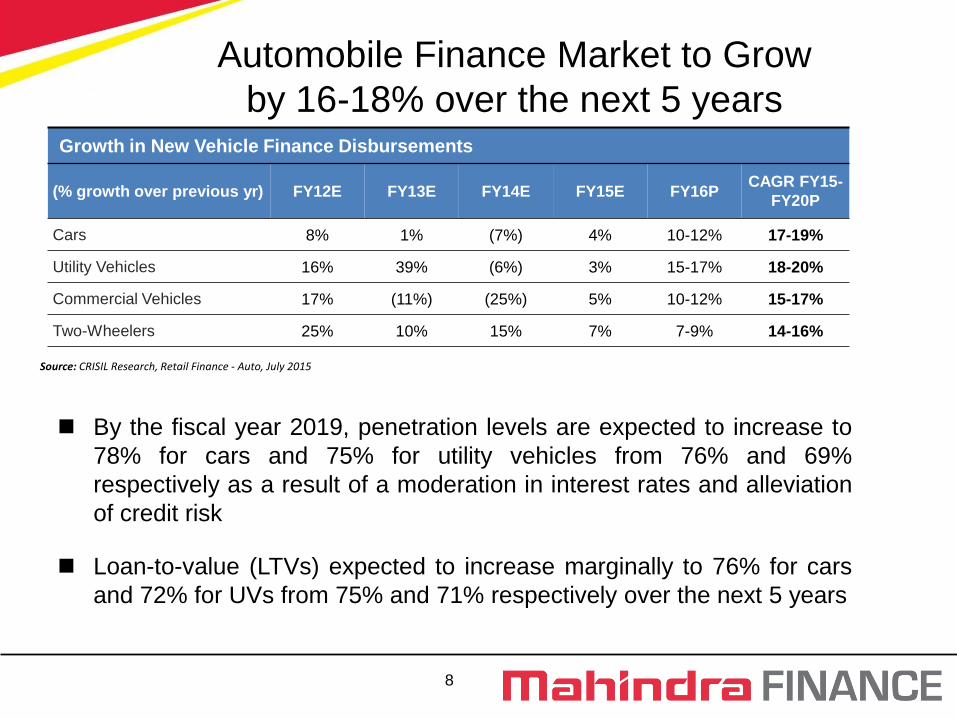
Growth in New Vehicle Finance Disbursements
(% growth over previous yr) FY12E FY13E FY14E FY15E FY16P CAGR FY15-
FY20P
Cars 8% 1% (7%) 4% 10-12% 17-19%
Utility Vehicles 16% 39% (6%) 3% 15-17% 18-20%
Commercial Vehicles 17% (11%) (25%) 5% 10-12% 15-17%
Two-Wheelers 25% 10% 15% 7% 7-9% 14-16%
Source: CRISIL Research, Retail Finance - Auto, July 2015
Automobile Finance Market to Grow
by 16-18% over the next 5 years
By the fiscal year 2019, penetration levels are expected to increase to
78% for cars and 75% for utility vehicles from 76% and 69%
respectively as a result of a moderation in interest rates and alleviation
of credit risk
Loan-to-value (LTVs) expected to increase marginally to 76% for cars
and 72% for UVs from 75% and 71% respectively over the next 5 years

9
Auto Industry
Long term growth potential
Strong prospects in the long-term.
Growth to be driven by increase in
income of households and higher
passenger vehicle penetration
Small Cars to drive growth in the long
term due to higher aspiration levels led
by economy recovery and lower cost of
ownership
With 17 cars per 1000 people, India’s
potential is greater
MHCV goods vehicle sales in the long
term to be supported by growth in
economic activity, export-import and
freight traffic, construction activities etc.
Demand for LCVs in the long term to be
fuelled by increase of hub-and-spoke
model, growth of organised retail, rising
consumption expenditure and
improvement in rural road infrastructure
Source: *CRISIL Research Note : (1) All numbers except India are for CY 2012. India's figures are for 2013-14.
17 39 93
147 196
270 294
385
476 500 526 588
Global Comparison in terms of PV per thousand people (1)
FY05-10 FY10-15 FY16P FY15-20P
CAGR
(%)
CAGR
(%) (%)
CAGR
(%)
Cars and Uvs 13 6 6-8 11-13
Tractors 12 7 3-4 11-13
CVs 10 3 4-6 10-13
10
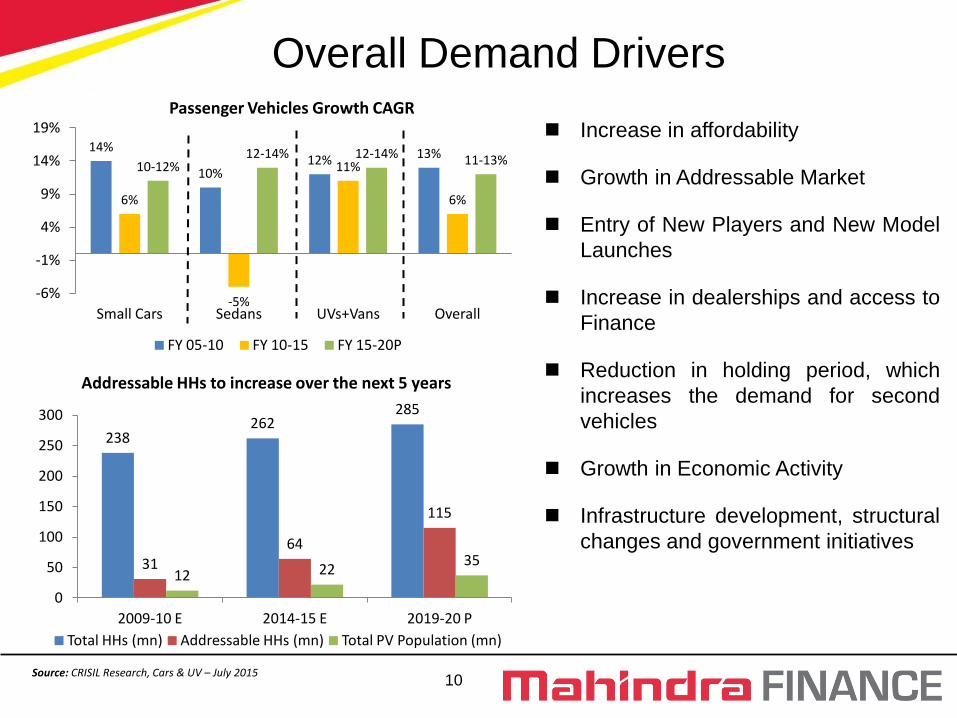
Overall Demand Drivers
Increase in affordability
Growth in Addressable Market
Entry of New Players and New Model
Launches
Increase in dealerships and access to
Finance
Reduction in holding period, which
increases the demand for second
vehicles
Growth in Economic Activity
Infrastructure development, structural
changes and government initiatives
14%
10% 12% 13%
6%
-5%
11%
6%
10-12% 12-14% 12-14% 11-13%
-6%
-1%
4%
9%
14%
19%
Small Cars Sedans UVs+Vans Overall
FY 05-10 FY 10-15 FY 15-20P
238 262
285
31
64
115
12 22 35
0
50
100
150
200
250
300
2009-10 E 2014-15 E 2019-20 P
Total HHs (mn) Addressable HHs (mn) Total PV Population (mn)
Source: CRISIL Research, Cars & UV – July 2015
Addressable HHs to increase over the next 5 years
Passenger Vehicles Growth CAGR
11
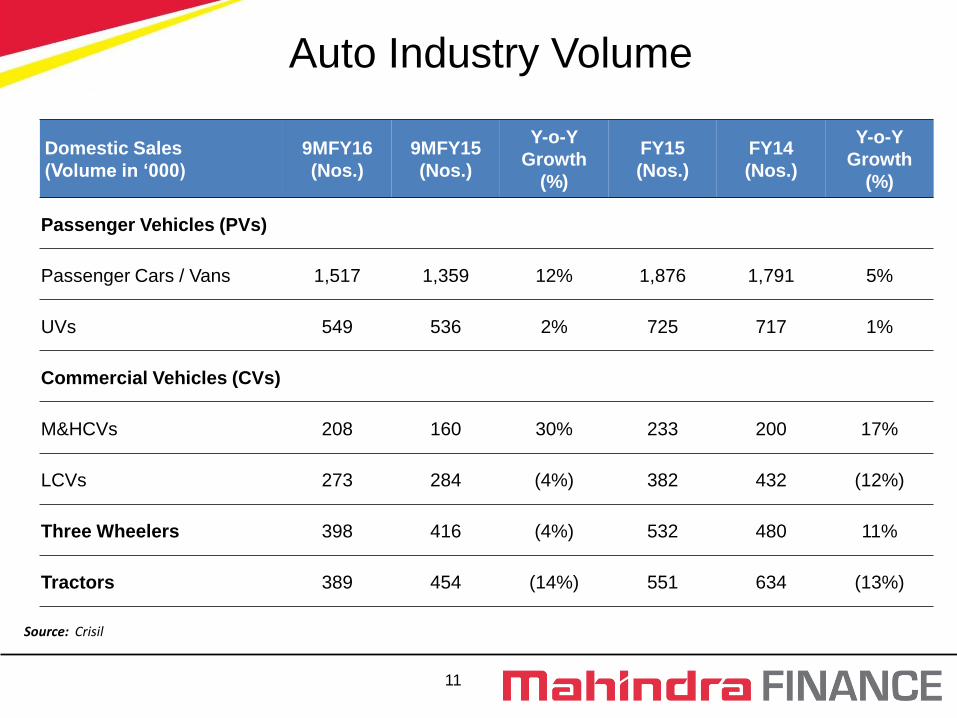
Source: Crisil
Auto Industry Volume
Domestic Sales
(Volume in ‘000)
9MFY16
(Nos.)
9MFY15
(Nos.)
Y-o-Y
Growth
(%)
FY15
(Nos.)
FY14
(Nos.)
Y-o-Y
Growth
(%)
Passenger Vehicles (PVs)
Passenger Cars / Vans 1,517 1,359 12% 1,876 1,791 5%
UVs 549 536 2% 725 717 1%
Commercial Vehicles (CVs)
M&HCVs 208 160 30% 233 200 17%
LCVs 273 284 (4%) 382 432 (12%)
Three Wheelers 398 416 (4%) 532 480 11%
Tractors 389 454 (14%) 551 634 (13%)

12
9% 17% 20%
34% 36% 40% 43%
47% 54%
77% 85%
101%
0%
20%
40%
60%
80%
100%
120%
Source: Crisil Retail Finance – Housing - January 2015
Housing Finance Growth
775
1,840
2,988
7,861
0
1000
2000
3000
4000
5000
6000
7000
8000
9000
2005-06 E 2010-11 E 2013-14 E 2018-19 F
Banks HFCs
Growth in Housing Finance Disbursements (Rs.bn)
Mortgage Penetration (as % of GDP)
Growth in disbursements to be
supported by rising focus of
developers on the affordable
housing segment
Tier II and III cities to drive
growth
Though India’s mortgage-to-
GDP ratio is low, it has improved
by 300-400 bps over the last six
years
Growth in economic activity,
disposable incomes, improving
affordability

13
Business Strategy
Transforming rural lives
across the country
14
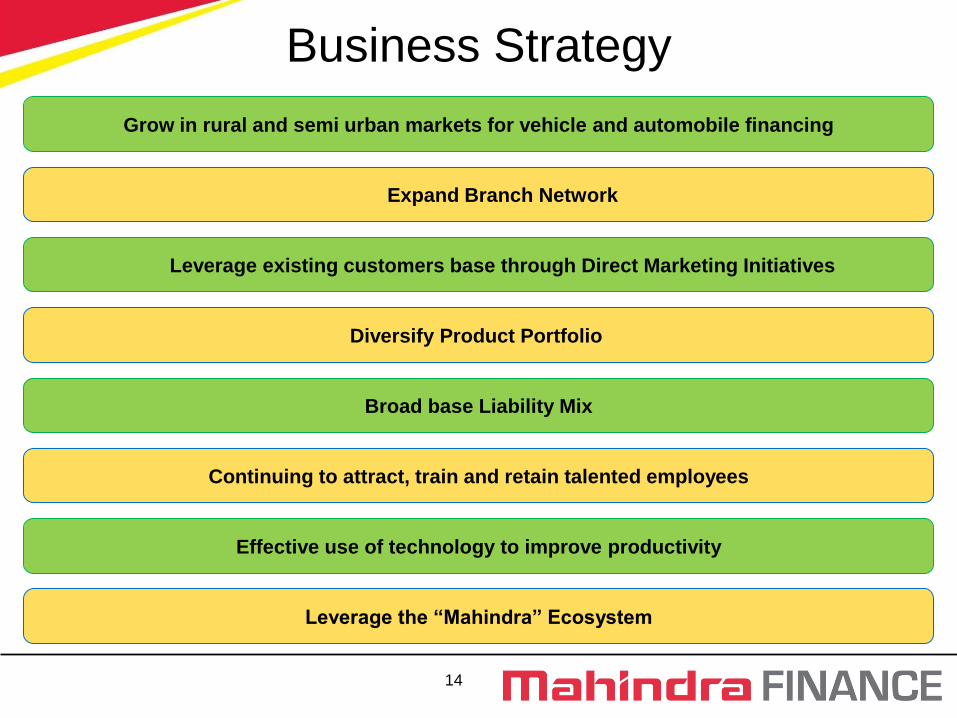
Business Strategy
Grow in rural and semi urban markets for vehicle and automobile financing
Diversify Product Portfolio
Continuing to attract, train and retain talented employees
Effective use of technology to improve productivity
Broad base Liability Mix
Leverage the “Mahindra” Ecosystem
Leverage existing customers base through Direct Marketing Initiatives
Expand Branch Network

15
MMFSL has an extensive branch network with presence in 25 states and 5 union
territories in India through 1179 offices as of December 31, 2015
Branches have authority to approve loans within prescribed guidelines
Coverage Branch Network as of
Extensive branch network
1 1
5
41 30
19 27
17
104 72
93 65
101
35
116
63
2
94 98
18
21
44
1
67
2
5
35
JK
PB
HP
UC
HR Delhi
UP RAJ
GUJ
MAH
MP CH
GOA KK
KER
TN
PONDICHERRY Port Blair
Andaman & Nicobar
AP
OR
JH
BH
WB
AS
Sikkim
Megh
Tripura Mizoram 1
DDR & NGR Haveli 1
256
436
547
657
893
11081179
Mar'05 Mar'08 Mar'11 Mar'13 Mar'14 Mar'15 Dec'15

16
Diversified Product Portfolio
Loans for auto and utility vehicles, tractors, cars, commercial
vehicles and construction equipments Vehicle Financing
Pre-Owned
Vehicles
Mutual Fund
Distribution
Loans for pre-owned cars, multi-utility vehicles, tractors and
commercial vehicles
Advises clients on investing money through AMFI certified
professionals under the brand “MAHINDRA FINANCE FINSMART”
SME Financing Loans for varied purposes like project finance, equipment finance
and working capital finance
Personal Loans Offers personal loans typically for weddings, children’s education,
medical treatment and working capital
Insurance
Broking
Housing Finance
Insurance solutions to retail customers as well as corporations
through our subsidiary MIBL
Loans for buying, renovating, extending and improving homes in
rural and semi-urban India through our subsidiary MRHFL
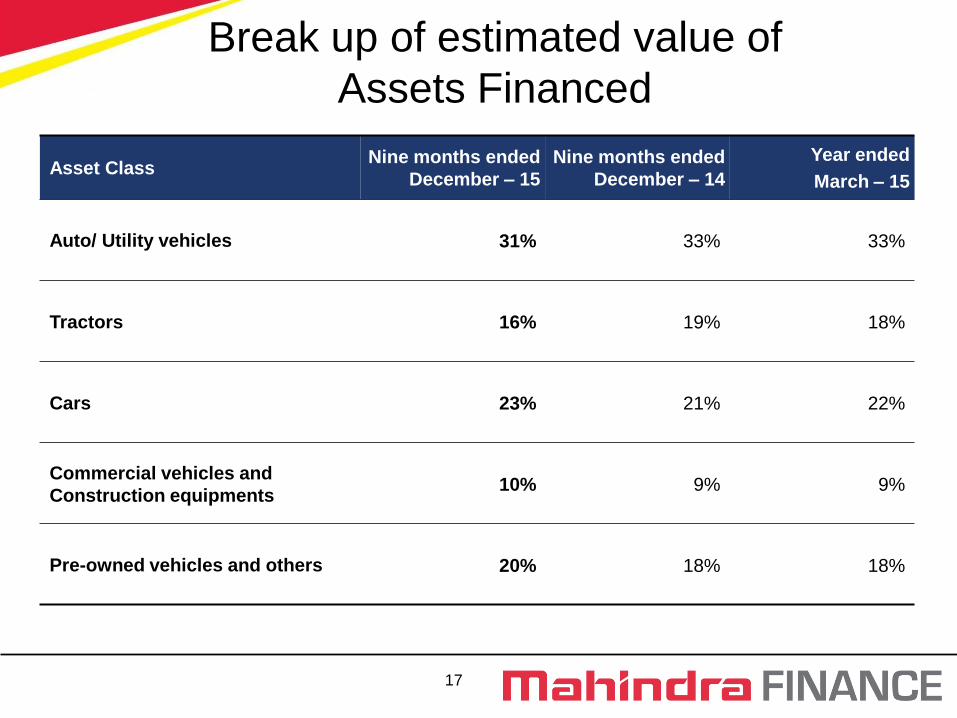
17
Break up of estimated value of
Assets Financed
Asset Class Nine months ended
December – 15
Nine months ended
December – 14
Year ended
March – 15
Auto/ Utility vehicles 31% 33% 33%
Tractors 16% 19% 18%
Cars 23% 21% 22%
Commercial vehicles and
Construction equipments 10% 9% 9%
Pre-owned vehicles and others 20% 18% 18%

18
Break up of AUM
Asset Class As on
December – 15
As on
December – 14
As on
March – 15
Auto/ Utility vehicles 31% 30% 31%
Tractors 17% 19% 18%
Cars 24% 23% 23%
Commercial vehicles and
Construction equipments 12% 13% 13%
Pre-owned vehicles and others 16% 15% 15%
1. Approximate percentages 2. As on 31st Dec 15, ~47% of the AUM was from M&M assets
19
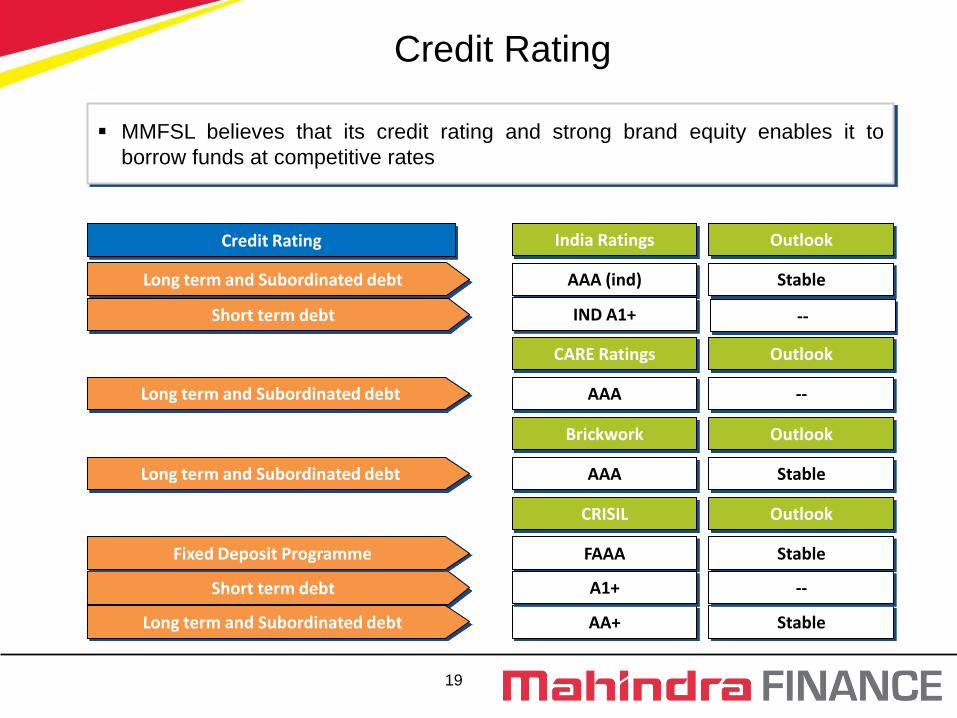
Credit Rating
MMFSL believes that its credit rating and strong brand equity enables it to
borrow funds at competitive rates
Long term and Subordinated debt
Short term debt
Long term and Subordinated debt
Fixed Deposit Programme
Long term and Subordinated debt
AAA (ind) Stable
India Ratings Outlook
Brickwork Outlook
AAA Stable
FAAA Stable
CRISIL Outlook
AA+ Stable
A1+ --
Credit Rating
Long term and Subordinated debt
CARE Ratings Outlook
AAA --
Short term debt IND A1+ --

20
Funding Mix by Investor profile (Dec’ 15) Funding Mix by type of Instrument (Dec’ 15)
Total : Rs. 303 bn
Broad based Liability Mix
Total consortium size of Rs.15.3 Bn comprising several banks
Banks (Rs.123,107
mn)41%
Mutual Fund (Rs.65,399
mn)21%
Others (Rs.49,224
mn)16%
Insurance Co. &
Institutions (Rs.50,756
mn)17%
Banks forAssignment (Rs.14,826
mn)5%
Total : Rs. 303 bn
Bank Term Loan
(Rs.100,860 mn)33%
NCD's (Rs.102,902
mn)34%
FD (Rs.49,097
mn)16%
CP, ICD (Rs.35,627
mn)12%
Assignment (Rs.14,826
mn)5%
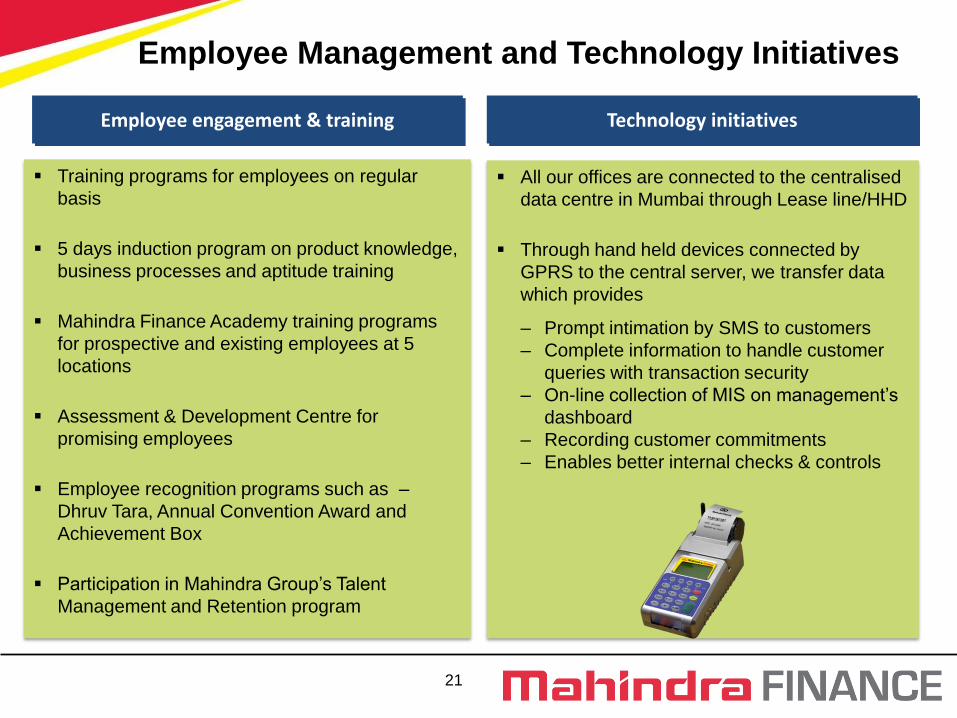
21
Employee Management and Technology Initiatives
All our offices are connected to the centralised
data centre in Mumbai through Lease line/HHD
Through hand held devices connected by
GPRS to the central server, we transfer data
which provides
– Prompt intimation by SMS to customers
– Complete information to handle customer
queries with transaction security
– On-line collection of MIS on management’s
dashboard
– Recording customer commitments
– Enables better internal checks & controls
Technology initiatives
Training programs for employees on regular
basis
5 days induction program on product knowledge,
business processes and aptitude training
Mahindra Finance Academy training programs
for prospective and existing employees at 5
locations
Assessment & Development Centre for
promising employees
Employee recognition programs such as –
Dhruv Tara, Annual Convention Award and
Achievement Box
Participation in Mahindra Group’s Talent
Management and Retention program
Employee engagement & training

22
Financial Information
Transforming rural lives
across the country
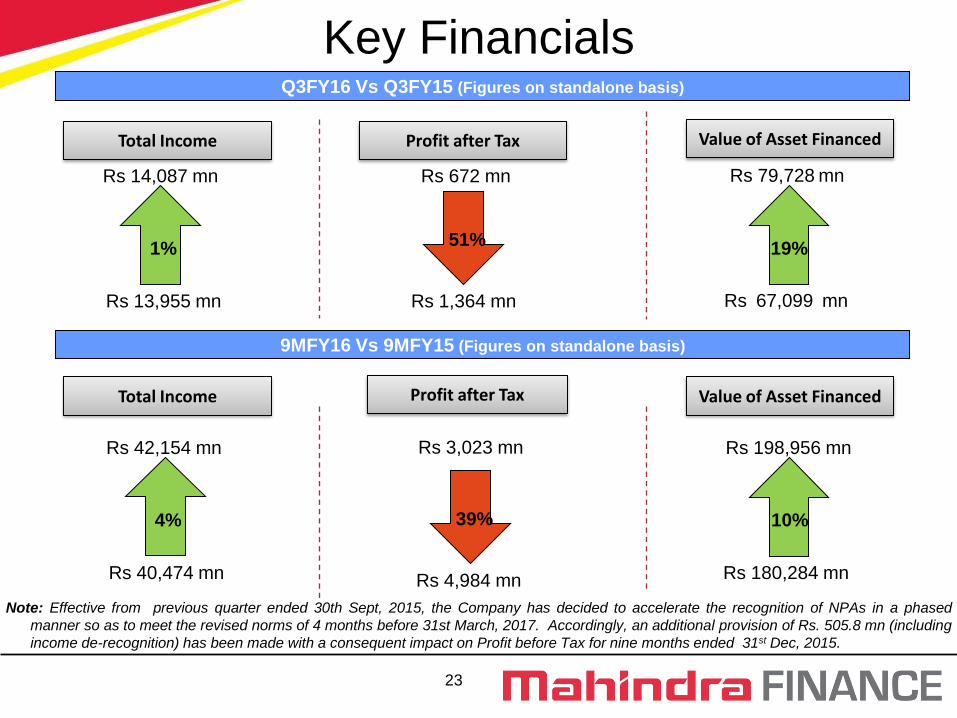
23
Key Financials
Rs 14,087 mn
Rs 13,955 mn
1%
Q3FY16 Vs Q3FY15 (Figures on standalone basis)
9MFY16 Vs 9MFY15 (Figures on standalone basis)
Rs 672 mn
Rs 1,364 mn
51%
Rs 79,728 mn
Rs 67,099 mn
19%
Rs 42,154 mn
Rs 40,474 mn
4%
Rs 3,023 mn
Rs 4,984 mn
39%
Rs 198,956 mn
Rs 180,284 mn
10%
Total Income Profit after Tax Value of Asset Financed
Total Income Profit after Tax Value of Asset Financed
Note: Effective from previous quarter ended 30th Sept, 2015, the Company has decided to accelerate the recognition of NPAs in a phased
manner so as to meet the revised norms of 4 months before 31st March, 2017. Accordingly, an additional provision of Rs. 505.8 mn (including
income de-recognition) has been made with a consequent impact on Profit before Tax for nine months ended 31st Dec, 2015.

24
Growth Trajectory
Loan Book (Rs. Bn) Revenues (Rs. Bn)
38.95
49.53 55.85
42.15
FY13 FY14 FY15 9MFY16
Profit after Tax (1) (Rs. Bn)
8.83 8.87 8.32
3.02
FY13 FY14 FY15 9MFY16
Book Value Per Share (2) (Rs.)
56.7
89.6
99.7 105.2
FY13 FY14 FY15 9MFY16
Note : 1 PAT post exceptional items 2. Calculated as Shareholders funds/ Number of shares 3. All figures and ratios are post additional
provision of Rs. 505.8 mn (including income de-recognition). Please refer to detailed note on Slide 23.
Figures on standalone basis
240.38
296.17 329.30
365.59
FY13 FY14 FY15 9MFY16

25
3.0% 4.4%
5.9% 7.1%
10.1%
1.0% 1.9% 2.4%
3.4% 4.6%
FY13 FY14 FY15 9MFY15 9MFY16
Gross NPA Net NPA
32.6% 33.0%
32.6%
34.3%
37.3%
FY13 FY14 FY15 9MFY15 9MFY16
Financial Performance
Return on Net Worth (RONW) (3) (%)
23.5%
18.6%
15.5%
12.4%
6.9%
FY13 FY14 FY15 9MFY15 9MFY16
Asset Quality
65.9 % 59.0% 61.0%
Note 1 Cost to Income calculated as Operating Expenses (including depreciation)/(Net Interest Income + Other Income). 2 Calculated based on average total
assets. 3 All figures and ratios are post additional provision of Rs. 505.8 mn (including income de-recognition). Please refer to detailed note on Slide 23.
Return on Assets (ROA) (2) (%)
4.0%
3.2%
2.5%
2.0%
1.1%
FY13 FY14 FY15 9MFY15 9MFY16
Cost to income ratio (1) (%)
Figures on standalone basis
54.3% 57.3% Provision
Coverage Ratio
26
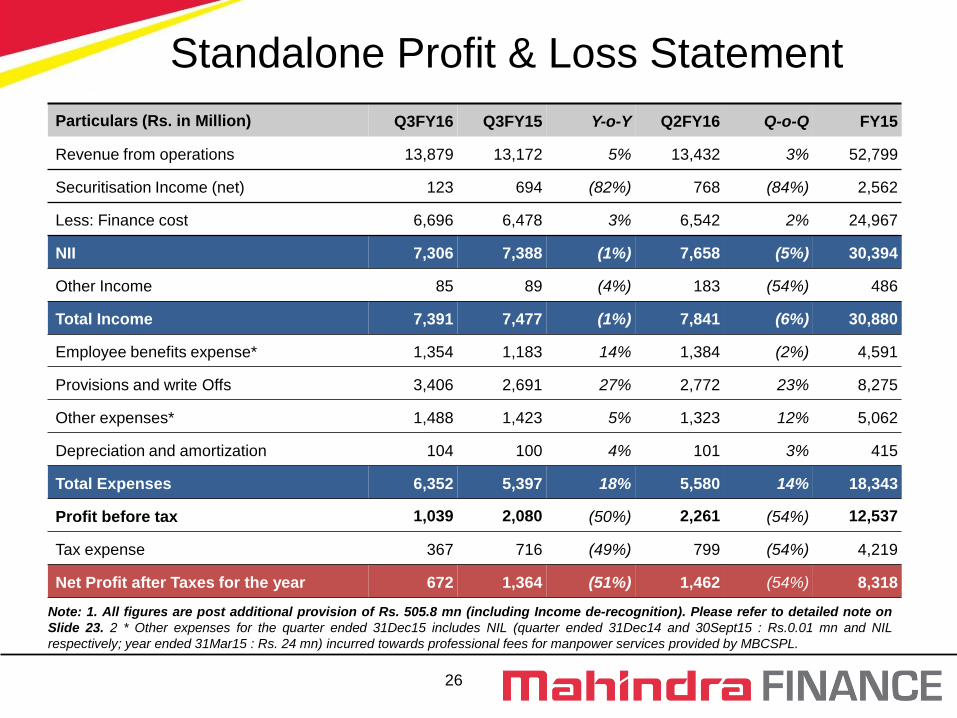
Standalone Profit & Loss Statement
Particulars (Rs. in Million) Q3FY16 Q3FY15 Y-o-Y Q2FY16 Q-o-Q FY15
Revenue from operations 13,879 13,172 5% 13,432 3% 52,799
Securitisation Income (net) 123 694 (82%) 768 (84%) 2,562
Less: Finance cost 6,696 6,478 3% 6,542 2% 24,967
NII 7,306 7,388 (1%) 7,658 (5%) 30,394
Other Income 85 89 (4%) 183 (54%) 486
Total Income 7,391 7,477 (1%) 7,841 (6%) 30,880
Employee benefits expense* 1,354 1,183 14% 1,384 (2%) 4,591
Provisions and write Offs 3,406 2,691 27% 2,772 23% 8,275
Other expenses* 1,488 1,423 5% 1,323 12% 5,062
Depreciation and amortization 104 100 4% 101 3% 415
Total Expenses 6,352 5,397 18% 5,580 14% 18,343
Profit before tax 1,039 2,080 (50%) 2,261 (54%) 12,537
Tax expense 367 716 (49%) 799 (54%) 4,219
Net Profit after Taxes for the year 672 1,364 (51%) 1,462 (54%) 8,318
Note: 1. All figures are post additional provision of Rs. 505.8 mn (including Income de-recognition). Please refer to detailed note on
Slide 23. 2 * Other expenses for the quarter ended 31Dec15 includes NIL (quarter ended 31Dec14 and 30Sept15 : Rs.0.01 mn and NIL
respectively; year ended 31Mar15 : Rs. 24 mn) incurred towards professional fees for manpower services provided by MBCSPL.

27
Standalone Balance Sheet
Particulars (Rs. in Million) As on Dec 31
2015
As on Dec 31
2014
As on Mar 31
2015
EQUITY AND LIABILITIES
Shareholders' funds
a) Share Capital 1,128 1,128 1,128
b) Reserves and Surplus 58,718 54,841 55,566
Shareholders' funds 59,846 55,969 56,694
Non-current liabilities
a) Long-term borrowings 1,67,248 1,58,663 1,47,871
b) Other Long-term liabilities 4,075 3,049 3,025
c) Long term provisions 10,047 3,626 3,280
Non-current liabilities 1,81,370 1,65,338 1,54,176
Current liabilities
a) Short Term Borrowings 56,197 43,833 48,710
b) Trade payables 5,701 5,110 4,779
c) Other current liabilities 77,389 68,889 74,876
d) Short term provisions 8,696 9,110 11,506
Current liabilities 1,47,983 1,26,942 1,39,871
Total Equities and Liabilities 3,89,199 3,48,249 3,50,741
28
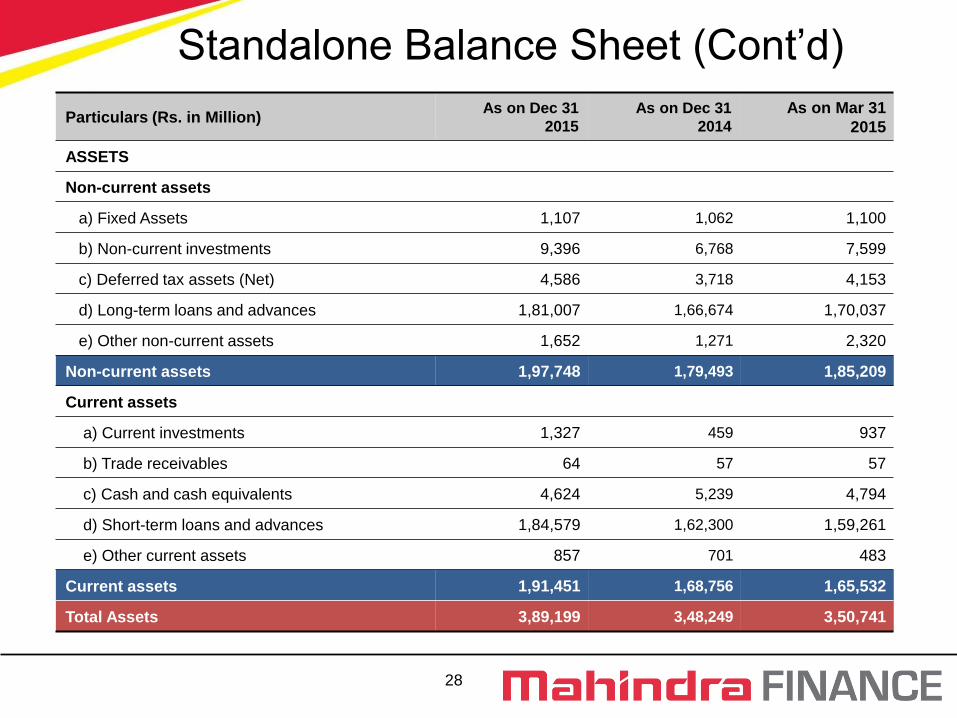
Standalone Balance Sheet (Cont’d)
Particulars (Rs. in Million) As on Dec 31
2015
As on Dec 31
2014
As on Mar 31
2015
ASSETS
Non-current assets
a) Fixed Assets 1,107 1,062 1,100
b) Non-current investments 9,396 6,768 7,599
c) Deferred tax assets (Net) 4,586 3,718 4,153
d) Long-term loans and advances 1,81,007 1,66,674 1,70,037
e) Other non-current assets 1,652 1,271 2,320
Non-current assets 1,97,748 1,79,493 1,85,209
Current assets
a) Current investments 1,327 459 937
b) Trade receivables 64 57 57
c) Cash and cash equivalents 4,624 5,239 4,794
d) Short-term loans and advances 1,84,579 1,62,300 1,59,261
e) Other current assets 857 701 483
Current assets 1,91,451 1,68,756 1,65,532
Total Assets 3,89,199 3,48,249 3,50,741

29
Key Subsidiaries
Transforming rural lives
across the country
30
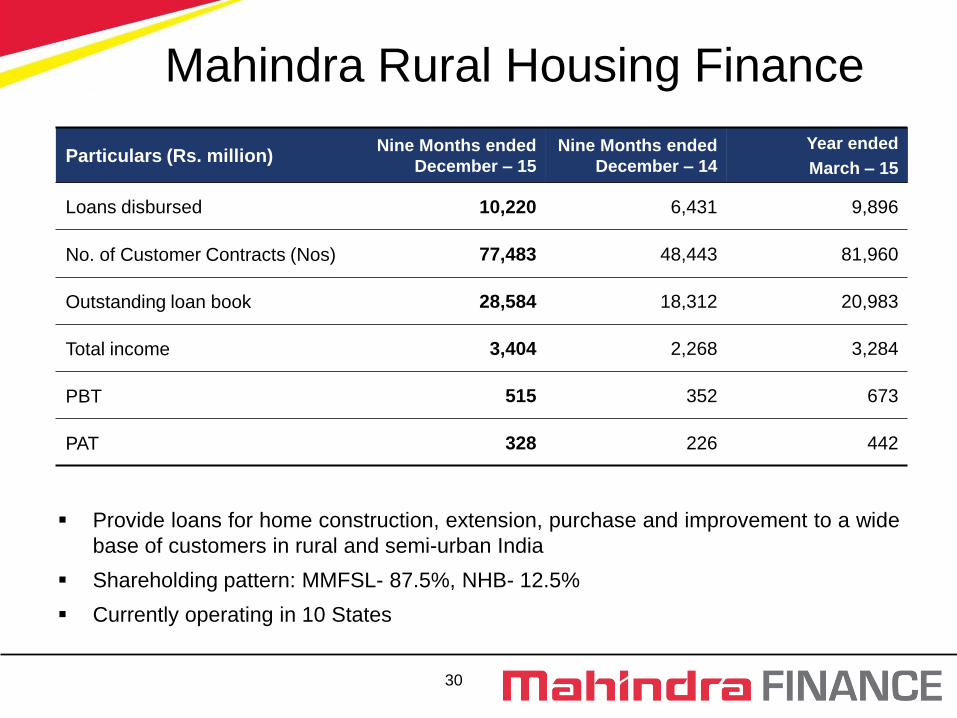
Provide loans for home construction, extension, purchase and improvement to a wide
base of customers in rural and semi-urban India
Shareholding pattern: MMFSL- 87.5%, NHB- 12.5%
Currently operating in 10 States
Mahindra Rural Housing Finance
Particulars (Rs. million) Nine Months ended
December – 15
Nine Months ended
December – 14
Year ended
March – 15
Loans disbursed 10,220 6,431 9,896
No. of Customer Contracts (Nos) 77,483 48,443 81,960
Outstanding loan book 28,584 18,312 20,983
Total income 3,404 2,268 3,284
PBT 515 352 673
PAT 328 226 442
31
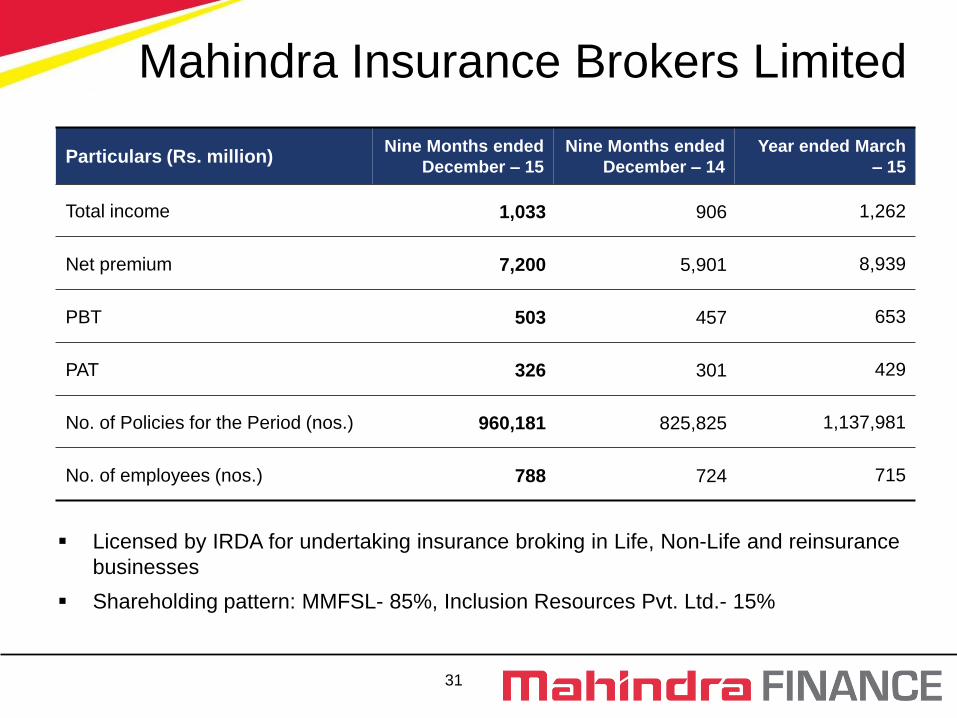
Mahindra Insurance Brokers Limited
Particulars (Rs. million) Nine Months ended
December – 15
Nine Months ended
December – 14
Year ended March
– 15
Total income 1,033 906 1,262
Net premium 7,200 5,901 8,939
PBT 503 457 653
PAT 326 301 429
No. of Policies for the Period (nos.) 960,181 825,825 1,137,981
No. of employees (nos.) 788 724 715
Licensed by IRDA for undertaking insurance broking in Life, Non-Life and reinsurance
businesses
Shareholding pattern: MMFSL- 85%, Inclusion Resources Pvt. Ltd.- 15%
32
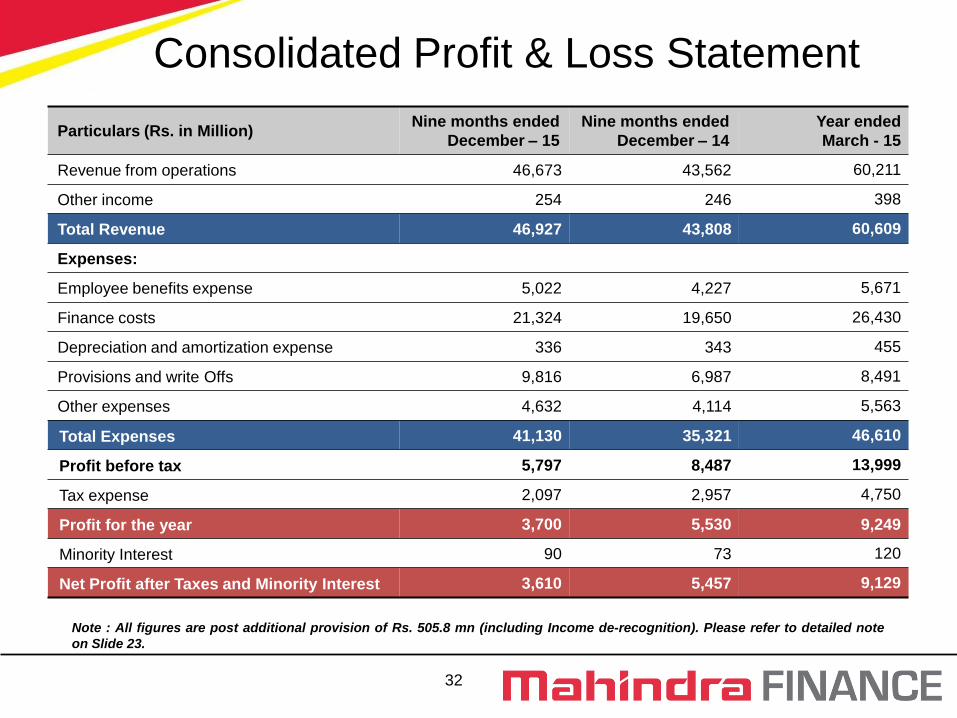
Consolidated Profit & Loss Statement
Particulars (Rs. in Million) Nine months ended
December – 15
Nine months ended
December – 14
Year ended
March - 15
Revenue from operations 46,673 43,562 60,211
Other income 254 246 398
Total Revenue 46,927 43,808 60,609
Expenses:
Employee benefits expense 5,022 4,227 5,671
Finance costs 21,324 19,650 26,430
Depreciation and amortization expense 336 343 455
Provisions and write Offs 9,816 6,987 8,491
Other expenses 4,632 4,114 5,563
Total Expenses 41,130 35,321 46,610
Profit before tax 5,797 8,487 13,999
Tax expense 2,097 2,957 4,750
Profit for the year 3,700 5,530 9,249
Minority Interest 90 73 120
Net Profit after Taxes and Minority Interest 3,610 5,457 9,129
Note : All figures are post additional provision of Rs. 505.8 mn (including Income de-recognition). Please refer to detailed note
on Slide 23.
33
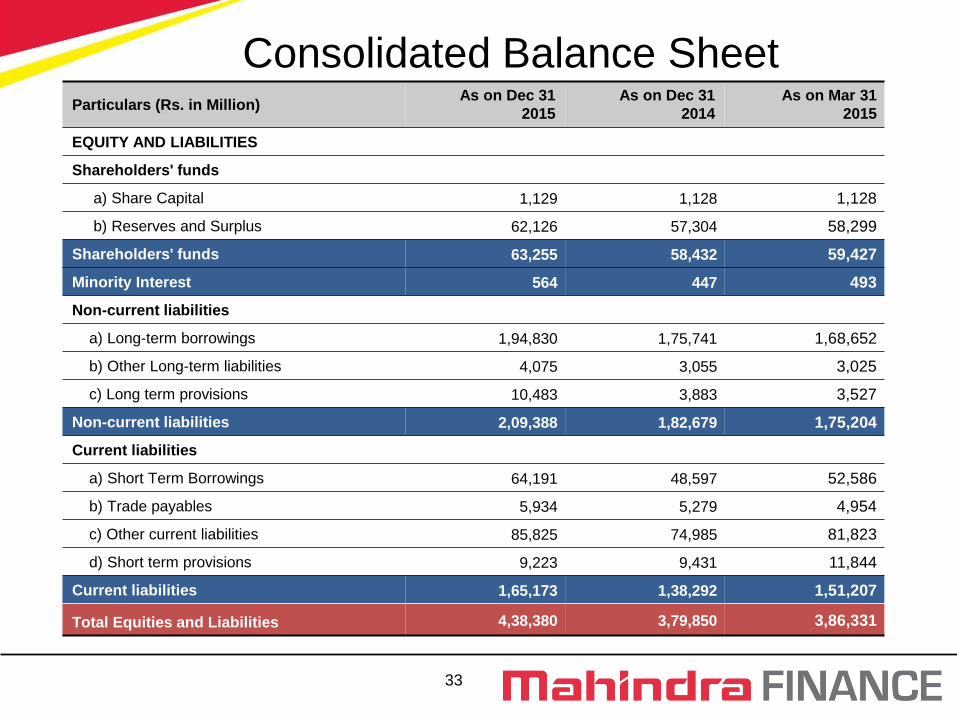
Particulars (Rs. in Million) As on Dec 31
2015
As on Dec 31
2014
As on Mar 31
2015
EQUITY AND LIABILITIES
Shareholders' funds
a) Share Capital 1,129 1,128 1,128
b) Reserves and Surplus 62,126 57,304 58,299
Shareholders' funds 63,255 58,432 59,427
Minority Interest 564 447 493
Non-current liabilities
a) Long-term borrowings 1,94,830 1,75,741 1,68,652
b) Other Long-term liabilities 4,075 3,055 3,025
c) Long term provisions 10,483 3,883 3,527
Non-current liabilities 2,09,388 1,82,679 1,75,204
Current liabilities
a) Short Term Borrowings 64,191 48,597 52,586
b) Trade payables 5,934 5,279 4,954
c) Other current liabilities 85,825 74,985 81,823
d) Short term provisions 9,223 9,431 11,844
Current liabilities 1,65,173 1,38,292 1,51,207
Total Equities and Liabilities 4,38,380 3,79,850 3,86,331
Consolidated Balance Sheet

34
Consolidated Balance Sheet (Cont’d) Particulars (Rs. in Million)
As on Dec 31
2015
As on Dec 31
2014
As on Mar 31
2015
ASSETS
Non-current assets
a) Fixed Assets 1,227 1,159 1,192
b) Non-current investments 6,530 4,843 5,597
c) Deferred tax assets (Net) 4,688 3,767 4,212
d) Long-term loans and advances 2,20,546 1,91,833 1,98,883
e) Other non current assets 1,658 1,277 2,326
Non-current assets 2,34,649 2,02,879 2,12,210
Current assets
a) Current investments 1,833 459 945
b) Trade receivables 171 126 145
c) Cash and cash equivalents 4,875 5,367 4,936
d) Short-term loans and advances 1,96,045 1,70,331 1,67,620
e) Other current assets 807 688 475
Current assets 2,03,731 1,76,971 1,74,121
Total Assets 438,380 3,79,850 3,86,331

35
Summary & Key Ratios
Particulars Nine months ended
December – 15
Nine months ended
December – 14
Year ended
March – 15
RONW (Avg. Net Worth) 6.9% 12.4% 15.5%
Debt / Equity 4.83:1 4.69:1 4.63:1
Capital Adequacy 17.8% 18.1% 18.3%
Tier I 15.0% 15.6% 15.5%
Tier II 2.8% 2.5% 2.8%
EPS (Basic) (Rs.) 5.36 8.84 14.75
Book Value (Rs.) 105.2 98.4 99.7
Dividend -- -- 200%
Assets Under Management (Rs. Mn) 402,823 365,023 368,780
New Contracts During the period (Nos) 400,615 388,719 515,654
No. of employees 15,580 13,899 14,197
Figures on standalone basis
Note : All figures and ratios are post additional provision of Rs. 505.8 mn (including Income de-recognition). Please refer to detailed note on Slide 23.
36
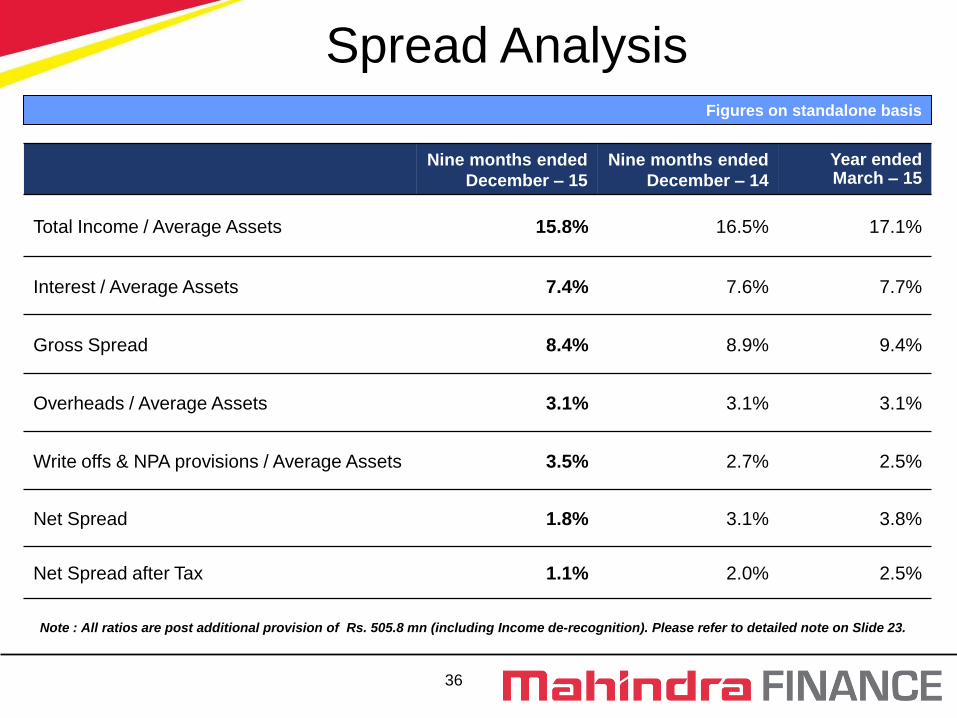
Spread Analysis
Nine months ended
December – 15
Nine months ended
December – 14
Year ended March – 15
Total Income / Average Assets 15.8% 16.5% 17.1%
Interest / Average Assets 7.4% 7.6% 7.7%
Gross Spread 8.4% 8.9% 9.4%
Overheads / Average Assets 3.1% 3.1% 3.1%
Write offs & NPA provisions / Average Assets 3.5% 2.7% 2.5%
Net Spread 1.8% 3.1% 3.8%
Net Spread after Tax 1.1% 2.0% 2.5%
Figures on standalone basis
Note : All ratios are post additional provision of Rs. 505.8 mn (including Income de-recognition). Please refer to detailed note on Slide 23.
37
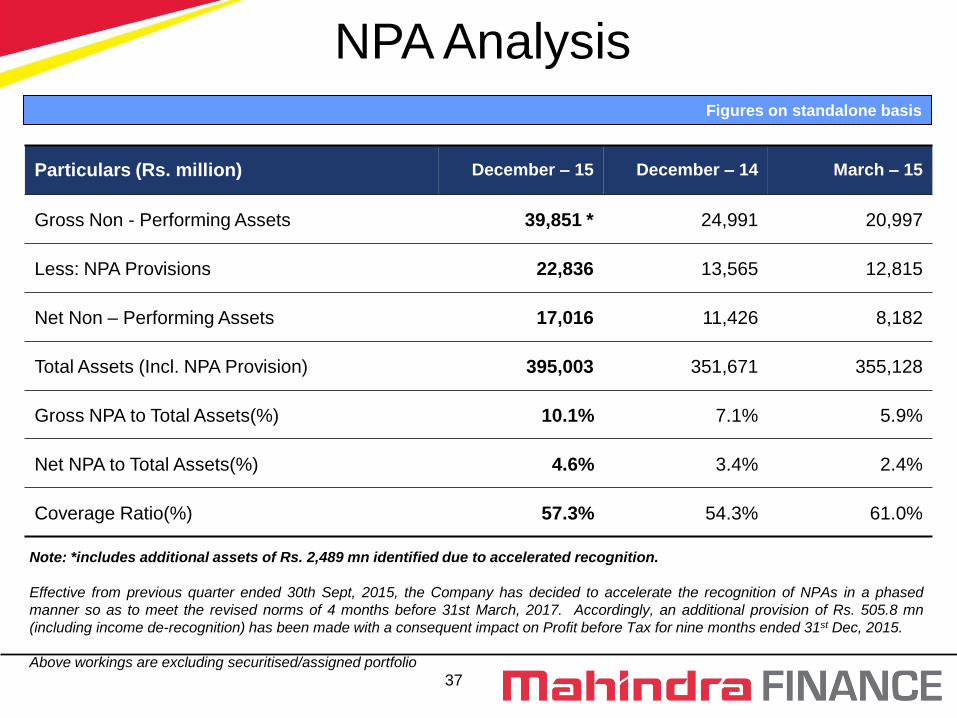
NPA Analysis
Particulars (Rs. million) December – 15 December – 14 March – 15
Gross Non - Performing Assets 39,851 * 24,991 20,997
Less: NPA Provisions 22,836 13,565 12,815
Net Non – Performing Assets 17,016 11,426 8,182
Total Assets (Incl. NPA Provision) 395,003 351,671 355,128
Gross NPA to Total Assets(%) 10.1% 7.1% 5.9%
Net NPA to Total Assets(%) 4.6% 3.4% 2.4%
Coverage Ratio(%) 57.3% 54.3% 61.0%
Note: *includes additional assets of Rs. 2,489 mn identified due to accelerated recognition.
Effective from previous quarter ended 30th Sept, 2015, the Company has decided to accelerate the recognition of NPAs in a phased
manner so as to meet the revised norms of 4 months before 31st March, 2017. Accordingly, an additional provision of Rs. 505.8 mn
(including income de-recognition) has been made with a consequent impact on Profit before Tax for nine months ended 31st Dec, 2015.
Above workings are excluding securitised/assigned portfolio
Figures on standalone basis

38
Awards & Accolades
Transforming rural lives
across the country
39
Awards and Accolades Mahindra Finance has been appraised and rated at People
CMM® Maturity Level 3
Mahindra Finance included on Dow Jones Sustainability Index (DJSI) - Emerging Market Trends for 3rd years in a row. We also got featured in RobecoSAM Sustainability Yearbook 2015
Mahindra Finance made it to the list of Carbon Disclosure Leadership Index (CDLI) for 2nd consecutive year in 2015
Mahindra Rural Housing Finance Limited (MRHFL) has been awarded the ‘Platinum’ Award under the category of ‘Social Development’ and sub-category of ‘Rural Upliftment’ by ASSOCHAM’s 3rd Innovation Excellence Awards 2014
The ‘Learning and Development’ department of Mahindra & Mahindra Financial Services Ltd. has been declared as the winner of ‘Golden Peacock National Training Award’ for the year 2014.
Mahindra Finance is among the best in the prestigious Dun & Bradstreet’s ‘India’s Top 500 Companies 2014’

40
Key Risk Management Practices
Transforming rural lives
across the country
41
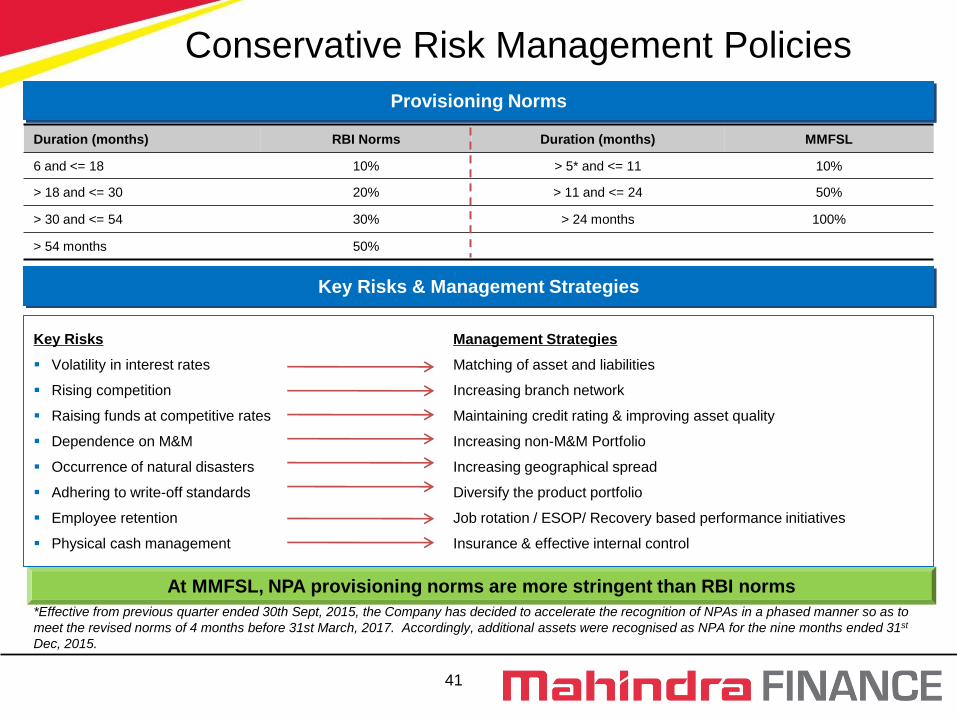
Conservative Risk Management Policies
Duration (months) RBI Norms Duration (months) MMFSL
6 and <= 18 10% > 5* and <= 11 10%
> 18 and <= 30 20% > 11 and <= 24 50%
> 30 and <= 54 30% > 24 months 100%
> 54 months 50%
At MMFSL, NPA provisioning norms are more stringent than RBI norms
Key Risks & Management Strategies
Key Risks Management Strategies
Volatility in interest rates Matching of asset and liabilities
Rising competition Increasing branch network
Raising funds at competitive rates Maintaining credit rating & improving asset quality
Dependence on M&M Increasing non-M&M Portfolio
Occurrence of natural disasters Increasing geographical spread
Adhering to write-off standards Diversify the product portfolio
Employee retention Job rotation / ESOP/ Recovery based performance initiatives
Physical cash management Insurance & effective internal control
Provisioning Norms
*Effective from previous quarter ended 30th Sept, 2015, the Company has decided to accelerate the recognition of NPAs in a phased manner so as to
meet the revised norms of 4 months before 31st March, 2017. Accordingly, additional assets were recognised as NPA for the nine months ended 31st
Dec, 2015.
42
Disclaimer
This presentation does not constitute or form part of any offer or invitation or inducement to sell or issue, or any solicitation of any offer to purchase or subscribe for, any securities of Mahindra & Mahindra Financial Services Limited (the “Company”), nor shall it or any part of it or the fact of its distribution form the basis of, or be relied on in connection with, any contract or commitment there for.
This presentation contains statements that constitute forward-looking statements. These statements include descriptions regarding the intent, belief or current expectations of the Company or its directors and officers with respect to the results of operations and financial condition of the Company. These statements can be recognized by the use of words such as “expects,” “plans,” “will,” “estimates,” “projects,” or other words of similar meaning. Such forward-looking statements are not guarantees of future performance and involve risks and uncertainties, and actual results may differ from those in such forward-looking statements as a result of various factors and assumptions which the Company believes to be reasonable in light of its operating experience in recent years. The Company does not undertake to revise any forward-looking statement that may be made from time to time by or on behalf of the Company.
No representation, warranty, guarantee or undertaking, express or implied, is or will be made as to, and no reliance should be placed on, the accuracy, completeness or fairness of the information, estimates, projections and opinions contained in this presentation. Potential investors must make their own assessment of the relevance, accuracy and adequacy of the information contained in this presentation and must make such independent investigation as they may consider necessary or appropriate for such purpose. Any opinions expressed in this presentation are subject to change without notice. None of the Company, the placement agents, promoters or any other persons that may participate in the offering of any securities of the Company shall have any responsibility or liability whatsoever for any loss howsoever arising from this presentation or its contents or otherwise arising in connection therewith.
This presentation and its contents are confidential and should not be distributed, published or reproduced, in whole or part, or disclosed by recipients directly or indirectly to any other person. In particular, this presentation is not for publication or distribution or release in the United States, Australia, Canada or Japan or in any other country where such distribution may lead to a breach of any law or regulatory requirement. The information contained herein does not constitute or form part of an offer or solicitation of an offer to purchase or subscribe for securities for sale in the United States, Australia, Canada or Japan or any other jurisdiction. The securities referred to herein have not been and will not be registered under the United States Securities Act of 1933, as amended, and may not be offered or sold in the United States or to or for the benefit of US persons absent registration or an applicable exemption from registration.
CRISIL DISCLAIMER: CRISIL limited has used due care and caution in preparing this report. Information has been obtained by CRISIL from sources which it considers reliable. However, CRISIL does not guarantee the accuracy, adequacy or completeness of any information and is not responsible for any errors or omissions or for the results obtained from the use of such information. No part of this report may be published/reproduced in any form without CRISIL’s prior written approval. CRISIL is not liable for investment decisions which may be based on the views expressed in this report. CRISIL Research operates independently of, and does not have access to information obtained by CRISIL’s Rating Division, which may, in its regular operations, obtain information of a confidential nature that is not available to CRISIL Research.

43
Thank You
Transforming rural lives
across the country