MA KING THE CLEAN ENER GY CITY IN CHINA
187
MA CL IN Year 3 Massach Departm School o Dennis Principa Cressica Project D AK LEA CH 3 Report husetts Inst ment of Urba of Architect Frenchma l Investigat a Brazier Director ING AN HIN t titute of Tec an Studies ture and Pla n, Christop ors G T EN NA chnology and Plannin anning pher Zegra HE NER ng as RGY Y C ITY Y
Transcript of MA KING THE CLEAN ENER GY CITY IN CHINA
MACLINYear 3
Massach
Departm
School o
Dennis
Principa
Cressica
Project D
AKLEA CH
3 Report
husetts Inst
ment of Urba
of Architect
Frenchma
l Investigat
a Brazier
Director
INGAN HIN
t
titute of Tec
an Studies
ture and Pla
n, Christop
ors
G TEN
NA
chnology
and Plannin
anning
pher Zegra
HENER
ng
as
RGYY CITYY
MACLINYear 3
Massach
Departm
School o
Dennis
Principa
Cressica
Project D
August 2
AKLEA CH
3 Report
husetts Inst
ment of Urba
of Architect
Frenchma
l Investigat
a Brazier
Director
2013
INGAN HIN
t
titute of Tec
an Studies
ture and Pla
n, Christop
ors
G TEN
NA
chnology
and Plannin
anning
pher Zegra
HENER
ng
as
RGYY CITYY

Credits Principal Investigators
Dennis Frenchman, Leventhal Professor of Urban Design and Planning, MIT Christopher Zegras, Associate Professor of Transportation Planning, MIT
Contributing Investigator
Jan Wampler, Professor of Architecture, MIT
MIT Research Assistants
2012-2013 Viktorija Abolina J. Cressica Brazier Shan He Karen Johnson Liu Liu Sophie Yue Pan Alexis Wheeler Feifei Yu Qianqian Zhang
2011-2012 J. Cressica Brazier Yang Chen Yang Chu Chris Rhie Rosie Sherman Bill Dong Wang Ira Winder Feifei Yu Judy Zheng Jia
2010-2011 Yang Chen Daniel Daou Reza Darbari Shani Sharif Rosie Sherman Nah-yoon Shin Jue Wang Ira Winder Aspasia Xypolia Heshuang Zheng
© 2013 MIT / Dennis Frenchman, Christopher Zegras
Acknowledgements
The research team wishes to thank the Energy Foundation, China, for its generous support of Making the Clean Energy City in China, a research project of the Massachusetts Institute of Technology. Project partners include Tsinghua University, Shandong University, and Beijing Normal University, which were responsible for field work in Jinan. We would like to thank Tsinghua University School of Architecture professors Mao Qizhi, Zhang Jie, and Shao Lei for their collaboration on this project. We also wish to thank the City of Jinan for its assistance and cooperation with the project. This report would not be possible without the many years of contributions from students.
Contents I. Prologue
II. Bibliography of Project Works
Papers
1. Clean Energy Urban Design in China
An Introduction to the Empirical Analysis, Practice, and Policy of Low-carbon Neighborhood Development Dennis Frenchman, Christopher Zegras, J. Cressica Brazier
2. The Energy Proforma
Measuring neighborhood energy performance for design, development, and urban policy J. Cressica Brazier, Shan He
3. Simulation of Household In-home and Transportation Energy Use:
An integrated behavioral model for estimating energy consumption at the neighborhood scale Feifei Yu, Christopher Zegras
4. Neighborhood Energy Performance Policy for China:
A Proposal for Improving Urban Energy Efficiency through Regulatory, Municipal Finance, and Market-Based Strategies Qianqian Zhang, Liu Liu, J. Cressica Brazier
5. Implementing Energy-Efficient Neighborhood Form in China:
Cases of Residential Planning Regulation and Practice in Jinan and Shenzhen J. Cressica Brazier
Accompanying Documents
6. Making Clean Energy Neighborhoods: The Energy Proforma in Policy and Practice Dennis Frenchman and Christopher Zegras, PI's. 2013. MIT: SAP Press.
7. Clean Energy Guidelines for Neighborhood Design in Rapidly Urbanizing China
Alexis Wheeler

I - 1
I. PROLOGUE Making the Clean Energy City in China is a multiyear investigation at MIT of the relationship between the design of urban neighborhoods and the energy they consume. The work has involved the development of new tools to improve the practice of clean energy design and policy recommendations to guide urban development towards a more energy efficient mode. As part of the Year 3 research products, we present a series of five chapters that have been or will be presented as papers for conferences and publication. These papers not only build on the comprehensive Year 2 report (June 2012) to synthesize the project findings for a wider audience, but they also present new, more sophisticated statistical modeling techniques, policy recommendations, and practical applications of the Energy Proforma© that we have developed in Year 3. Two of the following papers have been presented at conferences, and together the papers form the basis for a planned volume on the complete course of the research project. This report is accompanied by an important stand-alone publication, which summarizes the research and documents the work of the 2012 MIT-Tsinghua Joint Urban Design Studio, entitled Making Clean Energy Neighborhoods: The Energy Proforma in Policy and Practice. Also accompanying this report is a new thesis publication entitled “Clean Energy Guidelines for Neighborhood Design in Rapidly Urbanizing China,” by Alexis Wheeler, a member of the research team. Finally, we have released a fully developed project website, energyproforma.mit.edu. The website brings together educational materials on clean energy neighborhood design with access to the interactive, online Energy Proforma software. We describe the many functions of this website in the second paper below.
Papers
1. Clean Energy Urban Design in China
An Introduction to the Empirical Analysis, Practice, and Policy of Low-carbon Neighborhood Development Dennis Frenchman, Christopher Zegras, J. Cressica Brazier
This opening paper guides readers through a summary of the project work to date, from the principles of the research design, to the empirical data collection and analysis, the development of the Energy Proforma, and the clean energy neighborhood policy recommendations and patterns that emerge from the research findings. We are preparing the paper for a forthcoming publication, and we have presented the paper at the June 2013 conference entitled Peking University – Lincoln Land Institute Workshop on Regional, Urban, and Spatial Economics.

I - 2
2. The Energy Proforma
Measuring neighborhood energy performance for design, development, and urban policy
J. Cressica Brazier, Shan He
In this report, we detail the functionality of the online Energy Proforma, energyproforma.mit.edu, as a rapid assessment tool for neighborhood energy performance, in its current version 3.0 as well as plans for upcoming releases. We describe the many modes of interacting with the site—as a portal for learning about neighborhood energy, as a tool for exploring and quickly assessing neighborhood form-energy relationships, and as a platform for urban development stakeholders to iteratively analyze custom neighborhood designs—and we highlight the upcoming features of the site, which include assessment modules for neighborhood lifecycle costs and regulatory plan indicators.
3. Simulation of household in-home and transportation energy use
An integrated behavioral model for estimating energy consumption at the neighborhood scale Feifei Yu, Christopher Zegras
We have made a number of advancements in the statistical modeling framework underlying the Energy Proforma this year. This paper describes the behavioral modeling research that has led to three key contributions. First, the modeling framework now integrates the in-home and travel components of household energy consumption, by explicitly modeling the probabilities of activity substitutions, or ‘trade-off lifestyle patterns,’ that link in-home and out-of-home energy use. Second, a series of eight inter-related models now provides detailed behavioral outcomes of equipment purchases and trip frequency, mode, and length choices. Lastly, the modeling framework is expanded with micro-simulation modules that enable policymakers to explore neighborhood energy demand over time. This paper has also been presented at the Peking University – Lincoln Land Institute Workshop on Regional, Urban, and Spatial Economics in June, 2013.
4. Neighborhood Energy Performance Policy for China: A Proposal for Improving Urban Energy Efficiency through Regulatory, Municipal Finance, and Market-Based Strategies Qianqian Zhang, Liu Liu, J. Cressica Brazier
This paper outlines the strategy for adopting clean energy policy using knowledge we have
gained and tools we have developed in the research. Policy recommendations encompass not only planning and design regulations, but also municipal finance reforms and market-based energy efficiency strategies. Taken together, these proposals would create a comprehensive policy context for supporting clean energy neighborhood development. The report explores six approaches: prescriptive design and regulatory planning guidelines, the

I - 3
Neighborhood Energy Performance Standard, land leasing modifications, property taxes linked to energy efficiency, energy labeling and disclosure, and a carbon trading market framework that is inclusive of clean energy neighborhood developments. We also explain how the Energy Proforma is integral to the formulation and implementation of this wider range of policy applications.
5. Implementing Energy-Efficient Neighborhood Form in China:
Cases of Residential Planning Regulation and Practice in Jinan and Shenzhen J. Cressica Brazier
This paper documents an in-depth investigation of the current regulatory context for urban development in China, using the regulatory policy proposal as a basis for exploratory interviews. Throughout 2012, twenty interviews were conducted with government officials, urban planners, consultants, and developers, to view from multiple perspectives the role of the urban planning bureau in shaping residential developments. We trace the bureaus’ regulatory control, decision making, and stakeholder collaboration surrounding three key design variables related to energy efficiency in neighborhood form: road network density, building density within the neighborhood, and neighborhood use mix. By contrasting the cases of Jinan and Shenzhen, it is possible to describe a spectrum of potential implementation strategies and barriers for clean energy neighborhood development in China’s immediate future.
Accompanying Documents
6. Making Clean Energy Neighborhoods: The Energy Proforma in Policy and Practice Dennis Frenchman and Christopher Zegras, PI's. 2013. MIT: SAP Press.
This publication summarizes all of the work and findings of the Making the Clean Energy City in China project, including reults of the 2012 MIT-Tsinghua University Joint Urban Design Studio, which field tested the Energy Proforma version 2.4 in developing designs for five new clean energy neighborhoods in the demonstration city of Jinan China
7. Clean Energy Guidelines for Neighborhood Design in Rapidly Urbanizing China
Alexis Wheeler This 2013 Masters thesis analyzes the context and proposes a framework of urban design guidelines based on the experience of the Making Clean Energy Cities in China project and the Energy Proforma.

II - 1
II. BIBLIOGRAPHY OF PROJECT WORKS
All documents have been submitted to the Energy Foundation and are available on the research project website, energyproforma.mit.edu.
Year 3 (2013)
1. Making the Clean Energy City in China: Year 3 Report
Dennis Frenchman, Christopher Zegras, PIs (Collection of papers, listed below) PROJECT REPORT
Clean Energy Urban Design in China
An Introduction to the Empirical Analysis, Practice, and Policy of Low-carbon Neighborhood Development Dennis Frenchman, Christopher Zegras, J. Cressica Brazier
PROJECT PAPER CONFERENCE PAPER
The Energy Proforma
Measuring neighborhood energy performance for design, development, and urban policy J. Cressica Brazier, Shan He
PROJECT PAPER
Simulation of Household In-home and Transportation Energy use
An integrated behavioral model for estimating energy consumption at the neighborhood scale Feifei Yu, Christopher Zegras
CONFERENCE PAPER MASTERS THESIS
Neighborhood Energy Performance Policy for China A Proposal for Improving Urban Energy Efficiency through Regulatory, Municipal Finance, and Market-Based Strategies Qianqian Zhang, Liu Liu, J. Cressica Brazier
PROJECT PAPER

II - 2
Implementing Energy-Efficient Neighborhood Form in China: Cases of Residential Planning Regulation and Practice in Jinan and Shenzhen J. Cressica Brazier
PHD PAPER 2. Making Clean Energy Neighborhoods: The Energy Proforma in Policy and Practice
Dennis Frenchman and Christopher Zegras, PI's. 2013. MIT: SAP Press. RESEARCH SUMMARY + 2012 URBAN DESIGN STUDIO BOOK
3. Clean Energy Guidelines for Neighborhood Design in Rapidly Urbanizing China
Alexis Wheeler MASTERS THESIS
Year 2 (2012)
4. Making the Clean Energy City in China: Year 2 Report
Dennis Frenchman, Christopher Zegras, PIs PROJECT REPORT
5. Neighborhood Design and the Energy Efficiency of Urban Lifestyle in China:
Treating Residence and Mobility as a Lifestyle Bundle Yang Chen
PHD DISSERTATION 6. Household Operational Energy Consumption in Urban China:
A Multilevel Analysis Dong Wang
MASTERS THESIS
Year 1 (2010-2011)
7. Making the Clean Energy City in China: Year 1 Report
Dennis Frenchman, Christopher Zegras, PIs PROJECT REPORT
8. Designing Clean Energy Cities: New Approaches to Urban Design and Energy
Performance Dennis Frenchman, Jan Wampler, and Christopher Zegras, PI's. 2010. MIT: SAP Press.
RESEARCH SUMMARY + 2010 URBAN DESIGN STUDIO BOOK
II - 3
9. Clean Energy Neighborhoods: Global Scan
Dennis Frenchman, Christopher Zegras, PIs PROJECT STUDY
10. Clean Energy Development Patterns
Dennis Frenchman, Christopher Zegras, PIs PROJECT STUDY
11. Does Energy Follow Urban Form?
An Examination of Neighborhoods and Transport Energy Use in Jinan, China Yang Jiang
MASTERS THESIS
12. Integration of Renewable Energy with Urban Design
Based on the Examples of Solar Photovoltaics and Micro Wind Turbines Heshuang Zeng
MASTERS THESIS
13. Operational Energy Consumption and GHG Emissions in the Residential Sector in
Urban China: An Empirical Study in Jinan Jiyang Zhang
MASTERS THESIS 14. The Form of Clean Energy Neighborhoods:
How It Is Guided and How It Could Be Jue Wang
MASTERS THESIS

1
CLDEAn IntLow-ca
Dennis F
LEAESIGtroductionarbon Ne
Frenchman,
AN EGN n to the Eeighborho
, Christophe
ENEIN
Empiricalood Deve
er Zegras, J
ERGCHl Analysi
elopment
J. Cressica B
GY UINA
is, Practic
Brazier
URBA
ce, and P
BAN
Policy of
N

1 - 1
1
CLEAN ENERGY URBAN DESIGN IN CHINA An Introduction to the Empirical Analysis, Practice, and Policy of Low-carbon Neighborhood Development
Dennis Frenchman, Christopher Zegras, J. Cressica Brazier
ABSTRACT
In this paper, we present ongoing research aimed at identifying low-carbon planning and design patterns at the neighborhood scale and finding effective ways to implement these principles in rapidly developing Chinese cities. Based on empirical analysis of the relationships between energy and urban patterns in China, we have developed the Energy Proforma©, an openly accessible online tool that enables urban designers, developers, regulators and researchers to understand, ex ante, the relative energy consumption among proposed neighborhood designs. The current version of this energy assessment tool is calibrated for Jinan, China, using a survey by Shandong University of over 4,500 households in 23 neighborhoods, which represent four prototypical development patterns in the city. We demonstrate how design elements that impact residential energy use – including building height, density, coverage, solar exposure, wind porosity, road connectivity and type, land use mix, unit size, parking, and construction type – fit within the current regulatory regime for urban planning and residential design. We then show how the energy assessment tool can inform design guidelines for low carbon neighborhood forms, and how these guidelines can be implemented within the Chinese land use control and regulatory planning system to produce measurable improvements in residential energy performance. We also propose a new, performance-based planning approach, the Neighborhood Energy Performance Standard, which would establish an expected reduction in

1 - 2
overall energy consumption for new residential developments, compared with a baseline neighborhood’s energy use. We conclude with implications for monitoring, evaluation, and comprehensive policy support for low-carbon neighborhood development, across the arenas of municipal finance, governance, and market transformation.
Introduction
China’s urban landscape is being dramatically transformed through rapid urbanization, changing standards of living, and a massive shift to more energy-intensive consumer lifestyles. While numerous studies have examined energy consumption and efficiency at the metropolitan and building scales, few studies or policies target the urban development scale. This is the scale often referred to as ‘superblocks’ in China: the neighborhoods, commercial districts, and real estate projects that form the fundamental building blocks of urban growth. China will need to build cities that can accommodate over 350 million new urban inhabitants in the next 20 years (Woetzel et al. 2008)—the equivalent of over 30,000 neighborhood units in current housing practice. In concert with an expanding urban population, the growing demands of urban residents, from private vehicles and living space to consumer goods, will create even greater strain on China’s energy resources. Energy consumption attributable to commercial and residential buildings in China remains below industrialized countries—approximately 36% of total energy demand in 2003 (Bressand et al. 2007)—but will continue to increase with the standard of living. China has already become the largest carbon emitter in the world. To face this challenge, China has set targets of a 16% reduction in energy intensity and a 17% reduction in carbon intensity within the term of the 12th Five-Year Plan (Lewis 2011). Achieving these goals would require significant carbon reduction efforts in arenas across the economy, making the implementation of clean energy development strategies even more urgent. In contrast to the ambitious energy policies and implementation plans at the national level, urban planning agencies at the local level receive little guidance for how to apply energy intensity reduction targets or develop local carbon reduction action plans (Zhou et al. 2011). City administrators and real estate developers also possess limited knowledge about the relationship of energy consumption and neighborhood form, and no standard exists to provide guidance for achieving energy efficiency at a wider scale than the individual building (MIT and Tsinghua 2012). Our work aims to fill the gap in research on relationships between neighborhood-level urban form and energy consumption. As part of a multi-year research project at the Massachusetts Institute of Technology, entitled Making the Clean Energy City in China, we are identifying patterns of clean energy development at the neighborhood level and crafting the analysis tools needed for achieving widespread adoption of these low-carbon urban forms. This research has resulted in the Energy Proforma©, a comprehensive rapid assessment tool for neighborhood energy consumption. In this paper, we first describe the functionality and potential applications

1 - 3
of the Energy Proforma, with which stakeholders in urban development can conduct ex ante evaluations of the energy consumption of neighborhood designs—including operational, transport, and embodied energy use—and also determine the potential for on-site renewable energy generation. Next, we describe the survey-based empirical study of household energy consumption patterns in the case city of Jinan, China, which forms the basis for the Energy Proforma estimation models. We then illustrate how the Energy Proforma has been used by design studios at MIT and Tsinghua University to advance the energy performance as well as environmental quality of neighborhood design proposals, and how low-carbon neighborhood development patterns can be identified by using the Proforma. In the final section, we synthesize the lessons of the design studios and empirical research to propose a new, performance-based energy benchmarking and planning approach: the Neighborhood Energy Performance Standard. Building on this standard for reducing overall energy consumption in new residential developments and retrofit projects, we conclude with the key roles that municipal finance reform and market transformation can play in supporting a shift to clean energy neighborhood development. Clean energy neighborhood development—a built environment that achieves greater energy efficiency while maximizing on-site renewable energy generation—is an untapped resource at the neighborhood scale. What and how we build not results in energy consumption today, but also affects inhabitants’ behavior and use of energy in their daily lives for decades into the future. Together with this project’s partner institutions, including Tsinghua University, Beijing Normal University, and Shandong University, and with the sponsorship of the Energy Foundation, Beijing, we intend to facilitate the implementation of cleaner, more energy efficient, and higher quality patterns of urban development. In short, we envision a Chinese model for assessing and encouraging clean energy urban form that can become the standard of practice for urban development worldwide.
The Energy Proforma©: a rapid neighborhood energy assessment tool
Creating clean energy neighborhood development is fundamentally different than implementing building energy efficiency or encouraging more efficient urban-scale form. Both private and public stakeholders must be engaged in the process, in a coordinated effort that moves beyond the building envelope to where interactions among buildings, spaces and streets form the context for urban activities. The relationships among buildings can profoundly affect energy consumption; a cluster of buildings may cast shadows on one another, buffer the wind, or reduce exposed surface area. The distribution of buildings and uses can also affect travel behavior by facilitating pedestrian movement or requiring the use of a car. Understanding the interdependent energy impacts of these urban design decisions, spanning both public and private realms, requires a comprehensive, integrated method for analyzing direct energy
1 - 4
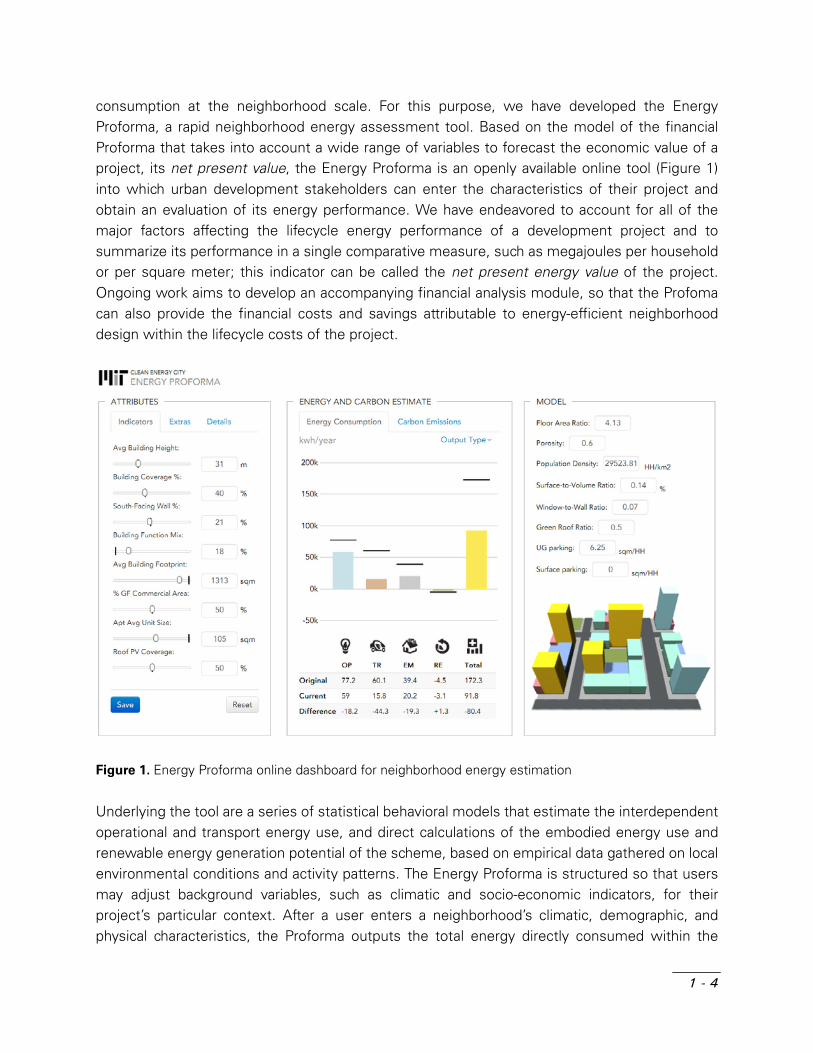
consumption at the neighborhood scale. For this purpose, we have developed the Energy Proforma, a rapid neighborhood energy assessment tool. Based on the model of the financial Proforma that takes into account a wide range of variables to forecast the economic value of a project, its net present value, the Energy Proforma is an openly available online tool (Figure 1) into which urban development stakeholders can enter the characteristics of their project and obtain an evaluation of its energy performance. We have endeavored to account for all of the major factors affecting the lifecycle energy performance of a development project and to summarize its performance in a single comparative measure, such as megajoules per household or per square meter; this indicator can be called the net present energy value of the project. Ongoing work aims to develop an accompanying financial analysis module, so that the Profoma can also provide the financial costs and savings attributable to energy-efficient neighborhood design within the lifecycle costs of the project.
Figure 1. Energy Proforma online dashboard for neighborhood energy estimation
Underlying the tool are a series of statistical behavioral models that estimate the interdependent operational and transport energy use, and direct calculations of the embodied energy use and renewable energy generation potential of the scheme, based on empirical data gathered on local environmental conditions and activity patterns. The Energy Proforma is structured so that users may adjust background variables, such as climatic and socio-economic indicators, for their project’s particular context. After a user enters a neighborhood’s climatic, demographic, and physical characteristics, the Proforma outputs the total energy directly consumed within the

1 - 5
neighborhood, across the four dimensions of energy use:
1. Operational energy: The energy consumed in the daily operation and maintenance of the neighborhood, including energy used by individual households as well as by common areas of buildings and within public spaces. These systems include heating, cooling, elevators, water pumps, and lighting.
2. Transportation energy: The energy consumed when households travel within and outside the neighborhood to meet their daily needs, such as work, school, shopping, and entertainment.
3. Embodied energy: The energy used in manufacturing materials, transporting materials to the construction site, and then assembling the materials into the neighborhood’s physical spaces and infrastructures. This includes not only buildings and streets, but also the full scope of lifecycle analysis (LCA), from excavation to demolition.
4. On-site renewable energy production: We also take into account new stocks of energy that could be produced on site, including solar energy for electricity and hot water, wind power, and geothermal energy. The potential of a neighborhood to accommodate renewable energy is in part a function of its form. Photovoltaic and solar hot water panels require surfaces with solar exposure, wind turbines need tall buildings, and geothermal wells require larger land areas. While on-site renewable generation may not reduce total energy consumption per se, it does reduce the total GHG emissions by replacing energy generated from fossil fuels with cleaner sources.
The Energy Proforma then becomes a platform for neighborhood energy assessment by establishing what design elements should be considered, how to measure the variables that characterize these elements, and a standard unit of output (i.e., megajoules per household per annum) for easy comparisons across the energy performance of different designs. The Energy Proforma is a practical tool with which designers and developers can estimate the relative energy performance of complex development projects, particularly in the concept and schematic design phases when determining the key programs, building massing, and accessibility strategies that impact energy use. As such, the Energy Proforma is a tool for comparative feedback and decision-making rather than for precise measurement. Designers can also vary different neighborhood characteristics to understand the cumulative impacts of many small design choices, before the project is built. This information empowers the designer to decide how a project can best meet energy goals tailored to a specific project’s circumstances, thus facilitating innovation and reducing the need to rely on conventional development models or guidelines that were not formulated for the project’s actual context—an antidote to standard Modernist development. Finally, the Energy Proforma is a resource for developing more informed public policy related to urban development and energy performance. In the final section of this paper, we return to the
1 - 6
potential for using the Energy Proforma to guide a new policy framework for neighborhood energy performance. The Proforma provides policymakers with a common protocol for assessing energy consumption at the neighborhood scale. It is also transparent, so the data, assumptions, contributing variables, and their interactions can be traced by any user. The Proforma also enables a performance-based approach to planning regulation: the Proforma does not prescribe how the goals should be met nor does it aim to propose an “ideal” urban design model to be repeated over and over; rather it intends to encourage planning and design innovation. If adopted as a standard tool of practice by both the public and private sectors, then policy goals for the energy performance of urban form in different contexts, or for different types of projects, could be established.
Energy modeling and design methodology for the Energy Proforma
The Energy Proforma builds upon several years of work on developing an integrated approach to the design of clean energy neighborhoods, combining empirical data and behavioral models, and urban design studios. This approach, using real development project sites, advanced behavioral modeling methods, and research-based studio pedagogy, aims to provide practical urban design solutions using grounded evidence and to train the next generation of urban developers, planners and designers. The current version of the Energy Proforma is calibrated for Jinan, China, using data from a survey, administered by Shandong University, of over 4,500 households in 23 neighborhoods, which represent four prototypical development patterns in the city. We began by identifying these prototypical patterns that combine to form nearly the entire residential fabric of the city (Figure 2): (1) enclaves of walk-up slabs; (2) modern “towers-in-the-park” developments that typically occupy “superblock” land parcels; (3) gridded streets and blocks with mixed building types; and (4) traditional courtyard settlements and urban villages. Each of these neighborhood prototypes represent different stages of the city’s development and imply different potential relationships between urban form and energy consumption. In 2009 and 2010, Shandong and Beijing Normal Universities conducted extensive surveys of household energy consumption, travel behavior, physical characteristics, and building uses in a sample of neighborhoods that are representative of each of the above types (Table 1). The surveys that included trip records, a subset of 1203 surveys in 14 of the neighborhoods canvassed in 2010, are used to calibrate the integrated operational and transport energy consumption models (Figure 3). Yu and Zegras (2013) present a complete description of this modeling framework, which is based on the premise that households make choices between in-home and out-of-home activities such as working versus telecommuting, dining in versus dining out, and in-home versus out-of-home leisure activities. These household choices result in

1 - 7
trade-offs among operational energy use in the home, transportation energy use, and operational energy consumed outside of the home. We explicitly model the probabilities of these activity substitutions, or ‘trade-off lifestyle patterns,’ using the neighborhood form and demographic variables that may explain these choices. For example, the probability of a household dining out is dependent on income, household size, car ownership, and the neighborhood’s distance from the city center, density, and average street width. These ‘trade-off lifestyle pattern’ probabilities, which have implications for energy demand, are included as explanatory variables in the linear regression model for in-home energy use. A model for appliance ownership, calibrated to air conditioner ownership from the survey data, also produces an important factor for the in-home energy use model.
Figure 2. Four prototypical development patterns: enclave, superblock, grid, and traditional/urban village
(from left to right).
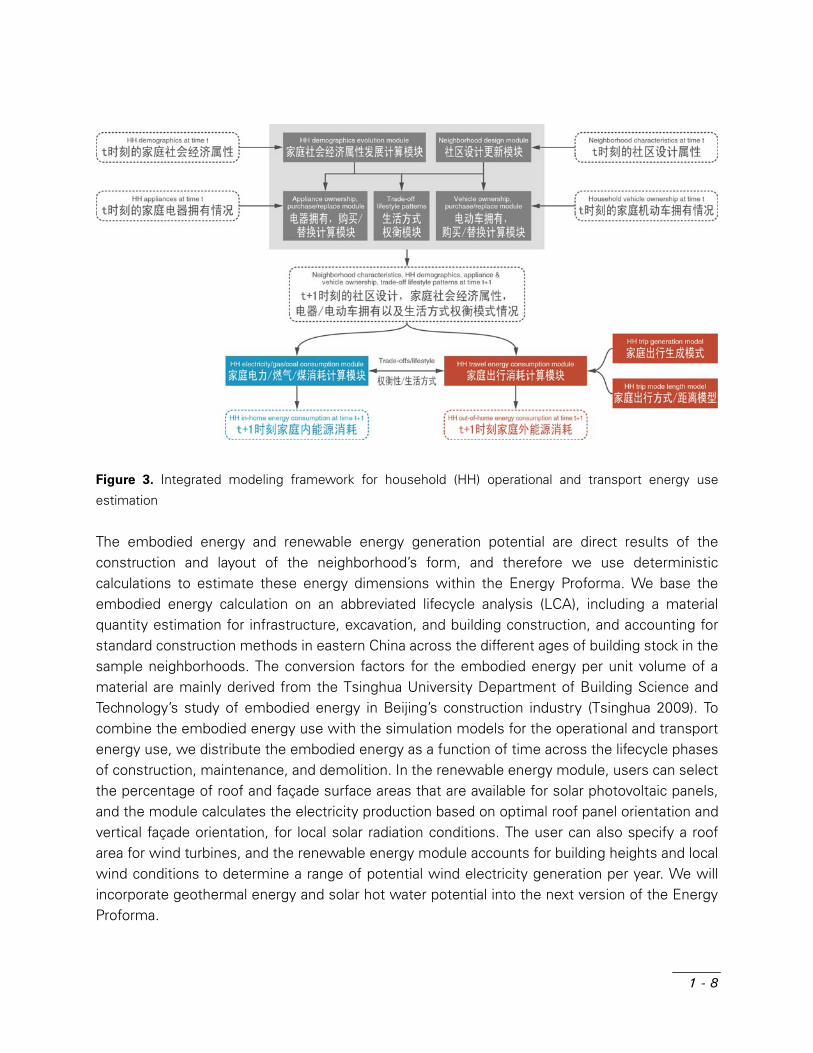
The out-of-home (transportation) energy use model is constructed from a series of behavioral models; the choice between internal and external trips, transportation mode, trip length, and the number of trips are all inputs into the transportation energy calculation. First, we estimate the household’s choice between internal (within-neighborhood) and external trips, in which neighborhood design variables including sidewalks, green coverage, and bus rapid transit (BRT) availability play an important role. Next, we use a combined model to estimate the mode (walking, bicycle, electric bike, motorcycle, car, or public transit) and trip length (short, medium, long) of the external trips. Within each model, the trips are characterized as one of four types: work, daily maintenance, leisure, and school. The trip generation model estimates the frequency of each type of trip, and this output is combined with the trips’ respective mode choice and length to arrive at a total value for household transportation energy consumption. In the current version of the Energy Proforma, we have extended these estimation models to account for changes in household demographics, appliance and vehicle ownership, and neighborhood characteristics over time in a micro-simulation framework (shown as components with dashed lines in Figure 3), so that users can estimate the evolution of energy demand and the net present energy value of a neighborhood design throughout its lifecycle.
1 - 8
Figure 3. Integrated modeling framework for household (HH) operational and transport energy use
estimation
The embodied energy and renewable energy generation potential are direct results of the construction and layout of the neighborhood’s form, and therefore we use deterministic calculations to estimate these energy dimensions within the Energy Proforma. We base the embodied energy calculation on an abbreviated lifecycle analysis (LCA), including a material quantity estimation for infrastructure, excavation, and building construction, and accounting for standard construction methods in eastern China across the different ages of building stock in the sample neighborhoods. The conversion factors for the embodied energy per unit volume of a material are mainly derived from the Tsinghua University Department of Building Science and Technology’s study of embodied energy in Beijing’s construction industry (Tsinghua 2009). To combine the embodied energy use with the simulation models for the operational and transport energy use, we distribute the embodied energy as a function of time across the lifecycle phases of construction, maintenance, and demolition. In the renewable energy module, users can select the percentage of roof and façade surface areas that are available for solar photovoltaic panels, and the module calculates the electricity production based on optimal roof panel orientation and vertical façade orientation, for local solar radiation conditions. The user can also specify a roof area for wind turbines, and the renewable energy module accounts for building heights and local wind conditions to determine a range of potential wind electricity generation per year. We will incorporate geothermal energy and solar hot water potential into the next version of the Energy Proforma.

1 - 9
These energy estimation models are combined within the Energy Proforma, so that the energy-related impact of changes in the geometry or attributes of the neighborhood design, such as building heights, will be reflected across all four dimensions simultaneously. To understand how feedback on energy performance might influence the urban design process, in which design decisions must be continuously evaluated not only for multiple dimensions of energy impacts, but also living quality, functionality, and economic concerns, we tested the Energy Proforma with student participants in three urban design studios and workshops from 2010 to 2012. In these pedagogical settings, the student designers were asked to iteratively incorporate the Energy Proforma output into their decisions on design revisions, and to explain the decisions that led them to select design iterations with higher or lower energy performance. We also evaluated nearly 100 international, neighborhood-scale development projects that include energy efficiency as a key objective, in order to assess as complete a range as possible of currently feasible forms for clean energy development.
Findings from empirical models and design studies
In the cumulative results of these studies, we can observe both the fundamental relationships between neighborhood form and energy consumption and the range of built form outcomes that clean energy neighborhoods can achieve. The descriptive energy performance results of the Jinan survey (Figure 4) reveal that total household energy consumption does differ among each of the prototypical neighborhood patterns. Most notably, households living in ‘towers-in-the-park’, superblock-type developments consume nearly twice as much energy as those in every other neighborhood. Although the energy required for building operations dominates across all the neighborhoods, there are also important variations within the three dimensions of energy consumption according to neighborhood prototype. For example, transport energy use in commercial grids and traditional neighborhoods is negligible, but it takes up a much larger proportion of the total energy in the superblock developments. Next, we use the statistical models to respond to the question of whether the urban form matters for energy consumption, even after accounting for the effects of lifestyle and socioeconomic and demographic factors. These explanatory models suggest that, holding demographics and appliance/vehicle ownership constant, a number of urban form characteristics that relate to both in-home and out-of-home energy consumption are statistically significant and important to consider in evaluating neighborhood energy performance (Table 2). The values of neighborhood form variables that are unique to superblocks – minimal building coverage on the

1 - 10
Table 1. Selected urban form characteristics of the 23 sample neighborhoods in Jinan
Measure (average) Enclave Superblock Grid Traditional
Residential density (HH/sq.km.) 18,500 12,900 11,900 15,200
Floor Area Ratio (FAR) 1.7 1.8 2.1 1.0
Site coverage (%) 35 23 36 47
Building height (average stories) 4.8 9.2 5.8 2.2
Green Coverage (%) 11 15 5 1
Building function mix index 0.27 0.17 0.39 0.22
Land use mix index within 500m 0.69 0.61 0.74 0.65
% of roads with sidewalks 42 44 69 72
Street Level Shops (% of GF
area) 14 3 6 8
Road density (km/sq.km.) 26 25 14 8
Road width (average, m) 7 12 7 9
% of roads w/cul-de-sacs 30 6 7 7
Figure 4. Household energy consumption across the sample of 23 neighborhoods in Jinan

1 - 11
ground plane, higher FAR but also higher porosity (equivalent to lower volumetric density), lower road network density, fewer nearby shops – are related to higher neighborhood energy consumption. On the other hand, characteristics such as small blocks, high levels of pedestrian amenities and uses, moderate building height and coverage, and higher population density are associated with lower energy consumption. These indicators are critical for informing urban designers how design tradeoffs will impact energy consumption. Because the Grid, Traditional, and Enclave typologies demonstrate different combinations of these characteristics of better energy performance, it seems clear that multiple neighborhood form patterns exist that can achieve high levels of energy performance. Conversely, “superblock” neighborhoods may require substantial adjustments in their form to improve their energy performance. As we will see in the demonstration design studies, this is not as difficult a task as it may seem. To explore neighborhood forms beyond the four prototypes of Jinan, we must evaluate the fundamental qualities of urban forms that may enable lower energy consumption by their inhabitants, using the guidance of the statistical analysis. These qualities can be clustered into three sets of design considerations associated with both in-home and out-of-home energy use, due to the integrated treatment of the trade-offs between activities inside and outside the home: climatic quality, road network and pedestrian connectivity, and neighborhood services and functionality. The design goal of achieving higher climatic quality encompasses many of the urban design characteristics that determine the operational energy performance of a neighborhood, including the density and orientation of the built cluster forms. Although the floor area ratio (FAR) is the primary control of built density in China’s planning system, a lower porosity for a development, or reducing the ratio of the total volume of open air to the building masses, is essential for moderating both sun and wind impacts on operational energy use. Combining lower porosity with smaller, more dense housing units will increase the effectiveness of massing density, holding all other characteristics equal. Orientation and design of buildings and their facades to achieve higher passive solar gain in the winter is also a basic requirement for energy performance, as lower in-home energy consumption is related to a higher solar exposure index. This is most likely because Jinan is heating-dominated, but solar gain may also need to be minimized in the summer, depending on site characteristics and location. Finally, more green space is associated with less travel outside the neighborhood, which implies that the quality of the outdoor climate is important for low-carbon activities as well.

1 - 12
Table 2. Relationships between neighborhood form variables and selected behavioral model results†
Measure‡
Activities
outside
home
In-home
energy
use
Number of
external
trips
Internal trip
choice
Long trip
for daily
needs
Neighborhood Area + +
Total Households +
Residential Density - +
Floor Area Ratio (FAR) + +
Site coverage -
Building height (average) -
Solar exposure index -
Porosity +
Walk-up housing form +
Apartment unit area + +
Green Coverage +
Building function mix +
Land use mix within 500m -
Underground parking - -
Surface parking +
% of roads with sidewalks +
Distance to city center - * +
Street Level Shops + -
Road density - -
Road width (average) +
Regional accessibility + -
% of roads w/cul-de-sacs -
BRT Corridor + -
Activity: telecommute +
Activity: dine out +
Activity: leisure out-of-home -
† The direction/sign of the relationship between neighborhood form explanatory variables and selected dependent
variables is shown in this table. See Yu and Zegras (2013) for complete model specifications, including demographic
variables and coefficient magnitudes.
‡ Only the measures/variables that relate to the selected model results are shown. See MIT and Tsinghua (2012) and
Yu and Zegras (2013) for a complete set of variables that are considered for these estimation models. The solar
exposure index is the percentage of façade area that faces south. Porosity is the percentage of the volume of a
neighborhood (defined by the average building height and the area of the neighborhood) not enclosed by buildings.
* More daily maintenance trips, but fewer leisure trips, are associated with a longer distance to the city center.

1 - 13
Second, planners and developers may achieve the goal of greater connectivity across a neighborhood by adjusting another bundle of variables to create a network of car, pedestrian and bicycle access to daily needs. Higher road density within and around neighborhoods may minimize vehicular travel distances from home to work, leisure, shopping, and services, and may facilitate lower-energy forms of travel such as walking or bicycling. A smaller number of external trips is also associated with a higher road network density. Higher road density then enables narrower street widths, encouraging walkability and more integrated land uses. Conversely, low road density results in fewer, wider streets that may create barriers to pedestrian movement and urban integration. The amount of pedestrian facilities—the percentage of streets with sidewalks—is also associated with residents’ choice to make internal instead of external trips, thus avoiding transport energy use. Third, the road network and pedestrian connectivity combine with the neighborhood’s functionality—the presence of integrated shops, services, and work places—to improve accessibility and therefore potentially reduce travel energy consumption. More street level shops may enable a greater amount of local trips instead of energy-intensive external trips, and the length of trips is shorter when the land use mix within a half kilometer radius is higher. These findings align with the literature on the relationships between land use and travel energy use, which suggests that separated land uses may generate more vehicle trips across the city, adding to traffic congestion and transport energy consumption. Returning to the additional dimensions of neighborhood form within the Energy Proforma, we find that the proportion of embodied energy that would be distributed to each household is as high as transportation energy use in Jinan’s superblocks (Figure 4), in contrast to the common assumption that embodied energy is negligible when compared with the magnitude of operational and transport energy use. From the perspective of net present energy value, the large initial energy costs of construction, compared with the incremental embodied energy of maintenance that will be discounted over time, may result in embodied energy having an even greater impact on the total energy performance. Thus, policies geared towards managing embodied energy should not be neglected, considering the current energy demand profile of China. Neighborhoods with greater site coverage, and therefore sufficiently low porosity and higher density for climatic quality and functionality, will also provide larger roof surfaces to accommodate PV electricity and solar hot water systems. A hybrid system of solar energy utilization could supply 10% of electricity and 100% of hot water needs during the majority of the year, especially in locations with plentiful solar resources such as Jinan. Therefore, developers should be optimizing today’s neighborhood form for long-term renewable energy generation, even if the equipment is not installed in the near term. Based on these observations of the fundamental characteristics of clean energy neighborhoods, as well as the outcomes of the Energy Proforma-based studios and the international clean

1 - 14
energy developments that the team has documented, we have defined six types of development forms that represent essentially different avenues to clean energy neighborhood design (Figure 5). These prototypes reflect diverse relationships among buildings, sites, access routes, and neighborhood uses, and they can become basic building blocks for neighborhoods with improved energy performance compared with conventional ‘superblock’ development. Within the Proforma, these prototypes can be used as a starting point for the process of designing complex neighborhood development projects. Looking across the prototypes, we can observe that there are many approaches to clean energy urban form. This is important in the context of China, where prescriptive and generalized policies can result in the reproduction of one type of urban development across the national landscape. The neighborhood designs based on these prototypes also stand out as high-quality places to live, offering diversity at the same time as the opportunity for individuality and innovation. While the prototypes vary in scale and density, they are all relatively compact. This characteristic fits well with the current trend in China of encouraging more compact growth in general, as well as with the objective of reducing energy consumption. The prototypes mix commercial and institutional uses with housing to provide convenient shops, services, and employment, thus reducing the need for motorized travel. The process and outcomes of the urban design studios thus demonstrate that it is possible to rethink the way in which designers engage with energy goals, by focusing on the influence of built form on human activity and resource consumption. Another important observation that came out of the analysis of international neighborhoods that purport to be energy efficient is that while all of those prototypes consume less energy than conventional developments, it is difficult to compare performance across representative projects. This is because each project uses different measures to assess energy consumption and different strategies to achieve energy savings. There is currently no commonly accepted protocol or even terminology for understanding the energy performance of urban development at the neighborhood scale; establishing a protocol for neighborhood energy assessment is a useful point of departure for beginning to construct a new policy framework for supporting energy efficiency at the neighborhood scale.
Figure 5. Six neighborhood prototype blocks (top) and designs that incorporate these prototypes (bottom)
1 - 15
Policy implications for urban planning, municipal finance, and market reforms
Our findings on the relationships between neighborhood-scale form and energy consumption hold important implications for the way in which real estate development is both regulated and encouraged in China. Below, we outline six policy recommendations that could guide neighborhood development toward more clean energy outcomes in both the near and long term, which build on the empirical analyses of neighborhoods in Jinan, the design studies, and an evaluation of the current energy and urban development policy regime in China (see MIT and Tsinghua 2012). These six reforms include: prescriptive requirements for real estate projects, neighborhood energy performance standards, land lease reforms, property taxation, a neighborhood labeling and disclosure program, and carbon credit trading. We also conducted a series of 20 interviews with planning officials and developers in Jinan and Shenzhen, to align these recommendations with current development practices in China and to assess how new energy guidelines and standards at the neighborhood scale might be most effectively introduced. Through this project, we have observed that energy and urban development policy spheres in China today do not adequately address energy consumption at the neighborhood scale. Nevertheless, the central government’s new energy intensity targets and policy directives for ‘eco-cities’ provide both a mandate and a critical opportunity to affect the design and development process for new and growing cities. The eco-city movement in China has thus enabled planners and urban designers to begin to engage with urban energy performance concerns. However, regulators and consultants have almost entirely focused on inserting sustainable technologies into new developments, instead of transforming the fundamental patterns of urban development that have been encoded in typical superblock plans. New towns branded as ‘eco-cities’ look and operate nearly identically to their conventional counterparts, and these built forms will most likely reinforce energy consumptive behaviors in their inhabitants. China’s eco-city demonstration projects, including Tianjin and Caofeidian, have also emphasized ex post (post-occupancy) sustainability key performance indicators (KPIs), while giving designers and developers little guidance on how to achieve these targets in the design development phase. In contrast, we propose policies that span control of what gets designed and built, as well as post-occupancy analysis of how the neighborhood actually operates. Beyond the regulation of urban design, each of the following recommendations has a strong precedent in existing local pilot projects in China and the potential to be deployed on a broad scale. Clean Energy Neighborhood Development Guidelines Transitioning to an urban development system that values energy performance will require an extended process of embedding knowledge and familiarity with low-carbon design agendas within every segment of the real estate development industry. For the near term, we propose
1 - 16
targeting the current regulatory regime for urban planning and real estate development, to re-align prescriptive criteria—including street layouts, density, use mix, and on-site renewables—with clean energy development principles directly supported by our empirical analysis of energy-efficient neighborhoods. If these guidelines are implemented within the existing revision process for urban development regulations, neighborhood development will achieve an incremental improvement in energy performance. We used the Energy Proforma to evaluate existing regulatory planning and residential codes, then we cataloged the code revisions and additional recommendations to reflect rational ranges for each of the design variables, as well as the potential energy savings due to these modifications (MIT and Tsinghua 2012). A qualitative summary of these recommendations includes: Floor area ratios should be combined with more restrictive building height limitations, in
order to increase development density and prevent ‘towers-in-the-park’ forms that typically have porosity values over 80%.
Daylight access analyses for both direct and ambient daylight should be required for plan approval, and conforming to a minimum building separation for daylight access should be disallowed.
Road spacing of 100m is recommended and should not exceed 250m. All roads should be through-streets that incorporate sidewalks, pedestrian amenities, and street-level storefronts.
The floor area requirements for commercial and public services that must be provided within neighborhoods should be revised, in order to reflect contemporary needs for walkable neighborhoods.
An ‘effective green space ratio’ that includes green space on both ground level and above-ground levels should be instituted, to allow for more ground-level space to be used for pedestrian access and mixed uses. Incentives should also be given for distributed green spaces, rather than allowing developers to fulfill the green space requirement with a single ‘central park’ type space.
We call these changes to the prescriptive codes “Clean Energy Neighborhood Development (CEND) Guidelines.” The code revision process can be complemented by clean energy neighborhood pilot projects, through which policy-makers, real estate development and urban design professionals can build experience in designing and implementing innovative neighborhoods. These CEND guidelines are logical extensions of the policies that innovative cities, including Shenzhen and Shanghai, have already implemented in their regulatory plans and residential planning codes. Neighborhood Energy Performance Standard By incorporating the Energy Proforma into the neighborhood design and evaluation process, China can move beyond conventional prescriptive guidelines to establish a performance-based energy standard at the scale of an entire neighborhood. We call this new energy assessment
1 - 17
system the Neighborhood Energy Performance Standard (NEPS), a standard that can be applied to both individual parcel analysis and the assessment of larger clusters within a regulatory plan. Similar to minimum fuel efficiency standards for motor vehicle design, a NEPS would set maximum energy consumption and carbon emissions values per square meter and per household, calibrated to an expected energy reduction from a baseline neighborhood development’s energy consumption in a specific locality. The NEPS is comparable to many international building-level energy codes that require conformance to a performance-based total ‘energy budget’, while allowing the building designer to make trade-offs between the performance of individual building components, for example by electing to improve window insulation values while reducing heating efficiency. The NEPS neighborhood-level ‘energy budget’ can be an enforceable indicator for each parcel in a regulatory plan, in the same way that floor area ratio is a performance-based control for building massing. With this standard, developers and designers can then demonstrate conformance with the NEPS by providing calculations from the Energy Proforma tool. These performance-based objectives are an important advancement over China’s conventional design regulations, which typically specify rigid, minimum dimensional requirements, with no scientific way to measure what the environmental consequences of the requirement will be in a particular case, and no means to assess trade-offs among different project requirements to achieve the best overall result. Instead of becoming an additional impediment to the design process, the NEPS can present an opportunity to bring multiple stakeholders to the table to identify possible design innovations, reconsider development priorities, and balance public interests, private real estate objectives, and consumer advocacy. The NEPS can also guide neighborhood retrofit programs, as the homeowners in contemporary superblocks contend with changing lifestyles and greater resource scarcity. China’s advancements in implementing and enforcing building energy efficiency provide a precedent for the proposed NEPS. The Design Standard for Energy Efficiency in Residential Buildings, issued by MOHURD, establishes a maximum building energy consumption value and requires either a prescriptive application of insulation and other energy conservation measures, or a performance-based simulation of the building’s thermal efficiency. New construction projects reached a nationwide compliance rate of 80% by 2008, but this rate varies substantially by local jurisdiction (Price et al. 2011). The codes and standards for urban planning will also benefit from a transition to a performance-based regulatory approach using the comparative assessment system of the Energy Proforma. Land leasing & tax reforms to support clean energy development The land leasing system is a critical near-term target for reforms focusing on clean energy development, to enable municipal governments to prioritize energy performance within their urban development strategies. In the absence of an ad valorem property tax system and a viable industrial tax base, municipalities now depend on land leases for the majority of their revenue. Not only does this dependence on land lease revenues result in insufficient funds for the

1 - 18
development and management of the urban infrastructure needed for low-carbon urban design, but local governments are also incentivized to develop more land at low density in order to generate revenue (Liu and Salzberg 2012), thus perpetuating energy-intensive development forms. If local land resource bureaus incorporate the NEPS into the land leasing conditions, land pricing in both auction and tender leasing methods could adjust to reflect the costs and potential market value of energy-efficient planning. To financially support these developments while aligning the central government’s goal of low-carbon development with local economic growth agendas, the central government may also need to formulate new fiscal transfer strategies, such as central-to-local transfers through bank ‘green loan’ subsidies for developers and urban development investment corporations. A wider reprioritization of urban development goals around low-carbon neighborhood design will also be more likely if energy performance indicators, for both the residential and commercial sectors, are incorporated into the civil service evaluation system at the municipal level for officials overseeing development projects. Similarly, as property tax reforms advance in China, municipalities should consider how this new tax instrument can promote energy efficient development. Most importantly, this revenue stream can begin to decouple the need for land development itself from the health of local finances. A secondary role of the property tax system could be to directly support and incentivize clean energy development. Municipalities could, for example, earmark tax revenues for CEND infrastructure funding as well as expand affordable housing programs, which currently are supported in property tax pilot projects (Yang 2011), to include CEND objectives. Homeowner property tax rebates may also be linked to energy performance over the lifecycle of the development, to balance any incremental CEND costs with the long-term benefits that will accrue to owners that maintain energy efficient neighborhoods. In a broader treatment of tax reforms, incentives and penalties for developers can also be linked to energy performance. Tax credits, supported by China’s Energy Conservation Law, in addition to FAR bonuses and other development allowances can all support development agreements that include CEND protocols. In sum, the potential for property and construction taxes to support low-carbon development goals should be recognized as an added incentive to implement tax reforms in China. Neighborhood energy labeling and carbon trading The final two strategies focus on market transformation. We view implementing a neighborhood energy labeling and disclosure program and allowing local development projects to participate in China’s carbon trading marketsas key strategies for influencing the value placed on urban energy efficiency in the real estate market. The first step is to establish a neighborhood energy performance database, potentially in conjunction with the housing information platform that is now under development at the national level. Systematic residential and commercial energy data collection and sharing is needed to expand the validity of energy calculation tools to all localities, in addition to enabling competition between cities and developers, greater consumer

1 - 19
awareness, and better national policymaking. Building on this neighborhood energy database, energy labeling and disclosure are essential for developing awareness of energy performance in the real estate market. The Energy Conservation Law already requires real estate developers to provide buyers with information on energy-saving measures and insulation warranties, but few conform to this rule. This requirement should be enforced and expanded to cover the range of criteria for neighborhood energy performance. China’s building ratings systems, such as MOHURD 3-Star, can also be expanded to include CEND strategies, in a similar progression as the extension of the LEED program from individual buildings to neighborhood developments. These rating systems can further validate clean energy developments, in concert with the energy disclosure requirements, and can be linked to a training and accreditation program to ensure that all CEND projects are consistently implemented and are sharing best practices. Finally, adopting a common system for measuring and monitoring neighborhood energy performance could potentially enable municipalities and developers to participate in the recently established carbon trading markets. Following the NEPS standard and evaluation protocol, verifiable carbon reduction credits from low carbon neighborhood developments could be traded to industries and other energy-intensive sectors, thereby increasing the financial viability of clean energy neighborhood development. The carbon credits could be aggregated at the residential zone plan level, either by public-private partnerships or land developers, in order to compete with other sources of carbon credits such as managed forests. Considering the magnitude of and sustained need for residential construction—1 billion square meters per year according to the 2011 China Statistical Yearbook, with an associated emissions value of 120 million tons CO2e per year (MIT and Tsinghua 2012)—carbon emission reductions in clean energy development may prove to be a substantial contribution to carbon trading markets in the long term, when compared with current carbon sequestration strategies.
Conclusion
China today is in a race against time. The current massive wave of urbanization will establish patterns of form, activity, and human behavior that will last for generations. The ways in which these neighborhoods are designed and operate have an important impact on energy demands, economic growth, natural systems, and quality of life. So far, however, inadequate attention has been paid to linking energy policy with sustainable forms of urban development. A policy regime for clean energy development patterns offers the opportunity to vastly improve the energy performance of cities at virtually no cost, as urban growth will occur with or without clean energy development policies. The implications of incorporating energy efficiency measures and distributed renewable energy technologies at the neighborhood level are wide-ranging for the sustainability agenda in China and many other countries currently undergoing rapid urbanization.
1 - 20
The outcomes of the Making the Clean Energy City in China project demonstrate the possibilities for and advantages ofachieving energy efficiency, economic feasibility, and environmental quality within an urban development process, by employing design tools for evaluating energy performance, such as the Energy Proforma. Neighborhood energy assessments can demonstrate how the actions of policy makers, real estate developers, and residential consumers combine into neighborhood forms that influence and perpetuate specific energy use patterns. The neighborhood energy performance standard, in conjunction with rapid energy assessment using the Energy Proforma, opens up a range of opportunities to policymakers for incorporating energy efficiency goals into programs for urban public finance, governance, real estate market management. Policies that regulate, monitor, and manage neighborhood-level energy consumption can then mitigate an increasing set of challenges in China, including: better managing depleting reserves of material, land, and financial resources for urban development; mobilizing regional players to achieve larger carbon intensity reduction goals; and measuring the outcomes for both policy evaluation and international climate negotiations. Because of its political and economic structure, China is in a unique position to respond quickly and effectively to this challenge, moving away from the 20th century Western ideals of Modernist developments and encouraging new forms of sustainable urban growth.
Acknowledgments
This paper is based on research supported by the China Sustainable Energy Program-The Energy Foundation and the Low Carbon Energy University Alliance. We gratefully acknowledge the collaboration of our partners, especially Jan Wampler (Professor of Architecture, MIT), Mao Qizhi (Professor of Urban Planning and Design, Tsinghua University), Zhang Jie (Professor of Urban Planning and Design, Tsinghua University), and Shao Lei (Assistant Professor of Urban Planning, Tsinghua University) and the research team whose work has been integral to the results presented here: Yang Chen, Nah-yoon Shin, Rosie Sherman, Bill Dong Wang, Daniel Daou, Yang Chu, Reza Darbari, Shani Sharif, Ira Winder, Jue Wang, Yang Jiang, Feifei Yu, Judy Zheng, Aspasia Xypolia, Heshuang Zheng, Qianqian Zhang, Liu Liu, Shan He, Yue Pan, Alexis Wheeler, Karen Johnson, and Viktorija Abolina.

1 - 21
References
Bressand, F., D. Farrell, F. Morin, J. Remes, J. Rosenfeld, J. Woetzel, and J. Yu. 2007. “Leapfrogging to Higher Energy Productivity in China.” McKinsey Global Institute.
Lewis, Joanna. 2011. “Energy and Climate Goals of China’s 12th Five-Year Plan”. Pew Center on Global Climate Change.
Liu, Z., and A. Salzberg. 2012. “Developing Low-Carbon Cities in China: Local Governance, Municipal Finance, and Land-Use Planning—The Key Underlying Drivers.” Sustainable Low-Carbon City Development in China: 97.
MIT, and Tsinghua. 2012. “Making the Clean Energy City in China.” http://energyproforma.scripts.mit.edu/documents/MIT_Clean_Energy_City_Year_2_Report_web.pdf.
Price, L., M.D. Levine, N. Zhou, D. Fridley, N. Aden, H. Lu, M. McNeil, N. Zheng, Y. Qin, and P. Yowargana. 2011. “Assessment of China’s Energy-saving and Emission-reduction Accomplishments and Opportunities During the 11th Five Year Plan.” Energy Policy.
Tsinghua University Department of Building Science and Technology. 2009. “Beijing Housing and Commercial Construction Embodied Energy Study, Interim Report (北京居住建筑与商业
建筑含能研究阶段报告).” Energy Foundation Research Reports. Woetzel, J., J. Devan, L. Jordan, S. Negri, and D. Farrell. 2008. “Preparing for China’s Urban
Billion.” McKinsey Global Institute. Yang, Luo. 2011. “Real Estate Tax (RET) of People’s Republic of China – An Analysis of the
Effectiveness of the Implementation of the RET in the Shanghai Trial”. SSRN Scholarly Paper ID 1963551. Rochester, NY: Social Science Research Network.
Yu, F., and Zegras, C. 2013. “Simulation of Household In-home and Transportation Energy Use: An Integrated Behavioral Model for Estimating Energy Consumption at the Neighborhood Scale.” In Peking University-Lincoln Institute for Land Policy Second International Workshop on Regional, Urban, and Spatial Economics in China.
Zhou, N., S. Ohshita, L. Price, and N. Zheng. 2011. “A Low Carbon Development Guide for Local Government Actions in China.” Carbon Management 2 (4): 455–469.

2
THPRMeasuand ur
J. Cressi
HE EROF
uring neigrban polic
ica Brazier,
ENEFOR
ghborhoocy
Shan He
ERGRMA
od energy
GY A
y performmance forr design, developmment,
2 - 1
2
THE ENERGY PROFORMA Measuring neighborhood energy performance for design, development, and urban policy
J. Cressica Brazier, Shan He
In the introductory article to the Making the Clean Energy City in China project (Frenchman, Zegras, and Brazier 2013), we made the case for the critical importance of low carbon neighborhood design for China as well as for developing countries that face large scale, rapid urbanization. We have also observed that urban planning agencies at the local level receive little guidance for how to develop citywide carbon reduction action plans (Zhou et al. 2011). Recently, a number of practitioners have called for neighborhood level, empirically based, digital design tools to take on the particular challenges of urban design in China and other sites of mega-development (Besserud and Hussey 2011). In response, researchers have developed energy analysis tools that account for the interaction of buildings at the neighborhood scale based on thermal performance principles (Reinhart et al. 2013). Other researchers have incorporated energy estimation into integrated large-scale urban models, using energy micro-simulation approaches (Almeida et al. 2009). Yet another cohort of urban policy-focused researchers has undertaken the development of rapid assessment tools that include urban energy performance as a subset of a broad menu of energy-related sustainability indicators, such as water and waste (Bose 2010). However, an energy assessment tool that accounts for both the usability needs of multiple stakeholders and the relationships between the urban context and individual buildings, which are associated with multiple dimensions of energy performance, has yet to be realized.

2 - 2
The Energy Proforma© is the Making the Clean Energy City project team’s proposal for an openly accessible, rapid neighborhood energy performance assessment tool that fills the need for a common, comprehensible protocol for all stakeholders in the urban development process. This tool also provides a comprehensive, integrated method for analyzing direct energy consumption at the neighborhood scale, accounting for the interdependent energy impacts of specific urban design decisions. The Energy Proforma also provides immediate feedback on the interdependent impacts on multiple dimensions of energy performance due to specific modifications to a neighborhood design, and the energy implications of cumulative design decisions. In this chapter, we describe in greater detail the premise of the Energy Proforma and its web-based framework. We then demonstrate how a designer, developer, or planning official can use the tool, as well as how users can conduct a sensitivity analysis of different neighborhood design variables—in other words, an analysis of the relative benefits of modifying specific characteristics of a neighborhood design. Finally, we consider how the Energy Proforma enables learning and design development within a research-based urban design studio, using observations from the MIT-Tsinghua Joint Urban Design Studio in 2012, and the implications that arise from this study for training practitioners in the real estate development industry across China.
What is the Energy Proforma?
The Energy Proforma© is an openly accessible, digital tool that enables urban designers, developers, regulators, and researchers to understand the relative energy consumption among proposed neighborhood designs. Instead of relying on separate models to estimate building energy or vehicle usage, the Energy Proforma allows users to integrate analysis across multiple, interdependent dimensions of energy performance: operational, transport, and embodied energy use, as well as the potential for on-site renewable energy generation. We attempt to account for all of the major factors affecting the lifecycle energy performance of a development project and to summarize its performance in a single comparative measure: yearly megajoules (MJ) or tons of CO2 equivalent (tCO2e), per household or per square meter. When the neighborhood’s future energy use is discounted to a single point in time, this indicator can be called the net present energy value of the project. In concept, the tool is similar to the financial proforma used in real estate development projects, which provides a standardized method to assess the financial performance of a proposed project. The Energy Proforma thus provides a standardized method to assess the energy performance of a development project. The basic workflow of the Energy Proforma proceeds through three steps: data input, analysis, and interactive results of the energy performance analysis. The user inputs information in a standardized format that describes a neighborhood’s design, location, and socio-economic characteristics; the Energy Proforma model engine then calculates the net present energy value of the project, as well as the characteristics that explain the neighborhood’s energy performance.

2 - 3
In the current version of the Proforma, the model engine contains a series of statistical behavioral models that estimate the interdependent operational and transport energy use, and direct calculations of the embodied energy use and renewable energy generation potential of the scheme, based on empirical data describing local environmental conditions and activity patterns (Yu and Zegras 2013). Then, while viewing the interactive results (Figure 1), the user may manipulate some of the neighborhood’s design characteristics to obtain immediate feedback on the effects of design modifications, as well as reviewing the detailed output explaining the neighborhood’s energy performance over time. A financial analysis module will soon be available, so that the Profoma can also provide the financial costs and savings attributable to energy-efficient neighborhood design within the lifecycle costs of the project. This workflow reflects some of the attributes that we believe are requisites for a practical energy analysis tool, from the perspectives of transparency, usability, and functionality. To achieve widespread usability, we attempt to provide a proof of concept of a tool that presents rapid feedback through an easy-to-use interface, if the underlying energy estimation models are configured by a researcher in advance. The initial functionality of the tool was based on decision support for designers, but we have proposed and begun to implement the Proforma as a wider platform for neighborhood energy assessment. The tool could then serve as a common protocol; the standardized procedure and metrics would allow different stakeholders to estimate and compare the energy performance of development projects, communicate by using a common metric, and then make adjustments in the design process or in the management of existing neighborhoods. The second function of an energy tool based on statistical models is to enable a performance-based approach to the regulation and market valuation of neighborhood sustainability: the Proforma does not prescribe how the perofrmance goals should be met, nor does it propose an “ideal” urban design model to be replicated. Rather, through an extensible modeling framework based on the interaction of many neighborhood form measures, an energy assessment tool should encourage planning and design innovation. Finally, the transparency of the tool is essential, if a diverse audience will evaluate and adopt the tool itself. The data, assumptions, contributing variables, and their usage in the models should be traceable by any user. The current Energy Proforma is the third major release of this software, and it represents progress towards these stated goals of the tool. Version 1.0, developed in the first year of the research project, was an Excel spreadsheet, which required measuring and text input of the dimensions of every building and road in a neighborhood design. The feedback from the 2010 MIT-Tsinghua urban design studio and 2011 workshop provided the basis for revisions that led to a second version of the Proforma that is web based. After testing version 2.0 in the 2012 design studio, the Proforma has been further developed in year 3 of the project to include “shortcut analyses” and better integration with Sketchup 3D modeling software, making the tool more practical for designers.
2 - 4
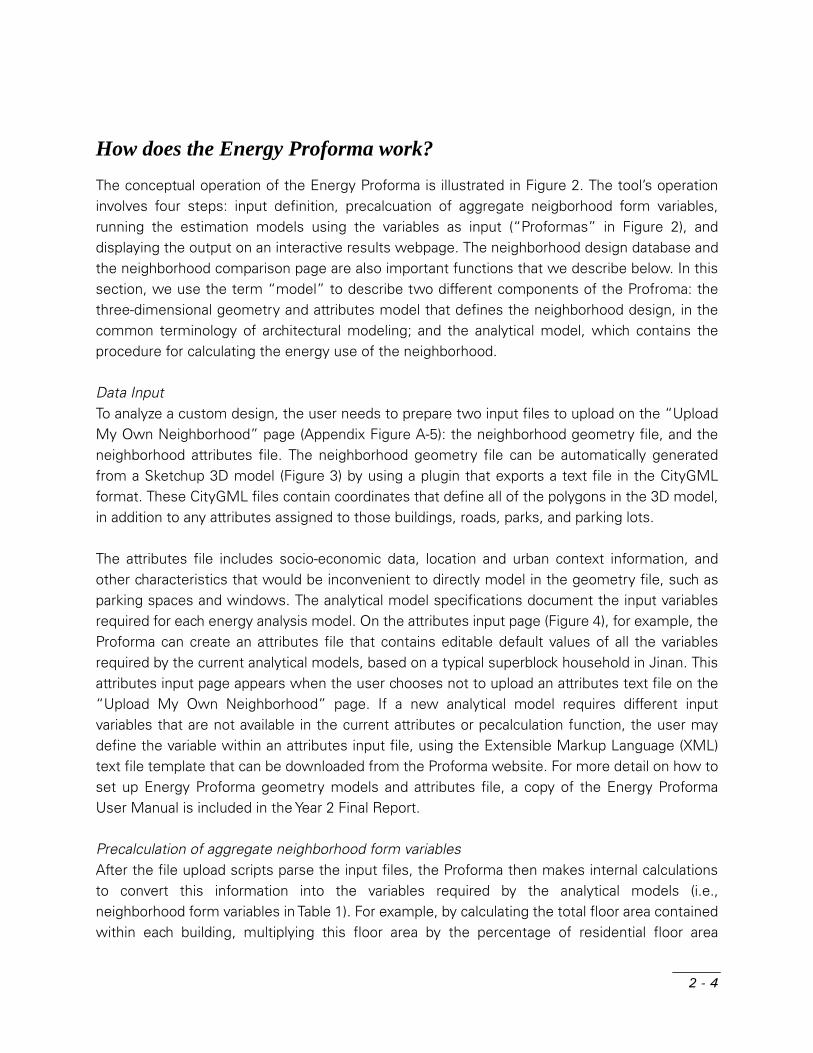
How does the Energy Proforma work?
The conceptual operation of the Energy Proforma is illustrated in Figure 2. The tool’s operation involves four steps: input definition, precalcuation of aggregate neigborhood form variables, running the estimation models using the variables as input (“Proformas” in Figure 2), and displaying the output on an interactive results webpage. The neighborhood design database and the neighborhood comparison page are also important functions that we describe below. In this section, we use the term “model” to describe two different components of the Profroma: the three-dimensional geometry and attributes model that defines the neighborhood design, in the common terminology of architectural modeling; and the analytical model, which contains the procedure for calculating the energy use of the neighborhood. Data Input To analyze a custom design, the user needs to prepare two input files to upload on the “Upload My Own Neighborhood” page (Appendix Figure A-5): the neighborhood geometry file, and the neighborhood attributes file. The neighborhood geometry file can be automatically generated from a Sketchup 3D model (Figure 3) by using a plugin that exports a text file in the CityGML format. These CityGML files contain coordinates that define all of the polygons in the 3D model, in addition to any attributes assigned to those buildings, roads, parks, and parking lots. The attributes file includes socio-economic data, location and urban context information, and other characteristics that would be inconvenient to directly model in the geometry file, such as parking spaces and windows. The analytical model specifications document the input variables required for each energy analysis model. On the attributes input page (Figure 4), for example, the Proforma can create an attributes file that contains editable default values of all the variables required by the current analytical models, based on a typical superblock household in Jinan. This attributes input page appears when the user chooses not to upload an attributes text file on the “Upload My Own Neighborhood” page. If a new analytical model requires different input variables that are not available in the current attributes or pecalculation function, the user may define the variable within an attributes input file, using the Extensible Markup Language (XML) text file template that can be downloaded from the Proforma website. For more detail on how to set up Energy Proforma geometry models and attributes file, a copy of the Energy Proforma User Manual is included in the Year 2 Final Report. Precalculation of aggregate neighborhood form variables After the file upload scripts parse the input files, the Proforma then makes internal calculations to convert this information into the variables required by the analytical models (i.e., neighborhood form variables in Table 1). For example, by calculating the total floor area contained within each building, multiplying this floor area by the percentage of residential floor area
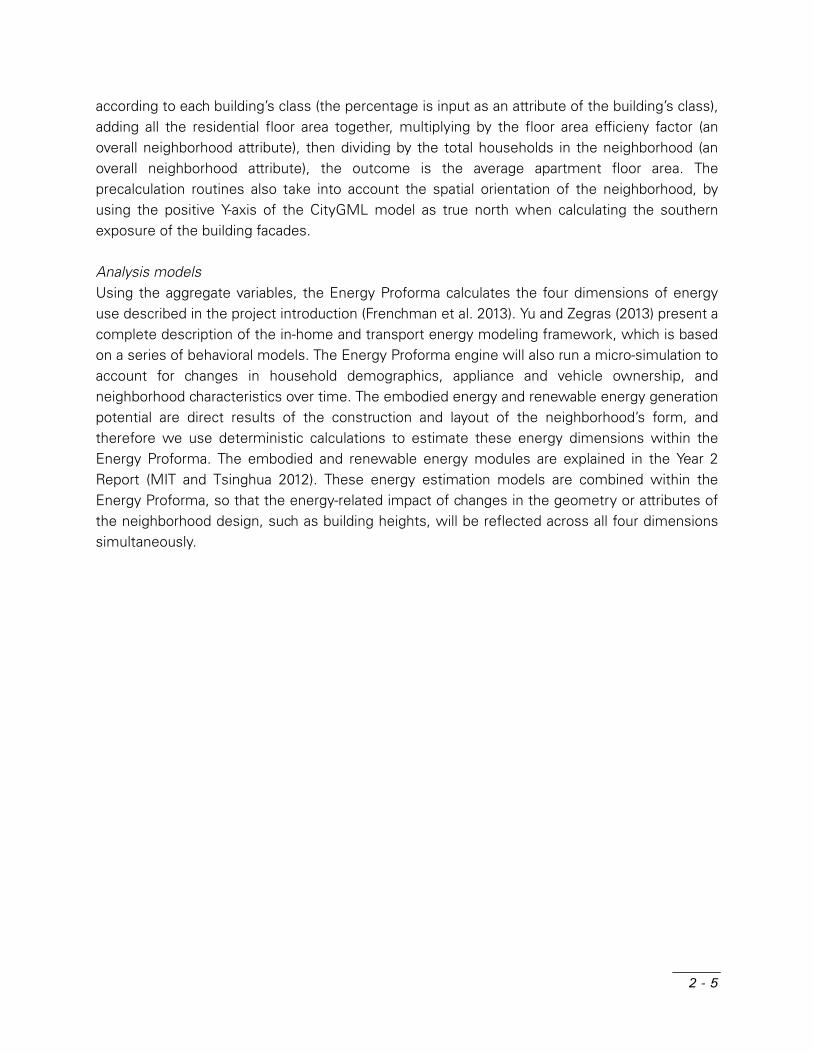
2 - 5
according to each building’s class (the percentage is input as an attribute of the building’s class), adding all the residential floor area together, multiplying by the floor area efficieny factor (an overall neighborhood attribute), then dividing by the total households in the neighborhood (an overall neighborhood attribute), the outcome is the average apartment floor area. The precalculation routines also take into account the spatial orientation of the neighborhood, by using the positive Y-axis of the CityGML model as true north when calculating the southern exposure of the building facades. Analysis models Using the aggregate variables, the Energy Proforma calculates the four dimensions of energy use described in the project introduction (Frenchman et al. 2013). Yu and Zegras (2013) present a complete description of the in-home and transport energy modeling framework, which is based on a series of behavioral models. The Energy Proforma engine will also run a micro-simulation to account for changes in household demographics, appliance and vehicle ownership, and neighborhood characteristics over time. The embodied energy and renewable energy generation potential are direct results of the construction and layout of the neighborhood’s form, and therefore we use deterministic calculations to estimate these energy dimensions within the Energy Proforma. The embodied and renewable energy modules are explained in the Year 2 Report (MIT and Tsinghua 2012). These energy estimation models are combined within the Energy Proforma, so that the energy-related impact of changes in the geometry or attributes of the neighborhood design, such as building heights, will be reflected across all four dimensions simultaneously.

2 - 6
Figure 1. Energy Proforma “neighborhood interactive results” dashboard.
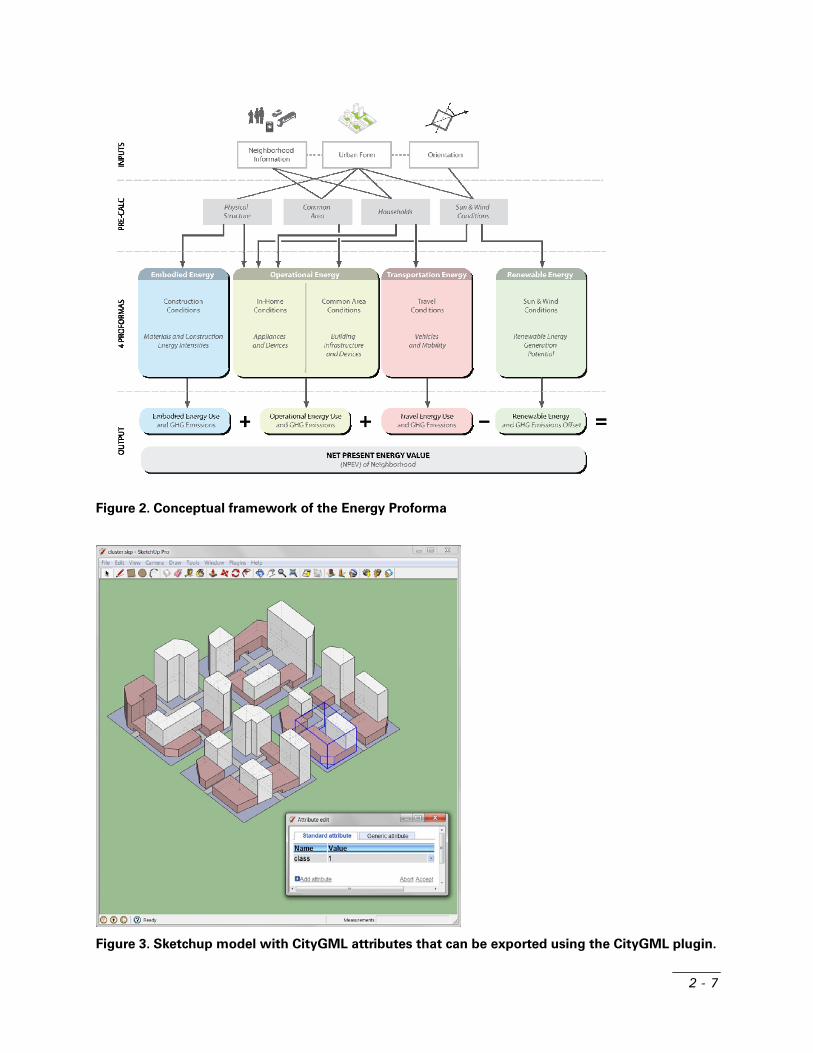
2 - 7
Figure 2. Conceptual framework of the Energy Proforma
Figure 3. Sketchup model with CityGML attributes that can be exported using the CityGML plugin.
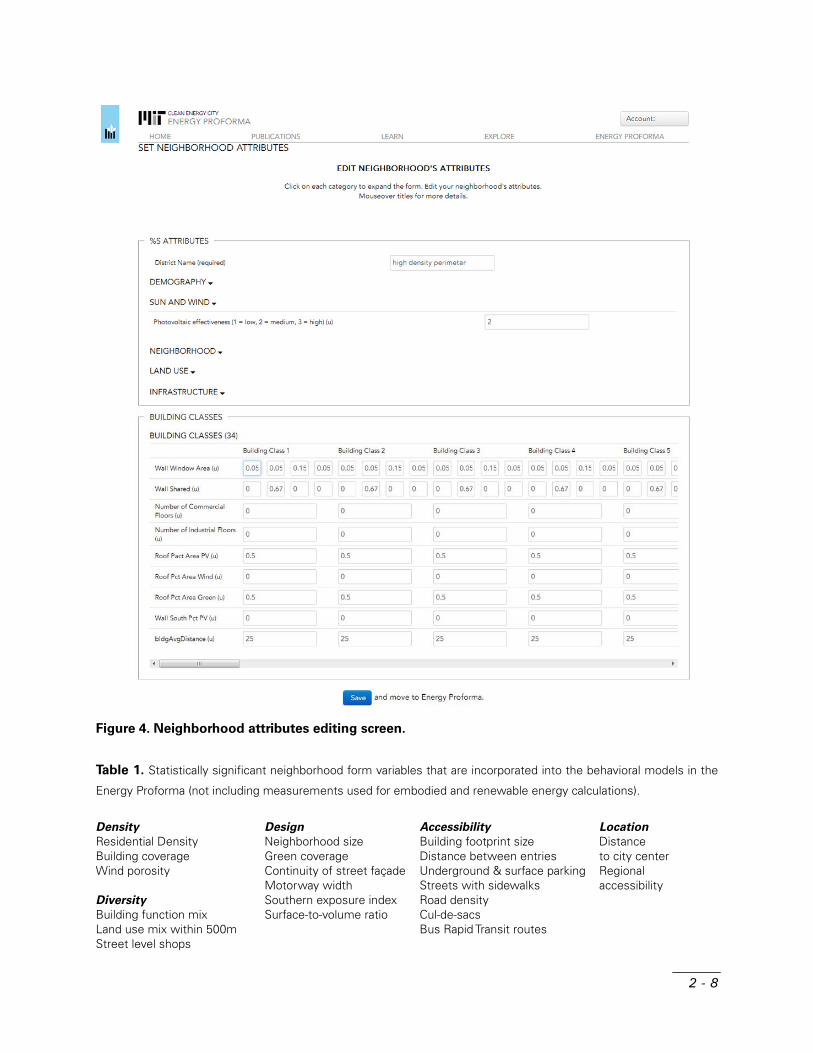
2 - 8
Figure 4. Neighborhood attributes editing screen.
Table 1. Statistically significant neighborhood form variables that are incorporated into the behavioral models in the
Energy Proforma (not including measurements used for embodied and renewable energy calculations).
Density
Residential Density Building coverage Wind porosity Diversity
Building function mix Land use mix within 500m Street level shops
Design
Neighborhood size Green coverage Continuity of street façade Motorway width Southern exposure index Surface-to-volume ratio
Accessibility
Building footprint size Distance between entries Underground & surface parking Streets with sidewalks Road density Cul-de-sacs Bus Rapid Transit routes
Location
Distance to city center Regional accessibility

2 - 9
Interactive output display The initial energy analysis, based on the user-input variables, is presented in a single dashboard display, shown in Figure 1 for the neighborhood version of the Proforma. The user can visually verify that the CityGML model produced an accurate representation of the neighborhood’s form, by inspecting the 3D OpenGL model in the “Model” panel. In the “Energy Estimate” panel, the total annual energy performance per household is presented by default, along with its constituent elements, including embodied, operational, and transport energy consumption, and renewable energy generation potential. The “Energy Analysis” panel also provides conceptual values of the breakdown of each type of energy use, according to the variables that explain a proportion of the energy use in the analytical models (Figure 10). The user may change the display units to energy per square meter of residential construction, or tons of CO2 equivalent emitted. The results webpage also enables the user to manually adjust the input parameters by moving the sliders in the Attributes panel, within realistic limits, to observe the effect that these design changes might have on energy performance. The movement of the sliders triggers a recalculation of the energy performance, using the same analysis models as the initial run. The output charts then dynamically update, while still retaining a marker at the original energy values for comparison against the initial input. Note that these changes to the neighborhood form variables do not actually change the geometry of the neighborhood model. The Proforma leaves these design modifications to the user, who should be able to control how the target variable values are achieved, such as a higher floor area ratio or a narrower average street width. Finally, after manipulating the sliders, the user may save the new design variables and energy analysis results in the database, in order to compare multiple iterations of one or more schemes. The results screen will soon provides access to information on the analysis models, to fulfill the objective of transparent analysis. Neighborhood model database When the user reaches the Interactive Results screen, the geometry, attributes, and initial results of the energy analysis have already been saved in the online database (Figure 5). Clicking the “Save” button on the interactive results page will save a new entry with updated slider variables. The database can be accessed by logging in, then clicking on “View Saved Models” on the Energy Proforma menu screen (Appendix Figure A-4). We also made the database open to any web user who logs in, so that users could investigate each other’s neighborhood schemes. The Proforma platform thus becomes a reposity for experiments of clean energy neighborhood design. Neighborhood design comparison view The final way that users can interact with the neighborhood designs is via the model comparison view (Figure 6). On the Neighborhood Model Database page, the user can select the models to compare by clicking the check boxes, then clicking “compare checked” at the top of the page. In

2 - 10
the current version, the overall energy results for each neighborhood will be displayed in a comparison chart, in addition to basic indicators such as FAR. In future versions, we will include more options for comparison, as well as 3D model views.
Figure 5. Neighborhood and district model database screen.
Figure 6. Neighborhood and district energy performance comparison screen.

2 - 11
Who can use the Energy Proforma?
The Energy Proforma is a practical tool with which urban development stakeholders can estimate the relative energy performance of complex development projects, particularly in the concept and schematic design phases when determining the key programs, building massing, and accessibility strategies that impact energy use. As such, the Energy Proforma is a tool for comparative feedback and decision support rather than for precise measurement. The Energy Proforma then becomes a platform for neighborhood energy assessment by establishing what design elements should be considered, how to measure the variables that characterize these elements, and a standard unit of output (i.e., megajoules per household per annum) for easy comparisons across the energy performance of different designs. Below, we outline how each of the major stakeholders can engage with the tool’s database and output. In these descriptions, we make frequent reference to the policies that might drive the usage of the Proforma, which are explored in the Neighborhood Energy Performance Policy Report.
Figure 7. Online Energy Proforma framework and end users

2 - 12
Developers Three features of the Proforma are suited to a developer’s decision making role in the development process: a rapid, exploratory energy evaluation pathway (“shortcut analysis”), a development scheme comparison dashboard, and a lifecycle cost analysis. This tool fits the energy analysis needs in the preliminary design phases when communication across a project team is essential for setting energy performance goals. The simplified, exploratory process (“shortcut analysis”) (Figure 9) would provide developers with the information needed for establishing initial goals for the design team, with limited design and input effort required. The developer could also use the exploratory analysis to evaluate different land parcels for their energy performance potential, by testing a neighborhood prototype on each parcel. As with the custom design, the user may adjust key parameters to understand how to improve performance. At the concept or preliminary design stage, when multiple design options are still being considered, the Energy Proforma may be used to assess the potential of different prototypes on a particular site. This process would begin with an exploratory analysis of prototypes. We are gradually preloading numerous prototypical forms of clean energy neighborhood development, in addition to the empirical examples from Jinan and international development. These prototypes can then be used as a starting point for the process of designing complex neighborhood development projects. The designers can then modify these prototypes and upload the new options into the Proforma database as custom neighborhoods, and the developer can review the designs in the development scheme comparison dashboard (Figure 6). The Proforma is thus a useful tool for an iterative design process among different stakeholders. As more detailed information becomes available during design development, developers can remain informed of the cost impacts of more or less energy efficient development schemes by using a type of financial proforma that incorporates the potential variations in energy pricing over time, for evaluation of lifecycle costs (Figure 8). Designers Designers can participate in the preliminary design phase as described above, in addition to producing more detailed neighborhood schemes and energy analyses as the project progresses. With the interactive results page, the designer can vary different neighborhood characteristics to understand the cumulative impacts of many small design choices, before the project is built. The “Energy Analysis” panel also provides conceptual values of the breakdown of each type of energy use, according to the variables that explain a proportion of the energy use in the analytical models (Figure 10). With this detailed information, the analyst can make more refined decisions about tradeoffs within the neighborhood design; for example, based on the information in Figure 10, the designer could encourage other disciplines to consider alternatives to energy intensive steel construction or to allow for smaller building footprints. This information empowers the designer to decide how a project can best meet energy goals tailored to a specific project’s circumstances, facilitating innovation and reducing the need to rely on conventional development models or guidelines that were not formulated for the actual context.

2 - 13
Figure 8. Mockup of Financial Analysis dashboard that will be accessible on the "Neighborhood
Interactive Results" screen.
Figure 9. Explore Prototype screen (shortcut analysis). High Density Perimeter block is shown.

2 - 14
Figure 10. Contents of the Operational, Transport, and Embodied Energy tabs in the detailed Energy
Analysis dashboard on the "Neighborhood Interactive Results" screen.

2 - 15
Figure 11. Mockup of District Interactive Results screen.

2 - 16
Urban Planning Authorities In the newest feature to be added to the Energy Proforma 3.0, we combine the “shortcut analysis” with the ability to analyze multiple parcels at the same time. By uploading geometry input files that define the roads, parcel areas, and their aggregate characteristics instead of the complete three-dimensional forms of every parel, urban planning authorities can quickly assess the overall energy performance of a district regulatory plan (Figure 11). These aggregate characteristics, such as FAR or building height limits, can then be adjusted using sliders for each parcel and assigned as required indicators for the neighborhood development. Alternatively, the characteristics of each parcel can be adjusted to achieve a target total energy performance; the resulting energy total can then be assigned to the parcel as a maximum allowable energy use per household. This performance-based approach follows our policy proposal for a Neighborhood Energy Performance Standard, similar to the performance-based design process for energy efficiency that conforms to an “energy budget.” Policymakers at the municipal and central levels Finally, the Energy Proforma is a resource for developing more informed public policy related to urban development and energy performance. In the Policy Report, we return to the potential for using the Energy Proforma to guide a new policy framework for neighborhood energy performance. The Proforma provides policymakers with a common protocol for assessing energy at the neighborhood scale. Energy performance can thus effectively be monitored, evaluated, and revised before and after construction. Researchers In addition to the list of actual players in the development process, we also want to emphasize the value of the Energy Proforma framework for academic researchers who could test and contribute to the analysis models, and add breadth of energy performance that the Proforma could incorporate, such as material flow accounting, human metabolism, or detailed heat island effects. Researchers can use the chronological, linked database entries to trace the iterative design development of each user’s neighborhood schemes, in order to understand the design decision process and use of the Proforma. Researchers may also better understand the performance of proposed or built projects for case studies.
Where can the Energy Proforma be used?
The current version of this energy assessment tool is calibrated for Jinan, China, using a survey by Shandong University of over 4,500 households in 23 neighborhoods that represent the range of prototypical development patterns in the city. Thus, the energy performance estimates are valid for the heating-dominated climate, construction practices, and particular activity patterns of Jinan. If activity and energy consumption data were collected for households in another city, then the statistical models underlying the Energy Proforma could be recalibrated to produce
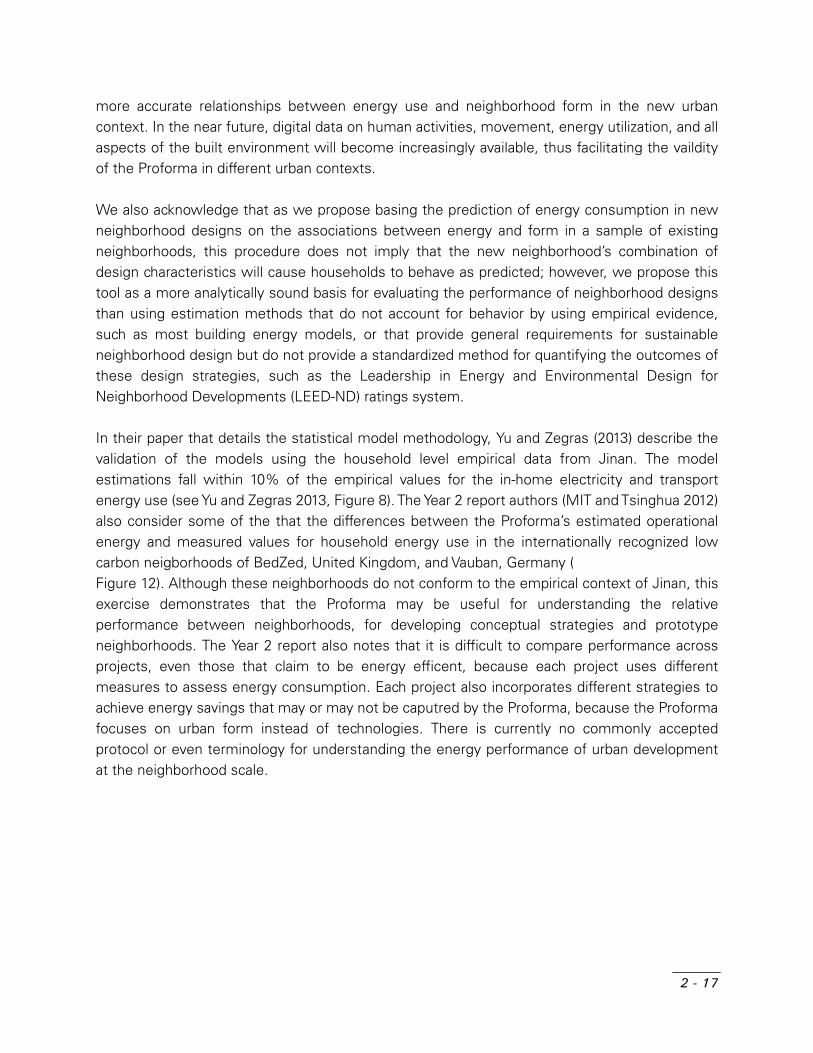
2 - 17
more accurate relationships between energy use and neighborhood form in the new urban context. In the near future, digital data on human activities, movement, energy utilization, and all aspects of the built environment will become increasingly available, thus facilitating the vaildity of the Proforma in different urban contexts. We also acknowledge that as we propose basing the prediction of energy consumption in new neighborhood designs on the associations between energy and form in a sample of existing neighborhoods, this procedure does not imply that the new neighborhood’s combination of design characteristics will cause households to behave as predicted; however, we propose this tool as a more analytically sound basis for evaluating the performance of neighborhood designs than using estimation methods that do not account for behavior by using empirical evidence, such as most building energy models, or that provide general requirements for sustainable neighborhood design but do not provide a standardized method for quantifying the outcomes of these design strategies, such as the Leadership in Energy and Environmental Design for Neighborhood Developments (LEED-ND) ratings system. In their paper that details the statistical model methodology, Yu and Zegras (2013) describe the validation of the models using the household level empirical data from Jinan. The model estimations fall within 10% of the empirical values for the in-home electricity and transport energy use (see Yu and Zegras 2013, Figure 8). The Year 2 report authors (MIT and Tsinghua 2012) also consider some of the that the differences between the Proforma’s estimated operational energy and measured values for household energy use in the internationally recognized low carbon neigborhoods of BedZed, United Kingdom, and Vauban, Germany ( Figure 12). Although these neighborhoods do not conform to the empirical context of Jinan, this exercise demonstrates that the Proforma may be useful for understanding the relative performance between neighborhoods, for developing conceptual strategies and prototype neighborhoods. The Year 2 report also notes that it is difficult to compare performance across projects, even those that claim to be energy efficent, because each project uses different measures to assess energy consumption. Each project also incorporates different strategies to achieve energy savings that may or may not be caputred by the Proforma, because the Proforma focuses on urban form instead of technologies. There is currently no commonly accepted protocol or even terminology for understanding the energy performance of urban development at the neighborhood scale.
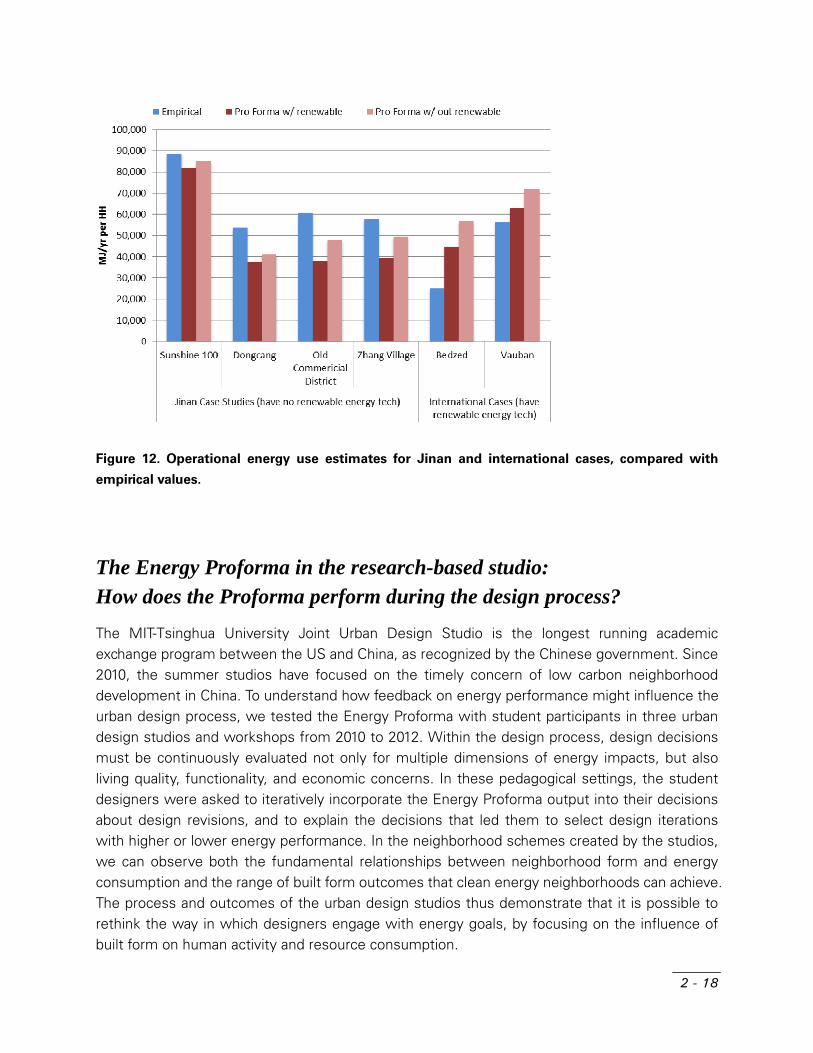
2 - 18
Figure 12. Operational energy use estimates for Jinan and international cases, compared with
empirical values.
The Energy Proforma in the research-based studio: How does the Proforma perform during the design process?
The MIT-Tsinghua University Joint Urban Design Studio is the longest running academic exchange program between the US and China, as recognized by the Chinese government. Since 2010, the summer studios have focused on the timely concern of low carbon neighborhood development in China. To understand how feedback on energy performance might influence the urban design process, we tested the Energy Proforma with student participants in three urban design studios and workshops from 2010 to 2012. Within the design process, design decisions must be continuously evaluated not only for multiple dimensions of energy impacts, but also living quality, functionality, and economic concerns. In these pedagogical settings, the student designers were asked to iteratively incorporate the Energy Proforma output into their decisions about design revisions, and to explain the decisions that led them to select design iterations with higher or lower energy performance. In the neighborhood schemes created by the studios, we can observe both the fundamental relationships between neighborhood form and energy consumption and the range of built form outcomes that clean energy neighborhoods can achieve. The process and outcomes of the urban design studios thus demonstrate that it is possible to rethink the way in which designers engage with energy goals, by focusing on the influence of built form on human activity and resource consumption.

2 - 19
In 2012, the instructors of the MIT-Tsinghua Joint Urban Design Studio incorporated the second version of the Energy Proforma and the underlying research findings on the relationships between energy and urban form into the design studio process. We also conducted entry and exit surveys of all students and in-depth interviews with a subset of the students, to observe possible changes in their comprehension of low carbon development principles and attitudes towards working with energy analysis tools. The web-based version of the Proforma proved to be relatively convenient to access and use, compared with the Excel version used in 2010. The visual feedback afforded by the interactive website was the most effective component of the Proforma for improving students’ understanding of household energy use. We found that teams should be carefully structured and briefed by instructors, if each team member is to attain a balanced understanding of energy use in neighborhoods. Unless the instructors coach all students about the fundamental principles of neighborhood energy performance, Proforma input, as well as the detailed results of the Proforma analysis that could inform their designs, then team members not responsible for Energy Proforma output will most likely not engage with the tool. Moreover, dedicated “energy analysts” may still treat the analysis software as a “black box” and will thus find the process of design improvements and innovations for energy efficiency more challenging. For a fast-paced design production environment that mirrors today’s practice of urban design in China, participants will not rely on in-depth documentation such as the research reports and separate design manuals, and they are less likely to make iterative design studies if the neighborhood geometry has to be modeled independently of the master digital model. Instead, student feedback suggests that practitioners need an energy analysis process that is fully integrated with the design workflow and that is transparently explained within the analysis tool itself. Instructional methods, team organization, and the design process
In total, seventeen MIT and nine THU architecture students participated in the studio, and these students were joined by two MIT research assistants. The instructors included Professors Dennis Frenchman, Jan Wampler, and Christopher Zegras from MIT and Zhang Jie and Shao Lei from THU. The Tsinghua participants all belonged to the urban planning program, with a mix of Master and PhD degree candidates, except for one building technology student. Some of these students had taken part in summer internships. The MIT students were evenly distributed between the Master of Architecture and Master of City Planning programs, and all the students had previously worked in the architecture, planning, and energy services industries for 2 to 9 years, with an average of 3.3 years. Most of the MIT students were therefore familiar with the project workflow in a design office and could speak to the usefulness of incorporating energy performance information and energy analysis software into a professional design process. Two THU students and one MIT student did not complete both the entry and exit surveys. The studio began in Jinan, where students were distributed into five teams to analyze the urban

2 - 20
form and energy use characteristics of an existing neighborhood, each representing one of several typical development patterns. The students mapped the neighborhoods, talked with residents, and observed activities that provided a realistic basis for their subsequent projects. The new neighborhood designs, begun at Tsinghua University after several days of analyzing the existing neighborhoods, were sited within the new town surrounding the Jinan West high speed rail station. We instructed each team to appoint a representative who would be responsible for communicating about Energy Proforma issues with the teaching staff. Even though we encouraged the groups to arrange the energy analysis work according to their own interests and collaboration methods, all the groups delegated the Energy Proforma work to one MIT “energy analyst” on each team. If we had not requested one point of contact for each team, then the teams might have organized themselves differently. The first design evaluation trials with the Proforma, in which only the “energy analysts” elected to participate, proceeded in close cooperation with the research assistants. Reinhart (2011) asks if the energy assessment tools should be available online for any participant or mediated by an energy analysis “professional.” Although many students seem to have gained a greater appreciation for the impact of neighborhood form changes on neighborhood energy performance, half of the students revised their responses to the question of how to conduct an urban design process that is focused on energy performance (Figure 13). All but five of the students had expected that full collaboration would be possible, in which every team member would interact with the energy analysis software and incorporate findings into the design. Notably, all but one of the MIT students preferred full collaboration. At the end of the studio, however, half of the students preferred a discipline-based division of design and energy analysis work that mirrored the team structure of the past month. These responses may reflect the challenges that some group members faced when communicating with the “energy analysts” and not being able to interact with the tool themselves.
Figure 13. Students' preferred team strategy for incorporating the Energy Proforma into the design
process
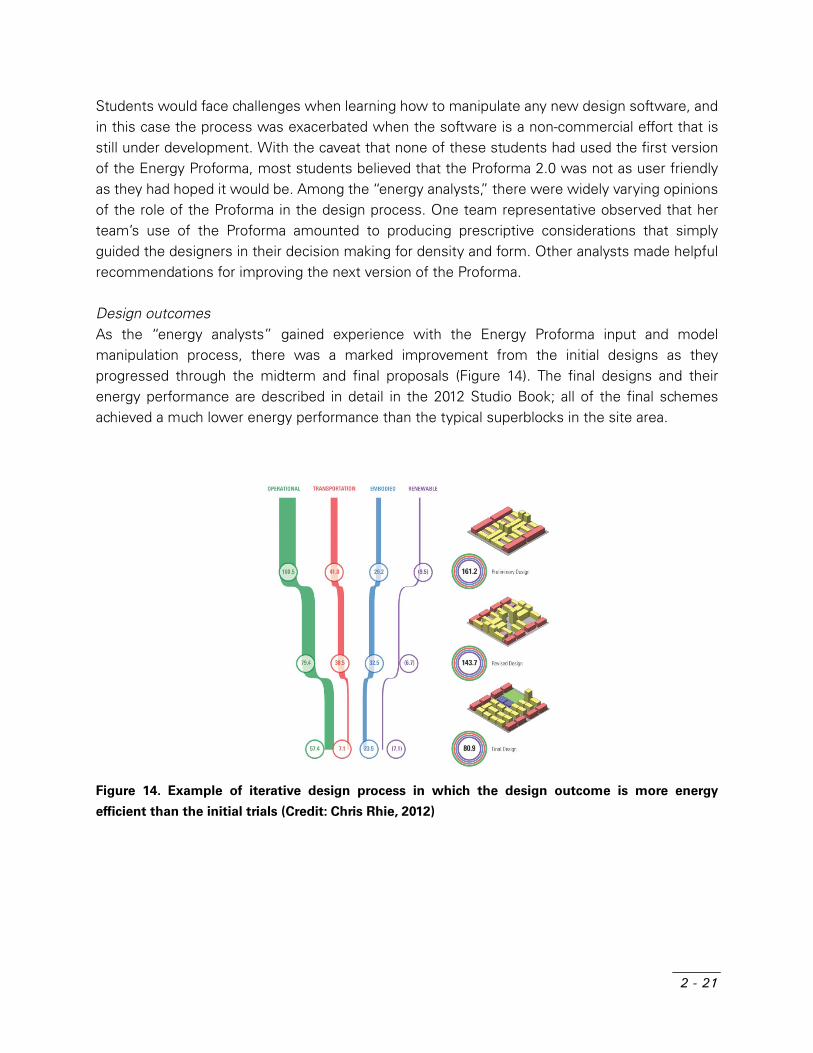
2 - 21
Students would face challenges when learning how to manipulate any new design software, and in this case the process was exacerbated when the software is a non-commercial effort that is still under development. With the caveat that none of these students had used the first version of the Energy Proforma, most students believed that the Proforma 2.0 was not as user friendly as they had hoped it would be. Among the “energy analysts,” there were widely varying opinions of the role of the Proforma in the design process. One team representative observed that her team’s use of the Proforma amounted to producing prescriptive considerations that simply guided the designers in their decision making for density and form. Other analysts made helpful recommendations for improving the next version of the Proforma. Design outcomes As the “energy analysts” gained experience with the Energy Proforma input and model manipulation process, there was a marked improvement from the initial designs as they progressed through the midterm and final proposals (Figure 14). The final designs and their energy performance are described in detail in the 2012 Studio Book; all of the final schemes achieved a much lower energy performance than the typical superblocks in the site area.
Figure 14. Example of iterative design process in which the design outcome is more energy
efficient than the initial trials (Credit: Chris Rhie, 2012)

2 - 22
Learning outcomes for neighborhood energy performance The Energy Proforma has the potential to become an influential pedagogical tool for learning about physical and behavioral factors that affect energy consumption, through the experience of designing low-carbon neighborhoods. We tracked the development of students’ understanding of three classes of energy performance feedback that were available in the Energy Proforma 2.0 interface (Figure 15): overall energy use categories (operational, transportation, and embodied energy), indirect effects of neighborhood form variables that can be modified in the Energy Proforma interface, and energy use categories that would require a more in-depth reading of both the research report and the Energy Proforma output. The students’ understanding of overall energy use exhibited the clearest improvement (Figure 16). The students could observe the breakdown of a typical superblock's total energy consumption in three phases of the studio: the Jinan neighborhood site analysis, reading the report, and running the Proforma on their initial neighborhood designs. Seven of the students who incorrectly estimated the energy use breakdown on the intake survey were able to provide correct estimates on the exit survey, while four students maintained correct responses and eight still did not achieve correct responses. All of the “energy analysts” successfully improved or maintained their correct responses. The center ring represents a response that differs by less than a 25 percentage points total difference from the appropriate answer (for example, a response of 55% operational, 25% transport, and 20% embodied would equal 20 percentage points difference). The students’ estimation of the magnitude of solar PV energy production in the exit survey also improved to a rational order of magnitude on average (Figure 17), which is promising for their ability to improve their intuition and reasoning through long-term exposure to and discussion of energy issues.
2 - 23
Figure 15. Interface of Energy Proforma 2.0 software that was provided to studio participants
A more detailed understanding of relationships between energy use and neighborhood form would have been evident in the students’ responses to the survey questions that asked for rankings of the influence of different neighborhood design factors on total energy consumption. After the group discussions and greater consideration of energy in the design process, the students should have improved their responses, even if they did not actively engage with the Proforma. The majority of students were able to correctly rank the magnitude of each component of in-home energy use in the end (Figure 18). However, students were uniformly unable to rank the impact of site coverage variables on neighborhood energy use (Figure 19). These results were not displayed graphically in the Proforma, although some of the variables were modifiable through the sliders. But no student appears to have taken on a sensitivity analysis of design variables within his or her exploration of the Proforma.
Level 3. Detailed text output for
energy calculations
Level 1. Visual summary of energy performance
Level 2. Neighborhood form variable adjustments

2 - 24
Figure 16. Household energy use
Change in students’ reporting of the breakdown of household energy use in a typical Jinan superblock, compared with the most appropriate answer of 65% operational, 15% transport, and 20% embodied energy use. Inner ring: 25 percentage point difference; outer ring: 100 percentage point difference from most appropriate answer. Each student is represented by one arrow that points from the entry response to the exit response, grouped by school and/or role of “energy analyst.”
Figure 17. Renewable energy
Students’ reporting of the percentage of operational energy that could be generated by solar photovoltaics on 25% of the façade in a typical Jinan superblock. Inner ring: 5% of operational energy; outer ring: 50% of operational energy.
Figure 18. In-home energy use ranking
Change in accuracy of students’ ranking of the energy usage of in-home heating, cooling, and lighting in Jinan, from highest to lowest. Inner ring: correct ranking; outer ring: the most incorrect ranking that was reported.
Figure 19. Neighborhood form impacts ranking
Change in the accuracy of students’ ranking of the relative energy impacts of neighborhood form variables related to site ground plane usage in Jinan. Inner ring: correct ranking; outer ring: most incorrect ranking.

2 - 25
Finally, we asked students about their overall view of the proposition that neighborhood form and energy consumption are related, by comparing the strength of the impact of neighborhood form with the impact of building-level energy efficiency measures, such as insulation and equipment upgrades (Figure 20). Half of the students changed their view of the strength of the relationship between energy use reduction and urban form modifications, resulting in a notable shift towards a 'strong' relationship. The students may not have been able to identify the specific strategies that they used to improve the energy performance of their neighborhood designs, but they did agree that the exercise of achieving greater energy efficiency through neighborhood form was worthwhile.
Figure 20. Students' reponse to the question, "how strong is the relationship between energy use
and neighborhood form?"

2 - 26
Conclusion: why use the Energy Proforma?
Designers, developers and decision makers at all levels of government—from national to province and city level—have become increasingly aware of the role of the built environment in determining energy consumption, greenhouse gas emissions, and climate change impacts. However, systematic tools that can assess and predict the energy performance of urban development at the neighborhood scale have not been accessible to these stakeholders. The lack of effective tools has hindered empirically validated research, design, and policy formulation for clean energy urban development. The Energy Proforma© is being developed by MIT to address this gap. It builds upon several years of work on developing an integrated approach to the design of clean energy neighborhoods, combining empirical data, behavioral models, and urban design studios. This approach, using real development project sites, advanced behavioral modeling methods, and research-based studio pedagogy, aims to provide practical urban design solutions using grounded evidence and to train the next generation of urban developers, planners and designers. The Energy Proforma is low carbon neighborhood design and instructional tool with great potential. We have demonstrated its usefulness in four practical trials of the tool, which provided important feedback to improve the functionality of the Proforma. The tool continues to be a dynamically evolving platform for discussing, demonstrating, and measuring energy-related aspects of urban form. As we move forward, the Energy Proforma will become even more accessible to planners, designers, and policymakers through a more intuitive web platform.

2 - 27
References
Almeida, A. M., M. Ben-Akiva, F. C. Pereira, A. Ghauche, C. Guevara, S. Niza, and C. Zegras. 2009. “A Framework for Integrated Modeling of Urban Systems.” In Proceedings of the 45th ISOCARP International Congress, 18–22.
Besserud, K., and T. Hussey. 2011. “Urban Design, Urban Simulation, and the Need for Computational Tools.” IBM Journal of Research and Development 55 (1.2) (January): 2:1–2:17. doi:10.1147/JRD.2010.2097091.
Bose, Ranjan K. 2010. Energy Efficient Cities: Assessment Tools and Benchmarking Practices. World Bank Publications.
Frenchman, Dennis, Christopher Zegras, and J. Cressica Brazier. 2013. “Clean Energy Urban Design in China: An Introduction to the Empirical Analysis, Practice, and Policy of Low-carbon Neighborhood Development.” In Peking University-Lincoln Institute for Land Policy Second International Workshop on Regional, Urban, and Spatial Economics in China.
MIT, and Tsinghua. 2012. “Making the Clean Energy City in China.” http://energyproforma.scripts.mit.edu/documents/MIT_Clean_Energy_City_Year_2_Report_web.pdf.
Reinhart, Christoph F., T. Dogan, D. Ibarra, and H. W. Samuelson. 2011. “Learning by Playing–teaching Energy Simulation as a Game.” http://www.tandfonline.com/doi/abs/10.1080/19401493.2011.619668.
Reinhart, Christoph F., T. Dogan, J. A. Jakubiec, Tarek Rakha, and Andrew Sang. 2013. “UMI - An Urban Simulation Environment for Building Energy Use, Daylighting and Walkability.” In Chambery, France.
Yu, Feifei, and Christopher Zegras. 2013. “Simulation of Household In-home and Transportation Energy Use: An Integrated Behavioral Model for Estimating Energy Consumption at the Neighborhood Scale.” In Peking University-Lincoln Institute for Land Policy Second International Workshop on Regional, Urban, and Spatial Economics in China.
Zhou, N., S. Ohshita, L. Price, and N. Zheng. 2011. “A Low Carbon Development Guide for Local Government Actions in China.” Carbon Management 2 (4): 455–469.

2 - 28
Appendix: Online Energy Proforma website
Appendix Figure A-1. Online Energy Proforma main "Home" page.

2 - 29
Appendix Figure A-2. "Learn" menu page.
Appendix Figure A-3. "Explore" menu page.

2 - 30
Appendix Figure A-4. "Energy Proforma" menu page.
Appendix Figure A-5. "Upload my own neighborhood" page.
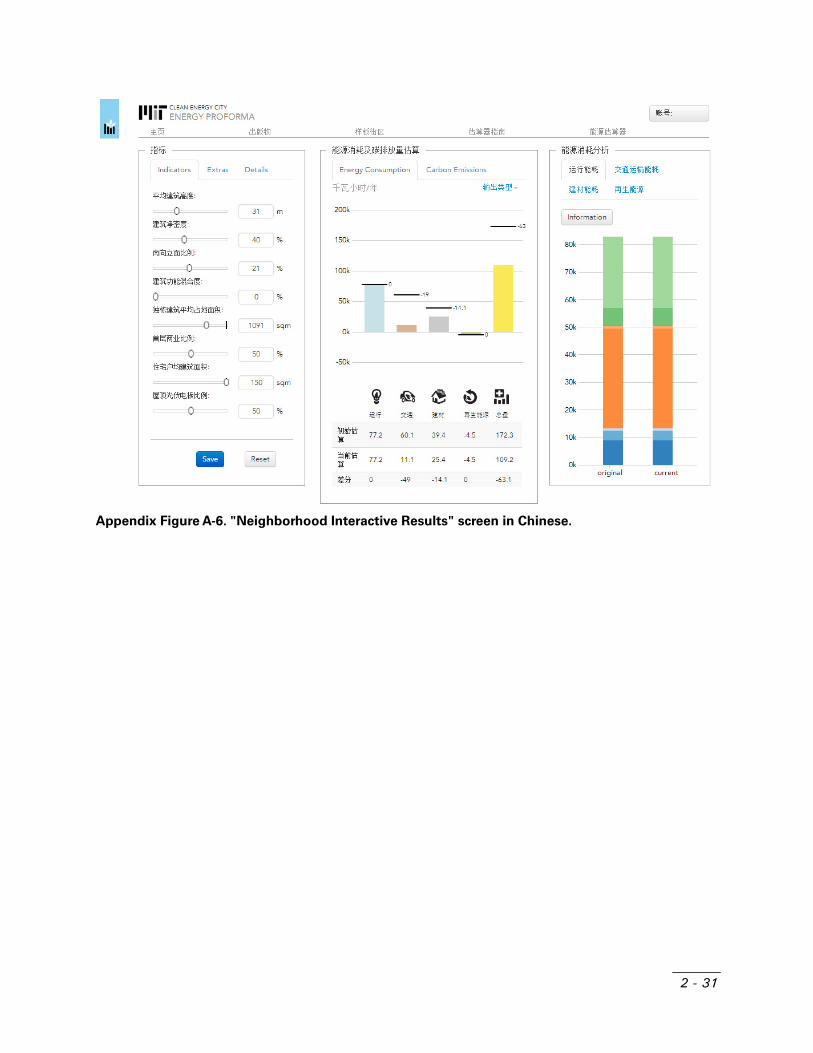
2 - 31
Appendix Figure A-6. "Neighborhood Interactive Results" screen in Chinese.
3
SIMHO+ TENAn intethe nei
Feifei Yu
MULOUSTRA
NERegrated bighborho
u, Christoph
LATSEHANSRGY
behavioraood scale
her Zegras
TIOHOLSPOY US
al model f
N OLD IORTSE
for estima
OF N-ATI
ating ene
HOION
ergy cons
OMEN
sumption
E
at

3 - 1
3
SIMULATION OF HOUSEHOLD IN-HOME + TRANSPORTATION ENERGY USE An integrated behavioral model for estimating energy consumption at the neighborhood scale
Feifei Yu, Christopher Zegras
Abstract
Household in-home activities and out-of-home transportation are two major sources of urban energy consumption. In light of China’s rapid urbanization and income growth, changing lifestyles and consumer patterns – evident in increased ownership of appliances and motor vehicles - will have a large impact on residential energy use in the future. The pattern of growth of Chinese cities may also play an intertwined role in influencing and being influenced by consumption patterns and, thus energy use. Nonetheless, models for evaluating energy demand often neglect the evolution of appliance & vehicle ownership and directly correlate consumption with static characteristics without explicit behavioral links. In this paper we aim to provide a comprehensive method for understanding household energy behavior over time. Using household survey data and neighborhood form characteristics from Jinan, a mid-sized Chinese city, we explore the relationship between neighborhood design and household-level behaviors and their impact on final energy consumption. Our ultimate goal is to provide the modeling engine for the “Energy Proforma©” a tool intended to

3 - 2
help developers, designers, and policy-makers implement more energy-efficient neighborhoods.
To predict in-home and transportation energy use, and their trade-offs, we develop an integrated household-level micro-simulation framework. The simulation tool is based on a total of eight inter-related behavioral models which estimate out-of-home energy use by predicting trip generation, mode choice and trip length for each household and in-home energy use according to different energy sources. In the various sub-models, relevant dimensions of neighborhood form and design are included as explanatory variables. These models are then combined with modules that update household demographics, appliance & vehicle ownership information, and activity trade-off patterns. These inter-linked models can then be used to estimate the long-term effects of neighborhood design on household energy consumption and greenhouse gas emissions.
Unlike separate in-home or out-of-home energy demand models, we develop an integrated simulation framework for forecasting. It captures estimated trade-off effects between in-home and transportation energy-consuming behaviors. The approach produces indicators of detailed behavioral outcomes such as trip mode and trip length choice, making it easier to relate policies, such as transit-oriented strategies, to ultimate outcomes of interest. We ultimately aim to provide urban designers, developers, and policy makers a decision support tool to explore and compare long-term energy performance across proposed neighborhood development projects.
1. Introduction
The turn of the twenty-first century finds China under rapid and intense urbanization. Between 2010 and 2030, China will add approximately 350 million people – more than the entire population of the USA – to its cities (Woetzel et al, 2009). This unprecedented demographic shift is intertwined with economic transformations and changing consumer patterns and lifestyles, such as demand for larger living spaces, more appliances and more motor vehicles (McNeil & Letschert, 2005; Hao et al, 2010). These trends will undoubtedly be matched by rising energy consumption and greenhouse gas emissions. While the nation has made impressive strides in reducing the greenhouse gas (GHG) intensity of its economy in recent decades, emissions per capita have been on the rise, sharply so in recent years (World Bank, 2013). If the Chinese government is to fulfill its ambitious efforts to further reduce the carbon intensity of its economy (by 40-50% between 2005 and 2020), it will likely have to focus on the urbanization process. Unlike in cities in the ‘global north’, industry and power generation currently dominate China’s cities emissions profiles (Wang et al, 2012); however, future energy demand and related emissions will be driven by massive increases in the urban buildings and transport sectors (Woetzel et al, 2009). In light of this forecast growth in energy and emissions, intensifying urbanization, and the need to realize sustainable urban development, the “Clean Energy City” concept has been promoted at both national and local levels in China (Yao et al, 2005). Changing the patterns of urbanization now holds great promise for mitigating short-term urban energy use and emissions and ensuring a long-term, lower-carbon urban development trajectory.

3 - 3
Given the sheer scale of urbanization in China, the pent-up demand for space and consumer goods and services, and the underlying political economy of urban development (e.g., the land lease system; see Liu and Salzberg, 2012), moving China’s urban development towards a lower-carbon future requires intervening at the development scale – that is the neighborhood. Neighborhoods constitute the fundamental building block of the modern Chinese city, epitomized by the Da Pan, large-scale (e.g., 30-300 hectares), predominantly suburban, developments driven by the dynamic real estate industry (Chen, 2008). In turn, neighborhoods, the physical places where people live and often undertake a number of their daily activities, condition residential energy consumption. Households, living in a neighborhood, aim to maximize their quality of life, given their capabilities. More formally, households choose their daily in-home activities (e.g., eating, sleeping, watching TV) and out-of-home activities (e.g., eating out, going to work, attending school) to maximize their utility subject to time, money, physical and other constraints. These activities result in energy consumption. In addition, households implicitly consume energy “embodied” in the neighborhood physical structure they inhabit – that is, the energy “invested” in constructing the physical spaces we inhabit. Therefore, we can partition neighborhood-level energy consumption into three aspects (CEC report, 2012): 1) Embodied – the energy used in the manufacturing, transporting, and processing construction materials; 2) Operational – the energy consumed to maintain the operations and life-supporting functions of households in the neighborhood; and 3) Transportation – the energy involved in household travel.
In this paper, we examine in-home operational energy, out-of-home transportation energy, and their trade-offs. Other researchers have emphasized, in the China context, the need to better understand the impact of human behavior and lifestyles on energy use (Zhang et al, 2010). Towards this end, we develop and demonstrate an integrated model that incorporates in-home and transportation energy trade-offs and accounts for the evolution of demographics and equipment ownership. Our ultimate intention is to enhance the behavioral modeling engine underlying the “Energy Proforma”©, a tool designed to provide urban designers, developers, and policy makers a means to explore and compare long-term energy performance across proposed neighborhood development projects (Frenchman et al, 2013).1
The remainder of this paper consists of 4 sections. Section 2 presents some empirical and analytical precedents and challenges and introduces the overall model framework and techniques. Section 3 describes the data used to estimate the models related to in-home and transportation energy use and the model estimation processes. Section 4 describes the simulation process and presents the simulation results. Chapter 5 provides conclusions and our thoughts on future directions.
1 An on-line version of the tool can be viewed here: energyproforma.mit.edu.

3 - 4
2. Methods
Precedents and Challenges
Most household-level analyses tend to model in-home and transportation energy consumption separately. For in-home operational energy use, a variety of methods have been introduced to estimate the factors related to demand. Dubin and McFadden (1984) provide the seminal work, proposing a unified model of the demand for appliances and the derived demand for electricity, utilizing economically consistent discrete-continuous regression models. Fung et al (1999), using regression techniques, find that energy price, demographics, weather, and appliance ownership significantly relate to residential energy consumption in Canada. Santin et al (2009) find, using regression, that both physical attributes and occupant characteristics explain the variations of in-home electricity energy consumption. To capture potential non-linear relationships, Aydinalp et al (2002) proposed a comprehensive residential consumption model using neural networks and utilized demographics, appliance, and heating system information as the inputs to train the neural networks. Wang (2012) reviews a number of recent analyses in China which find income growth, urbanization, demographic changes, and related elements like increased consumer goods as important factors driving household energy consumption.
On the transportation side, researchers have long been interested in the empirical relationships between neighborhood built form and travel behavior, typically utilizing a range of multivariate-regression analysis (including discrete choice, event count and other modeling techniques). Typically, such analyses focus on specific behavioral dimensions underlying energy use, but not energy use per se. Ewing and Cervero (2010) recently conducted a meta-analysis of more than 50 such empirical studies (all but four apparently in North America), and find private vehicle kilometers traveled (VKT) to be consistently related to population density, land use mix, street configuration as well as relative location (e.g., distance to jobs). They find roughly comparable effects with respect to public transport use and walking. In China, a number of recent studies, using disaggregate data, have focused on various related aspects of urban travel in China, including the relationship between neighborhood form and travel distances (Pan et al, 2009), neighborhood form and household vehicle ownership and travel energy use (Jiang, 2010) and relative neighborhood location and travel energy use (Naess, 2010).
A shortcoming to the above approaches is the treatment of in-home and out-of-home activities separately, while total household energy use arises from both sets of activities and, their interactions. In recent years, activity-based modeling has emerged as the ‘state-of-the-art’ in transportation systems analysis, based on the basic idea that travel demand derives from the demand for activities (e.g., Bowman and Ben-Akiva, 2001) – people do not want to travel, per se, rather they want access to daily wants and needs. In-home energy demand can be considered analogously; people do not want energy consumption, rather they want lighting, comfort, food, entertainment, etc. An activity-based framework, thus, provides a formal way of integrating individual- and household-level energy consumption by accounting for the activities that demand

3 - 5
energy and travel as well as potential trade-offs between them (e.g., in-home entertainment vs. traveling to leisure elsewhere). Such trade-offs cannot be captured with separate in-home or transportation models. Only recently, however, have efforts moved towards developing activity-based models for fully estimating household energy (and other resource) use at the urban scale and these efforts remain partial, either as proposed approaches (e.g., Almeida et al, 2009) or focusing only on part of the consumption picture (Keirstead and Sivakumar, 2012). One challenge to implementing the activity-based approach is the typical lack of adequate data.
In addition, empirically understanding the relationships between neighborhood form and behavior faces the classic causality challenge, sometimes referred to as “self-selection” (Mokhtarian and Cao, 2008). In aiming to show whether neighborhood form produces different household activity patterns and energy use, at least two related forms of bias may be present: simultaneity bias (e.g., individuals who prefer a low-energy lifestyle choose to live in low energy-oriented neighborhoods); and omitted variable bias (unobserved variables, like preferences for lower energy use, produce the low-energy outcomes, but also correlate with the neighborhood). In other words, the presumed exogenous causal variable, the neighborhood, is actually endogenous, which can produce inconsistent and biased estimators. In other words the behavioral models underlying the simulation might be incorrect.
Furthermore, as mentioned, the neighborhood may well influence both durable goods ownership (e.g., motor vehicles, air conditioners) and energy use and emissions. Within the ownership and use decisions, endogeneity bias may also be present. For example, if one specifies regression model of, for example, household vehicle use using the household’s observed number of motor vehicles included as an explanatory variable, the choice variable may be correlated with unobserved variables (e.g., households with more energy-intensive travel lifestyles being more inclined to own private vehicles) and, thus, with the second stage model’s error term. This violates a basic regression assumption. One way to correct for this endogeneity bias is by developing an instrumental variable; for example, the predicted number of air conditioning (AC) units (estimated from the AC choice model) and substituting this predicted value (as an instrument) in lieu of the actual number of ACs in the household (Dubin and McFadden, 1984). Such an approach, in theory, ‘purges’ the independent choice variable (in this case, number of ACs) of its correlation with the error term in the electricity use model.
Finally, in order to predict effects into the future, particularly in a rapidly evolving place like China, we must account for the evolution of demographics, appliance & vehicle ownership and the explicit underlying behavioral links. To understand the role of the neighborhood in household total energy consumption in China, we develop a model of in-home energy use, transportation energy use, and their trade-offs. The in-home component attempts to capture two related choices made by households - the choice of equipment/energy source type and the choice of how frequently to use the equipment/energy source to fulfill demands for in-home activities. For transportation energy, several aspects of the household decision-making process are crucial, including the choice of vehicle ownership, the number of activities to undertake, where to realize those activities, and how to get to them. As mentioned, we can also imagine that some activities might lead to trade-offs between

3 - 6
in-home and transportation energy consumption.
Unfortunately, we only have access to a trip-based survey of household travel information and reported energy bills for different energy sources. Thus, we cannot implement a full activity-based model. Furthermore, for in-home consumption, we do not have detailed appliance usage information; instead, we have self-reported electricity, gas, coal, and centralized heating bills. While we can compute household energy use with those bills, we cannot model the underlying activity behaviors. For the transportation part, the trip-based survey allows us to model trip frequency, mode, and distance but we cannot explicitly link the in-home and out-of-home parts together by trade-off behaviors. Model Framework
Considering these modeling challenges and data constraints, we develop a simplified integrated simulation model (Figure 1). First, we define trade-off lifestyle pattern variables to reflect some potential in-home/out-of-home activity substitution. Second, we model in-home energy use via linear regression, incorporating the trade-off variables but ignoring the underlying activities. Third, we disaggregate travel behavior into trip generation, internal/external trip choice, and trip mode-distance choice models. Finally, since we ultimately want to model energy performance over time we incorporate modules to update demographics and vehicle and appliance ownership. Binary and Multinomial Logit Choice model (Ben-Akiva et al, 1985)
Random utility models (RUMs), of which logit choice models are the proverbial “work horse,” are the backbone of our behavioral models. In the basic model structure, if the decision-maker, , selects one and only one alternative from a choice set C = 1,2 with only two alternatives, the problem can be formulated as Binary Logit Choice. We can introduce the random utility for each alternative:
U = V + ε - Equation 1
U = V + ε - Equation 2
Here V is the systematic utility expressed as a function of explanatory variables and ε is the random utility error component.
The decision rule is that individual selects the alternative with the highest utility, U , among those in the choice set C . Therefore, the probability of choosing alternative 1 can be expressed as:
P (1) = P(U ≥ U )= P(V + ε ≥ V + ε )= P(ε − ε ≤ V − V )
- Equation 3
Choosing the Type I Extreme Value distribution for the error term, we get the following: ε ~Extreme Value(0, μ); ε ~Extreme Value(0, μ); ε − ε ~Logistic(0, μ).

3 - 7
Thus,
P (1) = P(ε − ε ≤ V − V )= 11 + e ( ) = ee + e
- Equation 4
We can then estimate the model using maximum log-likelihood estimation (MLE) to get the coefficients embodied in the systematic utility V and V .
With more than two alternatives, we can use Multinomial Logit choice model. Now we have the choice sets C = 1,2, … , i, … , J with J alternatives. Again, with the utility maximization decision rule, the probability of choosing i can be expressed as:
P(i|C ) = P U ≥ U , ∀j ϵ C= P V + ε ≥ V + ε , ∀j ϵ C = P ε − ε ≥ V − V , ∀j ϵ C
- Equation 5
If ε are independently and identically distributed (IIA assumption) as Extreme Value (0, μ), we
obtain the choice probability for individual n:
P(i|C ) = e∑ e - Equation 6
Again, we can estimate the model coefficients using MLE. Nested Logit Model (Train, 2003)
If two types of choices are decided jointly (e.g., the trip mode and distance choice), the IIA assumption described above for Multinomial Logit choice will be violated. Therefore, we need to model the joint choice with two-level Nested Logit techniques. For decision-maker, , the alternatives are divided into nests and each nest contains alternatives. Accordingly, for alternative i ∈ B , we can define the utility function for :
U = W + Y + ε - Equation 7
Here W is a function of variables that only describe nest and Y depends on variables that related to alternative . The probability of decision-maker choosing alternative (P ) can be decomposed into a marginal probability (P ) and a conditional probability (P | ):
P = P | P - Equation 8
The marginal and conditional probabilities take the Logit form and they are linked by the so-called “Logsum” (or inclusive value), the denominator from the lower-level nest, i.e.:

3 - 8
P = exp(W + λ I )∑ exp(W + λ I ) - Equation 9
P | = exp(Y /λ )∑ exp(Y /λ ) - Equation 10
I = ln Y /λ - Equation 11
Here I is the Logsum value and λ is the coefficient on the Logsum. λ is a measure of correlation within each nest and it should take values between 0 and 1. If λ is larger than 1, a basic assumption of the nesting structure is violated. Event Count models – Poisson and Negative Binomial Regressions (Jang, 2005)
For trip frequency, we apply event count models. A commonly used model for count data is the Poisson. For decision-maker, , the conditional mean of the frequency Y can be written as a function of explanatory variables X and parameters β :
E(Y |X ) = e - Equation 12
Then, the probability for individual n to choose frequency Y can be expressed as a Poisson distribution:
P(Y = y ) = e λy ! - Equation 13
Here λ is the mean of the Poisson distribution and λ = E(Y |X ) = e . Therefore, the log-likelihood function can be written as and the model can be estimated using MLE:
lnL(β) = ln e λy ! = y (β X ) − exp(β X ) − ln(y !) - Equation 14
The Poisson model makes a strong assumption – the conditional mean equals the conditional variance. We expect unobserved heterogeneity in our data sets so that this assumption will probably be violated. Therefore, we also test a negative binomial model to account for the potential overdispersion of our trip frequency data. The Negative Binomial regression relaxes the assumption of equal mean and variance by adding the unobserved heterogeneity, , into the parameter λ :
λ = E(Y |X ) = e - Equation 15
Here ε is Gamma distributed and it leads to the Negative Binomial distribution of the frequency. With this relaxation of the Poisson regression model, we can then estimate Negative Binomial Regression with MLE as well. Endogeneity and Instrumental variables
As we can see, the overall model framework requires the lower level model to use the outputs from the upper level choice model. This can cause endogeneity problems, as described above. Suppose

3 - 9
we have a response variable Y and several explanatory variables X in the lower level model:
Y = f(X , X , … , X , … X ) + ε - Equation 16
If X is a choice result variable from the upper level model, we will possibly fail to include all the explanatory variables when modeling X in a choice model. Those omitted variables could also be related to Y and incorporated in the . This violates the Exogeneity assumption E(X |ε) = 0. A method to solve this endogeneity problem is to introduce an instrumental variable – the fitted probability of X . Since this fitted probability is only correlated with observed explanatory variables, it will keep the X orthogonal to the error term in the lower level model.
Another important potential source of endogeneity is “self-selection,” as mentioned above. We attempt to mitigate this problem by incorporating household attitude information, as collected in the surveys, in the choice models. This represents the “statistical control” approach, whereby the attitudinal variables included in the relevant behavioral models serve to make some of the unobserved characteristics (e.g., attitudes towards energy consumption) “observed,” and thus at least partly “purging” the model of endogeneity (Mokhtarian and Cao, 2008). This approach faces practical challenges, including relating to the validity and reliability of the attitudinal variables themselves. Ideally, more advanced models could solve the “self-selection” problem, but those remain an area of future research (including better data).
3. Data and Model Estimation
Data Sources
The main data used for estimation and simulation of neighborhood design impacts come from a survey of households in Jinan in 2010. Jinan is a reasonably typical medium-sized city in China (see Wang, 2012) with a population of approximately 3.5 million in 2010. MIT-Tsinghua (2010) identifies four neighborhood typologies prevalent in the city: “Traditional”, “Grid”, “Mixed Enclaves”, and “Superblock” (see Table 1). These typologies form the basis for the stratified random sampling approach used. We chose 14 typical neighborhoods, representing the different typologies; within these neighborhoods households were sampled randomly, producing 1523 households and nearly 9000 trip records2. After data cleaning, we were left with 1203 observations for model estimation and simulation. The household data consist of demographics and attitudes, home attributes, energy bills, and travel records. In addition, detailed data characterizing the physical form of the neighborhoods and their environs were collected (Table 2).3
Table 3 presents the descriptive statistics for several key demographic variables, equipment ownership, and energy consumption. For family structure, the main household types is “couple & kids”, consistent with the most common household size of 3. The average household income in the
2 The survey was conducted by Shandong University.
3 The physical characteristics were developed in a Geographic Information System (GIS) by Beijing Normal University.
3 - 10
14 neighborhoods is more than 90K (approximately US$15,000). Most households already have more than 1 AC while only about 40% have at least one car. The sample may be biased towards higher income households. The standard deviations of electricity and in-home energy consumption are less than their means which helps in modeling since we don’t need to predict too many extreme values. However, transportation energy consumption data appears to be overdispersed, indicating a number of outliers with large travel energy use, making predictions more difficult. Appliance Ownership Modeling
We do not have appliance purchase information for households, only current ownership levels. Furthermore, we only have consistent ownership information for air conditioners (AC). AC ownership may be correlated with other energy consuming devices, but, together with heating demand AC is more likely related to neighborhood form than other appliances (such as refrigerators and clothes washers). Furthermore ownership of ACs has been the most rapidly increasing among energy consuming appliances among urban Chinese households since 2000 (Zhou et al, 2011). As such, we model AC ownership; specifying and estimating a discrete choice model (see Table 7 in Appendix). Household income and unit size are positively related to AC ownership, while renters and those living in neighborhoods with high surface-to-volume ratio have lower likelihood of owning ACs. Vehicle Portfolio Ownership and Car Purchase Intention
Household motor vehicle ownership logically drives household travel energy demand. Jinan’s households have a range of ownership patterns, or “vehicle portfolios” (Chen, 2012) (see Table 3), approximately increasing in energy intensity from: zero motorized vehicles, to electric bikes (e-bikes) only, motorcycles (MCs) only (or plus e-bikes), cars only, or cars plus other motorized modes (MCs and/or e-Bikes).
We specify and estimate a multinomial logit model of vehicle portfolio choice (Table 8 in Appendix) and find that household type, income, and employment status, and some neighborhood design variables significantly impact vehicle portfolio choice. In addition, given the dynamism of private car ownership in China and its importance to travel energy consumption, we attempt to model the likelihood of car purchase. For this, estimate a binary choice model of the intention to purchase a car (Table 9 in Appendix). Household income, current vehicle portfolio and several neighborhood form variables play significant roles in this intention “choice.” Lifestyle Trade-Off Patterns
As discussed in the previous section, household energy use will partly be determined by activities performed in-home versus out-of-home. We model households’ propensity to undertake different relevant activities: work outside vs. work-at-home, dine-out vs. cook at home, leisure out vs. in-home entertainment. From the household’s perspective, members working outside the home may result in additional transportation energy use, while working at home will create additional in-home energy consumption. Similar trade-offs can exist in the cases of dining and leisure. These patterns will then

3 - 11
possibly influence later-stage models of household trip frequencies (i.e., trip generation) and in-home energy consumption.
To quantify these three trade-off behavior patterns, we define three binary variables for work, eating, and leisure to indicate whether household preferences for going outside or staying at home for the same type of activity. We hypothesize that household and neighborhood design characteristics will impact those three aspects of lifestyle trade-off patterns. Table 10 in the appendix presents the estimation results for the three trade-off patterns. The results intuitively suggest that higher incomes increase the likelihood of working at home, but also increase the likelihood of going out for leisure activities, consistent with intuition. Household attitudes, predicted vehicle portfolio (instrumental variable), demographics and neighborhood characteristics have influence, particularly for more flexible activities (i.e., leisure and dining). Household Travel Consumption
To estimate household transportation energy use, we develop three models: a trip frequency model, a model estimating whether generated trips are internal or external to the neighborhood and a trip mode & length choice model. These models are applied to four trip types: work, maintenance, leisure, and school.
The trip frequency model results (Tables 13-16 in Appendix) show that household characteristics, the predicted vehicle portfolio (instrumental variable), neighborhood form, and regional accessibility variables are all significant.
The internal/external trip choice model results (Tables 17-19 in Appendix) show, as expected, that numerous neighborhood design variables – such as sidewalks, green coverage, and BRT routes – play a significant role. We assume no energy consumption takes place for “internal” trips, usually less than 500m.
For the external trips, we then model trip mode & length choice together as a nested logit model. The modes include walk, bike, E-Bike, motorcycle, car, and public transit; we categorize trip distance as short, medium, and long, as survey reporting of this variable tended to be in rough distance estimates (we don’t have detailed destination information either). Two nesting structures are theoretically possible (Figure 2). The nesting structure does not represent a sequential decision-making process, per se, but shows the pattern of similarities within a decision process that is simultaneous (e.g., Small and Winston, 1999). In other words, in the depiction in Figure 2-Version 2, the traveler views the different modes for traveling short distances as more similar to each other than the different travel distances that one can choose by a particular mode. As described in the modeling techniques (see Nested Logit Model in Chapter 2), the logsum from the lower level nest (e.g., mode choice in Figure 2-Version 2), figures directly into the utility function for the upper level choice and the coefficient on the logsum in the upper nest determines whether the nest structure is consistent with the model assumptions. For work, maintenance and leisure trips, the model estimation process suggests that “Version 2” in Figure 2 is the appropriate model structure (Final estimation results in Tables 20-25 in Appendix).
3 - 12
For school trips we take a different approach. Rather than specify an internal/external choice model, we account for the normal size of a school district in the city: 1.5km by 2.5 km. So we use the length of a diagonal – 3km – as the threshold for short and long trips (i.e., we do not further divide them into internal or external trips). Tables 26 and 27 in the Appendix show the estimation results for school trip mode-distance choice, indicating the predominance of household characteristics, although a few form-related and relative location variables do play a role. Household Electricity/In-home Energy Consumption Models
As mentioned, due to the lack of activity data for in-home appliance use, we cannot model in-home energy consumption with the quasi-activity-oriented approach as for the transportation part. Therefore, we use a linear regression model to estimate in-home electricity and total energy consumption. The model includes in-home energy type, i.e., electricity, gas, coal, and centralized heating. Note that variables coming from upper level choices (e.g., trade-off behaviors) may be a source of endogeneity so that we employ instrumental variables (the expected values of these upper-level choices).
Tables 11 and 12 present the estimation results for electricity and total in-home energy consumption. Here the in-home energy is the sum of electricity, gas, coal and centralized heating energy. Beyond household income and some demographics and dwelling unit attributes (i.e., size), we see that several form variables play a direct role, as well as indirect roles via, for example, the fuel choices and the AC choices. We can also see that all three of the trade-off variables are significant, which partly supports our hypotheses. The signs on the work and leisure trade-off variables make sense since work at home and leisure at home are “in-home” version of these two possible out-of-home activities. However, the sign on the dine-home variable is negative for in-home energy consumption, which is counter-intuitive. We can imagine some plausible explanations for this result. Perhaps households with a tendency to dine out have other unobserved characteristics that lead to more in-home energy consumption. In any case, this particular result requires additional research to better understand what is going on.
4. Simulation of In-home and Transportation Energy
Using the estimation results from the models described above, we then develop and implement a simulation of household in-home and transportation energy at the neighborhood scale, as depicted in Figure 1. The simulations run 1000 iterations and provide average forecasts of energy consumption over time via the following steps. The simulation provides annual results (i.e., a time step of one year, or t+1). There are also lots of sub-models in this framework dealing with behavioral choice probabilities. To connect household decisions at multiple levels, we just need to generate a uniformly distributed random variable between 0 and 1 and use probabilities as cut points between 0 and 1 to decide which choice the agent actually takes (i.e., micro-simulation techniques).

3 - 13
Model Initiation
The model is initiated with a base neighborhood (existing or new design), which provides the relevant base year built form characteristics, as well as household demographics, which then in combination, and using the relevant model estimation results (described in the previous section) provide estimates of appliance & vehicle portfolio ownership, lifestyle trade-off lifestyle patterns, and the in-home and transportation energy consumption. Household Demographics Evolution Module
The inputs of this module are household demographics at time t (from the model initiation) and the outputs are household demographics at time t+1. The household characteristics include household size, household type, household income, etc. The evolution of these characteristics alone will impact energy use. Taking this evolution into account allows us to predict energy consumption of a certain household 5 or 10 years later.
The module designed here simulates future household characteristics with assorted assumptions. Those assumptions assign change probabilities to birth and death and generate new characteristics at next time step. For childbirth, we use a birth rate of 12.1 per thousand people (World Bank, 2013). We have a total of six household types (“family structure” in Table 3): 1) Single, 2) Couple, 3) Couple & Kids, 4) Couple & parents, 5) grandparents & grandchildren, and 6) three generation family. If a certain type of household has a child, the household size will increase by 1 and the household type will change accordingly (from couple to Couple & Kids, for example). The death rate comes from life tables stratified by gender and age in China (Cai, 2005) applying it will decrease household size and possibly change family structure as well.
For income, we use the forecast average annual income growth rate of 10.7%, as reported by the government report.4 However, using a constant growth rate applied to all households is naïve. So, we apply an assumed triangular distribution to simulate annual income change across the households (See in Figure 3). In addition, the average annual income rate decays every year, eventually declining to 3% in 20 years. Neighborhood Design Module
This module takes as inputs the neighborhood characteristics at time t and then provides, as outputs, the neighborhood characteristics at time t+1. This module involves no actual calculations; rather it represents the change of neighborhood characteristics as a result of design interventions. Equipment Ownership Modules
Households may buy/replace a new/retired appliance or vehicle in each time step. We account for this via “appliance & vehicle purchase/replace” modules. Household appliance ownership is quite dynamic with the purchase of new appliances or replacement of break-down appliances. For
4 http://news.iqilu.com/shandong/yaowen/2013/0125/1435312.shtml
3 - 14
appliance replacement, we assume constant energy efficiency performance (i.e., we do not account for potential changes in this attribute), an assumption which could be relaxed if efficiency improvements wanted to be explicitly included. This simplifying assumption enables us to avoid having to predict appliance breakdown. As discussed above, we currently only account for AC ownership, an assumption which could also be relaxed with more information on household appliance holdings.
For vehicle portfolio ownership, we make a similar assumption regarding the evolution of vehicle efficiency (i.e., no changes over time). That is, replacement vehicles do not change the vehicle energy consumption characteristics.
For both AC and vehicle portfolio simulations, the inputs are household demographics, ownership levels and neighborhood characteristics at time t and the outputs are AC ownership and vehicle portfolio ownership at time t+1.
Transportation and In-Home Energy Use
These modules use the neighborhood and household characteristics and apply the relevant models to predict at times t, t+1, etc.: household lifestyle trade-off lifestyle patterns, household trip generation, mode choice, and length, conditional upon expected vehicle ownership portfolios; and household electricity and total operational energy use conditional upon AC ownership and lifestyle trade-off patterns.
Validation
Figure 4 compares the simulated versus actual energy consumption for the base year in the form of cumulative distribution functions (CDF). Overall, we can see that the simulation works well for all three energy categories: electricity, in-home operation, and out-of-home transportation. The fitted model does a reasonable job, except for some households with high levels of energy consumption.
We can also validate performance at the level of neighborhood (Figure 5). Among them, we have two “Traditional (T)”, two “Grid (G)”, three “Enclave (E)”, and seven “Superblock (S)” neighborhoods. We can conclude that the simulated energy is close enough to the actual energy consumption for most of the neighborhoods. Comparing across typologies, we can see that superblocks have a significant higher consumption for in-home energy. For electricity, most of the superblocks have the larger consumption. Traditional neighborhoods have the lowest transportation energy use. The relative magnitudes of in-home and transportation energy are consistent across the 14 different neighborhoods.
Forecasts
We first develop a baseline forecast of energy consumption over 20 years, considering only changes in the underlying demographics and equipment ownership (Table 4). As expected, energy use across all end-uses increases, with transportation leading the way, with an average increase of 2.3% per year, versus 0.6% for electricity and 0.4% for in-home. These rates are consistent with the fact that

3 - 15
household transportation energy use in Jinan is starting from a much lower base than in-home, relative to international precedents (e.g., Chen, 2012).
Examining in detail the transportation forecasts, we see, unsurprisingly the important role of the car in travel energy growth (Figure 6 - please see the magnitude of the X axis). Across neighborhood typologies, the “Superblock” and “Enclave” have the highest travel energy for motorcycles, cars, and transit. Among the lower travel energy neighborhood typologies, the “Traditional” consumption curve overlaps with “Grid” only for motorcycle energy use while “Grid” consumes more E-bike, car and transit energy than “Traditional”.
Finally, given the various neighborhood form characteristics across the underlying behavioral models, we can use the simulation tool to assess how changes in neighborhood characteristics would change household energy use trajectories. Such analysis could help inform neighborhood development towards lower energy consumption based on empirical evidence. To better associate energy saving potentials with neighborhood form variables, we perform the sensitivity analysis based on Superblock neighborhoods, as they are the most likely target for future sustainable urban development. The detailed results are present in Table 5.
For neighborhood density and massing, higher residential density is associated with less trip generation, more internal trips, and shorter external trip travel distance. Hence, an increase of 20 households per acre will save around 10% of transportation energy in year 1 and year 10. Then, lower porosity is in conjunction with greater building volume and it may reduce the in-home operational energy considering the winter wind cooling effects (2% energy savings with 10% decrease of porosity). For neighborhood passive system, increasing Southern Exposure Index by 10% could result in more than 7% of in-home energy savings due to the arising solar gaining in winter. For neighborhood use mix, the presence of street level shop and integrated services within the neighborhood show great potential in mitigating transportation energy trajectories. To be specific, 20% more street level shops or 10% higher function mix are expected to generate around 5% of transportation energy savings (average of year 1 and year 10 energy savings). For pedestrian facility, larger number of roads with sidewalks would create more “walkable streets” and predict to reduce an increasing percentage of transportation energy savings from year 1 to year 10. For building façade, continuity is a measure of the continuousness on a place and it helps in the sense of enclosure and definition of street space. 10% increase of façade continuity could potentially lead to more than 10% of transportation energy savings since it creates street-oriented trips.
5. Conclusions
We propose and implement an integrated model of both in-home and out-of-home energy consumption. This newly proposed model is an extension to the original models applied in the “Energy Proforma”©, an online tool for estimating neighborhood-level energy consumption in China. Rather than estimate household in-home and travel energy consumption separately and at a single point in time, our approach explicitly considers the trade-off among relevant household behaviors

3 - 16
that might drive energy use and, furthermore, formally incorporates a temporal dimension to the analysis.
Among the eight underlying behavioral models, we find varying relationships between urban form and the activities that result in household energy use (Table 6). Combined into the simulation tool, the integrated models can be used in a range of ways, such as: providing ex-ante estimates of neighborhood-level household energy consumption; generating relevant behavioral indicators such as travel mode choice which can be related to policy objectives such as transit-oriented development; capturing long-term effects of neighborhood form and design while accounting for socioeconomic and demographic evolution.
Despite the advances implied in this work, a number of shortcomings remain. The behavioral models are estimated on a rather small, likely biased, cross-sectional survey for only 14 neighborhoods in a single city in China. The household survey itself does not include the full range of household energy-consuming activities and relies on reported travel behavior and reported energy bills, both of which are certainly subject to errors. As such, the current results should be viewed as indicative and demonstrative of the technique, not necessarily authoritative regarding the magnitudes of expected effects. In addition, non-residential energy consumption is currently excluded from the modeling approach, which may influence the total neighborhood energy estimates in unknown ways. Technology evolution is also ignored (e.g., the simulation does not account for changes in vehicle or appliance fuel efficiency), an assumption which should be relaxed in the future. Similarly, larger evolution of the city, and the interactions among neighborhoods is also ignored, which would, at minimum, likely impact travel energy use. More generally, any effort to forecast the future, particularly in a highly dynamic context like urbanizing China, must be viewed with some skepticism. Such forecasts face behavioral uncertainties and exogenous uncertainties (e.g., new technologies, economic transformations) that are not currently considered in our approach. Point estimates of the future are wrong.
These shortcomings point to an ambitious future research agenda. Behaviorally, the move to an activity-based simulation model would be productive, but would require detailed data on in-home and out-of-home activities to enable the development of a model of activity trade-offs and complete energy consumption. Such data could possibly be collected via new technological devices (e.g., smartphones; see Cottrill et, al. 2013) perhaps in combination with in-home smart meters and more comprehensive and accurate energy use data (such as annual bills). Such an approach could lead to a more responsive decision support tool for urban planners, developers, and communities, and enable immediate feedback to consumers and thus realize the savings potentials due to energy-efficient neighborhood form. We hope to have provided a step in this direction.
3 - 17
References
Almeida, A. M., M. Ben-Akiva, F. C. Pereira, A. Ghauche, C. Guevara, S. Niza, and C. Zegras. 2009. A framework for integrated modelling of urban systems. 45th International Society of City and Regional Planners (ISOCARP) Congress, Porto, Portugal, 18–22 October 2009. http://www.isocarp.net/Data/case_studies/1623.pdf.
Aydinalp M, VI. Ugursal, A. Fung. 2002. Modeling of the appliance, lighting, and space cooling energy consumptions in the residential sector using neural networks. Applied Energy,72(2), pp.87-110.
Ben-Akiva, M. and Lerman, S.R. 1985. Discrete Choice Analysis: Theory and Application to Travel Demand, Cambridge, Massachusetts: MIT Press.
Bhat, C. R., and F. S. Koppelman. 1999. Activity-Based Modeling of Travel Demand. International Series in Operations Research & Management Science, Volume 23, pp 35-61.
Bowman, J.L. and M. Ben-Akiva. 2001. Activity-based disaggregate travel demand model system with activity schedules. Transportation Research Part A, 35(1), pp. 1-28.
Cai, Y. 2005. National and Provincial Life Tables Derived from China’s 2000 Census Data. http://www.unc.edu/~caiyong/papers/provlt.pdf.
Chen, W.Z. 2008. Neighborhood scale and market-responsive urban design. Thesis submitted in partial fulfillment of the requirements for the Degree of Doctor of Philosophy at the University of Hong Kong. September.
Chen, Y. 2012. Neighborhood Design and the Energy Efficiency of Urban Lifestyle in China: Treating Residence and Mobility as Lifestyle Bundle. Submitted in partial fulfillment of the requirements for the Degree of Doctor of Philosophy in Urban and Regional Planning, MIT. submitted in partial fulfillment of the requirements for the Degree of Doctor of Philosophy at the University of Hong Kong. September.
Cottrill, C., F. Pereira, F. Zhao, I. Dias, H.B. Lim, M. Ben-Akiva, C. Zegras. 2013. The Future Mobility Survey: Experiences in Developing a Smartphone-Based Travel Survey in Singapore. Transportation Research Record (forthcoming).
Dubin, J.A. D.L. McFadden. 1984. An Econometric Analysis of Residential Electric Appliance Holdings and Consumption. Econometrica, 52(2), pp. 345-362.
Fung AS, M. Aydinalp, and VI. Ugursal. 1999. Econometric models for major residential energy end-uses. CREEDAC-1999-04-05 report. Halifax, NS.
Ewing R, and R. Cervero. 2010. Travel and the Built Environment. Journal of American Planning Association 76(3), pp. 265-294.
Frenchman, D., C. Zegras, J.C. Brazier. 2013. Clean Energy Urban Design in China: The Energy Proforma© in Practice and Policy. Paper submitted to Peking University-Lincoln Institute for Land
3 - 18
Policy Second International Workshop on Regional, Urban, and Spatial Economics in China.
Hao H., H. Wang, and R. Yi. 2010. Hybrid modeling of China’s vehicle ownership and projection through 2050. Energy, 36, pp. 1351–61.
Jang, T. Y., 2005. Count data models for trip generation. Journal of Transportation Engineering 131 (6), pp. 444–450.
Jiang Y. 2010. Does Energy Follow Urban Form? An Examination of Neighborhoods and Transport Energy Use in Jinan, China. Master in City Planning and Master of Science in Transportation thesis, Massachusetts Institute of Technology, Cambridge, MA.
Keirstead, J. and A. Sivakumar, A. 2012. Using Activity-Based Modeling to Simulate Urban Resource Demands at High Spatial and Temporal Resolutions. Journal of Industrial Ecology, 16, pp. 889–900.
Liu, Z. and A. Salzberg, 2012. Developing Low-Carbon Cities in China: Local Governance, Municipal Finance, and Land-Use Planning – The Key Underlying Drivers. In Sustainable Low-Carbon City Development in China (A. Baumler, Ijjasz-Vasquez, E., Mehndiratta, S., eds.). World Bank, pp. 97-127.
McKinsey & Company. 2009. China’s green revolution: Prioritizing technologies to achieve energy and environmental sustainability.
McNeil, M. A. and V.E. Letschert. 2005. Forecasting Electricity Demand in Developing Countries: A Study of Household Income and Appliance Ownership. Submission to ECEEE Summer Study, June 2005.
MIT and Tsinghua University. 2010. Making the Clean Energy City in China. Year 1 Report submitted to the Energy Foundation of China. Massachusetts Institute of Technology.
MIT. 2012. Making the Clean Energy City (CEC) in China. Year 2 Report submitted to the Energy Foundation of China. Massachusetts Institute of Technology.
Mokhtarian P. and X. Cao. 2008. Examining the impacts of residential self-selection on travel behavior: A focus on methodologies. Transportation Research B 42, pp. 204-228.
Naess, P. 2010. Residential Location, Travel, and Energy Use in the Hangzhou Metropolitan Area. The Journal of Transport and Land Use, 3(3), pp. 27-59.
Pan, H., Q. Shen, M. Zhang. 2009. Influence of Urban Form on Travel Behaviour in Four Neighbourhoods of Shanghai. Urban Studies, 46(2), pp. 275-294.
Research Center for Sustainable Development (RCSD). 2007. Understanding China’s Energy Policy. Chinese Academy of Social Sciences.
Santin, O.G., L. Itard, and H. Visscher. 2009. The Effect of Occupancy and Building Characteristics on Energy Use for Space and Water Heating in Dutch Residential Stock. Energy and Buildings, 41, pp. 1223-1232.
Small, K.A. and C. Winston. 1999. The Demand for Transportation: Models and Applications. Chapter
3 - 19
2 in Essays in Transportation Economics and Policy: A Handbook in Honor of John R. Meyer (J. Gómez-Ibáñez, W. Tye, C. Winston, Eds), Brookings Institution Press, Washington, DC.
Train K. 2003. Discrete Choice Methods with Simulation, Cambridge University Press.
Wang, D. 2012. Household Operational Energy Consumption in Urban China: A Multilevel Analysis on Jinan. Masters Thesis, Department of Urban Studies and Planning, MIT.
Wang, X., N. Berrah, X. Peng, L. Sugar, H. Du. 2012. Low-Carbon Cities in China: Characteristics, Roadmap, and Indicators. In Sustainable Low-Carbon City Development in China (A. Baumler, Ijjasz-Vasquez, E., Mehndiratta, S., eds.). World Bank, pp. 63-95.
Woetzel, J., L. Mendonca, J. Devan, S. Negri, Y. Hu, J. Devan, L. Jordan, X. Li, A. Maasry, G. Tsen, F. Yu. 2009. Preparing for China’s Urban Billion. McKinsey Global Institute.
World Bank. 2013. World Development Indicators. data.worldbank.org.
Yao R., B. Li, and K. Steemers. 2005. Energy policy and standard for built environment in China. Renew Energy, 30, pp. 1973–88.
Zhang, J. 2008. Operational Energy Consumption and GHG Emissions in Residential Sector in Urban China: An Empirical Study in Jinan. Thesis for Master in City Planning, Massachusetts Institute of Technology.
Zhang, S. X. Yang, Y. Jiang, Q. Wei. 2010. Comparative analysis of energy use in China building sector: current status, existing problems and solutions. Front. Energy Power Eng. China, 4(1), pp. 2-21.
Zhou, N. D. Fridley, M. McNeil, N. Zheng, V. Letschert, J. Ka, Y. Saheb. 2011. Analysis of potential energy saving and CO2 emission reduction of home appliances and commercial equipments in China. Energy Policy, 39(8), pp. 4541-4550.

3 - 20
Figure 1 - Integrated modeling framework
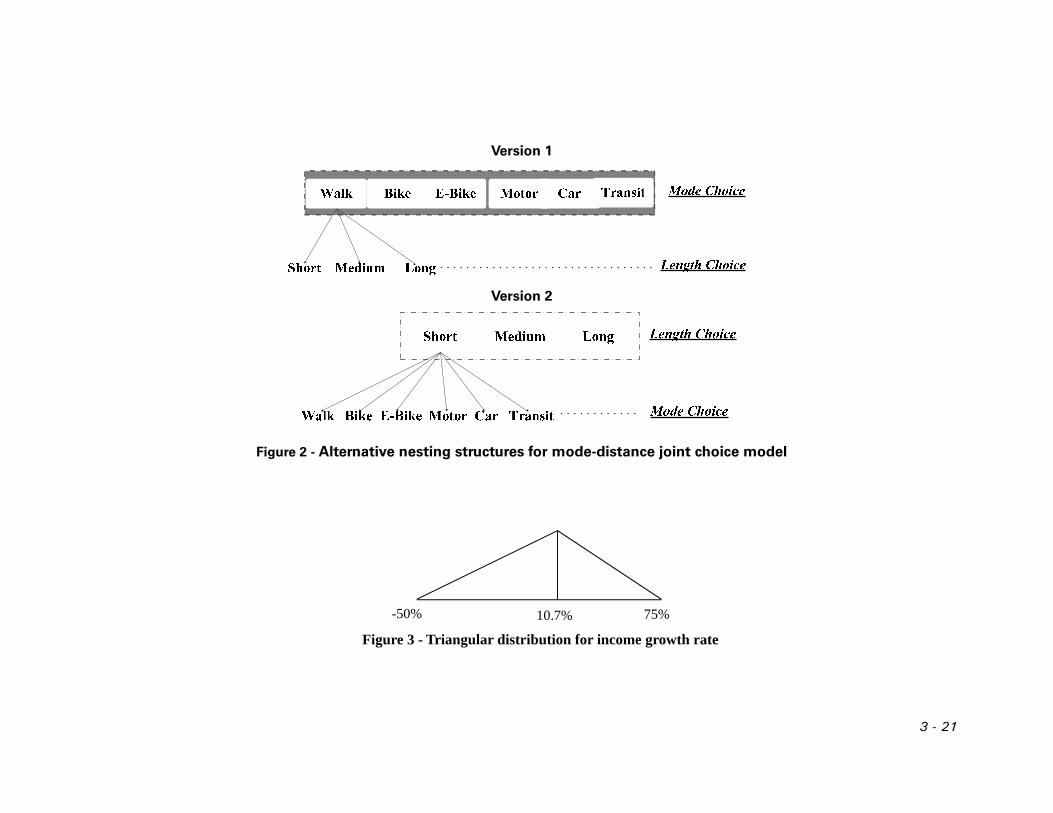
3 - 21
Version 1
Version 2
Figure 2 - Alternative nesting structures for mode-distance joint choice model
10.7% -50% 75%
Figure 3 - Triangular distribution for income growth rate

3 - 22
Figure 4 - Simulated vs. actual energy consumption in the base year (CDFs)
0 0.5 1 1.5 2 2.5
x 105
0
0.1
0.2
0.3
0.4
0.5
0.6
0.7
0.8
0.9
1
Electricity Energy(MJ)
F(x
)
Empirical CDF
Actual - 31950 MJ/HHSimulated - 30630 MJ/HH
0 1 2 3 4
x 105
0
0.1
0.2
0.3
0.4
0.5
0.6
0.7
0.8
0.9
1
Total In-home Energy(MJ)
F(x
)
Empirical CDF
Actual - 67680 MJ/HHSimulated - 66780 MJ/HH
0 1 2 3 4
x 105
0
0.1
0.2
0.3
0.4
0.5
0.6
0.7
0.8
0.9
1
Transportation Energy(MJ)
F(x
)
Empirical CDF
Actual - 9072 MJ/HHSimulated - 8700 MJ/HH

3 - 23
Figure 5 - Simulated vs. actual energy consumption (MJ) in the base year for 14 neighborhoods
(T-Traditional; G-Grid; E-Enclave; S-Superblock)
0
20000
40000
60000
80000
100000
120000
Dikou(T)
Furong(T)
Comm
ercial South(G)
Comm
ercial North(G)
Gannan(E)
Kuangshan(E)
Taoyuan(E)
Jixiangyuan(S)
Mingshi(S)
Weidong(S)
Feicuijun(S)
New
World(S)
Quancheng Garden(S)
Digital Bay(S)
Electricity - Actual In-home - Actual Transportation - Actual
Electricity - Simulated In-home - Simulated Transportation - Simulated

3 - 24
Figure 6 - Transportation energy use by mode and neighborhood typology over time (averaged over 20 years)
0 50 100 150 200 250 3000
0.2
0.4
0.6
0.8
1
Ebike Energy Consumption(MJ)
F(x
)
Empirical CDF
TraditionalGridEnclaveSuperblock
0 200 400 600 800 1000 12000
0.2
0.4
0.6
0.8
1
Motorcycle Energy Consumption(MJ)
F(x
)
Empirical CDF
TraditionalGridEnclaveSuperblock
0 0.5 1 1.5 2 2.5 3 3.5 4 4.5 5
x 104
0
0.2
0.4
0.6
0.8
1
Car Energy Consumption(MJ)
F(x
)
Empirical CDF
TraditionalGridEnclaveSuperblock
0 500 1000 1500 2000 2500 3000 35000
0.2
0.4
0.6
0.8
1
Transit Energy Consumption(MJ)
F(x
)
Empirical CDF
TraditionalGridEnclaveSuperblock

3 - 25
Typology Building/Street/Function
Traditional 1-3 story courtyards; fractal/dendritic fabric off a main shopping street,
on-site employment
Grid
(1920s)
Block structure with different building forms contained within each
block; retail on connecting streets
Enclave
(1980-1990s) Linear mid-rise walk-ups; housing integrated with commercial facilities
Superblocks
(2000s) Towers in park with homogeneous residential use
Table 1 - Descriptions of four neighborhood typologies in Jinan, China (MIT-Tsinghua, 2010)

3 - 26
Measure Description Mean Std. Min Max
Neighborhood Size Area (m2) 189461.0 72936.33 25572 302507
Total Households Number of households per neighborhood 2899.9 1557.38 515 5992
Residential Density Number of households per acre 63.3 21.94 26 104
FAR Ratio of floor area of buildings to size of neighborhood land 1.884 .6453 .78 3.16
Building Coverage Building footprint as share of neighborhood area .292 .1166 .07 .53
Green Coverage Green space as share of neighborhood land area .086 .0803 .01 .29
Entry_m Entry interval distance in meters 319.6 201.31 81 929
Function mix Building function mix .149 .1244 .03 .46
Lumix_500m Land use mix w/in 500 meter buffer .660 .0749 .54 .81
Underground Parking
Average underground parking area (m2) per household 7.339 8.5850 .00 24.00
Surface Parking Average surface parking area (m2) per household 9.6 10.19 0 35
Walking Facility Percentage of roads with walking facilities .265 .2201 .00 .82
Distance to Center Distance from the neighborhood center to the center of Jinan (kms) 4.90 2.133 .7 8.7
Street Level Shop Percentage of street level shops .095 .0994 .00 .35
Road Density In the neighborhood (km/m2) 30.280 14.6540 10.16 56.72
Motor_width Average motorway width (m) 6.575 3.1104 3.17 13.00
SEI Southern Orientation Index (area of projection of façade onto the south plane)*
.3490 .02640 .274 .391
Table 2 - Descriptive statistics: Variable measures of neighborhood form

3 - 27
Measure Description Mean Std. Min Max
Porosity Ratio of volume of open spaces to the total volume (buildings+open spaces)*
.6980 .09035 .557 .907
Surface to volume ratio
Ratio of building surface area to the total volume .499 .2287 .267 .944
Footprint Average site coverage area (in square meters) 583 381.8 48 1179
Façade continuity Measure of the continuousness of the building facade .6988 .05571 .5978 .7892
cul_de_sac Percentage of “dead end” roads .109 .1972 .00 .73
Factory Accessibility Regional accessibility (RA) for factory** 12.423 11.0893 3.75 44.88
Office Accessibility Regional accessibility (RA) for office** 10.196 13.6261 .94 45.25
Public Accessibility Regional accessibility (RA) for public** 5.319 8.4899 .69 32.10
Shopping Accessibility Regional accessibility (RA) for shopping** 153.920 133.2590 26.12 426.84
School Accessibility Regional accessibility (RA) for school** 8.448 8.9295 1.28 34.05
BRT Routes BRT routes with stops within 200m of the neighborhood 0 0.393
1 0.455
2 0.088
3 0.064
Table 2 (continued) – Descriptive statistics: Variable measures of neighborhood form
Notes: * Calculated using GIS maps (figure ground maps and building height information) and simulation tools (see MIT, 2012). ** Calculated as a gravity-based measure, using calculated road network times (see Chen, 2012).

3 - 28
Household Demographics & Equipment ownership Household Energy Consumption and Attitudes
Family Structure
Single 6.68%
Electricity (MJ)
Min 2397
Couple 23.64 Max 239665
Couple & kids 42.11% Mean 31945
Couple & parents 4.76% Std. 20396
Grandparents & grandchild 2.92%
In-home (MJ)
Min 2397
Three generations 19.97 Max 342195
Household Size
1 4.90% Mean 67679
2 25.30 Std. 33570
3 40.90
Transportation (MJ)
Min 0
4 16.70 Max 371366
>4 12.20 Mean 5909
Annual Income
(Yuan)
Min 4300 Std. 17734
Max 720000 Driving is a sign of prestige*** 34.0%
Mean 93066 It is convenient to take buses*** 67.5%
Std. 74756 I like riding bicycles*** 53.7%
Air Conditioner
0 12.7% Time spent on travel is a waste to me*** 35.6%
1 36.7% I’d like to live in bigger house*** 55.2%
>1 50.6% I like traveling*** 66.7%
Vehicle Portfolio
No vehicle owned 30.6% Plastic shopping bags in supermarkets should be free*** 50.6%
E-bikes only 23.9% High-rank officials do not take buses or ride bicycles to go out*** 57.9%
Motorcycles 5.2% Rich men do not take buses or ride bicycles to go out*** 52.4%
Cars only 24.1% I exercise regularly outside*** 62.3%
Cars and other vehicles) 16.2% I reuse things like plastic bottles or bags*** 69.3%
Table 3 - Descriptive statistics: Household characteristics, attitudes, and energy consumption
Notes: *** Percentage of positive responding (scores of more than 3 are counted as positive responding)

3 - 29
Year Electricity(MJ) In-Home(MJ) Transportation(MJ)
1 30630 66780 8700 2 31970 68620 9920 3 32610 69490 10750 4 33000 70000 11370 5 33270 70360 11940 6 33480 70630 12370 7 33640 70830 12700 8 33770 70990 13080 9 33890 71130 13310
10 33980 71240 13500 11 34070 71340 13740 12 34140 71410 13900 13 34200 71470 14030 14 34240 71530 14130 15 34290 71560 14240 16 34320 71590 14370 17 34340 71610 14450 18 34360 71620 14530 19 34370 71630 14550 20 34380 71630 14610
Table 4 - Household energy use baseline predictions
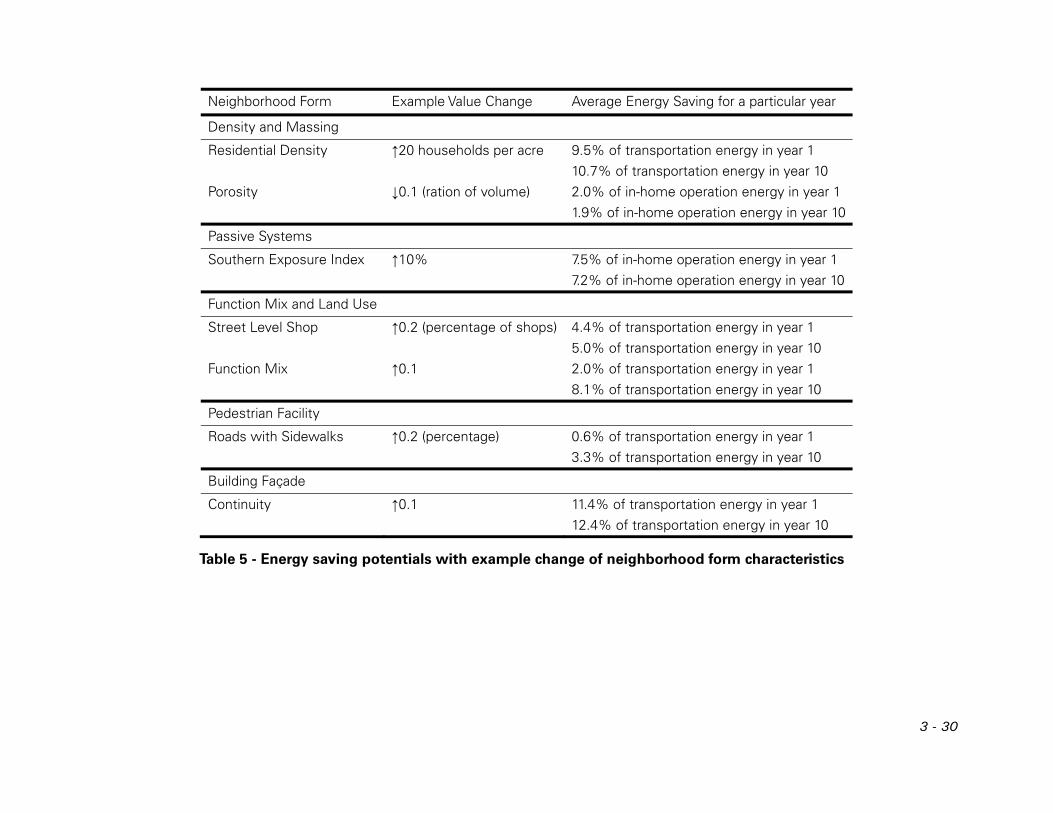
3 - 30
Neighborhood Form Example Value Change Average Energy Saving for a particular year
Density and Massing
Residential Density ↑20 households per acre 9.5% of transportation energy in year 1 10.7% of transportation energy in year 10
Porosity ↓0.1 (ration of volume) 2.0% of in-home operation energy in year 1 1.9% of in-home operation energy in year 10
Passive Systems
Southern Exposure Index ↑10% 7.5% of in-home operation energy in year 1 7.2% of in-home operation energy in year 10
Function Mix and Land Use
Street Level Shop ↑0.2 (percentage of shops) 4.4% of transportation energy in year 1 5.0% of transportation energy in year 10
Function Mix ↑0.1 2.0% of transportation energy in year 1 8.1% of transportation energy in year 10
Pedestrian Facility
Roads with Sidewalks ↑0.2 (percentage) 0.6% of transportation energy in year 1 3.3% of transportation energy in year 10
Building Façade
Continuity ↑0.1 11.4% of transportation energy in year 1 12.4% of transportation energy in year 10
Table 5 - Energy saving potentials with example change of neighborhood form characteristics
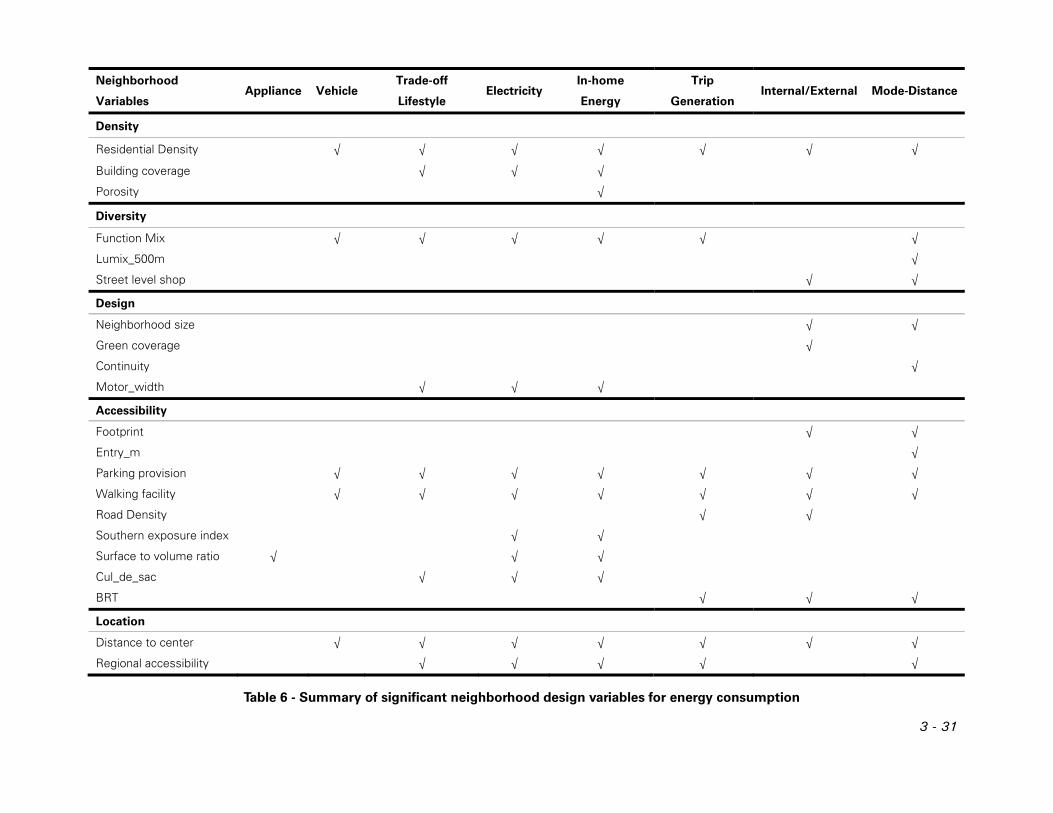
3 - 31
Neighborhood
Variables Appliance Vehicle
Trade-off
Lifestyle Electricity
In-home
Energy
Trip
Generation Internal/External Mode-Distance
Density
Residential Density √ √ √ √ √ √ √
Building coverage √ √ √
Porosity √
Diversity
Function Mix √ √ √ √ √ √
Lumix_500m √
Street level shop √ √
Design
Neighborhood size √ √
Green coverage √
Continuity √
Motor_width √ √ √
Accessibility
Footprint √ √
Entry_m √
Parking provision √ √ √ √ √ √ √
Walking facility √ √ √ √ √ √ √
Road Density √ √
Southern exposure index √ √
Surface to volume ratio √ √ √
Cul_de_sac √ √ √
BRT √ √ √
Location
Distance to center √ √ √ √ √ √ √
Regional accessibility √ √ √ √ √
Table 6 - Summary of significant neighborhood design variables for energy consumption
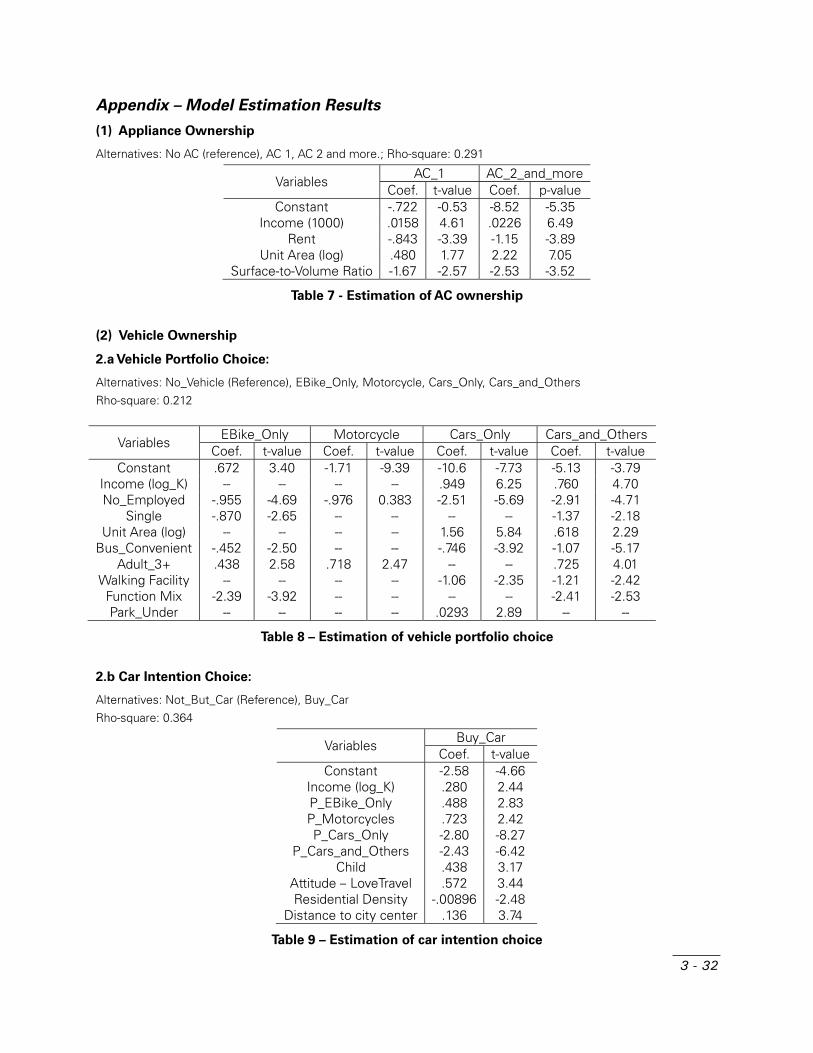
3 - 32
Appendix – Model Estimation Results
(1) Appliance Ownership
Alternatives: No AC (reference), AC 1, AC 2 and more.; Rho-square: 0.291
Variables AC_1 AC_2_and_more
Coef. t-value Coef. p-value Constant -.722 -0.53 -8.52 -5.35
Income (1000) .0158 4.61 .0226 6.49 Rent -.843 -3.39 -1.15 -3.89
Unit Area (log) .480 1.77 2.22 7.05 Surface-to-Volume Ratio -1.67 -2.57 -2.53 -3.52
Table 7 - Estimation of AC ownership
(2) Vehicle Ownership
2.a Vehicle Portfolio Choice:
Alternatives: No_Vehicle (Reference), EBike_Only, Motorcycle, Cars_Only, Cars_and_Others Rho-square: 0.212
Variables EBike_Only Motorcycle Cars_Only Cars_and_Others
Coef. t-value Coef. t-value Coef. t-value Coef. t-value Constant .672 3.40 -1.71 -9.39 -10.6 -7.73 -5.13 -3.79
Income (log_K) -- -- -- -- .949 6.25 .760 4.70 No_Employed -.955 -4.69 -.976 0.383 -2.51 -5.69 -2.91 -4.71
Single -.870 -2.65 -- -- -- -- -1.37 -2.18 Unit Area (log) -- -- -- -- 1.56 5.84 .618 2.29
Bus_Convenient -.452 -2.50 -- -- -.746 -3.92 -1.07 -5.17 Adult_3+ .438 2.58 .718 2.47 -- -- .725 4.01
Walking Facility -- -- -- -- -1.06 -2.35 -1.21 -2.42 Function Mix -2.39 -3.92 -- -- -- -- -2.41 -2.53 Park_Under -- -- -- -- .0293 2.89 -- --
Table 8 – Estimation of vehicle portfolio choice
2.b Car Intention Choice:
Alternatives: Not_But_Car (Reference), Buy_Car Rho-square: 0.364
Variables Buy_Car
Coef. t-valueConstant -2.58 -4.66
Income (log_K) .280 2.44P_EBike_Only .488 2.83P_Motorcycles .723 2.42P_Cars_Only -2.80 -8.27
P_Cars_and_Others -2.43 -6.42Child .438 3.17
Attitude – LoveTravel .572 3.44Residential Density -.00896 -2.48
Distance to city center .136 3.74
Table 9 – Estimation of car intention choice

3 - 33
(3) Trade-off Lifestyle Choice
3.a Work at Home
Alternatives: Telecommute or work outside (reference). Rho-square: 0.439 3.b Dining
Alternatives: Dine home or Dine out (reference). Rho-square: 0.125. 3.c Leisure
Alternatives: Leisure at home or Leisure out (reference). Rho-square: 0.111
Variables Telecommute Dine Home Leisure HomeCoef. t-value Coef. t-value Coef. t-value
Constant -5.45 -4.04 3.60 8.03 -1.60 -3.56 Income (log) .264 2.20 -- -- -- -- Income (K) -- -- -- -- -.00173 -1.75
Three Generation family .448 2.26 -- -- -.415 -2.41 Elder -- -- .275 3.21 -.179 -2.06
House Owner .381 1.97 -- -- -- -- Reside elsewhere -- -- -1.08 -5.84 -- -- Residence Year 1+ -- -- -- -- -.476 -2.77
P_Motorcycles -- -- -17.5 -5.33 -- -- P_Car_Only -3.15 -5.43 P_Car_Other -3.52 -4.88
Attitude – LoveTravel -- -- -- -- -.417 -3.10 Attitude – Not prefer bus or bike -- -- -- -- .682 5.16
Attitude – Prefer big house .438 2.52 -- -- -- -- Attitude – regular exercise -- -- -- -- -.720 -5.17
Building story -- -- -- -- .0831 4.18 Building coverage -- -- -- -- 2.76 3.40
Residential Density -- -- -.00759 -2.32 -- -- Motor width -- -- -.0490 -3.88 -- --
Distance to city center -- -- -- -- .0847 2.67 Cul_de_sac -- -- -- -- 1.18 3.45
RA_Total -- -- -.00140 -2.64 -- --
Table 10 - Estimation of trade-off lifestyle choice
Note: “RA” means regional accessibility, same below
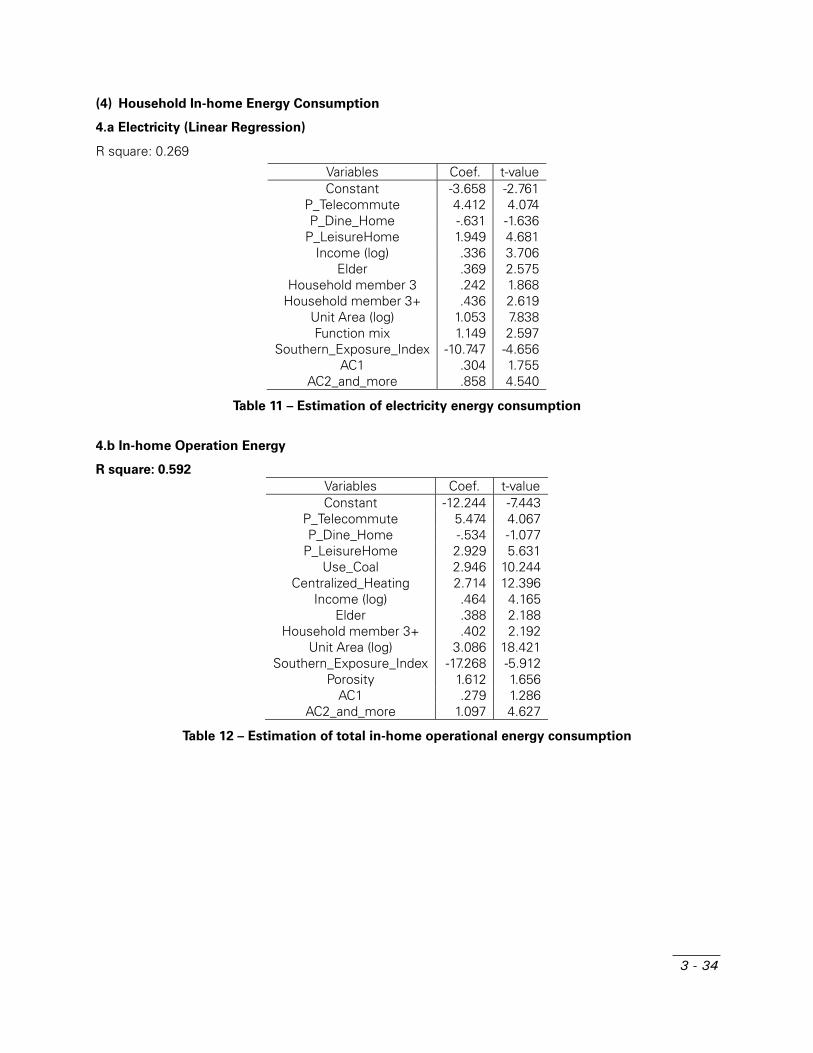
3 - 34
(4) Household In-home Energy Consumption
4.a Electricity (Linear Regression)
R square: 0.269
Variables Coef. t-valueConstant -3.658 -2.761
P_Telecommute 4.412 4.074P_Dine_Home -.631 -1.636
P_LeisureHome 1.949 4.681Income (log) .336 3.706
Elder .369 2.575Household member 3 .242 1.868
Household member 3+ .436 2.619Unit Area (log) 1.053 7.838Function mix 1.149 2.597
Southern_Exposure_Index -10.747 -4.656AC1 .304 1.755
AC2_and_more .858 4.540
Table 11 – Estimation of electricity energy consumption
4.b In-home Operation Energy
R square: 0.592
Variables Coef. t-valueConstant -12.244 -7.443
P_Telecommute 5.474 4.067P_Dine_Home -.534 -1.077
P_LeisureHome 2.929 5.631Use_Coal 2.946 10.244
Centralized_Heating 2.714 12.396Income (log) .464 4.165
Elder .388 2.188Household member 3+ .402 2.192
Unit Area (log) 3.086 18.421Southern_Exposure_Index -17.268 -5.912
Porosity 1.612 1.656AC1 .279 1.286
AC2_and_more 1.097 4.627
Table 12 – Estimation of total in-home operational energy consumption

3 - 35
(5) Household Transportation Energy Consumption
5.a Trip Generation
5.a.a Work Trips (Negative Binomial)
Variables Coef. Wald Chi-Square Sig.(Intercept) -.225 1.354 .245Employ_2 .486 59.714 .000
Employ_2+ .710 49.919 .000Elder -.375 133.718 .000
P_EBike_Only 3.745 71.873 .000P_Motorcycles 13.793 102.022 .000P_Cars_Only 3.495 128.123 .000
P_Cars_and_Other 3.256 113.345 .000parking_under -.019 18.274 .000
parking_surface .017 4.509 .034RA_office .008 17.563 .000
Residential Density -.005 13.831 .000(Negative binomial) .537 -- --
Table 13 – Estimation of work trip generation
5.a.b Maintenance Trips (Negative Binomial)
Variables Coef. Wald Chi-Square Sig.
(Intercept) .683 3.411 .065 P_Cars_Only -.599 14.326 .000 Income (log) .071 6.329 .012
Unit Area (log) .093 3.364 .067 Road_density .010 54.065 .000 BRT routes 1+ .238 20.213 .000
Distance to city center -.019 5.440 .020 Attitude – Bus Convenient .085 5.185 .023
(Negative binomial) .185 -- --
Table 14 – Estimation of maintenance trip generation
5.a.c Leisure Trips (Negative Binomial)
Variables Coef. Wald Chi-Square Sig. (Intercept) 1.035 23.301 .000
Road_density .024 22.863 .000 BRT routes 1+ .468 9.667 .002
Distance to city center -.124 23.246 .000 Elder .194 11.319 .001 Floor -.031 5.160 .023 Rent -.547 14.777 .000
Total_hh 1.4 E-4 10.585 .001 Residential density -.016 19.068 .000
Attitude – Exercise regularly .700 55.306 .000 (Negative binomial) 1.923 -- --
Table 15 – Estimation of leisure trip generation
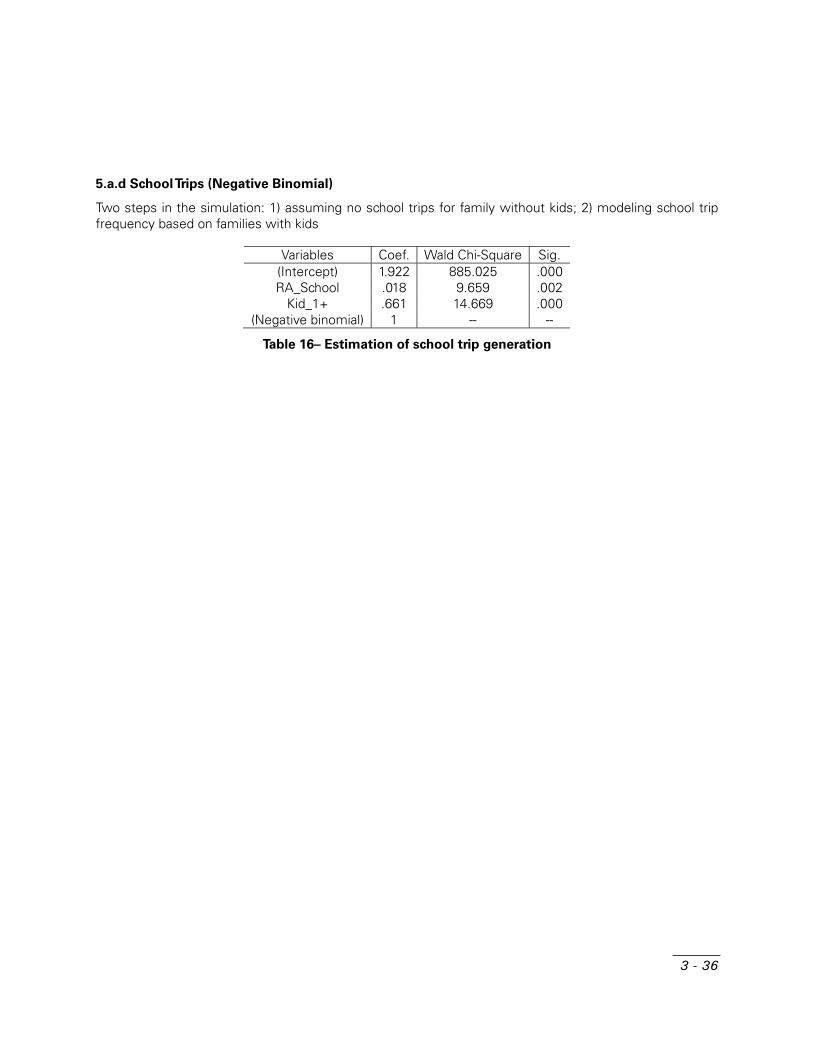
3 - 36
5.a.d School Trips (Negative Binomial)
Two steps in the simulation: 1) assuming no school trips for family without kids; 2) modeling school trip frequency based on families with kids
Variables Coef. Wald Chi-Square Sig.(Intercept) 1.922 885.025 .000RA_School .018 9.659 .002
Kid_1+ .661 14.669 .000(Negative binomial) 1 -- --
Table 16– Estimation of school trip generation
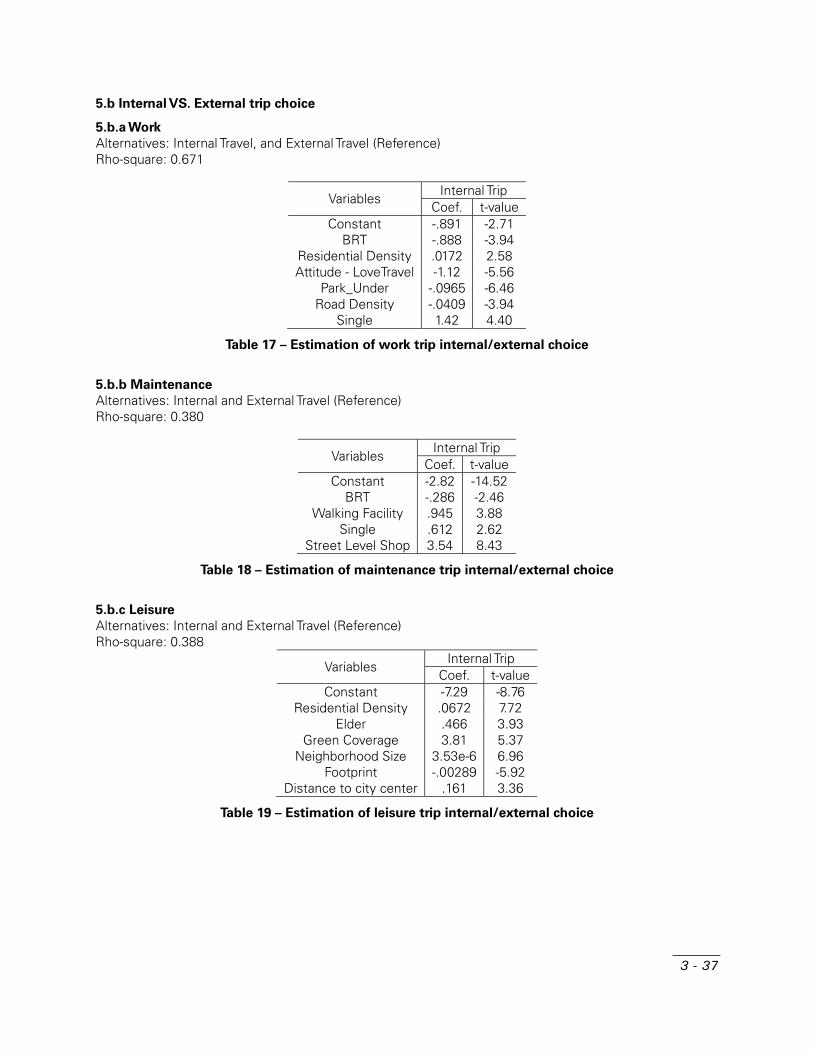
3 - 37
5.b Internal VS. External trip choice
5.b.a Work
Alternatives: Internal Travel, and External Travel (Reference) Rho-square: 0.671
Variables Internal Trip
Coef. t-valueConstant -.891 -2.71
BRT -.888 -3.94Residential Density .0172 2.58Attitude - LoveTravel -1.12 -5.56
Park_Under -.0965 -6.46Road Density -.0409 -3.94
Single 1.42 4.40
Table 17 – Estimation of work trip internal/external choice
5.b.b Maintenance
Alternatives: Internal and External Travel (Reference) Rho-square: 0.380
Variables Internal Trip
Coef. t-valueConstant -2.82 -14.52
BRT -.286 -2.46Walking Facility .945 3.88
Single .612 2.62Street Level Shop 3.54 8.43
Table 18 – Estimation of maintenance trip internal/external choice
5.b.c Leisure
Alternatives: Internal and External Travel (Reference) Rho-square: 0.388
Variables Internal Trip
Coef. t-valueConstant -7.29 -8.76
Residential Density .0672 7.72Elder .466 3.93
Green Coverage 3.81 5.37Neighborhood Size 3.53e-6 6.96
Footprint -.00289 -5.92Distance to city center .161 3.36
Table 19 – Estimation of leisure trip internal/external choice

3 - 38
5.c Trip Mode-Distance joint choice model
5.c.a Work
Lower-Level: Mode Choice Alternatives: WA (Walk), BI (Bike), EB (EBike), MO (Motorcycle, Reference), and TR (Transit) Rho-Square: 0.325
Variables Coef. t-valueConstant - WA .481 1.36 Constant - BI .898 2.44 Constant - EB .471 1.60 Constant - CA 1.50 5.93 Constant - TR 1.08 3.96
Cost -.103 -2.67 IVTT -.0515 -5.76 OVTT -.307 -5.71
Female - WA .758 3.60 Female - EB .957 4.99 Female - TR .718 4.85
Income(10K)- BI -.0665 -2.40 Income(10K)- EB -.0644 -4.12 Income(10K)- TR -.0466 -4.28
BRT - WA -1.12 -5.44 BRT - BI -.684 -3.12 BRT - EB -.429 -2.28
Travel_Waste_Time - WA -.782 -3.50 Travel_Waste_Time - BI -.318 -1.39 Travel_Waste_Time - TR -.628 -4.15
Table 20 – Estimation of work mode choice (lower level)
Upper-Level: Length Choice Alternatives: Short (Reference), Medi, and Long Trips Rho-Square: 0.172
Variables Coef. t-valueConstant - Medi 4.81 5.67 Constant - Long 7.39 4.32
LOGSUM .680 1.42 RA_Factory - Medi -.0138 -2.24 RA_Factory - Long -.0206 -1.49
Elder - Medi -.0100 -1.64 Elder - Long -.0336 -2.90 Rent - Medi -.396 -2.35 Rent – Long -.618 -1.84
Continuity – Medi -4.93 -4.21 Continuity - Long -8.34 -3.75
Table 21 – Estimation of work distance choice (upper level)

3 - 39
5.c.b Maintenance
Lower-Level: Mode Choice Alternatives: WA (Walk), BI (Bike), EB (EBike), MO (Motorcycle, Reference), and TR (Transit) Rho-Square: 0.227
Variables Coef. t-valueConstant – WA 1.76 5.47 Constant – BI .335 1.10 Constant – EB -.831 -2.00 Constant – CA -.482 -.95 Constant – TR .383 -1.06
Cost -.109 -1.95 IVTT -.0601 -10.30 OVTT -.136 -6.29
Female – WA 1.51 2.94 Female – BI 1.18 2.25 Female – EB 1.14 2.12 Female – CA 1.22 2.31 Female – TR 1.35 2.62
Footprint – EB .00176 3.31 Footprint – CA .00299 4.39 Footprint – TR .00134 3.86
Table 22– Estimation of maintenance mode choice (lower level)
Upper-Level: Length Choice Alternatives: Short (Reference), Medi, and Long Trips Rho-Square: 0.095
Variables Coef. t-valueConstant - Medi 1.19 1.92 Constant - Long 3.51 4.58
LOGSUM .682 2.39 Income - Medi .00303 2.52 Income - Long .00194 1.54 Elder - Medi -.582 -4.51 Elder - Long -.805 -5.28
RA_Shopping - Medi -.00332 -2.99 RA_Shopping - Long -.00274 -1.93
Street Level Shop -Medi -1.00 -1.94 Street Level Shop - Long -2.97 -5.18
Nsize - Medi 2.72e-6 7.29 Nsize - Long 1.76e-6 4.52
Land Use Mix - Medi -2.51 -2.62 Land Use Mix - Long -4.21 -4.43
Table 23 – Estimation of maintenance distance choice (upper level)

3 - 40
5.c.c Leisure
Lower-Level: Mode Choice Alternatives: WA (Walk), BI (Bike), EB (EBike), MO (Motorcycle, Reference), and TR (Transit) Rho-Square: 0.381
Variables Coef. t-value
Constant - WA 6.14 2.86
Constant - BI 4.13 1.85
Constant - EB 4.24 1.80
Constant - CA 4.92 2.25
Constant - TR 6.80 3.17
Cost -.189 -3.42
IVTT -.100 -6.80
OVTT -.146 -2.51
Entry_Distance - WA -.541 -1.38
Entry_Distance - BI -.622 -1.51
Entry_Distance - EB -.838 -1.92
Entry_Distance - CA -.593 -1.48
Entry_Distance - TR -.972 -2.45
Table 24 – Estimation of leisure mode choice (lower level)
Upper-Level: Length Choice Alternatives: Short (Reference), Medi, and Long Trips Rho-Square: 0.146
Variables Coef. t-value
Constant - Medi -0.539 -0.80
Constant - Long 6.64 7.49
LOGSUM .454 4.15
Income - Medi .00779 5.51
Income - Long .00946 6.57
Elder - Medi -1.08 -8.28
Elder - Long -1.10 -6.33
Household_Member_3+ - Medi -.622 -4.75
Household_Member_3+ - Long -.713 -4.89
Continuity - Medi 2.62 2.83
Continuity - Long -4.96 5.19
Residential Density - Medi -0.0138 -3.06
Residential Density - Long -0.0249 -4.60
Table 25– Estimation of leisure distance choice (upper level)
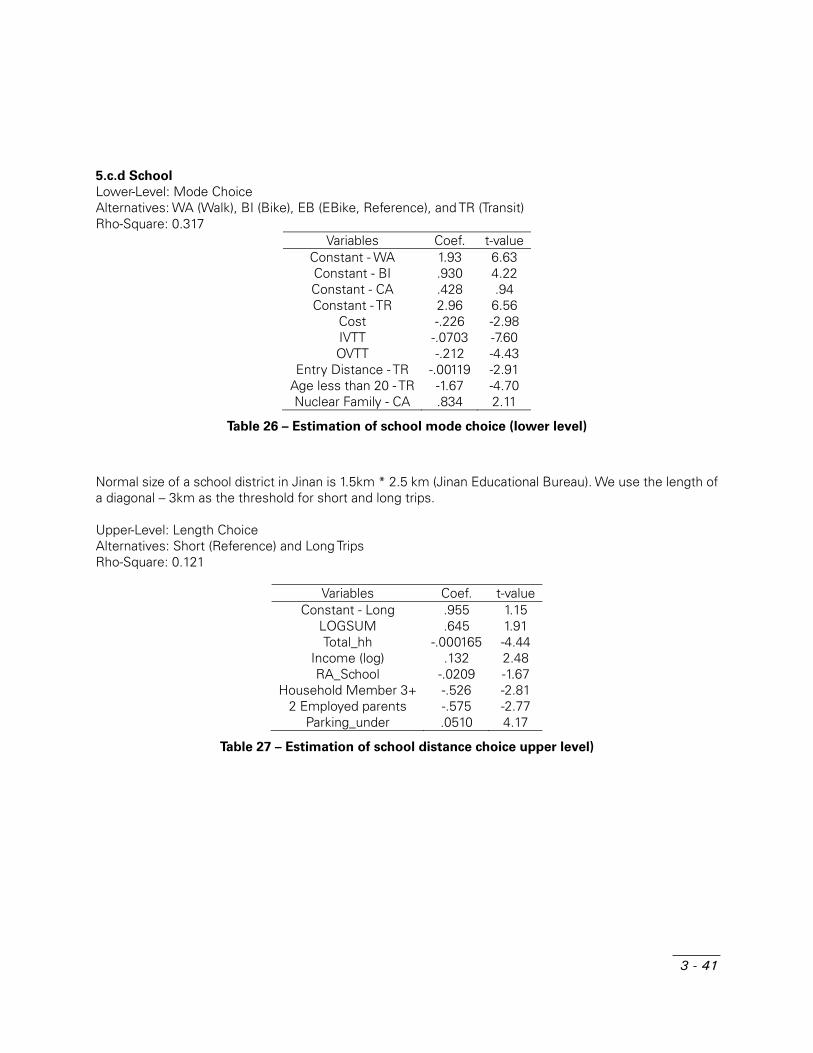
3 - 41
5.c.d School
Lower-Level: Mode Choice Alternatives: WA (Walk), BI (Bike), EB (EBike, Reference), and TR (Transit) Rho-Square: 0.317
Variables Coef. t-valueConstant - WA 1.93 6.63Constant - BI .930 4.22Constant - CA .428 .94Constant - TR 2.96 6.56
Cost -.226 -2.98IVTT -.0703 -7.60OVTT -.212 -4.43
Entry Distance - TR -.00119 -2.91Age less than 20 - TR -1.67 -4.70Nuclear Family - CA .834 2.11
Table 26 – Estimation of school mode choice (lower level)
Normal size of a school district in Jinan is 1.5km * 2.5 km (Jinan Educational Bureau). We use the length of a diagonal – 3km as the threshold for short and long trips. Upper-Level: Length Choice Alternatives: Short (Reference) and Long Trips Rho-Square: 0.121
Variables Coef. t-valueConstant - Long .955 1.15
LOGSUM .645 1.91Total_hh -.000165 -4.44
Income (log) .132 2.48RA_School -.0209 -1.67
Household Member 3+ -.526 -2.812 Employed parents -.575 -2.77
Parking_under .0510 4.17
Table 27 – Estimation of school distance choice upper level)
4
NEENPEFOA PropRegula
Qianqian
EIGNERERFOOR C
posal for atory, Mu
n Zhang, Liu
HBORGYORCHI
Improvinunicipal F
u Liu, J. Cre
ORHY MANA
ng UrbanFinance,
essica Brazi
HO
ANCA
n Energy and Mar
ier
OD
CE P
Efficiencrket-Base
D
POL
cy througed Strateg
LICY
gh gies
Y

4 - 1
4
NEIGHBORHOOD ENERGY PERFORMANCE POLICY FOR CHINA A Proposal for Improving Urban Energy Efficiency through Regulatory, Municipal Finance, and Market-Based Strategies
Qianqian Zhang, Liu Liu, J. Cressica Brazier
1. Introduction: The Idea of Neighborhood Energy Performance in Public Policy
Cities across the globe have established strong building-level and urban-scale energy use policies, such as building energy efficiency (EE), smart growth, and urban locational efficiency. However, most policy regimes have taken a segregated and piecemeal approach to regulating these different dimensions of energy use, as well as separately developing energy efficiency policies at varied scales of urban development, including buildings, district land use, and urban growth patterns. Neighborhood-level energy performance, encompassing both household energy consumption and the capacity of the neighborhood to produce renewable energy, remains largely unregulated. The synergies between different dimensions of energy consumption are also unexplored. Integrated policies and an energy estimation and benchmarking tool to support those policies would enable a much more effective regulatory

4 - 2
environment for low-carbon cities. Merging building-based and ‘street’-based energy efficiency innovations at the block, cluster, or neighborhood level—the scale at which most human activity takes place—could be the next major development in energy efficiency strategy. There are many other reasons for considering policies at the neighborhood scale. First, neighborhoods contain a mix of uses, which may facilitate efficient household activities, energy load balancing, and matching the intermittent supply of renewables. A neighborhood is also dependent on much larger magnitudes of energy and water flows and produces more waste than an individual building, and thus it provides more flexibility and scalability for integrated clean energy systems. Third, clean energy design at the neighborhood level can influence not only building-level operational energy choices that households make, but also transportation choices and lifestyle. Our research has also demonstrated that the spatial relationships between buildings can impact both building thermal performance and activities within the spaces of the neighborhood. Finally, neighborhood plans and real estate projects are the scale at which urban areas are developed, especially in rapidly urbanizing regions in Asia and other developing countries. If large-scale projects remain the de facto standard for both new development and urban regeneration plans, then urban energy efficiency agendas should align with the actual scale of development. Policymakers can now account for these interdependent dimensions of energy use in neighborhoods by using empirically-based policy analysis tools, such as the Energy Proforma© that has been developed through the MIT Making the Clean Energy City in China project. The Energy Proforma© is also a proof of concept for a common energy assessment protocol at the neighborhood scale, upon which any effective policy aimed at urban energy efficiency should be based. All stakeholders in the urban development process, from residents and local designers to central policymakers, should be able to access and compare the relative energy consumption of real estate development schemes across at least four dimensions of energy use: operational, transportation, embodied, and renewable energy generation. Broader sustainability objectives beyond energy efficiency and renewables generation, such as air and water quality, waste, biodiversity, and public health, can also be incorporated into such an analysis tool as empirical evidence becomes available. At present, the Energy Proforma© is calibrated to the urban development patterns of China, so we will first explore the implications of neighborhood energy assessment tools and standards within China’s urban policy context.
In China, finding new strategies of energy efficient urban construction is a pressing imperative, especially considering that residential land use already occupies over 50% of the area of urban development in China. Until the Reform and Opening of 1978, China’s urbanization rate was half the global average, increasing from 11% to 19% from 1950 to 1980.1 These new economic development strategies would directly benefit the rising trends of urban development in China.2 Urbanization policies themselves have now taken center stage as the 1 http://baike.baidu.com/view/2418751.htm 2 Wu Li, “the study of China’s urbanization from 1978 to 2000”, 1978-2000 年中国城市化进程研究
http://www.ce.cn/ztpd/xwzt/guonei/2004/jdzg/kfgh/jdyk/200406/25/t20040625_1151554.shtml

4 - 3
top leader of State Council, Premier Li Keqiang,3 has emphasized repeatedly that the key to realizing China’s full modernization is urbanization, which comes with both great opportunities and challenges. As he noted, the core step in this process is to relocate rural citizens into new urban developments. While China’s cities have been facing shortages of electricity and even water supply, many question if the already degraded urban environment is too vulnerable to accommodate an addition 20% of China’s population in the following 20 years.4
In this report, we propose a set of coordinated approaches to neighborhood energy performance policy, with the ultimate goal of implementing Clean Energy Neighborhood Development (CEND)—neighborhoods that enable residents to reduce their total energy consumption and increase renewables generation while maintaining the same or better quality of life as their counterparts in conventional developments—at a national scale in China. We present these six approaches as demonstrations of policy feasibility analyses that can be conducted using the Energy Proforma: prescriptive requirements for real estate projects, energy performance standards, land lease reforms, property taxation, a neighborhood labeling and disclosure program, and carbon credit trading. The first set of reforms targets the current regulatory regime for urban planning and real estate development, to re-align prescriptive criteria—including street layouts, density, use mix, and on-site renewables—with clean energy development principles directly supported by our empirical analysis of energy-efficient neighborhoods. We then propose a new, performance-based planning approach, the Neighborhood Energy Performance Standard (NEPS), which would benchmark new real estate projects’ overall energy consumption. The NEPS can serve as both a standard for design review and a post-occupancy performance indicator within the current regulatory planning system. Next, we consider how reforms of the land leasing system can incorporate clean energy development goals, to enable municipal governments to prioritize energy performance within the land lease system. Similarly, as property tax reforms advance in China, we describe how municipalities should harness this new instrument for promoting energy efficient development, by earmarking tax revenues for clean energy-oriented infrastructure and linking homeowner property tax rebates to energy performance. The final two strategies focus on market transformation. Implementing a neighborhood energy labeling and disclosure program intends to influence the value of urban energy efficiency in the real estate market. Finally, adopting a common system for measuring and monitoring neighborhood energy performance would enable municipalities and developers to participate in the recently established carbon trading markets, allowing the carbon reduction credits from low carbon neighborhood developments to be traded to industries and other energy-intensive sectors, thereby increasing the financial viability of clean energy neighborhood development. These policy recommendations span not only the market, finance, and regulatory dimensions that influence the adoption of energy
3 Li Keqiang mentioned the huge potential between urban and rural areas when he met with Jin Yong, the president of World Bank on Nov, 28th, 2012. Li Keqiang emphasized the core of the urbanization is to improve the people’s living standard when moved to urban area during his visit to Academy of State Administration of Grain on Jan 15th, 2013. 4 Li Keqiang, “Coordinated promotion of urbanization is the key to realize modernization”, 李克强:协调推进城镇化
是实现现代化的重大战略选择,http://theory.people.com.cn/n/2012/1026/c40531-19403044.html

4 - 4
efficient development practices, but also a near- and long-term view of urban transformation towards low-carbon development: land lease alignment with CEND, prescriptive regulatory guidelines, and energy performance labeling are all achievable short-term strategies, while energy performance-based standards, property taxation, and an expanded emissions trading scheme are long-term objectives. For each policy approach, we first consider the challenges and possibilities posed by present-day governance, finance, and market structures for implementing these proposals. Differences in local climate, income, activity patterns, culture, politics, construction practices, and technological change would also need to be considered, due to the sensitivity of neighborhood energy performance to these factors. We also draw on precedents to demonstrate the feasibility of the neighborhood-focused policy recommendations within China’s current policy framework; in fact, each of these policy approaches builds on at least one existing regional pilot project. Next, we outline the practical steps to implementing these approaches, generally beginning with a pilot plan within existing institutions and then expanding to national deployment, which may involve institutional transformation. Monitoring and verification of the energy performance outcomes of each policy are necessary components of the approaches, and we include a discussion of these management strategies. We conclude by illustrating the synergies between these policy reforms, to demonstrate that a robust support system for clean energy development can enable both municipalities and developers to capture the potential for energy efficiency in neighborhood form in China. We present the CEND policy agenda as two projective scenarios, in order to link these reforms in urban development policy to real project cases and policy implementation procedures. First, what needs to change within an individual development project, involving both public and private stakeholders, in order to successfully implement and monitor clean energy development? Second, we project a transformed urban development environment in which the Neighborhood Energy Performance Standard is fully operationalized, with support from integrated policies for financing and regulating CEND. In this section, we must also consider how to harmonize clean energy regulation and policies for existing properties with those that target new developments.

4 - 5
2. A review of policy recommendations for China’s neighborhoods
In their World Bank report, Liu and Salzburg offer the most direct critique of the challenges for low-carbon neighborhoods in China: “the existing system of Chinese municipal governance, finance, and planning has a detrimental effect on the development of low-carbon urban form.”5 They single out the municipal public finance system’s overdependence on land lease revenues and call for reducing ‘perverse incentives’ for local government to develop more land at low density. To achieve this, the central government should play a greater role in urban development. Another consequence of relying on ‘land-based financing’ is the abuse of indirect lending to municipalities by way of Urban Development Investment Corporations (UDICs), and Liu and Salzburg suggest that government should regulate the UDICs and reduce local debt, which also requires giving local governments access to property taxes, betterment charges, municipal borrowing, and more public-private partnerships for urban infrastructure. Notably, the report spends time outlining the need both to revise the standards of practice for neighborhood design and to support more local pilot projects. In their analysis, low-carbon neighborhood development would require changes to local planning regulations, including coordinated transport and land use planning and a comprehensive, instead of parcel-by-parcel, density control system.
3. Regulatory Reforms
3.1 Institutional context: Governance and regulatory regimes influencing China’s urban development
China’s four parallel systems of government— the Party, Congress, Government, and Political Consultative systems—may all play a role in influencing urban development policy. This complex power structure may have both direct and indirect influence on the implementation of CEND, because all of them span the hierarchy from the central government, to provincial, municipal, and township levels. The Government System, in charge of daily administration and formulating general policies, also includes all the technical and construction-related departments, such as the National Development and Reform Commission (NDRC) and the Ministry of Housing and Urban-Rural Development (MOHURD). Therefore, the implementation of clean energy neighborhoods is most dependent on this system. Another important system is the Party, as the party has the power to appointment regional leaders who play a decisive role in promoting city development strategies. Because the Congress system has the power of legislation, some key policies related to CEND, such as property tax, must find legislative
5 Liu, Z., and A. Salzberg. 2012. “Developing Low-Carbon Cities in China: Local Governance, Municipal Finance, and Land-Use Planning—The Key Underlying Drivers.” Sustainable Low-Carbon City Development in China, p. 99.

4 - 6
support through this system of government. The political consultative conference may play an advisory role.6
The central, provincial, and municipal government systems follow a similar governance structure at each level, which is led by an administrative government and composed of departments that are responsible for specific fields and hold equal powers. For example, at the central level, the leading government entity is the Council, and the department principally charged with urban construction is the MOHURD. At the provincial level, the lead administration becomes the provincial government and the specific department for construction is called the Bureau of Construction. On the municipal level, there are also a municipal government and a Bureau of Construction. Each department belongs to its government at the same level, while it also remains subordinate to the department on the higher level.
Many departments may influence the implementation of CEND. Departments including the NDRC and MOHURD hold mandates to make national and local urban development plans that could incorporate CEND requirements; the Ministry of Land and Resources (MOLR) can require criteria to be included in land leasing; the Ministry of Finance (MOF), State Administration of Taxation (SAOT), and the People’s Bank of China (PBC) can formulate supportive financial policies for the local governments and developers who build CEND; and SAOT and the Ministry of Science and Technology (MOST) can play the role of inspection and technical consultant during the whole process.
In the Party System, however, the key to the success of CEND is to convert the evaluation of leadership promotion from gross domestic product (GDP) to indices that promote healthier and more efficient urban development, such as CEND. Both the “Yearly Assessment of Party and Governmental Leadership and Leaders” and the “Comprehensive Evaluation Measurements on the Selection and Appointment of Local Communist Party and Governmental Leaders,”7 administered by the Organization Department of the Communist Party of China (ODOCPC), focus on subjective criteria such as energy efficiency and “green” construction. The transparency and rigor of these performance evaluations would benefit from indicators based on an accepted urban energy assessment protocol. In parallel, CEND would become more widely and rapidly accepted across the country, due to the broad influence of municipal government over the development of the urban landscape. The Congress System may not impact the progress of CEND in the near term. Over time, however, it could enable cleaner development after formulating laws to support wide-reaching policies, such as property tax, that will help overcome financial barriers to CEND.
Turning to the regulatory regime, four types of regulations may aid in improving neighborhood energy performance: laws, notices (or measures), technical standards and codes, and the 12th Five-Year Plan system. Only the Congress or the standing committee of the Congress at the national and provincial level and some committees at the municipal level (around 50 cities in
6 http://en.wikipedia.org/wiki/Chinese_People's_Political_Consultative_Conference 7 http://wenku.baidu.com/view/a9dde020dd36a32d73758166.html

4 - 7
China8) can establish laws. Legislation should have the greatest influence when compared with other forms of regulation, but it also lags behind the objectives of policy instruments such as the Five-Year Plans, because the legislation process is highly restricted. Usually it will take over 5 years to prepare a revision to an existing law and may take longer to produce an entirely new law. Laws also outline only the most general of requirements. For example, the renewable energy law, which was revised in 2009, requires every real estate developer to provide on-site renewables capacity, but very few cities have attempted to create policy implementation pathways that would enforce this regulation..
Notices and measures are issued by the State Council or the ministries and contain more specific requirements than the laws, but they hold less power in a more limited period of time. The State Council can also publish the Five-Year Plan, which has even stronger and more specific requirements for each lower level of government. This special plan is a traditional product of China’s political history since 1953. In advance of the each 5-year period, the Communist Party of China (CPC) requires the State Council and the NDRC to write a Five-Year Plan outline. To some extent, the Five-Year plan outline has almost the same power as the law and compensates for the slow progress of law formulation. For example, the 12th Five-Year Plan for GHG emission control9 lays out both a general requirements plan and specific, quantitative GHG emission targets, such as the percentage decrease in GHG emission per unit of GDP for each province. Every province is then obligated to formulate a specific Five-Year Plan that aligns with the central government’s objectives, and every technical department, such as MOHURD and MOLR, makes more practicable regulations to support those plans. Implementing CEND will require a cooperative agenda from China’s special power structure, embodied within the Five-Year Plan system.
The process of creating the Five-Year Plan is very complex, and it engages with all four parallel systems of government.10 However, the current 12th Five-Year Plan would not be a very efficient way of promoting clean energy neighborhood development in China, due to a lack of clear clean energy targets and specific measures for cities. Targets such as carbon emissions reductions are all designed for industries,11 while the 12th Five-Year Plan for GHG emission control only has two major indices to which cities should conform: percentage decrease of carbon emissions per unit of GDP, and percentage decrease of energy per unit GDP. Currently, every province has simply allocated the emissions reduction requirements from the upper level to all the cities in its administrative area. The No. 11th article of the Plan does require cities to develop pilot low-carbon neighborhoods, but it provides no more specific agenda and appears to have had very limited influence on the Plans of local governments.12 Provinces such as Hubei have selectively copied the low-carbon neighborhood requirement into their Plans but have 8 http://zh.wikipedia.org/wiki/较大的市 9 http://www.gov.cn/zwgk/2012-01/13/content_2043645.htm 10 the process of the 12th Five-Year Plan, “十二五”规划制定过程解读, http://finance.china.com.cn/news/gnjj/20101029/161864.shtml 11 The 12th Five-Year Plan Outline, 十二五规划纲要, http://news.sina.com.cn/c/2011-03-17/055622129864.shtml 12 The 12th Five-Year Plan of GHG emission control, "十二五"控制温室气体排放工作实施方案,
http://baike.baidu.com/view/7360869.htm

4 - 8
made the target even more vague. 13 Local administrations then further dilute these requirements in the municipal Plans. 14 Such a problem is due to a lack of clarity and enforcement within the Five-Year Plan, but it is also related to the accountability problems in the multi-level power structure together with the disincentives for such pilot projects within the leadership promotion system.
Technical policy documents include the Guobiao (GB, ‘national standards’), codes, and regulations. GB are issued only by the ministry responsible for a particular technical area, while other codes, standards and regulations are usually co-issued by the responsible ministry and the General Administration of Quality Supervision. For example, the GB of Urban Residential Areas Planning & Design is issued by MOHURD, while the GB code for vehicle emissions is issued by the Ministry of Environmental Protection (MEP). However, national GB regulations for land use and construction were co-issued by MOHURD and the General Administration of Quality Supervision, and so was the national code for building construction and climate zone division. MOHURD’s Measures for Formulating City Planning designate the legally required components of regulatory plans for all Chinese cities, including a set of boundary lines—the ‘six control lines’ of red, yellow, green, orange, blue, and purple, respectively designating the boundary of the road, infrastructure, green space, public facility, water, and historical conservation zone—that seek to balance between the interests of public service provision and real estate developers. The regulatory plan also lists the design parameters for each of the resulting land parcels, to strongly enforce parameters that developers might change to their advantage (land use, constructed floor area, FAR, site coverage, building height, and some public amenities), and to provide guidance for parameters that MOHURD considered less critical to the development outcome (green space ratio, some residential amenities). The regulatory plan development process often incorporates a preliminary urban design, to coordinate and evaluate the regulatory plan’s proposed zoning, overall building massing, and public space. However, planners and developers generally do not have adequate incentives or controls to follow through with a coordinated implementation of the spatial qualities and urban systems of this urban design proposal.
After the ministries issue these national level technical documents, municipalities will adapt these documents for local requirements. For example, the Shenzhen Urban Planning Standards and Regulations document refers to the GB of Urban Residential Areas Planning & Design, National Regulation of Land use and Construction, and the Code of Building and Climate
13 The 12th Five Year Plan of GHG emission control in Hubei Province, 湖北省"十二五"控制温室气体排放工作实施方
案,http://www.hbepb.gov.cn/zwgk/zcwj/szfwj/201301/t20130114_58539.html The 12th Five Year Plan of GHG emission control in Fujian Province, 福建省"十二五"控制温室气体排放工作实施方案,
http://www.fj.chinanews.com/news/2013/2013-02-27/226861.shtml The 12th Five Year Plan of GHG emission control in Yunnan Province, 云南省"十二五"控制温室气体排放工作实施方
案,http://www.tanpaifang.com/zhengcefagui/2013/061821409.html The 12th Five Year Plan of GHG emission control in Guangdong Province, 广东省"十二五"控制温室气体排放工作实
施方案,http://zwgk.gd.gov.cn/006939748/201208/t20120828_341198.html 14 The 12th Five Year Plan of GHG emission control in Jingmen, 荆门市"十二五"控制温室气体排放工作实施方案,
http://www.jmnews.cn/html/yaow/2013-5/28/08_03_49_647.html

4 - 9
Division. Along with this local regulatory document, planning and design guidelines for green residential districts were also issued.
The above categories are technical documents with legal authority. There are also technical documents that serve as handbooks or guidelines for reference only. For example, the Green and Eco-city Construction and Technology handbook is co-issued by MOHURD and MOST, but it is not compulsory. The Eco-city Plan Guidelines are co-issued by MOHURD and Energy Foundation, and the guidelines are also considered and outcome of pilot research projects and are not legally binding.
3.2 CEND Prescriptive Guidelines
Transitioning to an urban development system that values energy performance will require an extended process of embedding knowledge and familiarity with low-carbon design agendas within every segment of the real estate development industry. For the near term, we propose targeting the current regulatory regime for urban planning and real estate development, to re-align prescriptive criteria—including street layouts, density, use mix, and on-site renewables—with clean energy development principles directly supported by our empirical analysis of energy-efficient neighborhoods. If these guidelines are implemented within the existing revision process for urban development regulations, neighborhood development will achieve an incremental improvement in energy performance. We used the Energy Proforma to evaluate existing regulatory planning and residential codes, then we cataloged the code revisions and additional recommendations to reflect rational ranges for each of the design variables, as well as the potential energy savings due to these modifications.15
These prescriptive guidelines thus impact two levels of planning regulation: the regulatory planning level, and the residential development design codes within the regulatory plan’s parcels. The information contained in the regulatory plan, or detailed control plan, is the most important determinant of a neighborhood’s potential for energy-efficient design. In conjunction with enforceable parcel design guidelines, regulatory planning system reform is critical to beginning the process of restructuring China’s urban development conventions for CEND.
At the scale of the individual development parcel, current regulations affecting the energy efficiency of neighborhood form include: daylight access requirements, wide setbacks that separate ground-level amenities from the street, large green space ratios that compete with site coverage ratios, security guidelines that often result in reduced access, large allocations for parking spaces and car circulation, and minimal required public and commercial services in residential zones In general, neighborhood planning codes are not spatially oriented, and a developer can satisfy the code requirements with a poorly-arranged spatial plan that, for example, does not coordinate land uses and access to alternative transportation. These regulations reinforce the conventional towers-in-the-park relationships of buildings within a neighborhood, which in turn impact the quality of outdoor space, solar gains, ventilation,
15 MIT, and Tsinghua. 2012. “Making the Clean Energy City in China.” http://energyproforma.scripts.mit.edu/documents/MIT_Clean_Energy_City_Year_2_Report_web.pdf.

4 - 10
available transport modes and travel choices, and the placement and functionality of public facilities.
Urban planning bureaus do, however, find opportunities to innovate within the two-dimensional ‘control lines’ and land use designations of the regulatory plans. Shenzhen has developed a systematic yet flexible procedure for revising local regulatory plan requirements, beyond the legal requirements laid out in the national Measures for Formulating City Planning. The urban planning bureau has worked with developers to apply these strategies to regulatory plans in multiple areas, including Houhai and the Longgang Universiade City. Although not explicitly linked to energy planning, these requirements are related to improved energy efficiency in neighborhood form. Shenzhen has demonstrated this viable basis for incorporating energy concerns into national regulatory planning:
Public access routes through superblocks, marked as ground-level rights of way across blocks and second story pedestrian routes between blocks
Publicly-accessible, privately-maintained green spaces distributed as small parks, which allow for greater site coverage at ground level
District-scale transportation amenities (i.e. local street-level tram that connects superblock entrances to mass transit)
Pedestrian streets and special commercial zones between and within developments Form-based codes, including three-dimensional massing and elevation requirements for
developers that improve and localize the control of building density Wider allowances for residential floor area within commercial zones and vice versa,
which enable a greater mix of uses while still adhering to land use requirements Local jurisdictions also have the opportunity to redefine or add new requirements to the national residential design code, to incorporate local development objectives and climatic needs. However, many of these local modifications may work against energy efficiency and need to be guided toward values that reduce energy consumption. Shenzhen’s planning bureau has already reconsidered many inefficient standards, including setback requirements and limitations on mixed use development. Shanghai has also introduced ‘smart growth’ principles into local planning guidelines. In 2009, the Shanghai Urban Planning and Land Resources Bureau reissued the Shanghai Large-Scale Residential District Planning and Design Guidelines to district planning departments, land developers responsible for local urban designs, real estate developers, and local planning and design institutes. The revised guidelines clearly defined new key priorities that span both regulatory planning and neighborhood design stages for residential developments, including:
Mixed-use functions, including commercial space on the perimeter of gated communities, and ‘small office-home office’ shared use programming, possibly to improve street utilization and to allow flexible mixed-use within developments
Higher-density housing surrounding transit hubs and core districts, a strategy that is generally known as transit-oriented development
4 - 11
Road network distribution, including recommending a 250m block length for typical gated residential parcels, not to exceed 350m, possibly to improve pedestrian and transport access
Area limitations for apartment floor plans: 2-bedroom apartments should not exceed 75 sq.m., and 3-bedroom apartments should be limited to 90 sq.m.
National energy laws also support on-site renewable energy generation; the 2009 Renewable Energy Law requires residential developers to consider renewable power generation for buildings, including solar thermal and PV, ‘where applicable’. Beijing is the first major city to set the precedent of mandating developers to install complete solar water heating systems, in an ordinance issued by the Beijing Municipal Commission of Housing and Urban Rural Development in December 2011.16
We have used the knowledge gained through our empirical analysis and design studies to define a set of Clean Energy Neighborhood Development (CEND) guidelines for use by municipal planning authorities in China. In the Year 2 Report,17 we show how we have coordinated these guidelines with current codes for both regulatory plans and individual development parcels. We have also used the Energy Proforma to recommend rational, quantitative ranges for each of the design variables, as well as the potential energy savings due to these modifications. These CEND guidelines are logical extensions of the policies that cities such as Shenzhen and Shanghai have already implemented in their control plans and residential planning regulations. The guidelines are associated with four overarching objectives of clean energy neighborhood development:
Climatic quality: This goal encompasses many of the urban design characteristics that determine the operational energy performance of a neighborhood, including the density and orientation of the built cluster forms. Although the floor area ratio (FAR) is the primary control of built density in China’s planning system, a lower porosity for a development, or reducing the ratio of the total volume of open air to the building masses, is essential for moderating both sun and wind impacts on operational energy use. Floor area ratios should therefore be combined with more restrictive building height limitations, in order to increase development density and prevent ‘towers-in-the-park’ forms that typically have porosity values over 80%. We recommend a mix of low and high-rise structures, to create a higher overall density in the average FAR range of 2.5-5, depending on the urban context. More sophisticated methods for calculating ambient daylight access should also be used to avoid the convention of entirely south-facing buildings.
Road network and pedestrian connectivity: The goal of greater connectivity across a neighborhood is achieved through another bundle of guidelines that creates a network of car, pedestrian and bicycle access to the daily living needs. Higher road density within and among
16 Process of revising urban planning and development standards, which functions well in Shenzhen but not so well in other cities, should be explained here. 17 MIT, and Tsinghua. 2012. “Making the Clean Energy City in China.” http://energyproforma.scripts.mit.edu/documents/MIT_Clean_Energy_City_Year_2_Report_web.pdf.

4 - 12
neighborhoods minimizes vehicular travel distances from home to work, social life, shopping, and services, and facilitates lower-energy forms of travel such as walking or bicycles. It also enables smaller street widths, encouraging walkability and integration of land uses. Conversely, low road density results in fewer, wider streets that create barriers to pedestrian movement and urban integration. In our analyses of current neighborhood form, buildings with smaller footprints were associated with much lower household transport energy use than conventional tower footprints. Road spacing of 100m is recommended, and block lengths should not exceed 250m. All roads should be through-streets that incorporate sidewalks, pedestrian amenities, and street-level storefronts.
Neighborhood functionality: We recommend including multiple uses within neighborhoods sufficient to provide for daily activities, as well as opportunities for employment within a walking distance of approximately 500 meters. The functionality of a neighborhood depends heavily on the productive use of ground level space; therefore, we suggest creating an ‘effective green space ratio’ that includes green space on above-ground levels, to allow for more ground-level space to be used for pedestrian access and mixed uses.
Renewable energy potential: Neighborhoods with greater site coverage will also provide larger roof surfaces to accommodate PV electricity and solar hot water systems. A hybrid system of solar energy utilization could supply 10% of electricity and 100% of hot water needs during the majority of the year in most areas of China.
3.3 Neighborhood Energy Performance Standard (NEPS)
By incorporating the Energy Proforma into the neighborhood design and evaluation process, we can advance beyond conventional prescriptive guidelines to establish a performance-based energy standard at the scale of an entire neighborhood. We call this new energy assessment system the Neighborhood Energy Performance Standard (NEPS), a standard that can be applied to both individual parcel analysis and the assessment of larger clusters within a regulatory plan. These performance-based objectives are an important advancement over China’s conventional design regulations, which typically specify rigid, minimum dimensional requirements, for instance for building spacing, with no scientific way to measure what the environmental consequences of the requirement will be in a particular case, and no means to make trade-offs among different project requirements to achieve the best overall result.
Similar to a minimum fuel efficiency standard for motor vehicle design, a Neighborhood Energy Performance Standard would set maximum energy consumption and carbon emissions values per square meter and per household, calibrated to an expected energy reduction from a baseline neighborhood development in a specific locality. The NEPS is also a comparable concept to many international building energy codes that require conformance to a performance-based total “energy budget,” while allowing the building to make trade-offs between the performance of individual building components, for example by improving window insulation and reducing heating efficiency.
China’s advancements in implementing and enforcing building energy efficiency provide a precedent for the proposed NEPS. The Design Standard for Energy Efficiency in Residential

Buildingsrequires or a peConservadown sylocationsplans forconsultanthe stanConstrucenvelopeby 2008,
The NEPregulatorconformaprotocol energy ucompareevaluate conventioper year,which is an Energ
Figure 1. P
18 Price, L“AssessmFive Year P
s, issued by either a pre
erformance-bation Law aystem of acs a separate r compliancent (usually ndardized ch
ction site ine materials.
but this rate
PS neighborhry plan. Wance with thfor evaluat
use, setting d with thethe actual
onal neighb so a new na reasonab
gy Proforma
Procedure for
., M.D. Levine,ent of China’s
Plan.” Energy P
MOHURD, scriptive app
based simund the Reguccountabilitydepartment
e with the national or pecklist of e
nspectors foNew constre varies sub
hood-level “With this sthe NEPS by ing a neigha reduced e
e benchmarenergy perforhoods in
neighborhoole target redanalysis (Fig
applying the N
, N. Zhou, D. FEnergy-saving
Policy.
establishes plication of ilation of thulation on Ey and enfort from the uenergy effic
provincial deeach buildingollow up toruction projestantially by
energy budgtandard, deproviding ca
hborhood usemissions ork, then coformance ofa particular d plan woul
duction for cgure 1).
NEPS to new
ridley, N. Adenand Emission-
a maximuminsulation anhe building
Energy Consrcement. Thurban planninciency standsign institutg wall sectio ensure coects reachedlocal jurisdic
get” is an eevelopers aalculations frsing the NEor energy usonducting pf the new ncity could cd be requireconventional
neighborhood
n, H. Lu, M. Mc-reduction Acco
m building ennd other ene’s thermal
servation in he local conng bureau—dards, and ates) conduction componompliance wd a nationwction.18
enforceable ind designerom the EneEPS includesse target forperiodic posneighborhoodconsume 10ed to consuml superblock
d developmen
cNeil, N. Zhengomplishments
nergy consumergy conserv
efficiency. Civil Buildinnstruction b
—initially revian approvedts an indepenent’s thermwith the ap
wide complia
indicator forers can theergy Proforms establishir a new neigst-occupancyd. For exam00 gigajouleme only 70%k developme
nts
g, Y. Qin, and Pand Opportuni
4
mption valuevation meas
China’s Enngs outline abureau—in sews the bu
d building enendent revie
mal performapproved bunce rate of
r each parceen demons
ma tool. The ng a benchghborhood wy evaluation
mple, compaes per house% of that enents accordi
P. Yowargana. ities During the
4 - 13
e and sures, nergy a top-some ilding nergy ew of ance. ilding 80%
el in a strate basic
hmark when ns to arable ehold
nergy, ng to
2011. e 11th
4 - 14
To attain approval under the NEPS, most development projects will need to fulfill performance improvements on both planning and architectural levels. In fact, coordination across adjacent real estate development projects may be necessary for modifying neighborhood massing and ensuring the execution of streetscapes that support low-carbon transport options and accessible services. Trade-offs between operational, embodied, transport, and renewable energy improvements will need to be negotiated within the project design team as well as between investors and planners. Instead of becoming an additional impediment to the design process, the NEPS can present an opportunity to bring multiple stakeholders to the table to identify possible design innovations, reconsider development priorities, and balance between public interests, private real estate objectives, and consumer advocacy.
4. Municipal Land Leasing and Public Finance Reforms
We propose that sustainable neighborhood development could be a meaningful common goal around which to structure municipal finance reforms. In this section, we examine the components of the fiscal system that supports urban infrastructure, a crucial component of clean energy neighborhood development. The current system of land leasing, limited taxation, fees, and borrowing practices form both barriers and opportunities for supporting clean energy development.
First, dependence on land lease revenues needs to be reduced. If local land resource bureaus incorporate neighborhood energy performance criteria into the land leasing conditions, land pricing in both auction and tender leasing methods could adjust to reflect the costs and potential market value of energy-efficient planning.
Similarly, as property tax reforms advance in China, municipalities should consider how this new tax instrument can promote energy efficient development. Most importantly, this new revenue stream could begin to supplant municipal governments’ need for land lease revenues, but a secondary role of the property tax system could be to directly support and incentivize clean energy development through tax rebates and penalties for homeowners. In the short term, central-to-local fiscal transfers also need to be considered for making up the difference between the costs of CEND and the costs that the conventional real estate market can support. In the long term, public finance reform should imbue local government with stronger institutional capacity for guiding private developers in carrying out clean energy neighborhood development.
4.1 Institutional context: municipal public finance challenges in land leasing and property taxation
Municipal land leasing practices are a key driver of residential development for both public and private stakeholders in China, and these practices should act as a “gate keeper” to ensure the quality of urban development. In the current public finance regime, however, land income
4 - 15
composes a large part of municipal income, and public finances are highly dependent on land lease revenues.19 Land issue in China is generally divided into 2 parts: administrative allocation and land lease. The administrative allocation process is typically used to facilitate large public infrastructure projects, and the government often converts arable land to this usage. Land parcels are now most frequently issued via the market-based mechanism of the land lease. There are three subcategories of land leasing: tender, action, and listing (TAL). In this section, we focus on TAL practices, the history of land leasing reforms, and their potential relationship with clean energy development.
Before the establishment of TAL system, land leasing policies underwent an extensive and long-term period of reform, which ultimately trended toward marketization. Before 1980, land parcels were prohibited from being transferred within a land market. The first time that the ownership and use rights of land were separated was in 1986, when “the Shenzhen government created a task force to push for improvements in the land allocation system, with a view to moving from a purely administrative process to one based on market competition.”20 Shortly after that, the first TAL experiments were launched in Shenzhen.21 The land leasing price by auction turned out to be two times the basic price.22 After the pilot test in the laboratory of the Special Economic Zone, the new land tenure system became national policy in 1988.23 From 1987 to 1998, however, most land was still leased by administrative allocation. In 1998, there was a national regulation encouraging TAL. Later, in 2002, the Ministry of Land and Resources (MOLR) issued the “Regulations of Transferring the Use Rights of State-Owned Land by Open TAL.” These regulations required all profit-making land transactions to be conducted by open TAL starting on July 1, 2002, including commercial, tourism, entertainment use, and commodity housing.24 Meanwhile, leasing by agreement was banned except for special cases. It was not until 2007 that the land market was almost fully marketized and using the TAL system.
At first glance, the TAL land leasing system is a fairly good one: it may reduce corruption, allow transparency of land transactions, may incentivize market competition, and can better allocate the land resources. But there are still many problems that are already working to impede clean energy neighborhood development. First, price becomes the dominant criterion. Calls for transparency and reducing corruption have encouraged local officials to adopt the auction method of land allocation, but this method often results in acceptance of the highest bids and
19 Wu, Weiping. 2010. “Urban Infrastructure Financing and Economic Performance in China.” Urban Geography 31 (July 1): 648–667. 20 Shen, Xiaofang, and Songming Xu. 2012. “China: Shenzhen Special Economic Zone as a Policy Reform Incubator for Urban Land Market Development.” Untying the Land Knot: 87. 21 Chinese land reform: http://cpc.people.com.cn/GB/64156/64157/4512167.html (Chinese website) 22 land reform and development zone- forum: http://www.people.com.cn/GB/32306/54155/57487/8239987.html (Chinese website) 23 Campanella, Thomas J. The Concrete Dragon: China's urban revolution and what it means for the world. Princeton Architectural Press, 2008. 24 Regulations of Transferring the Use Rights of State-Owned Land, MLR, (6 April 2005), available at: http://www.mlr.gov.cn/zwgk/flfg/dfflfg/200504/t20050406_66761.htm.

4 - 16
encourages municipal governments to seek higher profits,25 which may jeopardize the quality of land development and thus exclude all CEND projects. Second, though local administrators claim to have reduced corruption, corruption is still prevalent in the real estate market.26 Zhu argues that as industry reforms give power to more officials in each step of the development process, corruption might become a consequence of these attempts at regulating real estate development.27 Corruption, either actual or perceived, may decrease the credibility of clean energy neighborhood development schemes, if non-auction methods are used to support CEND. Because there is no independent third party monitoring system for TAL activities, information disclosure for both developer bids and energy consumption become an important complementary practice, an issue we discuss later in this paper. Third, municipal governments rely too heavily on land lease revenue. The ratio of local revenues to the total revenue has averaged around 50 percent, while the ratio of local fiscal expenditures to the total remains much higher, at about 70 percent.28 To fill the gap, local governments almost invariably turn to land concessions. It is estimated that on an average 30% of government income (exclusive of borrowing) comes from off-budget land leasing revenue. The percentage in some small cities can even reach as high as 90%.29 This dependence results in irrational urban expansion and land use inefficiency: land leasing becomes a method to raise money, and much of the leased land remains vacant for years. It is especially serious in small towns that have even fewer financial resources. This dependence will lead directly to development agendas focusing on quantity rather than quality. In sum, the price-oriented land market presents little incentive to pursue CEND, and reforms would be necessary to enable CEND.
Partly due to the problems addressed above, and also due to other economic and sustainable development trends, some refinements of the current land leasing system have occurred. Cities including Beijing, Tianjin and Qingdao experimented with innovative ways of land leasing within the existing framework of TAL, including competitive land pricing conditional on a maximum housing price,30 to control the trend towards extremely high land auction prices. Other reforms focused on achieving housing price control are also becoming more prevalent. In February 2013, the most recent National Five Strategies on land and housing marketing were issued, which targets two main problems: extremely high land prices and a large amount of vacant leased land.31 The National Five strategies show the trend that the central government has recognized the severe problems brought by the current land leasing and land-based finance practices, and the central government is requiring the local government to take more
25 Tian, Li, and Wenjun Ma. 2009. “Government Intervention in City Development of China: A Tool of Land Supply.” Land Use Policy 26 (3) (July): 599–609. 26 Zhu, Jiangnan. 2012. “The Shadow of the Skyscrapers: Real Estate Corruption in China.” Journal of Contemporary China 21 (74): 243–260. 27 Zhu, Jiangnan. 2012. “The Shadow of the Skyscrapers: Real Estate Corruption in China.” Journal of Contemporary China 21 (74): 243. 28 Zhigang Yang. "Chinese fiscal system of taxation: Problems and reform proposals." Fiscal federalism and fiscal management (2005): 51. 29 Guoling Zhao, Xianhui Hu & Gangqiao Yang. (2008). Analysis on “land finance”. Economy Economics, 7, 018 30 Land TAL: http://house.people.com.cn/n/2013/0216/c353928-20495972.html (Chinese website) 31 Residential property registration: http://house.ifeng.com/special/fangcs/ (Chinese website)
4 - 17
responsibility for controlling land prices, as well as for monitoring the quality of land development.
As mixed-use industrial development zones (DZ) become an increasingly popular feature local economic development plans, the land leasing system is also being reformed to better fit these development schemes. Pilot experiments for DZ land leasing have attempted both new management approaches and lower energy consumption via improved management and resource allocation. In the Tianjin Binhai New Zone, for example, local government has more power in reallocating land resources,32 so they approached the DZ as a holistic plan that incorporated large-scale “eco-infrastructure.” The Binhai DZ land reform also addresses issues such as agricultural land preservation, better compensation for displaced local residents, land revenue allocation management, and better monitoring of the quality of land development.33 Because the above elements are all included in the multi-criteria land leasing system, and the local government has more powers to allocate resources and control the master plan, the result was promising: it was reported that energy consumption per capita in 2012 (including industrial, buildings, and transportation sectors) was 25% less than the 2010 level for existing DZ occupants.34 However, the relationships between these new land lease mechanisms and energy conservation remain unclear.
Lastly and most importantly, land leasing reforms are beginning to incorporate green building criteria. In January 2013, the State Council approved the MOHURD and NDRC’s proposal for a green building action plan, which clearly states that “land and resources departments should conduct more research to formulate new land transfer policies to promote green building developments. Housing and Urban Construction departments should conduct studies to formulate policies for FAR awards incentives. In the land TAL’s planning criteria, the proportion of land used for green building construction should be made clear.”35 The Beijing government has even included green building requirements in TAL documents for Xiaotangshan town in Changping district, in which two parcels must obtain the MOHURD Three Star rating, and one parcel should reach One Star status.36 Moreover, the TAL documents also require installation of a pneumatic waste collection system. At the end of 2012, the Nanchang government also included building energy performance, renewable energy, renewable water, construction material recycling, and other green building indicators in the prioritized preconditions of land development and planning for all newly built public buildings after 2012. All these preconditions must now be clearly indicated in the land leasing contracts.37
32 Tianjin Development zone land reform: http://bbs.cfaspace.com/thread-168331-1-1.html (Chinese website) 33 Tianjin Development zone land management reform: http://wenku.baidu.com/view/f0f4de2eed630b1c59eeb526.html (Chinese website) 34 Energy comsuption per GPD at Tianjin Development zone: http://www.022net.com/2013/2-8/446428182394459.html (Chinese website) 35 NDRC, Mohurd (2013), green building action plan, available at: http://www.gov.cn/zwgk/2013-01/06/content_2305793.htm (Chinese website) 36 Beijing: green building and land leasing: http://www.cpmchina.com/html/11/70857.html (Chinese website) 37 Nanchang green building proposal: http://www.nc.gov.cn/xwzx/shsh/201212/t20121218_621395.htm (Chinese website)

4 - 18
Looking at the larger public finance system in China, players include People’s Congress, NDRC, MOF, China Development Bank (CDB), Commercial Banks and Urban Development Investment Corporations (UDICs). Funding for public services usually comes from local taxation, while funding for new projects comes mainly from extra-budget revenue and self-raised funds.38 The NDRC is in charge of the national development goals, which means their financial support generally leans toward “key industries.” The MOF’s responsibilities include strategic fiscal planning, formulating related laws and regulations, balance of payment, transfer payments, and management of non-tax income. The MOF will also participate in issuing and supervising central fiscal expenses from the central budget. More importantly, the MOF and NDRC can co-issue “notices” on central financial subsidies for certain kinds of projects. For example, these ministries announced that in the 11th Five-Year Plan, “energy-saving enterprises” could obtain central financial subsidies.39 In 2012, they issued another 170 billion RMB in funding for energy conservation.40 Another 1.7 billion was allocated to projects for building energy conservation in northern China.41 The China Development Bank acts more like a central investor. Its projects focus more on national-level, large-scale development projects, either spanning large areas like a regional highway system, or serving important roles in development strategies, such as the Qianhai new district development in Shenzhen. Recently, the CDB has been involved in some small projects that serve the central government’s agenda of “harmonious society”—projects like slum revitalization and affordable housing development.42 Municipal borrowing is also an increasingly critical issue, and it could benefit from greater central oversight and alignment with a true “green loan” program.
Urban Development Investment Corporations have become an emerging player in local governments’ drive to finance and build infrastructure in China, where local administrations are not allowed to engage in direct borrowing from asset markets.43 The UDIC model provides municipal governments with a corporate government structure, in order to borrow from the market and quickly develop infrastructure. They are treated as municipal corporations under the Company Law of the People’s Republic of China (PRC).44 The UDIC is therefore a financing platform, a public sector investor, a land development agent and a project sponsor or owner. The SAR Development Group (Shenzhen), for example, was formed in 2011 when five companies were assigned to the group, including the main planning firm of Shenzhen, the Urban Planning and Design Institute of Shenzhen (UPDIS). This group is now in charge of industrial park developments, urban unit developments, urban infrastructure development, old town revitalization, and affordable housing projects. Their tasks also include raising funds to support urban development. During the 12th Five-Year Plan, this group invested in 122 projects,
38 Wu, Fulong, Jiang Xu, and Anthony Gar-On Yeh. 2006. Urban development in post-reform China: state, market, and space. Vol. 15. Taylor & Francis. 39 http://www.stcsm.gov.cn/gk/bmfw/fwzx/xxzd/zcjd/295105.httm 40 Central financial support on energy conservation: http://news.xinhuanet.com/energy/2012-05/24/c_123186770.htm (Chinese webiste) 41 http://house.hexun.com/2012-03-16/139386809.html 42 China Development Bank webpage: www.cdb.com.cn (Chines webpage) 43 “World Bank. 2010. The Urban Development Investment Corporations (UDICs) in Chongqing, China. © World Bank., https://openknowledge.worldbank.org/handle/10986/2888 44 “World Bank. 2010. The Urban Development Investment Corporations (UDICs) in Chongqing, China.

4 - 19
including 80 nonprofit projects (30 billion RMB) and 42 for-profit projects (300 billion RMB).45 To better ensure the implementation of the projects, the development groups issue medium-term notes and project loans. Meanwhile, the groups try to broaden their financing channels by collaborating with commercial banks, securities, investments, insurances, trust and other financial institutions. 46 UDICs could thus play an active role in CEND. From the CEND development point of view, the major challenge is the absence of financial incentive for energy efficiency. Neither UDICs nor private developers will be willing to fulfill CEND requirements if they result in reduced profits.
The absence of property tax, one of the most basic tax types in many countries, is also a challenge for financing urban infrastructure. First, there is insufficient local fiscal income. In the current tax sharing system, local governments retain only 40% of business and other tax income on average, and the remainder (60%) is transferred to the central government.47 Small towns in particular may have limited funds for additional urban development costs. Second, municipal governments themselves are most likely unable to provide subsidies to developers for the added costs of CEND or subsidies to homebuyers in CEND, although advantageous land leasing arrangements often indirectly subsidize developers. In addition, without a property tax system, there is no mechanism for tax incentives or penalties on residential land development, and yet local governments have no opportunity to use property tax as leverage to direct homeowners’ choices.
Property tax is therefore a key missing element for local public finance. Fortunately, property tax for residential apartments is already under consideration. Two cities, Shanghai and Chongqing, have already conducted experimental programs with partial property taxes in 2011. In Shanghai, the geographic scope was limited to the administrative region of Shanghai and tax is only levied on second home purchasers after January 2011. Under these provisional implementation rules, tax concessions are available for highly skilled individuals who have migrated from outside of Shanghai.48 The situation in Chongqing is similar: only single family homes, luxury apartments (two times the average apartment price), and second homes for buyers without a Chongqing hukou were included in the property tax system. The revenues from Shanghai’s pilot program were reserved for public housing development, but the use of tax revenues in Chongqing has not been publicized. The State Council recently announced that the scope of residential property tax reform is to be expanded,49 which means that more cities
45 Shenzhen SEZ Construction and Development Ltd. webpage, http://mail.ytport.com/sitecn/jtgk/index.html (Chinese webpage) 46 Shenzhen SEZ Construction and Development Ltd. webpage, http://mail.ytport.com/sitecn/jtgk/index.html (Chinese webpage 47 Guoling Zhao, Xianhui Hu & Gangqiao Yang. (2008). Analysis on “land finance”. Economy Economics, 7, 018 48 Yang, Luo. 2011. Real Estate Tax (RET) of People’s Republic of China – An Analysis of the Effectiveness of the Implementation of the RET in the Shanghai Trial. SSRN Scholarly Paper ID 1963551. Rochester, NY: Social Science Research Network. 49 State Council: expand the numbers of pilot cities for residential property tax: http://news.xinhuanet.com/politics/2013-02/20/c_114743180.htm (Chinese website)

4 - 20
will host pilot projects. Yet another sign is that a residential housing information platform is under construction,50 which might serve as the database for residential property tax.
Other tax incentive precedents include tax reductions for developers. It is estimated that in the green building sector, 35.6% of the incentive policies of local governments are tax reductions for developers, and 36.8% are allowances for buyers.51 The MOF has also supported energy efficiency retrofits since the early 1990s, through the Energy Efficiency Retrofits for Existing Residential Buildings program (EERERB). Though the scale of retrofits was small and the projects lacked systematic and effective organization, it is considered to be an important program for China’s energy strategy.52 Documents such as ‘‘Interim administrative method for incentive funds for heating metering and EERERB in China’s northern heating area (No.957 [2007] of the Ministry of Finance)’’ clearly require that the central government arrange a special transfer payment for heat metering and EERERB projects in China’s north heating area.53 But the central government’s subsidy is insufficient, especially in underdeveloped provinces and cities. Since local governments do not have sufficient fiscal strength to meet their financial responsibilities in China’s current public finance system, the fiscal pressure often causes local governments to lose their motivation to implement EERERB.54 This case also shows the importance of robust financial support for clean energy projects.
4.2 Land leasing reform proposal
As we discussed above, the TAL land lease system provides a strong incentives for higher land revenue and potentially improving land management, but it is not a good system for encouraging higher quality land development. As the focus of urbanization in China shifts from quantity to quality, a new round of land leasing reform is necessary. In this section, we recommend two strategies for reforming land leasing practices: reinforcing multi-criteria bidding procedures and public-private partnerships for CEND. Besides central-to-local fiscal transfers, tax reform is another important component for generating CEND, which will be discussed in the next session.
First, a multi-criteria bidding approach should be used for all types—tender, auction, or listing—of land leases. The highest bid can still be sought while embedding these CEND criteria in the lease requirements, and the local government can still obtain the highest present value for the land after accounting for the development’s lifetime carbon production. However, price can no longer be the first or only condition in the bid evaluation process. Neighborhood energy consumption can be estimated in the pre-bidding phase and included in the land leasing requirements. To make this happen, MOHURD and NDRC could co-issue “Clean Energy
50 Mohurd: houseowener database being built: http://news.xinhuanet.com/house/2012-01/09/c_122555810.htm ( Chinese website) 51 Liang, Jing, Baizhan Li, Yong Wu, and Runming Yao. 2007. “An Investigation of the Existing Situation and Trends in Building Energy Efficiency Management in China.” Energy and Buildings 39 (10) (October): 1098–1106. 52 Li, Dongyan. 2009. “Fiscal and Tax Policy Support for Energy Efficiency Retrofit for Existing Residential Buildings in China’s Northern Heating Region.” Energy Policy 37 (6): 2113–2118. 53 Li, Dongyan. 2009. “Fiscal and Tax Policy Support for Energy Efficiency Retrofit for Existing Residential Buildings.” 54 Li, Dongyan. 2009. “Fiscal and Tax Policy Support for Energy Efficiency Retrofit for Existing Residential Buildings.”

Neighborenergy cnecessitaalso be proceduroutcomeThe MOimplemegovernmassist thappropriaimplemeand distrcan imagorder to the reguincluding
Figure 2.
The secoprivate pdevelopmdevelopmNational delivery China: p
rhood Actionconsumptioate fewer aubeneficial tores will be se of includingOF can facil
nt the newments still hig
e municipal ate goals, dntation pathict governm
gine that a sincentivize lolations issue
g CEND indic
Implementa
ond recommpartnershipsment plans.ment, but P
Five Stratemethod. Affrivate devel
n Plans” at n in land uctions, or mo include Csimilar to thog green builditate centra
w land leasghly dependgovernmen
etailed actiohway for the
ments (Figuresystem that ocal governmed by the cecators in the
ation pathwa
mendation fs (PPPs), to. Public-privPPs for strugies also cafordable houopers are e
the nationaleasing. A
more conditiEND strategose of the gding requiremal-to-local fissing systemd on land innts’ adoptionon plans, ane action plae 2). With resupports a
ment to adoentral gover civil servan
ay for CEND
for restructuo ensure tvate partneructuring landall for more using projecencouraged
al level, whicmore robu
onal auctiongies in the green buildinments in thescal transfe
m, especiallycome. The n of land lead technologns, from theforms that ihigher qualipt this land nment, espet promotion
land leasing
uring land lhat developrships ared developm
affordable ts already reto build a c
ch would eust multi-crns, and moreFive-Year Png action ple land leasinrs as inceny in the trprovincial leasing reformgy documene national gnclude CENty of land dleasing mececially NDRCsystem.
reform actio
easing pracpers follow more broaent hold pohousing toepresent strcertain porti
mphasize thiteria biddine tender and
Plans. Theselan, which dng process inntives for eransition peevel of govems by estabnts. The ideagovernment ND criteria in
evelopmentchanism, theC and MOH
on plans
ctices is to through o
dly used fotential for C
be providedrong precedion of afford
4
he importanng system d listing. It we implementdirectly led tn some locaeach provinceriod when ernment canblishing regioa is to creato the mun land leasingt would resue system calHURD, as w
promote pon clean enor infrastruCEND. The d by this pr
dents for PPdable housi
4 - 21
ce of may
would tation o the lities. ce to local
n also onally te an
nicipal g, we ult. In lls for ell as
ublic-nergy cture 2013
roject PPs in ng in
4 - 22
many real estate projects, and private developers also take on the construction of state-sponsored social housing. Therefore, affordable housing can be built through build-transfer (BT) or build-operate-transfer (BOT).55
Similar PPP schemes can be applied to CEND, because private partners need loans and the public sector’s financial support, resulting in the benefits of CEND branding for both parties. From the public perspective, PPPs moderate the governments’ financial constraints and encourage the development of social housing projects; from the private developer’s perspective, PPPs can produce a better financial situation and reach civic goals while promoting its brand. Land transfers by tender and bidding should therefore be used more frequently to enable partnerships between UDICs and private developers. For example, using BOT, residential development can be initiated by public and private sectors and, after a certain operating period, transferred to private sector.
More importantly, clean energy development and affordable housing development can be pursued jointly. The affordable housing sector may be the most useful platform for experiments with subsidizing and managing CEND. First of all, affordable housing is an important real estate sector in which the public sector already plays a clear role. It will be more straightforward to incorporate CEND into national affordable housing plans than into conventional development. Second, affordable housing is not supposed to be profit-seeking, which may facilitate the implementation of pilot CEND projects. Third, affordable housing is most likely to implement better monitoring of energy consumption, due to the sensitivity of its occupants to utility costs. Therefore, the first pilot projects of the “clean energy neighborhood development action plans” could use PPP land leasing strategies and start from affordable CEND housing projects. UDICs, as a government-affiliated entity, should also focus more investment on clean energy neighborhood development projects. By taking advantage of the entrepreneurial behavior of the municipal government, UDICs can serve long-term role in CEND by partnering with consulting firms to form energy service companies (ESCOs).
4.3 Real Estate Property Taxation and other fiscal reforms
Property taxation is an important mechanism for both promoting energy efficiency and reducing fiscal dependence on land development. In the long run, a fully developed, national property tax system is already highly likely, leading to improved financial situations for municipal governments. A flexible tax rate based on market value will best serve CEND, as energy efficiency could gradually gain value in the real estate market, creating a positive feedback loop for municipal revenues and an incentive for bureaucrats to better levy property tax. Property tax can fundamentally change the local government’s fiscal structure and also empower local governments’ institutional capacity for clean energy neighborhood development. Along with our recommendation to support the new residential property tax system, we discuss the potential use for resident property tax revenue as well as the strategies for levying property tax to more effectively address CEND. 55 Proposal for public-private corporation on affordable housing construction: http://cppcc.people.com.cn/GB/71578/17770527.html (Chinese website)
4 - 23
First and foremost, property tax revenues can begin to replace land lease revenues and alleviate the pressure on local administrators to release land for urban development. If, for example, half of the national land lease revenues of 1.6 trillion RMB in 200956 were to be replaced by taxes on the approximately 20 billion square meters of existing urban residential construction,57 a 40 RMB per square meter or 1% tax-on-value property tax scheme would have satisfied this revenue requirement. Though it is still not clear how property tax affects local government’s fiscal structure in Shanghai and Chongqing, tax revenue will certainly increase as the tax scope expands.
Second, for both newly built and existing properties, we propose a performance-based tax rebate. For newly built properties, residential property tax instruments can be used to incentivize developers and residents to build and purchase CEND. Tax rebates could effectively serve as a subsidy for developers who elect to conform to the NEPS. In order to engage in land development, developers must now pay business tax, urban construction tax, education surcharge, land tax, stamp duty, corporate income tax, personal income tax and deed tax, among other fees. All of these taxes are one-time charges, and there are no tax returns contingents upon actual energy performance. Even these taxes are ties with energy indicators, it would not a strong enough incentive for developers and residents to keep a good energy performance record in the future. Therefore, it will be a great incentive for developers to initiate CEND if the tax returns are dependent on energy performance: property tax rebates should occur periodically for homeowners, based on actual and sustained improvements in energy performance to ensure neighborhoods continue to support energy efficient lifestyles. Similarly, for existing residential properties, the property tax rate can be determined in part by its energy performance, based on energy audits. Residents can be incentivized to maintain lower energy consumption, and may even be incentivized to opt for a neighborhood retrofit. Residential property tax-based incentives still may not be able to guarantee the financial success of CEND. For instance, in developing areas, local governments may not be able to collect enough residential property tax to compensate for the lost land lease revenue. while could not get back the same amount of revenue from residential property tax.
Therefore, we also suggest that the current tax shares between local and central government—split at 50% for each level—should be refined to give municipal government more fiscal power for supporting CEND and to fill the already wide gap between municipal costs and revenues for urban infrastructure. Moreover, the central government should provide more fiscal support to clean energy neighborhood development by central fiscal transfer. UDIC, as a government affiliated institute also has the potential to carry out more CEND projects, especially CEND-affordable projects. Another way to use property tax revenues is to support CEND affordable housing construction. Piloting several CEND affordable housing projects would be a useful starting point for demonstrating the benefits of the new tax. Property taxes can also be used to directly support retrofit projects such as EERERB. 56 http://english.caixin.com/2010-02-20/100118104.html 57 http://www.rba.gov.au/publications/rdp/2012/pdf/rdp2012-04.pdf, http://www.eiu.com/Handlers/WhitepaperHandler.ashx?fi=Building_Rome_in_a_day_WEB_Updated.pdf&mode=wp&campaignid=china_realestate_wp

4 - 24
5. Market Transformation Strategies
Next, we have been using the Energy Proforma to determine the feasibility of two market transformation strategies—a system of neighborhood energy labeling and an emissions trading scheme (ETS) that incorporates neighborhood carbon credits—which would both encourage markets to properly value energy efficiency. The labeling and disclosure system would provide a platform on which government, developers, and homebuyers could review, share, and compare the energy performance information of different neighborhoods. Expanding China’s pilot carbon trading markets to include neighborhood energy efficiency credits or certificates would also provide long-term incentives for both municipal governments and developers to implement CEND projects while contributing to greenhouse gas emissions control. In the following sections, we discuss the context for neighborhood energy accounting and disclosure in Chinese cities, lessons from U.S. cities’ experiences with building energy disclosure, and the subsequent opportunity for carbon market modifications that confidence in and transparency of neighborhood energy accounting could present.
5.1 Institutional context for energy disclosure and carbon trading
The 11th Five-Year Plan for the national economy and social development clearly established energy savings as one of China’s national strategies, requiring an energy intensity58 reduction of 20% compared with energy intensity levels at the end of the 10th Five-Year Plan. To carry out this plan, a consortium of agencies including the NDRC, State Energy Leading Group Office (SELGO) and the National Statistics Bureau instituted the first national energy accounting system in order to track the GDP energy consumption index.59
Compared with these steps towards managing energy intensity in the industrial sector, neither the central government nor Chinese cities have considered implementing a broad labeling and disclosure system for the commercial or residential sectors. It is important to note, however, that China has established legislative support for the disclosure of certain building energy efficiency data: Article 36 of the Energy Conservation Law of China already requires developers to disclose the energy efficiency characteristics of a new apartment to the homebuyer.60 The “public notice on energy conservation information for civil buildings,” issued by MOHURD in 2008, laid out more detailed steps to disclose energy saving measures of real estate projects to the public.61 According to this notice, the information in the contract, quality certificate, and operation instructions must explain the approaches the developer has taken to building energy efficiency and the building insulation warranty. Neither the law nor MOHURD’s implementation
58 Energy consumption per unit GDP 59 “Suggestions on the 11th Five-Year Plan from the Communist Party’s Central Committee”, 中共中央关于制定国
民经济和社会发展第十一个五年规划的建议, http://app.dbw.cn/hljgov/sn_298598.shtml 60 “Law of the People’s Republic of China on Conserving Energy”, NPC - 2007 – 中华人民共和国节约能源法 61 “The public disclosure of energy saving information for residential buildings”, 住房城乡建设部关于印发《民用建
筑节能信息公示办法》的通知建科〔2008〕116 号, http://www.gov.cn/gongbao/content/2008/content_1175826.htm

4 - 25
requirements appear to have had any effect on disclosure practices or on public awareness of energy efficiency.62 The implementation of this law may not be that sound. Feng Yan-ping observed that because of a higher initial cost for energy efficient buildings, developers tend to construct buildings that simply meet the mandatory codes, and the public has little education or incentive for looking beyond the initial construction.63 In China’s sellers’ market, there is even a lack of understanding of basic residential building costs among developers, homebuyers, and government.
At the local level, official attempts to mandate energy disclosure in China have only focused on closed platforms for building-level information exchange between the government and developers. Shanghai, for example, has started to build such an energy information platform. The municipal government has been collecting energy usage data from commercial buildings in Shanghai, according to the requirements of the Five-Year Plan. The Shanghai Commission of Construction and Transportation intends to analyze these data in order to make better energy efficiency policies.64 Such an energy data collection initiative raises questions, including: who should have access to the energy use information? What quality of information is it? How can local governments influence energy efficiency through better data? Even with better data and national legislation, will the lack of knowledge among stakeholders prevent progress in urban energy efficiency?
The experiences of several large cities in the United States, including New York, Seattle, and San Francisco, provide useful roadmaps and lessons for the path towards energy use disclosure in for China’s neighborhoods. Each of these cities publishes different mandatory requirements for building energy disclosure and benchmarking in the private sector.65 According to Pogue and Ellis, the growing effectiveness of these cities’ energy benchmarking programs stems from not only the mandatory requirements, but also the availability of standardized energy accounting tools, active outreach and education provided by the municipal government, and the cooperation of utility companies. The U.S. Environmental Protection Agency (EPA) created an openly available online tool, the Portfolio Manager, which allows property owners to analyze the energy and water consumption of buildings, and provides a comparative metric of their energy efficiency in relation to other buildings in the EPA database. In its Local Law 84, issued in December 2009, the New York City government mandated that owners of large buildings of all property types, including multifamily buildings due to their large share of citywide energy use,66 must enter their building’s energy consumption data into the Portfolio Manager platform. By the end of 2011, 75% of the mandated buildings had complied with the
62 We are still searching for documentation of the effects of the residential energy efficiency disclosure law. 63 Feng Yan-ping, Wu Yong & Liu Chang-bin. 2009. “Energy-efficiency supervision systems for energy management in large public buildings: necessary choice for China.” Paragraph 12. 64 Qiang Xu et al, 2011, “The Construction of energy conserving information platform in Shanghai”, 上海市建筑节
能信息平台建设 65 Pogue and Ellis, 2012, “Lessons Learned from the Implementation of Rating and Disclosure policies in US cities”. 2012 ACEEE Summer Study on Energy Efficiency in Buildings. http://www.imt.org/resources/detail/lessons-learned-from-the-implementation-of-rating-and-disclosure-policies-i 66 Almost half the energy use and 60% of the carbon emissions from large buildings in New York City
4 - 26
disclosure law.67 To achieve this participation rate, New York City used mail and e-mail notification campaigns and worked with the Association for Energy Affordability (AEA) and EPA to develop a Portfolio Manager training program specific to the requirements of Local Law 84.68 Although the local legislation does not require utilities to assist customers with collecting energy consumption data, the government was able to engage with ConED and National Grid to provide aggregated, whole-building energy and natural gas consumption data in electronic format to building owners. Energy data acquisition in Seattle is much easier: the state already legislated requirements for investor-owned utilities to maintain customer data records in a format compatible with Portfolio Manager. San Francisco, however, has encountered data confidentiality barriers, due to state laws, which have precluded its local energy benchmarking legislation. In sum, these U.S. municipal-level experiences with legislative support, energy reporting tools, and local utility partnerships for energy disclosure programs provide key lessons to consider while structuring similar programs in China, where the neighborhood development is an analogous unit to the large building in the U.S. for energy management.
Voluntary labeling through green building rating systems may become a stepping stone to wider energy benchmarking, both in China and internationally. Although these labeling systems—MPG for Homes, LEED, or the MOHURD 3-Star Standard—have certain shortcomings such as focusing primarily on the building scale and not sufficiently accounting for tenant behavior, these programs are becoming increasingly rigorous in their energy performance and monitoring requirements. The MOHURD “3-Star” Chinese Green Building Label Standard, which is very similar to the LEED building labeling system, has yet to expand to neighborhood scale considerations in the same way that LEED for Neighborhood Developments (LEED-ND) has. Technical requirements for construction take up much of the weight in the evaluation process for MOHURD 3-Star.
The 11th Five-Year Plan put industrial energy efficiency in a central position on the policy map, and the 12th Five-Year Plan added carbon trading as an important strategy for grappling with industrial emissions, especially in the pilot cities that now host China’s first forays into organizing carbon trading markets. The Beijing Environment Exchange has developed and applied the Panda Standard for carbon trading; the Tianjin Climate Exchange has initiated voluntary GHG reductions in that city; Shanghai has taken advantage of the World EXPO 2010 to develop a voluntary trading platform; and Chongqing, which was the first municipality to use the innovation of “land tickets” to encourage land resources protection, is now applying the concept to “carbon tickets” for an emissions trading scheme. There are 5 pilot low-carbon provinces (Guangdong, Liaoning, Hubei, Shaanxi, and Yunnan) and 6 low-carbon cities (Beijing, Chongqing, Shanghai, Tianjin, Shenzhen, and Xiamen) with regional carbon markets.
67 Beber, Hilary, 2012, (New York City Mayor’s Office of Long-Term Planning and Sustainability). Personal communication. February 12. 68 Pogue and Ellis, 2012, “Lessons Learned from the Implementation of Rating and Disclosure Policies in US Cities”, http://www.imt.org/resources/detail/lessons-learned-from-the-implementation-of-rating-and-disclosure-policies-i
4 - 27
When the climate department of the NDRC published the first cohort of pilot low-carbon provinces and cities on July 2010,69 it was also the first time that China began to incorporate carbon emissions control into municipal agendas. According to the NDRC’s requirements, the selected pilot provinces and cities will incorporate climate change mitigation strategies into their local 12th Five-Year Plans and will formulate specific low-carbon development plans, including the following areas:
1. Developing low-carbon urban planning that incorporates structural changes in the local economy, low-carbon energy mixes, and energy conservation considerations
2. Establishing low-carbon policies to encourage energy conservation and renewable energy
3. Accelerating innovation and R&D for low-carbon industries 4. Establishing GHG emission database and management systems 5. Encouraging green lifestyles changes
Some of these objectives may be achieved through a carbon-trading center, which the NDRC describes as a comprehensive system that can embrace most of these requirements while staying beneficial to all the players.70 Nearly 100 other cities in China, including Guangyuan, Dezhou, Ningbo, and Wuxi, have volunteered to be part of the NDRC low-carbon cities program.71 After NDRC’s second round of adopting low-carbon cities for its program,72 nearly half of cities in China have demonstrated interest in the concept and are trying to incorporate these objectives into their local plans.
Carbon trading systems define the carbon emissions as a product for trading. Since this concept is quite new to China’s cities, there are no uniformed requirements from the central government to the local municipal building of the system. Whether through the pilot regional carbon markets or the low-carbon cities program, the initial phase of carbon trading in China is focusing solely on developing a cap-and-trade system, in which volunteer industries can exchange carbon emissions credits with each other. Guangzhou, for example, currently uses voluntary or verified emissions reductions (VER) as the carbon trading products.73 Zhang and Chen suggest that in the initial stages, developing carbon credits domestically will benefit China.74
69 “Notice on getting the first batch of constructing low-carbon cities”, NDRC- 2010 - 关于开展低碳省区和低碳城
市试点工作的通知(发改气候[2010]1587 号),http://www.sdpc.gov.cn/zcfb/zcfbtz/2010tz/t20100810_365264.htm 70 “Notice on carrying out low carbon emission provinces and cities”, NDRC- 2010 - 关于开展低碳省区和低碳城
市试点工作的通知(发改气候[2010]1587 号), http://www.sdpc.gov.cn/zcfb/zcfbtz/2010tz/t20100810_365264.htm 71 “Wang Erde, The popularity and dilemma of constructing low-carbon cities in China”, 中国低碳城市建设热潮与困
境 http://www.goethe.de/ins/cn/lp/kul/mag/dis/nach/zh9777931.htm 72 “Notice on getting second batch of constructing low-carbon cities”, NDRC – 2012 – 我委印发关于开展第二批国家
低碳省区和低碳城市试点工作的通知 http://www.sdpc.gov.cn/gzdt/t20121205_517506.htm 73 “Guangzhou Carbon Emission trading center finished a trade of nearly 2000t carbon credits”,广州碳排放权交易
所完成近 2000 吨自愿碳减排交易, http://news.xinhuanet.com/fortune/2013-06/21/c_116242106.htm 74 Zhang Ru, “The innovated carbon ticket trading market in Chongqing”, P2, 张瑞 - 2012 - 创新重庆“碳票”模式
碳交易市场, http://www.cqvip.com/qk/84436A/201210/43575004.html

4 - 28
Internationally, existing implementations of carbon trading systems offer more potential avenues for China’s next phases of ETS development, which would more readily accommodate low-carbon neighborhoods as a source of tradable credits. There are two basic types of carbon trading systems: the first is a market based on an allocated carbon quota, such as the ETS in Europe, and the other is the exchange of quantified carbon emissions based on projects like the Clean Development Mechanism (CDM). By 2011, 663 projects in China achieved almost 480 million tons of certified emissions reduction (CERs), which is 59% of the total amount of all CDM projects.75 Either system of carbon exchange can include forestry carbon sequestration, industrial carbon sources (ORNL formula), and architectural calculations (Yoichi Kaya’s carbon fix formula). The carbon source assessment can rely on IPCC and the guidance of the China Green Carbon Foundation for forestry projects76. At the macro level, either carbon caps or a carbon emission license system can provide the guarantees for the trading system. While recruiting volunteers to enroll in the trading system, the government also plays a key role by providing incentives for companies to control emissions that would otherwise be considered as an externality. Several possible incentives are: support and discounts from the government; priority in applying for national energy saving projects; priority for financial and consulting support from governmental and intermediary institute; recognition for participation in the ETS; and tax rebates and priority for governmental purchases for verified ETS participants.
In summary, the context in China for energy disclosure, transparency, and carbon trading is still in the early stages of development, a situation reflected in several aspects of the proposal below. First, regulations or laws on compulsory disclosure are not specific enough; for example, they do not adequately define what kinds of information need to be conveyed, to what customers, before what time, and to what extent. There is also no system for enforcement or penalties that would facilitate the implementation of such rules. Second, the building energy accounting system is currently only open to the government, and there is no channel for public access. Third, the carbon trading system has just been initiated. Although China has controlled many of the industrial carbon credits internationally, the domestic trading market has not yet seen many transactions, due to a series of problems such as the shortage of trading incentives, lack of a supervision agenda, and nascent trading rules.77
5.2 CEND Labeling and Disclosure System
In this section, we first describe our proposal for a neighborhood energy performance database and labeling system, then we consider the implications of realizing neighborhood-based real estate market transformation in China. In Error! Reference source not found., we outline the system of stakeholders who would participate in an energy labeling and disclosure platform, which could operate first at the local level, then become linked to provide national-level 75 Fan Wei, “It is entirely possible that CDM in China only has the last eight years”, 樊威:中国 CDM 项目的存在极
有可能仅剩最后八年,http://www.letscorp.net/archives/19660 76 Chen Demin, Tan Zhixion - 2012 – “Establishment of Regional Carbon Trading Market: A Case Study of Chongqing”, 重庆市碳交易市场构建研究 P3 77 “The carbon trading market is stagnant with few sellers”, 中国碳排交易有价无市, http://finance.sina.com.cn/chanjing/cyxw/20121214/220714010494.shtml

4 - 29
coverage and analysis of neighborhood energy performance. There are three major stakeholders: the developers, the local government and homebuyers. The energy performance and ratings database—the focus of the platform—would serve three main purposes: developers and government can use it to conduct neighborhood energy benchmarking, and homeowners can refer to the database as an information source for apartment buying and benchmarking their own energy-related behaviors compared with other neighborhood inhabitants. The energy labeling and disclosure platform is similar in concept to the real property information database that is already being developed, which we described in the context of property tax implementation. The energy platform could in fact be linked to this national property database to create a more comprehensive dataset for energy performance analysis and linking energy efficiency with property tax assessment. Although the majority of neighborhoods in the database would initially be new construction, the Energy Proforma can be used to identify energy efficiency opportunities in existing neighborhoods as well, by benchmarking existing neighborhoods against other classes of neighborhoods in the database.
Voluntary rating systems, as an established method for communicating about the sustainability of the built environment, can play a useful role in the initial phases of more rigorous energy performance labeling. As mentioned previously, none of the current labeling systems is designed for transparency of energy use on the neighborhood level, and these systems primarily focusing on the energy consumption of independent buildings within a neighborhood. The proposed energy database, in conjunction with the Energy Proforma, will track the long-term monitoring of energy performance per neighborhood, so that administrators of rating systems such as the MOHURD 3-Star system78 can use the database for both design phase assessments and post-occupancy, periodic ratings reassessments. These assessments could occur at both the building and neighborhood scale, as the ratings systems expand to include neighborhood-level sustainability factors similar to LEED-ND.
At the early stages of the platform development, it is also important to develop ways to cooperate with utility companies to obtain accurate energy use data. This cooperation, which is often very complicated in U.S. cities, could easily be mandated and facilitated by the central government in China, because all the electricity, water, and gas providers are state-owned enterprises. Both household and neighborhood-scale, aggregated energy measurements are also easy to obtain, because local utility distribution is already structured around the neighborhood or sub-neighborhood scale.
78 MOHURD - 2006 - Evaluation Standard for green Building

Figure 3
HomebupreviousgovernmProformaintegratethe enerwill grad
79 AdaptedPerforman
. Database
yers shouldly suggeste
ment lack kna and neighed in the impgy conserva
dually transit
d from Nadkarnce of Resident
framework
d also be ined that a knowledge ohborhood eplementationation laws thtion from th
ni, Nikhil, and Htial Buildings.”
k for neighb
nfluenced bkey barrier
of the impoenergy platfon pathway fohat already ehe current s
Harvey MichaeMIT Energy Ef
orhood ene
y a transpais that th
rtance of borm can heor the resideexist in Chinsellers’ mark
ls. 2012. “A Nefficiency Strate
ergy perform
arent energye public, d
building eneelp fill this ential energyna. It is alsoket in real
ew Model for Degy Project, p. 1
mance ratin
y informatiodevelopers, ergy efficien gap, particy disclosure
o entirely poestate to a
Disclosing the 14.
4
ngs79
on platformand even
ncy. The Encularly by b
e requiremenssible that Cbuyers’ ma
Energy
4 - 30
. We local
nergy being nts of China arket.

4 - 31
According to Xiao Zhao et al.,80 today’s intense housing market will cool down, since the number of overproduced residential construction has reached 300 million square meters. Many developers, such Wanke, Lücheng and Longhu, have already turned from market commodity-oriented production to a diversified product-oriented strategy. In this case, developers could then increase their competitiveness by implementing CEND. In the long term, through this platform, developers could accrue credibility by transparently conforming with the requirements of CEND.
Many clues can be found, especially in the updated energy conservation law,81 renewable energy law,82 or the latest 12th Five-Year Outline,83 that the government is gradually recognizing the significance of improving energy performance in the built environment. To change the traditional concept of construction cost for developers, and to change the traditional recognition towards buildings’ value for homebuyers, a great number of information dissemination, education, and training program such as what those US cities had done are needed. Through those courses residents would be finally transformed to take energy efficiency into account while making comparison because an energy efficient building will benefit in the long run with its network energy saving performance. Therefore they will be more motivated to ask for the demonstration of energy certification from the developers during purchases.
5.3 CEND proposal for low-carbon neighborhoods within the carbon trading markets
As the regional carbon markets mature in China, allowing neighborhood real estate projects to participate in the ETS could be a crucial step forward for low-carbon city development. Domestic carbon buyers could benefit from a source of carbon credits beyond China’s forests, and municipal governments and developers could also benefit from the revenue source of selling carbon tickets. A less ideal alternative would be to institute a “cap-and-trade” system for neighborhood developments, independent of other industrial and construction sectors, and the government would create incentives for developers to participate in the system.
The premise of engaging CEND in the newly established carbon trading systems in China is that demand for urban development is far from abating, and the associated magnitude of the potential for carbon emissions savings will also continue to rise. From 2008 to 2010, for example, residential development transactions in China totaled 2.4 billion square meters,84 which suggests that 30 million new households were added to urban areas. Going forward, if
80 Zhao Xiao, Li Huizhong, Chen Jinbao, “The six trend of real estate in China in the future”, 赵晓; 李慧忠; 陈金保,
中国房地产未来的六大趋势 http://finance.ifeng.com/stock/hybg/20130119/7577150.shtml 81 “People’s Public of China Energy Saving Law”, NPC – 2007, 中华人民共和国节约能源法
http://www.gov.cn/flfg/2007-10/28/content_788493.htm 82 “Law of Renewable Energy”, NPC - 2009 - 中华人民共和国可再生能源法(2009 年修正)
http://www.gov.cn/flfg/2009-12/26/content_1497462.htm 83 “The 12th Five-Year Plan Outline”, NPC - 2011 - 十二五规划纲, http://www.china.com.cn/policy/txt/2011-03/16/content_22156007.htm 84 2011 statistical year book of real estate in China (中国房地产统计年鉴 2011), http://ishare.iask.sina.com.cn/f/23522167.html
4 - 32
all these households inhabited clean energy neighborhoods, a conservative carbon emissions savings estimate using the Energy Proforma would reach 60 million tons of carbon equivalent (tCO2e) per year.85 This carbon emissions reduction could become even more substantial, if per-household energy consumption continues its upward trend. China will never be able to compensate for its carbon emissions reduction needs by using forest sequestration, due to the already severe shortage of arable land and other new forest sites.86 Creating carbon credits simply by constructing CEND would be a prudent long-term strategy for balancing between GHG emissions control and urban development. In fact, we have calculated that the level of avoided carbon emissions per land unit of low-carbon neighborhood development is at least an order of magnitude higher than the carbon sequestration possible in the same area of forest land.
Like industries that conform to the IPCC inspection system in Chongqing,87 it is possible that neighborhoods may also participate in the regional carbon trading system by issuing carbon tickets within this current pilot project framework. The Energy Proforma can eventually serve this role as an evaluation system, allowing neighborhoods to be “inspected,” then issue a “carbon ticket” and “sell” it to large industrial buyers. The basic steps for allowing CEND to take part in the carbon trading system (Error! Reference source not found.) would then be: 1) the government allows neighborhood developments into the regional system; 2) issuing “carbon tickets”; 3) listing in the regional trading center; 4) trading with industries; and 5) related regulations and standards. The first step requires that government and industry realize the value of neighborhood energy efficiency. The second to the fourth steps are the mechanics of how clean energy neighborhoods will participate in the system. The fifth step describes the guarantees and safeguards that must be in place for the system to function.
First, determining how a carbon trading system will function depends on the size of the market. For example, in municipalities directly under the central government, such as Beijing, Tianjin, and Shanghai, the carbon trading market is very small and cannot be an independent market from the overall environmental trading market, but in Guangdong province the market is large enough to support a complete carbon trading market. It follows that neighborhoods should be incorporated into existing carbon trading systems that have access to a large number of industries. The diversity of the participants in the market and the difference between their marginal costs for reducing carbon emissions determine the opportunity for deals.88
85 Based on the evaluation of energy proforma, each household in a clean energy neighborhood could easily reduce its carbon emissions by 2 tons per year. 86 Kang Kaili, “Research on China’s Carbon Sink Forestry Development based on the Regional Forest Carbon Sink Capacity”,康凯丽-2012-基于区域森林碳汇能力的我国碳汇林业发展研究, http://cdmd.cnki.com.cn/Article/CDMD-10022-1012350305.htm 87 Zhang Ru, “The innovated carbon ticket trading market in Chongqing”, 张瑞 - 2012 - 创新重庆“碳票”模式碳交
易市场, http://www.cqvip.com/qk/84436A/201210/43575004.html 88 Zhang Ru, “The innovated carbon ticket trading market in Chongqing”, P2, 张瑞 - 2012 - 创新重庆“碳票”模式
碳交易市场, http://www.cqvip.com/qk/84436A/201210/43575004.html

4 - 33
Next, like the “carbon tickets” of Chongqing, the way in which neighborhood energy efficiency certificates can be incorporated into the existing system is similar to the carbon sequestration credits of a local forest resources administration. A government agency for a specific locality, such as a “City Commission of Neighborhoods,” plays the role of coordinator for future trading with independent neighborhood developers in the area. With the help of the NEPS and technical tools such as the Energy Proforma, this agency is in charge of consulting, examining the energy efficiency of applicants, and calculating how much carbon emissions savings the neighborhood can achieve through CEND design and new building technology. The ex ante estimation of carbon credits through a trusted system could also enable the developer to acquire better financing for CEND before construction. The Commission could then represent the municipal unit in charge of a residential development zone, quasi-governmental land developer, or neighborhood developer to submit requirements for recognition to the regional certificate and inspection institute, such as a “Regional Clean Energy Neighborhood Certificate Center.”
Once the application is approved, the commission would be granted a certain amount of “Carbon Emissions Credits” for selling. These credits would be estimated at the beginning of a market exchange term (i.e. at the beginning of a year) and then the actual energy performance of the neighborhood would be evaluated and verified at the end of the term in order to complete the transaction. In this case, the Commission becomes a supplier in the trading system by collecting scattered clean energy neighborhood development tCO2e savings. The Commission has the rights to require the Carbon Trading Center to list the carbon trading credits. Since the Trading Center or local Environmental Exchange Center can cover a larger area, many different agencies from different cities or towns can enter into the market to form the pool of suppliers.
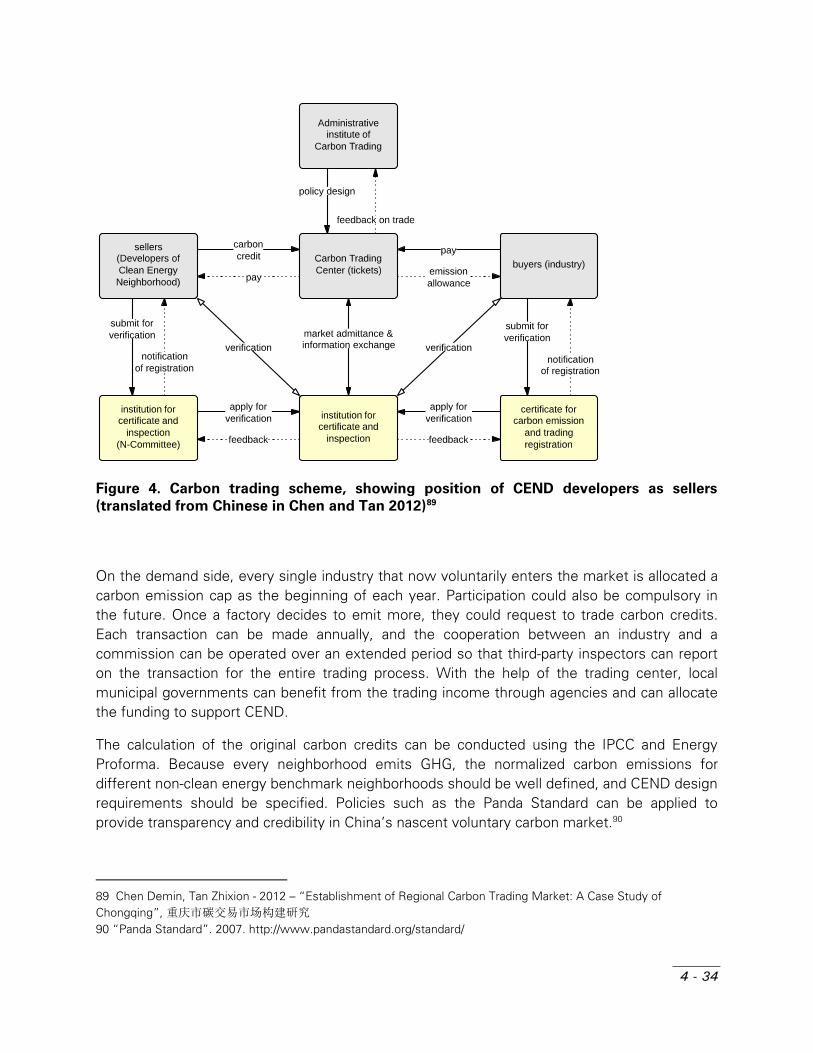
4 - 34
Figure 4. Carbon trading scheme, showing position of CEND developers as sellers (translated from Chinese in Chen and Tan 2012)89
On the demand side, every single industry that now voluntarily enters the market is allocated a carbon emission cap as the beginning of each year. Participation could also be compulsory in the future. Once a factory decides to emit more, they could request to trade carbon credits. Each transaction can be made annually, and the cooperation between an industry and a commission can be operated over an extended period so that third-party inspectors can report on the transaction for the entire trading process. With the help of the trading center, local municipal governments can bene�t from the trading income through agencies and can allocate the funding to support CEND.
The calculation of the original carbon credits can be conducted using the IPCC and Energy Proforma. Because every neighborhood emits GHG, the normalized carbon emissions for different non-clean energy benchmark neighborhoods should be well de�ned, and CEND design requirements should be speci�ed. Policies such as the Panda Standard can be applied to provide transparency and credibility in China’s nascent voluntary carbon market.90
89 Chen Demin, Tan Zhixion - 2012 – “Establishment of Regional Carbon Trading Market: A Case Study of Chongqing”, 重庆市碳交易市场构建研究 90 “Panda Standard”. 2007. http://www.pandastandard.org/standard/

4 - 35
6. Integrating the Policy Approaches In the final section of this report, we bring together the range of policy recommendations to show how a clean energy development-oriented process might play out at the local urban development level. As a conclusion, we then outline a larger agenda for incorporating CEND into the national low-carbon development program.
6.1 The Neighborhood Development Process after CEND
We present a future scenario for a typical, growing, second-tier urban administrative area in northern China, in which a new large-scale neighborhood area is about to be released for development. Before the Ministry of Land and Resources (MLR) and local land bureau releases a developable land allocation, the Ministry will require that the city government submit a Neighborhood Energy Plan to the land bureau. This concept CEND plan includes district energy resources, integrated transport and services, basic parcel size and density parameters, expectations for parcel developers, and an incremental upgrading plan. The incremental upgrading plan also enables future owners to access the benefits of future technological change and protecting against the effects of climate change. The Energy Proforma forms the basis for determining the parcel density and use gradients across the site, in addition to accessibility and transport requirements.
The city or district government then forms an Urban Development Investment Corporation (UDIC) to manage the infrastructure planning and land leasing. In the current system, this land developer would be maximizing the land parcel values while minimizing its level of infrastructure investment, and at the same time approaching developers that would be amenable to the least-cost approach to residential development. In the NEPS system, these developers would have to undergo training and receive approval from the province-level CEND agency to participate in the project. Any other officials who will be in charge of the new district, in addition to the UDIC staff, must be qualified for leading a CEND development by passing the training sessions.
By formulating a plan to stay on track to reach the yearly CEND target, the local NDRC has also applied to become part of the national program for pilot low-carbon cities. The national NDRC has already established a concrete evaluation system to ensure pilot cities achieve quantifiable carbon reduction goals in the long term, and the local office is responsible for coordinating with the new district’s officials to achieve these goals. The city has also included targets for the construction of CEND into its local Five-Year Plan, which form the basis for its application for the “clean energy city” title that is reevaluated every five years.
Strategic planning begins. The UDIC, in conjunction with a local planning institute, starts laying out the new neighborhood by consulting the simple, direct guidelines for CEND in a Neighborhood Energy Performance Policy handbook. In the regulatory planning phase, the
4 - 36
UDIC forms an interdisciplinary consulting team to conduct integrated land use and density, transportation, and energy supply planning. In this phase as well as the detailed design phase, consultant teams must also include accredited CEND professionals, similar to the LEED accreditation system. The CEND parameters for the regulatory plan are optimized in conjunction with the financial Energy Proforma model, in order to iteratively assess the distribution of costs and potential revenue streams to all project participants. In the regulatory plan approval process, the CEND parameters are reviewed by the local and provincial oversight agencies, including: NEPS (maximum energy and carbon equivalent standards) for each parcel, minimum FAR, distributed green space, rights-of-way, street hierarchy, and transportation access.
For public infrastructure and services, the UDIC takes advantage of the Bureau of Finance and commercial bank’s “green loan” program. These loans account for part of the public investment, while “green bonds” account for another portion. Local infrastructure fees for advanced systems would also be included in the project revenue projections, so local revenue through the UDIC is extended from one to four revenue sources: energy efficiency paybacks, infrastructure fees, property taxes, and land leases. Not only does the new district qualify for the low-carbon cities program, but the UDIC can also cooperate with the regional “neighborhood efficiency carbon credits” representative to determine potential revenues from the first round of CEND carbon ticket sales to nearby industries.
The land leases then include the neighborhood energy performance standard (NEPS) for every parcel. The developers who are bidding on most of the parcels will be evaluated and selected based on their plan’s energy performance, but some of the parcels are participating in a special negotiated lease program that provides for a long-term partnership with the UDIC. The bidding process, however, can enhance these development agendas through competitive project evaluation. Each developer accepts the additional CEND criteria in the regulatory plan by entering a bid, and their schematic plan proposal highlights the energy performance features of the project and a more advanced target for the NEPS, in both near- and long-term evaluations, coupled with affordability for the target market.
Another consortium of developers forms PPPs with the land developer, in order to balance development expectations across the site and design cohesive form-energy systems across parcels. The land developer then gains access to long-term financing for energy efficiency and becomes a type of Energy Service Company (ESCO) in exchange for future revenues based on energy savings. In this phase, private developers can also use their commitment to NEPS regulations to approach banks for preferential financing. Therefore, the government still does not directly subsidize the land for CEND as it would for affordable housing. Additional incentives for the developer are included in the land lease, including a higher FAR allowance and lower insolation interval requirement, in exchange for meeting more costly CEND requirements.
Each developer inputs its preliminary neighborhood plans, used for both bidding and the negotiated agreements during the land leasing process, into the online CEND tracking platform, which is hosted by the planning bureau. This platform automatically registers the estimated energy performance of the planned neighborhoods, using the Energy Proforma. The
4 - 37
developer’s design team then takes over management of the energy performance reporting, while the developer can monitor the financial impacts of the CEND components of the project, using the lifecycle cost analysis dashboard in the Proforma. This design team has already obtained its CEND accreditation, according to the requirements of the land lease. After the planning bureau has reviewed and approved both the construction documents and the energy performance estimate, the developer begins construction. Through the UDIC, the developer also applies for MOF funding for the CEND program, which is paid in partial installments throughout the construction phase.
The transparency of these energy evaluations is essential in each phase of the development project. Initial energy performance targets become part of the city's land management database from the beginning, and in the regulatory plan approval process, the planning bureau publishes both per-parcel and development-wide NEPS indicators for public comment. By inserting these estimated performance metrics into the neighborhood energy database via the Energy Proforma, the new neighborhood development is viewed in a comparative perspective with other existing and future developments. Then, by connecting this energy database to real estate pricing databases, the larger real estate market begins to respond to the entry of more energy efficient developments. After the project is completed and the project’s CEND features have been verified, the officials also receive publicly verified civil servant points for their CEND achievement.
Part of the initial agreement between the UDIC and parcel developers is the implementation of a neighborhood energy monitoring and evaluation system. Developers cannot receive the local and national subsidies until they submit two years of performance evaluations, in accordance with the current building rating systems that would be extended to neighborhood planning. This neighborhood performance information is evaluated against the local “typical neighborhood” benchmarks in the Energy Proforma. As the overall energy performance of the city's neighborhood stock increases, the standards for yearly evaluation also increase by making the “typical neighborhood” performance standards more stringent, similar to the escalating goals of the building energy efficiency program.
The CEND inspection department of the local planning bureau designates the team in charge of monitoring the CEND. After the neighborhood has been monitored for two years, the local government releases the tax discount to the developers, which the central government had disbursed to the municipality. The developer then also receives CEND credits that count toward preferential selection in future development projects. But if the developer doesn’t reach the NEPS, they lose CEND credits and do not receive the tax subsidies; in extreme situations, the developer may have to pay a fine.
For the homeowners, their initial purchase tax is not subsidized, but they have approached the banks with the development’s CEND approval to secure “green loans,” which subsidize loan payments. The central government funds these green loan subsidy pools. Homeowners also pay subsidized property taxes to the municipality, which are in part remitted to the central government. These tax subsidies are linked to the performance of their neighborhood, and will cease if the neighborhood no long conforms to CEND standards.
4 - 38
6.2 Expanding the benefits of clean energy development: a national view
The implications of incorporating energy efficiency measures and distributed renewable energy technologies at the neighborhood level are wide-ranging for the sustainability agenda in countries that must cope with rapid urbanization. In China alone, city governments and developers must plan to house 350 million new urban residents over the next 20 years—the equivalent of 30,000 new neighborhood units in current housing practice. As China’s cities face an increasing demand for energy in both new developments and the growth of individual energy consumption, enforcing neighborhood-level design regulations alone could reduce these growing energy needs by 15% to 30%.91
The neighborhood energy performance standard, in conjunction with rapid energy assessment using the Energy Proforma, also opens up a range of opportunities to policymakers for incorporating energy efficiency goals into larger programs for urban public finance, governance, and managing the real estate market. The following ten strategies, which serve as a summary of our main proposals as well as the supporting strategies outlined in the neighborhood development scenario above, can create a comprehensive environment of national support for CEND. The Energy Proforma can fit naturally within China’s existing pilot project activities and the future scaling-up process for a nationwide deployment of energy- and carbon-saving urban forms.
A neighborhood energy performance database should be instituted at the national level. Systematic data collection and sharing is needed to expand the application of energy calculation tools, in addition to enabling competition between cities and developers, greater consumer awareness, and better national policymaking. Building on this neighborhood energy database, the neighborhood energy labeling and disclosure platform is essential for developing awareness of energy performance in the real estate market. An information exchange platform, covering the range of criteria for neighborhood energy performance, is needed for transparent exchange among government, homebuyers, and developers and for establishing clean energy developer credits on which the price of land leasing and housing could rely. The information disclosure aspect of this platform would be enforceable through Article No. 36 of the China Energy Conservation Law,92 as we suggested in the policy approach description.
China’s building ratings systems, such as MOHURD 3-Star, should be expanded to include CEND strategies, in a progression similar to LEED’s extension from individual buildings to neighborhood developments. These regulations should not only enforce design requirements for CEND, but should also contain legally-binding standards for management and monitoring of neighborhood-level energy use. Low-carbon city pilot projects can adopt these standards immediately. A training and accreditation program is an important companion to these CEND ratings systems. A nationally uniform and continuous low carbon program management-training curriculum must be developed for
91 MIT, and Tsinghua. 2012. “Making the Clean Energy City in China.” http://energyproforma.scripts.mit.edu/documents/MIT_Clean_Energy_City_Year_2_Report_web.pdf. 92 NPC - 2007 - 中华人民共和国节约能源法

4 - 39
pilot administrators, and subsequently all development participants, to ensure that all CEND projects are successfully implementing and sharing best practices. This training and accreditation system should encompass all stakeholders in neighborhood development, including designers, contractors, developers, property managers, and administrators.
Neighborhood carbon savings, in comparison to benchmark neighborhoods, should count towards carbon reduction targets at the city level, so that city administrators can demonstrate the effectiveness of local energy efficiency initiatives to the provincial and the central government. These neighborhood performance metrics should be incorporated into the civil servant evaluation system, which in the near future should shift towards transparent, quantifiable, and verifiable indicators overall. Green GDP and industrial energy intensity measures should be accompanied by energy performance indicators in the residential sector, for officials overseeing development projects.
Incentives and penalties for developers, including reforms of the land leasing system, should be linked to energy performance. Tax credits, supported by the Energy Conservation Law, as well as FAR bonuses and other development allowances can all support development agreements that incorporate CEND.
When the property tax system is implemented, municipalities should earmark tax revenues for CEND infrastructure support. Homeowner property tax rebates may also be linked to energy performance.
Adopting a common system for measuring neighborhood energy performance also enables municipalities and developers to participate in carbon-trading schemes, in which municipalities can trade carbon credits to industries and other energy-intensive construction sectors in order to receive funding for CEND.
The NEPS can also guide neighborhood retrofit programs, as the homeowners in contemporary superblocks contend with changing lifestyles and resource scarcity.
Neighborhood energy assessments can demonstrate how the actions of policy makers, real estate developers, and residential consumers combine into neighborhood forms that influence and perpetuate specific energy use patterns. To effectively manage the impacts of urbanization on China’s low carbon development, we must conceive of policies that treat neighborhoods as energy systems that are critical to the energy performance of the built ecosystem as a whole. Cities must also be incentivized through these policies to engage in true low-carbon development; under the current system, there is little incentive for local governments to expand CEND beyond their token “eco-district” pilot projects. New pilot projects and policies must also demonstrate how the costs and benefits of CEND can be balanced between government, private developers, and homeowners. Policies that regulate, monitor, and manage neighborhood-level energy consumption should mitigate an increasing set of challenges in China: how to better manage depleting reserves of material, land, and financial resources for urban development, how to mobilize regional players in achieving larger carbon intensity reduction goals, and how to measure the outcomes for both policy evaluation and international climate negotiations.
5
IMENNEIN Cases Shenzh
J. Cressi
PLENEREIG
CHof Residehen
ica Brazier
EMERGYHBO
HINAential Pla
ENTY-EORHA anning Re
TINGFFICHO
egulation
G CIEOD
n and Pra
ENTD FO
actice in J
T ORM
Jinan an
M
nd
5 - 1
5
IMPLEMENTING ENERGY-EFFICIENT NEIGHBORHOOD FORM IN CHINA Cases of Residential Planning Regulation and Practice in Jinan and Shenzhen
J. Cressica Brazier
Abstract
In this paper, I investigate the barriers and opportunities for guiding planning codes and real estate practices towards more energy-efficient forms of residential development in China. I focus on the role of the urban planning bureau in shaping these developments, by tracing the bureaus’ regulatory control and decision making surrounding three key design variables related to energy efficiency in neighborhood form: road network density, building density within the neighborhood, and neighborhood use mix. I propose that, to effect systematic change in the built outcome, the urban planning bureau in each city can undergo a three-stage implementation process of pilot projects, qualitative guidelines, and performance-based standards. By contrasting the cases of residential planning in Jinan and Shenzhen, I define two very different points on the spectrum of planning policy innovation in China’s cities: Shenzhen’s urban planning bureau has developed a more systematic code revision process, reflecting its unique stage of physical and administrative development, while the Jinan urban planning bureau, which is more dependent on the leadership of individual directors and has not established a clear code revision process, is less likely than Shenzhen to lead development

5 - 2
towards a widespread implementation of more energy-efficient form. The first step of my analysis establishes the evolving official capacity of the planning bureaus to influence the developers’ neighborhood plans, by comparing versions of each municipality’s residential planning codes from 2003 to 2011. Through in-depth interviews, I then contrast the bureaus’ official capacities with their current practices for regulating and negotiating with developers; I also interviewed government officials, developers, and the design firms that act as representatives of the developers to the planning bureau. I assess the resulting residential developments in a zone of each city, to evaluate the effectiveness of planning policies in controlling the developers’ conformance to the three indicators of road network density, building density, and use mix. I then use the observations from the current planning context to propose and evaluate the potential effectiveness of several mechanisms for regulating and incentivizing developers to follow energy efficiency strategies.
Table of Contents
1 Introduction: Neighborhood Form as an Energy Efficiency Frontier in China 3
2 The Urban Planning Bureau within the ‘City-Making’ Institutions of China 7 2.1 Constraints on the Regulations and Practices of the Urban Planning Bureau 7 2.2 Control and Innovation in Development 10
3 Methodology 12 3.1 Variables: Design Codes, Practices, and Built Form Outcomes 12 3.2 Case Study Design 14 3.3 Data Sources and Analysis 16
4 Tracing the Impact of Design Regulations and Practice on Neighborhood Form 19 4.1 Road network density 19 4.2 Building Density and Floor-Area Ratio 21 4.3 Neighborhood Use Mix 25
5 Guiding Design Codes and Practice toward Energy-Efficient Form Outcomes 31 5.1 Pilot Projects 32 5.2 Prescriptive Standards and Guidelines 33 5.3 Performance Standards 34 5.4 Conclusion 35
6 Appendix 37 6.1 Interview List 37 6.2 Bibliography 38
5 - 3
1 Introduction: Neighborhood Form as an Energy Efficiency Frontier in China
China’s cities face a growing demand for energy, due to increasing individual energy consumption as well as new development. Residential energy use is now second only to the industrial sector’s energy consumption (Bressand 2007), and urban energy demand may double by 2025 (Woetzel 2008). The National Development and Reform Commission (NDRC), the central government body managing macroeconomic policy, has responded to this challenge with pilot programs for new energy resources and mandates for energy conservation in residential buildings. In contrast to these ambitious energy policies and implementation plans at the national level, urban planning agencies at the local level currently do not play a role in energy planning and therefore receive little guidance for developing local carbon reduction plans (Zheng 2011). City administrators and real estate developers also possess limited knowledge of the relationship between energy consumption and neighborhood form, and no standard exists for achieving energy efficiency at a wider scale than the individual building (MIT and Tsinghua 2012). However, recent research by MIT and Tsinghua University has demonstrated that neighborhood form can have a measurable impact on energy consumption, and that modifications to certain neighborhood form variables, such as building density and road network density, can produce more energy-efficient residential buildings, neighborhood plans, and transportation environments (MIT and Tsinghua 2012).
The dominant residential housing model in China, 'towers-in-the-park’ superblock housing, exhibits both benefits and major deficiencies for achieving greater energy efficiency through neighborhood planning and design. This standardized unit of neighborhood development is, on average, relatively more dense than its predecessor, the residential compound consisting of six-story slab buildings: in Jinan, the average floor-area ratio (FAR) of the sample of contemporary superblocks is 2.1, compared to an average FAR of 1.7 for earlier mid-rise neighborhoods (MIT and Tsinghua 2012). However, both the density and spatial organization of these neighborhoods still present a clear margin for improvement, as even higher densities than the current superblock housing are more strongly related to lower energy consumption. In contrast, only 15% of the area of developable land in the central district of Shenzhen, which has experienced at least two waves of redevelopment, contained developments with FAR of less than 2.0 (Zhu 2004, 439). Low-density road networks and an emphasis on parking provisions are key contributors to the high transportation energy consumption of residents in new superblock developments. Superblocks also lack flexibility in spatial programming, as setback requirements, limitations on public access, and reduced perimeter commercial facilities often contribute to the minimal mix of building uses in these neighborhoods.
All levels of government, urban planning bureaus, developers, and the homebuyer market have a stake in these residential development practices that Qiu Baoxing, vice-minister of the Ministry of Housing and Urban Rural Development (MOHURD), has criticized as producing “a thousand cities having the same appearance” (Watts 2007). City administrators view large-
5 - 4
scale residential development as an optimized equation between the municipal fiscal capacity to construct and maintain infrastructure, and private investment in and provision of housing and supporting services. Real estate developers have become locked into this model of commercialized housing through a general consensus on its efficiency of land use, saleable housing area, and construction methods. The gated superblock is also a reflection of socio-cultural norms in residential organization, desires for modern lifestyles, and mechanisms for state control in pursuit of social stability (Tomba 2010). All of these frames of interpretation of the superblock housing model contain implications for energy consumption. The contributions of social systems, land and housing markets, and public infrastructure need to be more cohesively described in terms of tradeoffs between energy efficiency and other values, from land use and construction efficiency to profit motives, in addition to the consequences for the quality of life within these residential spaces.
This study focuses on the role of urban planners and designers within this larger system of superblock housing production, a system that currently constrains the design flexibility that could lead to more energy-efficient built form outcomes. The urban planning bureau imagines its role in residential development as upholding a design code that implicitly balances between state and private interests (Tang 2010), and the towers-in-the-park superblock model is the unquestioned outcome of those codes. If energy efficiency is introduced into the physical
planning agenda, in what ways can current practices and policies be adjusted to
implement more energy-efficient residential neighborhood forms?
City administrations and planning bureaus employ a range of policy instruments to promote development objectives and regulate the outcome of real estate projects: local modifications to national urban planning and building codes, direct planning support and subsidies for marquee city projects, and publicly-announced implementation plans that signal the real estate market to new city development agendas. Normative real estate development procedures as well as local practices, including each stakeholder's objectives and capacity to influence the outcome of a neighborhood development project, may also have an important effect on the main residential planning variables that play a role in neighborhood-scale energy efficiency: road network density, building density and FAR, and neighborhood use mix (MIT and Tsinghua 2012). As the legally-responsible party for executing the comprehensive city plan and approving detailed residential development plans, the urban planning bureau may serve as an extension of the development apparatus of the local government, or as a proactive partner in a mediating role between local officials, developers, and the quality and performance of the urban environment. Depending on the local context, planning bureaus may also vary in their responsiveness to unconventional development strategies proposed by professional residential or urban design consultants, including energy efficiency advocacy groups.
Implementing energy-efficient development strategies poses a greater challenge to both regulators and developers compared with introducing energy efficiency technologies, such as building mechanical systems and insulated envelopes, and design and development strategies are thus adopted with much lower frequency than technologies (X. Zhang et al. 2012).

5 - 5
Researchers and practitioners also have a limited understanding of the impact of neighborhood form on energy consumption, and they have not established the magnitude of this impact, compared with the energy implications of building design decisions and even comprehensive urban planning. Proposals for changing the current neighborhood development model, whether for energy efficiency or other design objectives, must contend not only with the urban planning bureau’s supporting role in efficient municipal planning, but also with the politics of design that govern the practices of planning officials and developers within the Modernist, administrative city-making agenda. Pressures from local government officials who are engaged in this city-making are accompanied by the constraints imposed by developers, which include both the developer’s motives and its interpretation of homebuyer expectations. In exploring these constraints, I pay particular attention to the level of control the bureau perceives it can exert outside the ‘red line’—the line that designates the area of the developer’s land use rights—in the form of required and recommended criteria attached to each developable land parcel in the residential zone’s regulatory plan. The capacity of the professional firms executing the project is the third key external constraint to improving residential planning outcomes.
In the next section, I review the theories of China’s city-making contexts in which planning bureaus operate, the literature on development control and government-developer interactions in China, and the Chinese policy innovation process through which spatial planners are beginning to take a more proactive role in guiding development. I then analyze two cases of residential development, in Shenzhen and Jinan. The urban planning bureaus in these cities are governed by different development objectives and have assumed varying capacities and practices for regulating residential development, which I explain by comparing each city’s approach to regulating the three design variables of road network density, building density and FAR, and neighborhood use mix. These observations are based on interviews with planning officials, developers, planning institute members, and design consultants in each city.
Building on these observations of the current planning contexts in Shenzhen and Jinan, I then consider how spatial planning policy instruments and stakeholder practices can better support energy efficiency goals. To effect systematic change in built form outcomes, the urban planning bureau in each city could implement a three-stage process of pilot projects, qualitative guidelines, and performance-based standards. By evaluating the responses of planning officials and developers to these potential energy-focused policy instruments, I conclude that Jinan and Shenzhen again represent two distinct stages in the potential role of the urban planning bureau in regulating and guiding residential development towards more energy‐efficient forms. First, the pilot project process remains a necessary precondition for the formulation of local policy in both city-making contexts, whether in response to local needs or top-down policy objectives. Second, the urban planning bureaus need to better establish a system for revising prescriptive guidelines, in order for developers and administrators to accept adjustments that are not clearly explained by the national model residential code; Shenzhen has reached a systematic yet flexible procedure for developing guidelines, but standards of practice in Jinan are still dependent on the design preferences of individual leaders and are not clearly laid out in the approved urban planning guidelines. Third, although MOHURD has clearly established energy
5 - 6
efficiency performance standards at the building level—mainly because energy-efficient buildings can be achieved through formulaic construction methods—both the urban planning bureau and developers may find neighborhood energy performance standards difficult to accept within the current regulatory system. Because local government is sensitive to regulating energy consumption in residential life, in contrast to commercial and industrial operations, both MOHURD and local planning bureaus would need to gradually implement a performance standard that requires developers to demonstrate that neighborhood designs do not exceed a specified level of energy consumption. The central government may soon perceive a stronger need to reduce residential energy consumption, as the economic impacts of managing peak load through restrictions on industry alone may be too great in some provinces, and electricity costs may soon become a burden to households due to reduced subsidies (D. Feng 2010). While the familiarity of planning bureaus with their role in energy efficiency matures to the point at which central ministries could implement a residential neighborhood energy performance standard, local stakeholders can develop pilot projects and regionally appropriate design guidelines that may later be absorbed into national standards, through the process of policy experimentation.

5 - 7
2 The Urban Planning Bureau within the ‘City-Making’ Institutions of China
I first summarize the theories that attempt to explain the objectives of city administrations, developers, and design firms that are engaged in the process of ‘city-making’ in China, which form the context of constraints and opportunities for development control. I then review the international perspective on regulating development, as well as the state of development control in China. Lastly, I introduce the concept of Chinese policy experimentation that may explain the role of past residential demonstration projects and the way forward for innovation in development control.
2.1 Constraints on the Regulations and Practices of the Urban Planning Bureau
2.1.1 ‘City-making’ governments in China
Three layers of ‘city-making’ theoretically frame the motives of urban governance in China. These frameworks link the operations of Chinese urban planning institutions to the larger context of urban development and map out the forces that may constrain energy-efficient residential development from the perspective of local government. The Western formulation of entrepreneurialism in urban governance (Harvey 1989) was quickly translated into the concept of the entrepreneurial state in China (Wu 2002; Duckett 1998). During the transition from the planned to the market economy, numerous municipal departments have ‘spun-off’ for-profit businesses, especially for real estate and commercial interests (Duckett 1998). Entrepreneurial state entities, and the planning bureau by extension, are also actively engaged in inter-city competition and place promotion to attract urban growth partners (Wu 2009), including private industries and real estate developers. Urban planning operates in the service of state-led development projects, and in this function, local administrations perceive urban planning as a critical tool in maintaining state legitimacy (Abramson 2007, 68). In the absence of an ad valorem property tax system and a strong industrial tax base, municipalities now depend on land leases for the majority of their revenue (Stein 2012), Therefore, development and management of urban infrastructure is also subject to the constraints of the local state’s profit-seeking agenda, as infrastructure investment is dependent on the level of funding that local government achieves through its land management practices (Tian and Ma 2009; Wu 2009). However, the local state also has a history of supporting the rent-seeking behavior of real estate developers by dispensing or bargaining over advantageous real estate development conditions, which compromises the goal of planning for land use efficiency (Zhu 2004; Lin and Ho 2005) or for the municipality’s direct financial gain.

5 - 8
Operating concurrently with ‘entrepreneurial urbanization’, the theoretical model of ‘administrative urbanization’ describes cities that are created, or their boundaries expanded, by administrative decree (Friedmann 2005). In China, city officials may set the urban development agenda by ‘strong administrative means’ (Liu, Yin, and Ma 2011). The theory of administratively-led urbanization expands the profit-seeking focus of the urban entrepreneurial agenda to encompass the power-seeking of local officials, whose careers depend on urban modernization and investment (Liu, Yin, and Ma 2011). By exercising their increasing power in the decentralized system of governance, the local state engages in the “administrative ordering of nature and society” and “provides the determination to act on the desire” for High Modernist designs (Scott 1998, 5). As opposed to the passive role of spatially implementing economic planning targets within the entrepreneurial city-making regime, the urban planning bureau can directly participate in conveying the High Modernist ideology of the city administration into both the imaging of the modern city and the practice of scientific planning (Scott 1998). The planning bureau must execute these “modern urban projects that are visually impressive and financially rewarding” to local administrations (Liu, Yin, and Ma 2011, 2). The image of the city itself, in addition to the “modern, clean built environment, [is] considered as evidence of the achievements of government officials” (Han and Wang 2003, 110). In China, the rhetoric of scientific and rational planning, a panacea that would compensate for the inefficiencies of the market system (Wu, Xu, and Yeh 2007, 164), has been accompanied by a top-down insistence on the standardization and industrialization of housing itself (Lü, Rowe, and Zhang 2001, 290), which further enables construction efficiency and replication of Modernist forms.
In an advantageous shift for the goal of energy efficiency, city administrations have layered another formulation of ‘city-making’ onto the language of urban development: the concept of ‘low-carbon urbanization’, or ‘eco-city development’, in both planning strategies and branding (Hald 2009; Wang 2009). Planners have been urged to consider the importance of community-scale energy management in China (Sadownik and Jaccard 2001), but city officials and the public have only recently become aware of the critical role of cities in energy management in particular (Chen 2011; Li et al. 2008). Researchers and officials have also cited sustainable urban planning principles in their call to strengthen the urban growth management capacity of local administrations, to combat the negative effects of entrepreneurial urbanization (Zhao 2011). This trend presents an opportunity for expanding the scope of energy planning beyond individual buildings and urban energy distribution systems, to the planning of neighborhood units.
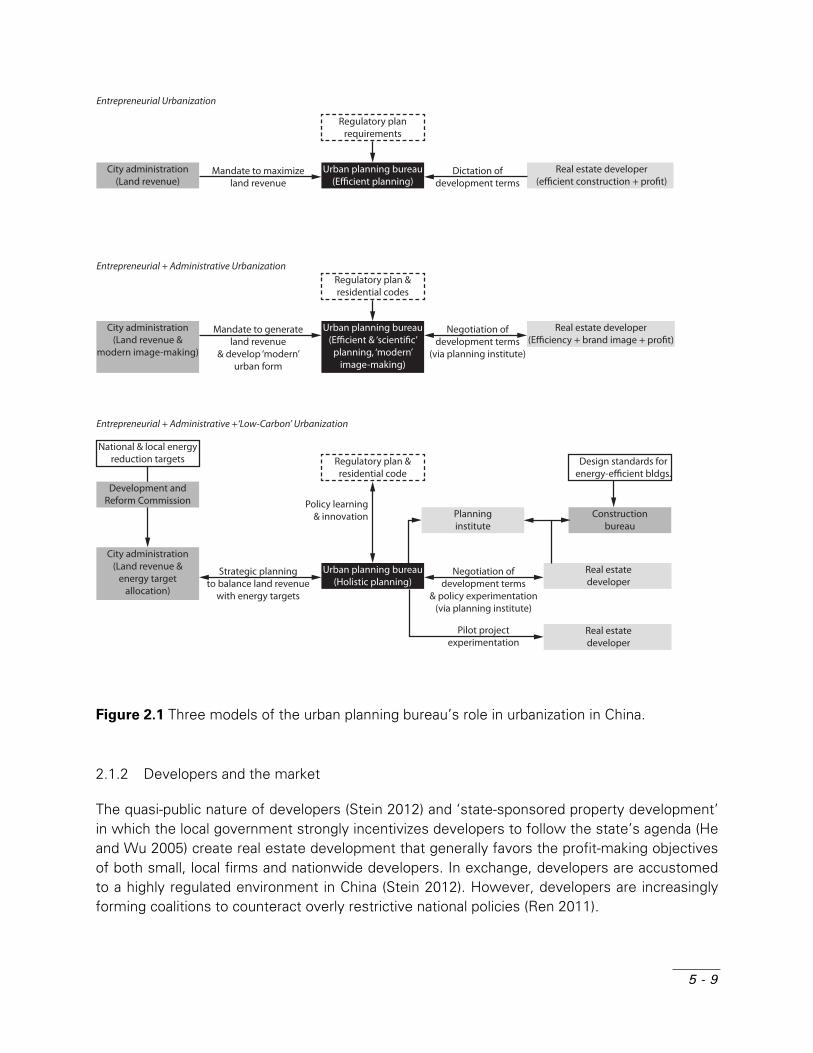
5 - 9
Figure 2.1 Three models of the urban planning bureau’s role in urbanization in China.
2.1.2 Developers and the market
The quasi-public nature of developers (Stein 2012) and ‘state-sponsored property development’ in which the local government strongly incentivizes developers to follow the state’s agenda (He and Wu 2005) create real estate development that generally favors the profit-making objectives of both small, local firms and nationwide developers. In exchange, developers are accustomed to a highly regulated environment in China (Stein 2012). However, developers are increasingly forming coalitions to counteract overly restrictive national policies (Ren 2011).
Urban planning bureau(Efficient planning)
Planninginstitute
Real estate developer(efficient construction + profit)
Regulatory planrequirements
Design standards for energy-efficient bldgs.
Constructionbureau
National & local energy reduction targets
Development and Reform Commission
City administration(Land revenue)
Entrepreneurial Urbanization
Entrepreneurial + Administrative Urbanization
Entrepreneurial + Administrative +‘Low-Carbon’ Urbanization
Mandate to maximize land revenue
Dictation of development terms
Urban planning bureau(Efficient & ‘scientific’
planning, ‘modern’ image-making)
Real estate developer(Efficiency + brand image + profit)
Regulatory plan & residential codes
City administration(Land revenue &
modern image-making)
City administration(Land revenue &
energy target allocation)
Mandate to generate land revenue
& develop ‘modern’ urban form
Negotiation ofdevelopment terms
(via planning institute)
Urban planning bureau(Holistic planning)
Real estate developer
Real estate developer
Regulatory plan &residential code
Strategic planning to balance land revenue
with energy targets
Negotiation ofdevelopment terms
& policy experimentation(via planning institute)
Pilot projectexperimentation
Policy learning& innovation

5 - 10
Developers cite three major barriers to participating in the ‘low-carbon’ city-making agenda by adopting green technologies or strategies: high green technology material costs, lack of motivation from market demand, and insufficient policy implementation efforts (X. Zhang et al. 2011). In contrast to energy-efficient technologies that consumers can directly adopt (D. Feng 2010), homebuyers have only an indirect influence on the built form of real estate development.
2.1.3 Professional practitioners
Professional consultants, including both local design institutes (LDIs) and private design firms, have a substantial and often overlooked influence on the body of knowledge that is brought to bear on a planning project, the dynamics of the design process, and the built form outcomes. In most cases, the planning bureau outsources the regulatory plan production to the same LDIs that will later produce the developers’ residential plans, and the LDIs apply the same limited information and planning capacity throughout the process:
“New or amended master plans prove only that the Design Institutes in charge, reporting to the local Urban Planning Bureau, continue to be dominated by architect-planners with little access to ‘feedback’ based on systematic monitoring of relevant small-area demographic and economic indicators, and these agencies still show little apparent concern about the economic cost or consequences of the actions outlined in the plans…” (Tian and Shen 2011, 4).
2.2 Control and Innovation in Development
The range of instruments for development control have been explored by numerous scholars (Tiesdell and Adams 2011; Ben-Joseph 2005; Barnett 1982). Policy intervention, financial leverages, and land lease control are all commonly used development control methods in China’s local governments (He and Wu 2005). The sophistication and effectiveness of these tools need to be understood in relation to the context of the evolving practice of city planning in China, however. The legitimacy of urban planning was legislated less than 25 years ago, in the 1989 City Planning Act (Wu et al. 2007), and planners have been gradually implementing the regulatory planning procedures, with little opportunity for innovation until recently. Planning theorists and practitioners now critique the rigidity of the regulatory planning system (Xu 2010), but this system has provided strong methods of controlling private development, compared with systems in the United States and other countries. The central government requires each municipality to prepare detailed plans, called regulatory plans, for urban zones that range from five to ten square kilometers, or more. The plans delineate the ‘red line’ of the public right-of-way and the leasable land parcel areas (Figure 4.4), attaching required development indicators to each of the parcels. These basic parcel requirements are: permitted land use type, maximum FAR, maximum building height, maximum building coverage ratio, minimum open space ratio, entrance locations, minimum parking requirements, public services and facilities to be
5 - 11
constructed by the developer (Tian and Shen 2011). Planners can also attach ‘recommended’ conditions to each parcel in the regulatory plan, but different planning bureau jurisdictions have varying capacities to enforce these recommendations.
In addition to the limited toolkit provided by the legal planning procedure, endogenous barriers to change within the urban planning bureau are evident in the literature. Most plans are out of date by the time of approval, especially due to a lack of financial considerations and the inadequate protection of open space from development (Tian and Shen 2011). Planners also lack capacity in terms of time and knowledge, as well as incentives to improve the quality of the planning products, in their current role as passive reviewers in the city-making process.
As new city-making agendas challenge this conventional planning system, the literature on local policy experimentation in China is becoming increasingly relevant to urban planning. Adaptive informal institutions in China devise “creative responses to formal institutional environments that actors find too constraining” and as endogenous sources of institutional change (Tsai 2006, 118). Local, ‘transitional’ institutions involved in the city-making enterprise, from ambiguous property rights to evolving planning processes, contribute to this informal adaptation that enables institutional change (Duckett 1998; Zhu 2004) and potentially increased capacity at the local level. The central government encourages this ‘experimentalism’ in local-level policy formulation (Heilmann and Perry 2011), and tacitly accepts local institutions’ informal responses and interpretations of top-down policies, or ‘coping strategies’ that also contend with the uncertainty of the transforming regulatory environment (Bruton, Bruton, and Li 2005; Tsai 2006; Zhu 2004). Policy experimentation was critical to the housing policy transitions from public to commercial housing provision in the 1980s, but the government and developers have rarely adopted the innovations in built form that have been demonstrated by pilot housing projects (Lü, Rowe, and Zhang 2001).
A small group of scholars has theorized the role of the urban planning bureau within the transitional economy of Shenzhen, suggesting that the planning bureau has shifted from directly serving economic planners to a more active role of ‘experimental learning’ and ‘path changing’ behavior (Bruton 2005; Ng and Tang 2004). Shenzhen has demonstrated flexibility in its localized interpretation of the national regulatory plan requirements, called ‘statutory plans’ in Shenzhen (Ng and Tang 2004). In a globalizing development environment, urban administrations are also learning through both informal networks and the ‘hegemonic discourse’ by which international institutions and consultancies transfer best practices and standards—knowledge which may or may not be immediately adopted by local officials (Chien and Ho 2011). Into these theories of innovation in planning, I incorporate the Shenzhen planning bureau’s creative and technical responses to resource scarcity, which now contend with land shortages but could also apply to energy shortages.
5 - 12
3 Methodology
‘City-making’ in China is a multi-stakeholder process of implementing real estate development policy and design codes, which national-level ministries establish and municipal bureaus modify for the local development context. Within the normative real estate development process, however, context-specific objectives, negotiations among stakeholders, and local reinterpretations of national codes and policies can present opportunities for alternative real estate development outcomes. Each of the stakeholder groups possesses different capacities in this process. The presence or absence of a particular stakeholder group, such as consultants with specialized knowledge, can also affect the overall project objectives and redirect the outcomes of development projects.
Because these development processes are complex and time-dependent, and because only a few previous studies have explored the role of the urban planning bureau and real estate firms in these dynamic processes (Stein 2012), I selected an open-ended case study method to compare the different localities with the current literature. Now that the key barriers and potential policy instruments for promoting energy-efficient strategies, further research could include a survey method to analyze a wider range of cities.
3.1 Variables: Design Codes, Practices, and Built Form Outcomes
3.1.1 Dependent Variables: Neighborhood Design Outcomes
China’s planning and housing regulations codify a wide range of recommended design variable values. For this research, I have focused on the outcome variables that: empower planning officials to influence development practices; can efficiently, accurately and systematically describe neighborhood form; and impact energy efficiency at the neighborhood scale. I have traced each bureau’s regulatory control and decision-making authority surrounding the following three key design variable classes: (1) road network density, (2) neighborhood building density and FAR, and (3) neighborhood use mix. The Making the Clean Energy City in China project has been studying the relationship of neighborhood form and energy consumption in China for the past two years, and the project team has identified road network density, building density, and commercial storefronts, which can be described in terms of neighborhood use mix, as important variables in the connection between energy efficiency and neighborhood form (MIT and Tsinghua 2012). These variables are important measures of control in the Chinese planning context, and previous studies have also employed these three variable classes to analyze neighborhood form (Handy 2002, TBD). I can measure these variables reliably as built-form outcomes, and I can compare their final values to the range of values that are defined within the planning codes. The level of the planning bureau’s and the developer’s adherence to these
5 - 13
variable value ranges serves as a measure of development control that is independent of a specific development project. In the interview and document analysis process, I compare additional important variables to these primary form descriptors, in order to explore competing explanations for the forces shaping the superblock forms. For example, developers often cite daylight access as the constraining factor in determining building density. I have restricted my research question to energy efficiency in the built form of new residential development, instead of in energy technologies or retrofit projects, and I have confined the scale of the built form intervention to superblock neighborhoods, instead of the larger question of urban form. At this neighborhood spatial scale, some concepts of energy efficiency in urban form, such as location efficiency and urban compactness, do not apply.
3.1.2 Independent Variables: Design Regulations and Institutional Practices
I have researched the range of design codes and policies in advance, but the interview process allows for the most relevant policies to become salient. Codes and policies include documented national energy policies, national planning regulations, city-level implementation plans, local design regulations, and planning handbooks and guidelines. For the institutional practices, I include the city-making objectives that drive the decision making of different stakeholders, broadly defined as the overlapping categories of entrepreneurialism, administrative action, and sustainable urbanization practices. I also highlight the theoretical categories pertaining to urban planning practices, including legitimacy seeking, coping with uncertainty, and enabling flexibility versus relying on the rigidity of regulations, which are often the background principles of the barriers and feasible strategies for negotiating with other stakeholders and changing neighborhood design outcomes.
If a major component of energy consumption depends on the behavior of individual end-users, and sales to households as well as to employers drive the residential market, then the influence of real estate consumers on the developers’ and planning bureaus’ agendas for neighborhood form production should be considered. Due to the limited scope of this study, however, I will leave this dimension of the relationship between real estate development and energy efficiency for future research.
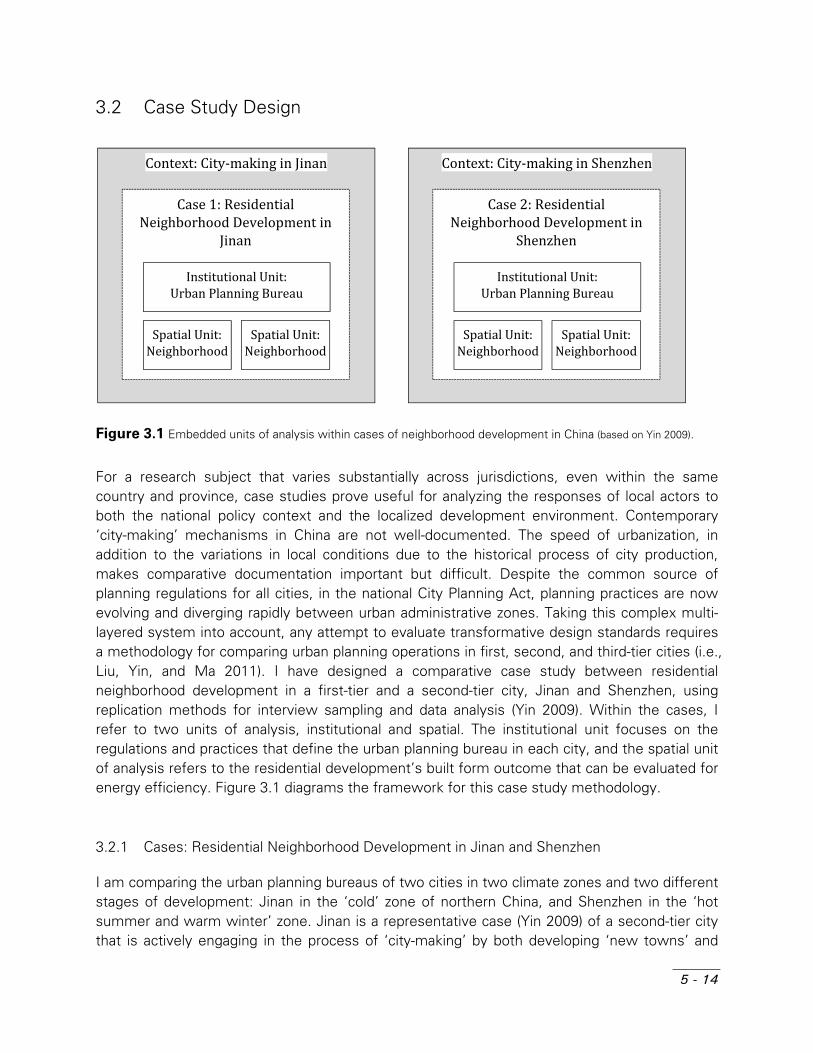
5 - 14
3.2 Case Study Design
Figure 3.1 Embedded units of analysis within cases of neighborhood development in China (based on Yin 2009).
For a research subject that varies substantially across jurisdictions, even within the same country and province, case studies prove useful for analyzing the responses of local actors to both the national policy context and the localized development environment. Contemporary ‘city-making’ mechanisms in China are not well-documented. The speed of urbanization, in addition to the variations in local conditions due to the historical process of city production, makes comparative documentation important but difficult. Despite the common source of planning regulations for all cities, in the national City Planning Act, planning practices are now evolving and diverging rapidly between urban administrative zones. Taking this complex multi-layered system into account, any attempt to evaluate transformative design standards requires a methodology for comparing urban planning operations in first, second, and third-tier cities (i.e., Liu, Yin, and Ma 2011). I have designed a comparative case study between residential neighborhood development in a first-tier and a second-tier city, Jinan and Shenzhen, using replication methods for interview sampling and data analysis (Yin 2009). Within the cases, I refer to two units of analysis, institutional and spatial. The institutional unit focuses on the regulations and practices that define the urban planning bureau in each city, and the spatial unit of analysis refers to the residential development’s built form outcome that can be evaluated for energy efficiency. Figure 3.1 diagrams the framework for this case study methodology.
3.2.1 Cases: Residential Neighborhood Development in Jinan and Shenzhen
I am comparing the urban planning bureaus of two cities in two climate zones and two different stages of development: Jinan in the ‘cold’ zone of northern China, and Shenzhen in the ‘hot summer and warm winter’ zone. Jinan is a representative case (Yin 2009) of a second-tier city that is actively engaging in the process of ‘city-making’ by both developing ‘new towns’ and
Context: City-making in Jinan Case 1: Residential Neighborhood Development in Jinan Institutional Unit: Urban Planning Bureau
Spatial Unit: Neighborhood Spatial Unit: Neighborhood
Context: City-making in Shenzhen Case 2: Residential Neighborhood Development in Shenzhen Institutional Unit: Urban Planning Bureau
Spatial Unit:Neighborhood Spatial Unit: Neighborhood

5 - 15
revitalizing existing districts. If the conditions for innovation in energy-efficient planning can be applied to Jinan, then the same conditions could be applied to most second-tier cities in China. The city’s main urban planning bureau is responsible for reviewing development projects throughout the city. The centralized organization of planning oversight contrasts with most first-tier cities, where district planning bureaus conduct local planning reviews and provide substantial public documentation of their activities, such as the Longgang and Bao’an districts in Shenzhen. The Energy Foundation (EF) has maintained a long-term engagement with planning processes in Jinan, and I have accessed its unique perspective through the foundation’s partnership with the MIT/DUSP Clean Energy City in China group. In Jinan, I found there are no examples of recently constructed real estate developments that have deviated from the conventional towers-in-the-park model. For these reasons, Jinan is useful context in which to examine the potential for adopting neighborhood energy efficiency policies within a typical rapid urban development environment.
In order to find evidence of innovation in regulating development, I compare the Jinan case to more advanced neighborhood development regulations and practices in Shenzhen. Shenzhen represents a critical case for residential development; if another Chinese city faced similar land shortages and its planning bureau had accumulated a comparable capacity for development control, then that city might follow the same pathway to innovation in its planning codes and would be more likely to achieve energy-efficient development.
3.2.2 Institutional unit of analysis: Urban Planning Bureaus in Jinan and Shenzhen
I focus on the urban planning bureau as an institutional unit representing the regulation and mediation practices between city administrations and developers in Chinese cities. Shenzhen just completed a major overhaul of the planning codes governing residential development. The planning bureau is now exploring the edges of what it can regulate within the developer’s domain of residential design, as well as what design parameters can only be formulated as recommendations. The strong capacity of the planning bureau, compared to other municipalities, reflects the lessons learned by the Shenzhen government during the past 20 years of poorly controlled development. The government now supports tightly controlling both the small amount of land that remains available for greenfield development and urban revitalization projects. Jinan is still in a stage of comparatively unrestricted development, so the interests of the planning bureau are primarily aligned with the development coalitions of the government and real estate firms.
3.2.3 Spatial unit of analysis: Neighborhood developments in Jinan and Shenzhen
The spatial units of analysis are residential neighborhood developments (Figures 4.2, 4.3). The built form outcome that defines the neighborhood spatial unit emerges from a detailed regulation and planning process. The resulting neighborhood plan codifies the allowable real estate development practices. Although the comprehensive planning phase in China

5 - 16
establishes many of the variable values that can impact overall urban efficiency, such as major road arteries and zoning, the neighborhood unit is the design scale at which functional urban environments are constructed. For each form variable, I selected embedded examples of neighborhoods that represent variations in the practice and outcomes of energy-efficient development.
3.3 Data Sources and Analysis
I have conducted a four-step analysis process for each outcome variable related to energy efficiency: (1) establishing target values for the design variables, based on the literature covering energy and neighborhood form, (2) summarizing the design code values and the planning bureaus’ justifications for regulating these variables, (3) describing the stakeholders’ practices for interpreting and negotiating the variable values, and (4) reviewing the built form outcome’s conformance to the codes and practices. For example, I compare the residential density range that would result in greater energy efficiency (i.e., an FAR of 3.0 to 3.5 given a maximum building height of 100m) to the allowable FAR range given in the national and local residential planning codes (i.e., a maximum FAR of 2.0). Then I explain how the planning bureau sets the FAR for an example parcel based on these codes and on negotiations with potential developers, and I compare the developer’s residential design to the planning bureau’s objectives for the neighborhood’s density.
3.3.1 Design Codes and Commentary
The first step of my analysis establishes the evolving official capacity of the planning bureaus to influence the developers’ neighborhood plans. I collected and compared four different versions of China’s residential planning codes that date from 2002 to 2012. Although the revised national code may be released in 2012, I have used the 2002 Urban Residential Neighborhood Planning and Design Standard (GB 50180—93), as this version is the basis for all current municipal-level planning codes. Jinan’s version of the regulatory planning and residential planning codes were published in 2006. Shenzhen recently completed a major revision of its citywide regulatory planning and residential planning standard, during a three-year process that resulted in a 2012 document that is approximately fifty percent longer than the 75-page code book from 2004, and I have evaluated the changes between these versions of the residential planning chapters. From these codes, I assembled comparative tables of the design code variables associated with road network density, building density, and use mix.
I also drew from the commentary published by each planning bureau—the journal of the Jinan Planning Bureau, titled ‘City of Springs Planning Review’ with 2006 to 2012 issues available online, and the internal newsletter of the Shenzhen Planning Bureau from 2007 to 2012—that explains its rationale for specific regulations, such as the FAR, and residential planning

5 - 17
decisions. A range of other documents contain evidence of announced policies, urban development objectives, and neighborhood design outcomes. I have cited the overarching policy documents, when these documents provide guidance for regulating energy consumption at the neighborhood scale; these documents include the national energy policy, the national Science and Technology Plan, five-year plans at the city and national levels, and building design regulations.
3.3.2 Interview Sampling
Through in-depth interviews, I contrast the planning bureaus’ official capacities with their current practices for regulating and negotiating with developers and planning consultants. These interviews with residential project participants serve as the study’s primary data source. I sampled interviewees in order to capture as much of the neighborhood development decision-making and implementation chain as possible, subject to the constraints of time and access to developers and officials. I accessed informants affiliated with development in Jinan through the current MIT project sponsors and collaborators, an interview pool that included specialized energy planning consultants. Following a snowball sample building technique, I began the Shenzhen interview selection by contacting my former Shenzhen planning bureau colleagues and was able to interview the planning bureau officers responsible for code revisions—a dedicated position that the Jinan planning bureau does not currently maintain. Although I had originally planned to widen the interview sampling to consultants, developers, and municipal plan reviewers who worked on each of the specific neighborhoods that I have used as illustrations, instead I concentrated on a broader thematic documentation of neighborhood design practices, due to the time limitations of the fieldwork. In each city, I interviewed:
Three levels of urban planning bureau officers, each level of which exercises a different capacity to guide development policy and negotiate with developers:
o The bureau directorship o Managers responsible for the formulation of residential zone regulatory plans o Neighborhood development plan reviewers
Planning consultants who work with both the planning bureau and developers Planning managers within real estate development firms
I conducted the interviews in Chinese, except for the interviews with three design consultants who were fluent in English. My colleagues from the MIT-Tsinghua research project accompanied me to the group interviews in Jinan and assisted with follow-up questions, because these researchers served as intermediary contacts with the organizations. The group interviews at the Jinan planning bureau presented both drawbacks and advantages: while some informants’ responses may have been influenced by the presence of their supervisors, when the supervisors were participating in the interview, these same informants took the opportunity to react to their supervisor’s comments when I conducted independent follow-up sessions. The

5 - 18
interviews lasted for an average of one hour per informant. See Appendix 6.2 for a list of key informants.
3.3.3 Interview Instrument and Analysis
I designed three interview phases for the semi-structured interview instrument, so that the past neighborhood planning experiences of each informant set the context for a discussion of potential changes in the neighborhood planning practice and regulatory framework. I asked each informant to discuss:
1) Past experiences in neighborhood planning projects, including the interactions with consultants and developers.
2) Capacity to influence neighborhood planning decisions, in relation to the influence of other stakeholders.
3) Ability and willingness to integrate energy-efficient design policy into the revision of plans for land use and real estate development.
Following a qualitative coding method (Charmaz 2006), I categorized each stakeholder’s references to planning and design regulations, and allusions to norms of practice. I recorded the nature of the stakeholder’s participation in neighborhood planning decisions, direct or implied reasons for the decision, and if his or her reasoning was an interpretation or contravention of the relevant regulations. I further differentiated the capacity of each stakeholder to employ policy instruments.
3.3.4 Residential development plans and regulatory plans for residential zones
Finally, to illustrate the gaps between regulations, proposed plans, and the actual built forms, I assessed the resulting neighborhood developments in a residential zone of each city. I selected the plans from the set of neighborhoods that the planning consultant informants used as examples, and I requested the design documentation from these consultants. I then collected the approved residential zone regulatory plans from the planning bureau public sites, as well as photos and aerial plans of the built form outcomes. I evaluated the three outcome variables’ positions on the range of values prescribed by residential codes. The actual built form outcomes become an indicator of the level of planning control that is possible within the current planning environment.
5 - 19
4 Tracing the Impact of Design Regulations and Practice on Neighborhood Form
Within the overarching agenda of the city-making institutions, the urban planning bureau can exercise its capacity to make a wholesale acceptance or rejection of a neighborhood development plan. The design changes that lead to an approved plan, however, are negotiated at a more elemental level, in the language of neighborhood access, building density, and amenities. To establish a general strategy for achieving more energy-efficient form through the regulation and negotiation of these elemental design variables, I have drawn on the literature on relationships between neighborhood form and energy performance in Chinese and international cases. These studies are then compared to the findings of the Making the Clean Energy City in China project (MIT and Tsinghua 2012), which evaluates three components of superblock energy consumption in Jinan: household operational, transportation, and embodied energy. For each design variable, I explore the differences in code interpretation and the barriers in practice that may lead to implementation challenges. Specific neighborhood projects then illustrate continuity, incremental change, and paradigm change in the residential planning process and design variable outcomes for each city.
4.1 Road network density
Road networks do not simply reflect the traffic volume capacity of a residential zone. Municipal streets define the parcel size for a real estate development in new urban zones; a regulatory plan rarely parcelizes a new residential block by ‘red line’ boundaries that are not adjacent to roads. If the planning bureau elected to bisect a parcel with an additional municipal road, the bureau would have to account for both the opportunity cost of losing leasable land and the construction and management costs of an additional public street. Moreover, the burden of land lease arrangements and project approvals could increase, in accounting for two parcels instead of one. An inflexible primary road system can also lock a district into large-scale blocks, if the roads are not planned for smaller blocks in advance.
Empirical studies point to the potential energy efficiency of dense road networks (Shim et al. 2006, TBD). Shorter block lengths, more frequent intersections, and the resulting smaller building footprint areas are related to lower transportation energy consumption per household in Jinan (MIT and Tsinghua 2012).
Improving public infrastructure, such as road construction, tends to increase revenue from land use right sales (Stein 2012, 134), but the public investment required for additional roads that would achieve sufficient access and connectivity for energy-efficient design will most likely exceed the marginal increase in the land parcel’s value. Moreover, with public entities holding

5 - 20
interests in most development firms, the responsibility for investing in and constructing additional infrastructure is often ambiguous (Stein 2012, 136). If local government prioritized residential energy efficiency, then the dual public-private nature of most real estate firms might enable the government more easily to diffuse development practices such as smaller block sizes. The Jinan quasi-public developer, which must refer to itself as a non-profit state-owned service enterprise, can construct a road at the request of the local government, then be compensated through land assignments or smaller direct payments. The exchange of services and development privileges between government-affiliated enterprises reduces the burden on the finance department while enabling infrastructure provision (JRM). However, few of these practices could be codified to encourage widespread energy-efficient development.
In practice, cases of regulatory plan formulation demonstrate that the Jinan planning bureau has consistently rejected proposals for more dense street grids. Smaller parcels are not necessarily unattractive to developers, because local developers with lower capital resources are more likely to afford the land lease deposit for a small parcel (JRM). However, this situation primarily applies to parcels on steep slopes and remnant land. Informally, planning bureau officials are not averse to developing street layouts with more varied widths and spacing, an attitude that suggests the potential for a transformation in planning practices. Developers may not accept these parcels that are subdivided by municipal streets, which they interpret as the planning bureau interfering with their control over residential plans (JRM). Most developers in Jinan still hold a strong negotiating position and will not tolerate overly restrictive parcel requirements. Moreover, in Jinan, where divided streets with eight or more lanes dominate the primary road network, planners cannot incrementally add feeder roads to these wide avenues. If smaller-scale side roads had been planned in advance, additional neighborhood streets could have been added as development progressed (JRM). Within new residential neighborhoods, surface streets are now prohibited and all motor traffic must now utilize the underground parking lot for internal travel (JRM), although earlier residential plans such as Sunshine 100 do not conform to this rule. This requirement severely constrains the number of vehicular access points to a single community as well as limiting the amount of commercial storefront along vehicle paths in large parcels, which becomes an important concern for developing mixed use neighborhoods. However, eliminating the streets also provides more space for parks, pedestrian access, and even alternative transport networks on the ground level.
The case of a new cluster of residential developments in the hills of southern Jinan demonstrates several of these barriers to improving road access within a private residential development. The developer approached an outside consultant to propose low-carbon design changes to its conventional residential development in southern Jinan. The consultant, focusing on sustainable transport and urban design, created a new road layout that reconciled many of the problems with cul-de-sacs and private roads that may increase motorized trips, while increasing intersection density. In conjunction with the alternative street system, the consultant reorganized the land uses to reflect transport-oriented development principles. The urban planning and management bureaus in Jinan subsequently rejected these alternative design proposals, which would have required changes to the approved regulatory plan for this

5 - 21
residential zone. The developer was also not willing to accept the substantial changes in layout, for both additional private roads and the clustering of mixed-use buildings, which would have increased the developers’ share of the burden of management and infrastructure costs.
In Shenzhen, district-level planners have adopted a strategy for balancing between public access needs and the private developers’ domain. The regulatory plan designates two neighborhood entries joined by a privately financed but publicly accessible street, with the routing determined by the developer (SPZ). The planners are confident that the district’s enforcement capacity is sufficiently developed to ensure that the road is not converted to private access in the future (SPZ, SID). The strategy may become a code provision after the planning bureau demonstrates its capacity to enforce public access. In special planning districts, the bureau has already approved regulatory plans with significantly smaller blocks; some plans have been revised from 300m-long blocks to 200m or less, with the intention of improving the walkability of the new development rather than addressing energy efficiency.
4.2 Building Density and Floor-Area Ratio
For China’s developers, the floor-area ratio (FAR) is the most important statistic for measuring the value of a land parcel. For the urban planning bureau, FAR regulations are the primary means of responding to and controlling the real estate market; FAR regulations therefore play multiple roles within urban development policy, social welfare, and legal accountability (S. Feng 2009). Although the national planning code regulates the building coverage directly, the range of allowable coverage can accommodate any floor-area ratio. Therefore, the FAR becomes the indirect control of density, in conjunction with building height restrictions. Because of its complex role in development control, the process of determining parcel-by-parcel FAR exhibits both flexibility and uncertainty, and the practices and conventions of FAR adjustments vary across different urban administrations.
Previous studies have established a link between higher density zones and higher levels of energy efficiency in neighborhood form (Permana et al. 2008; Wright 2010). In the study of Jinan residential development, higher population density and volumetric density—the proportion of constructed mass within the total possible volume of the site, as defined by the weighted average building height—related to lower transportation and operational energy use, respectively (MIT and Tsinghua 2012).
The Jinan and Shenzhen planning bureaus have also published rationales for controlling FAR. From the perspective of planning regulation reform in Shenzhen, a planning code author reported on his experience researching the practice of FAR-led development regulation, which he calls the "key feature of land resource allocation and the core index of micro density control" (S. Feng 2009, 35). However, planning bureaus still lack an understanding of how to implement FAR controls as both spatial and policy tools, and some bureaus recognize that the planning
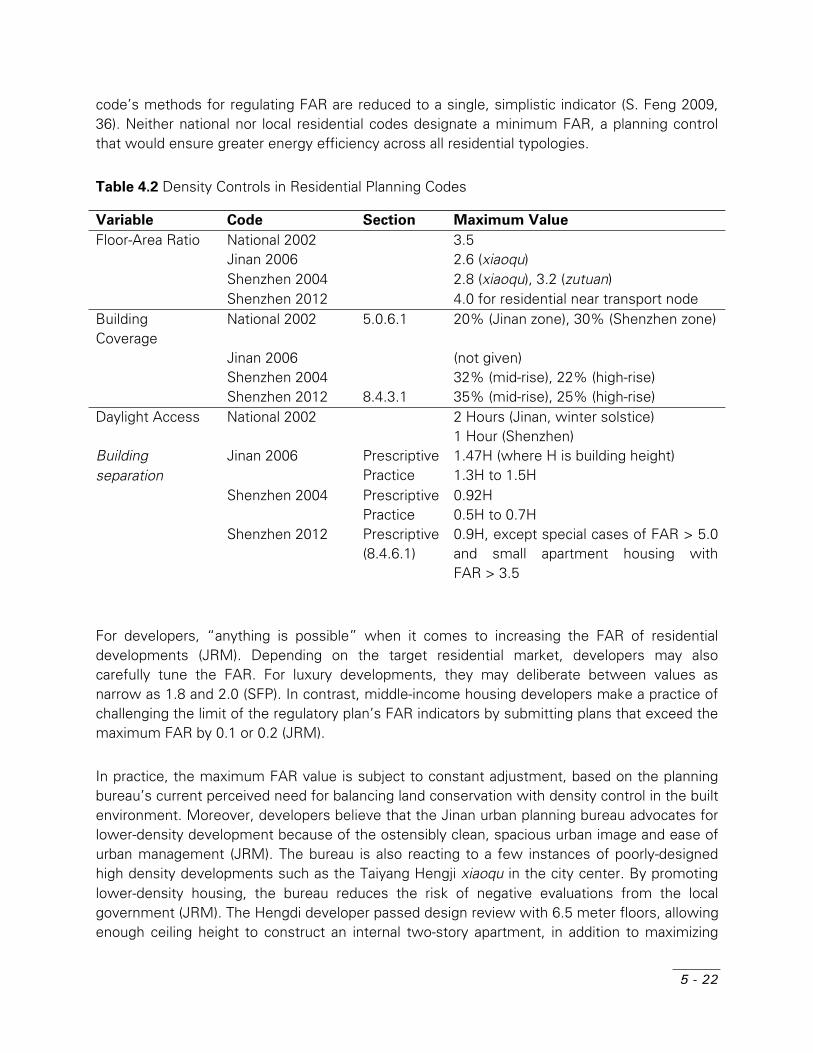
5 - 22
code’s methods for regulating FAR are reduced to a single, simplistic indicator (S. Feng 2009, 36). Neither national nor local residential codes designate a minimum FAR, a planning control that would ensure greater energy efficiency across all residential typologies.
Table 4.2 Density Controls in Residential Planning Codes
Variable Code Section Maximum Value
Floor-Area Ratio National 2002 3.5 Jinan 2006 2.6 (xiaoqu) Shenzhen 2004 2.8 (xiaoqu), 3.2 (zutuan) Shenzhen 2012 4.0 for residential near transport node Building Coverage
National 2002 5.0.6.1 20% (Jinan zone), 30% (Shenzhen zone)
Jinan 2006 (not given) Shenzhen 2004 32% (mid-rise), 22% (high-rise) Shenzhen 2012 8.4.3.1 35% (mid-rise), 25% (high-rise) Daylight Access National 2002 2 Hours (Jinan, winter solstice)
1 Hour (Shenzhen) Building separation
Jinan 2006 PrescriptivePractice
1.47H (where H is building height) 1.3H to 1.5H
Shenzhen 2004 PrescriptivePractice
0.92H 0.5H to 0.7H
Shenzhen 2012 Prescriptive(8.4.6.1)
0.9H, except special cases of FAR > 5.0 and small apartment housing with FAR > 3.5
For developers, “anything is possible” when it comes to increasing the FAR of residential developments (JRM). Depending on the target residential market, developers may also carefully tune the FAR. For luxury developments, they may deliberate between values as narrow as 1.8 and 2.0 (SFP). In contrast, middle-income housing developers make a practice of challenging the limit of the regulatory plan’s FAR indicators by submitting plans that exceed the maximum FAR by 0.1 or 0.2 (JRM).
In practice, the maximum FAR value is subject to constant adjustment, based on the planning bureau’s current perceived need for balancing land conservation with density control in the built environment. Moreover, developers believe that the Jinan urban planning bureau advocates for lower-density development because of the ostensibly clean, spacious urban image and ease of urban management (JRM). The bureau is also reacting to a few instances of poorly-designed high density developments such as the Taiyang Hengji xiaoqu in the city center. By promoting lower-density housing, the bureau reduces the risk of negative evaluations from the local government (JRM). The Hengdi developer passed design review with 6.5 meter floors, allowing enough ceiling height to construct an internal two-story apartment, in addition to maximizing

5 - 23
the floor area of enclosable balconies. In effect, the developer nearly doubled the FAR, and the bureau has since become more strict in its plan reviews under the criticism of the city government and residents (JRM). Developers in Shenzhen also blame the uninhabited Futian central business district, among other low-density zones, on planners following Modernist urban theories (SRD).
Due to the historical abuse and lack of transparency in density bonus allocation, this zoning incentive faces a difficult path to legitimacy in China. In its current stage of development, Jinan’s planning bureau does leave the door open for developers to negotiate for FAR changes (JRM). Conversely, Shenzhen has a well-established system through which developers apply—and pay—for FAR adjustments (SFM). This system did not arise from proactive governance, but rather was a reaction to two decades of uncontrolled development. Zhu Jieming (2004) explains that rent seeking through land use and density alterations in the 1990s led to extreme congestion and deteriorating retail performance in Luohu, Shenzhen’s urban core. Developers disregarded the redevelopment plan that called for an FAR limit of 3.0, and over half of the plots reached an FAR greater than 4.0. The reduction in environmental quality resulted in strong criticism of the Shenzhen government’s lack of development control. In the remaining fraction of developable land, the government finally moved to compensate developers for reducing densities to 1.0, which was as little as one quarter of the allowable FAR promised by the regulatory plan. As additional districts are experiencing intensive redevelopment, administrators continue to voice concern that the planning bureau is accepting developers’ requests for FAR increases that will strain the districts’ public services, as the districts are often unable to allocate additional land and resources to increase public service provision (SPA).
The most serious barrier to high-density development, according to every developer and designer I interviewed, remains the daylight access requirement. Developers may not be able to achieve the both the allowable FAR and required hours of direct sunlight under certain site configurations (JRM, SRM). The prescriptive requirements for building separation are the most restrictive codes that dictate the form of the development.
Development in the government-led high-tech zone of Jinan is representative of the challenges faced by the planning bureau in producing neighborhood density controls that are both comprehensive and detailed. This new area of the city has undergone a process of informal adaptation to achieve the interests of the city-making coalition. The Jinan developer took instructions directly from the urban management committee, planned the neighborhood to determine the parcel requirements, adjusted the residential parcel areas to suit the perceived need of the local government—thus assuming a role normally assigned to the planning bureau, while still maintaining contact with the bureau—then received many of these parcels for development. This practice of “taking from the right pocket and placing in the left” (JRM) is becoming less common in developed cities. In second- and third-tier cities, however, the close relationship between the state and developers remains critical to supporting the local economy (Stein 2012). In the case of Jinan, the government interest extends only to providing low-cost housing to enterprises that would relocate to and stimulate a new development zone. The

developeupmarkeof revenu
Planning and adjusThrough bureau tosystematthe prima
Figure 4
developedensity m
er was incet units, whicue in exchan
bureaus arstment, whithis practic
o receive gretic criteria, sary intention
4.2 Jinan Her, showing market hous
entivized to ch the govenge for the d
e seeking lech surpass ace, developeater benefisuch situation to protect t
High-Tech Dhigh-densit
ing (FAR of
increase thrnment allow
developer’s s
egitimacy byand sometimers are incrts (JRM). Thon may leadthe public go
Developmeny housing fapproximate
he residentws the deveservice to th
y creating ames contradreasingly cohe result is td to an abusood" (S. Feng
nt Zone hofor enterprisely 1).
ial density eloper to selhe city (JRM
a flexible pradict the rulesompelled tothat "due to se of powerg 2009, 36).
ousing comses (FAR of
to accommll at market ) (Figure 4.2
actice of regs defined by o engage wthe lack of lr for person
pleted by f approximat
5
modate additrate, as a so
2).
gulatory planpublished c
with the planlegal suppor
nal gains, de
the governtely 3), and
5 - 24
tional ource
nning codes. nning rt and espite
ment low-
5 - 25
4.3 Neighborhood Use Mix
The prevalence of high use mixes in energy-efficient neighborhood precedents suggests that appropriate commercial and public support services are an important variable in the formula for energy efficiency, although the literature on development use mix does not reveal a conclusive relationship between use mix and energy efficiency. In Jinan neighborhoods, higher use mixes are associated with greater in-home operational energy consumption, but this difference in energy use is offset by the lower transportation energy use in developments that accommodate more neighborhood commercial services (MIT and Tsinghua 2012).
Two conventional strategies for achieving higher use mixes in Chinese residential zones are land use diversification around residential developments and floor area requirements for supporting services (peitao sheshi) within the residential blocks. To adhere to the letter of the national planning code, which does not include a mixed-use land use category, some municipalities have designed regulatory plans with exclusive, single-use zoning. A critical roadblock, cited by the majority of informants, is the varying duration of land leases if different land use categories were assigned. The uncertainty associated with mixing different lease terms within one development is closely linked to the practice of homogenous land use planning. As the planning bureau leans on the code and interprets it literally, it exhibits legitimacy-seeking behavior, a tendency to rationalize decisions through the language of scientific planning, as well as an incapacity to explore alternative development strategies.
Rental space for commercial services generally takes the form of storefronts on perimeter streets, with small, individually-owned enterprises filling in a small percentage of the residential block’s interior. The Jinan guidelines for public facilities in residential areas restrict the area of commercial services to an even lower and smaller range than the national guidelines, but make the inclusion of some commercial space mandatory (Table 4.3). This wording contrasts with the commercial services provision of the 2004 Shenzhen code, which only lists recommended, not required, values for large residential districts. With the 2012 code, Shenzhen has transitioned to a more flexible control of nonresidential services, which allows planners to attach more detailed supporting service indicators to land parcels in the statutory plan, based on the principle of increasing mixed floor area uses within both commercial and residential land uses.
In practice, not only has the Jinan planning bureau frequently rejected plans that propose commercial storefronts on any streets other than major roads, claiming that small shops produce a chaotic urban image, but the bureau leadership has also promoted large perimeter setbacks that obviate most forms of publicly accessible commercial amenities (JFD, JPD). Despite the planning bureau’s current preferences, developers continue to actively pursue neighborhood plans that maximize the commercial space along streets, usually including as much low-rise, perimeter commercial space as possible at the outset of the plan approval process (JRM). This small-scale commercial space remains very profitable. When asked to comment on why the bureau would conflict with both developers’ preferences and the needs

5 - 26
of the inhabitants, the Jinan developer asserted that these rules only reflected the preferences of the current bureau leadership. The leadership may soon change, and with the new director will come a new physical planning agenda (JRM).
Table 4.3 Residential services floor area requirements
Service Code Floor area
Large District (sq.m. per 1000 residents)
Small District Commercial National 2002 700-910 450-570 Jinan 2006 400-500 (required) 450-550 (required) Shenzhen
2004 400-500 (recommended) None recommended
Shenzhen 2012
Residential land use: Up to 30% of total floor area can be used for commercial and other services Commercial land use: From 15% to 50% of total floor area can be used for residential condominiums, depending on the commercial land use subcategory
Key Large district (居住区): 40,000-60,000 residents Small district (小区): 10,000-20,000 residents Sources National 2002: City Residential Planning and Design Regulations (城市居住区规划设计规范 GB 50180—93), Table 6.0.3 Jinan 2006: Jinan regulatory plan guidelines for public facilities in residential areas (济南控制性
规划编制居住区公共服务设施配置指引) Table Shenzhen 2004: Shenzhen Planning Standards and Guidelines (深圳规划标准与准则) Table 4.3 Shenzhen 2012: Shenzhen Planning Standards and Guidelines (深圳规划标准与准则) Table 2.1.6
In Shenzhen, planners and developers have created the opposite phenomenon. In several districts, developers have oversupplied small-scale commercial space, and storefronts are frequently vacant or permanently closed (SID). In both Jinan and Shenzhen, the low utilization of storefront commercial space may be a symptom of the poor capacity of residential management firms, rather than a reflection of low market demand for commercial services.
Designers of both housing and mixed-use development have already played an important role in diversifying Shenzhen’s development forms. The Local Design Institute (LDI) architects convinced the developer of Shenzhen Red Bay (Figure 4.3) to include a publicly-accessible mixed use zone in the second phase of the development (SFP). Because of this project and similar experimental developments, a 30% commercial land use allowance in residential zones has passed from the ‘Shenzhen Statutory Planning Mixed Land Use Guide’ interim code

documenThe Longthe Shenincreasinbureau rethat is hplanners hierarchyblocks adevelopmBy way incorpora
Figure 4
commerc
nt into the reggang Plannnzhen Long
ng commercezoned the higher profit
required smy of streets s well as a
ment controof the pi
ated into the
4.3 Shenzhecial podium
esidential plaing Bureau a
ggang Univecial floor areland as com
t than commmaller-scale
and a densacross a pul tool the stlot experim
e 2012 mixed
en Red Bay (center, outl
anning sectioalso achieveersiade City ea within a mmercial mixmercial, andland parcel
ser road netublic, pedestatutory plan
mentation prd-use develo
phase 2 (lelined in red).
on of the offed mixed com
(North) thrparcel that
xed-use witd thus desirs than in thtwork. Devestrian right-onning procesrocess, thisopment guid
eft) and pha.
ficial 2012 Smmercial anrough the rt is designah an allowarable for thhe original selopers coulof-way, whss in Longgas mixed usdelines (Tabl
ase 1 (right
Shenzhen Pland residentiareverse straated for resnce for resie develope
statutory plald lease parich was alsang (SFM) (se provisionle 4.3).
t) (FAR 1.8),
5
anning Standal developmeategy: insteaidential usedential floorrs. In exchan, allowing
rcels on adjaso an innovFigures 4.4,n is also b
, showing p
5 - 27
dards. ent in ad of
e, the r area ange, for a
acent vative 4.5). being
public

Figure 4
of the ce
Figure 4
allowancacross bl
5
6
6.5
DY-202
DY-201
DY-203
4.4 Longgangentral busine
4.5 Longgaces for comlocks
4.55
4.5 9.5
2.5DY-03
DY-206
DY-205
DY-204 DY-207
DY-208
g Universiadss district (in
ang Universbined comm
5.
7.5.5
10
DY-2
DY-2DY-211
DY-209
de Town Non orange)
siade Town mercial and
2
7
6
45
5210
DY-101
DY-103
212
DY-104
DY-102
orth before (
North Cenresidential
87
5 10
6
DY-01
DY-118
DY-107
DY-105
DY-106DY-108
(left) and aft
ntral Businearea (show
8
9
74
4
DY-110
DY-114
DY-109
DY-02
DY-111
DY-112
ter (right) the
ess Districtwn in red) a
7
5
6
6DY-113
DY-115
DY-116
DY-117
5
e urban red
t, showing and rights-of
5 - 28
esign
FAR f-way
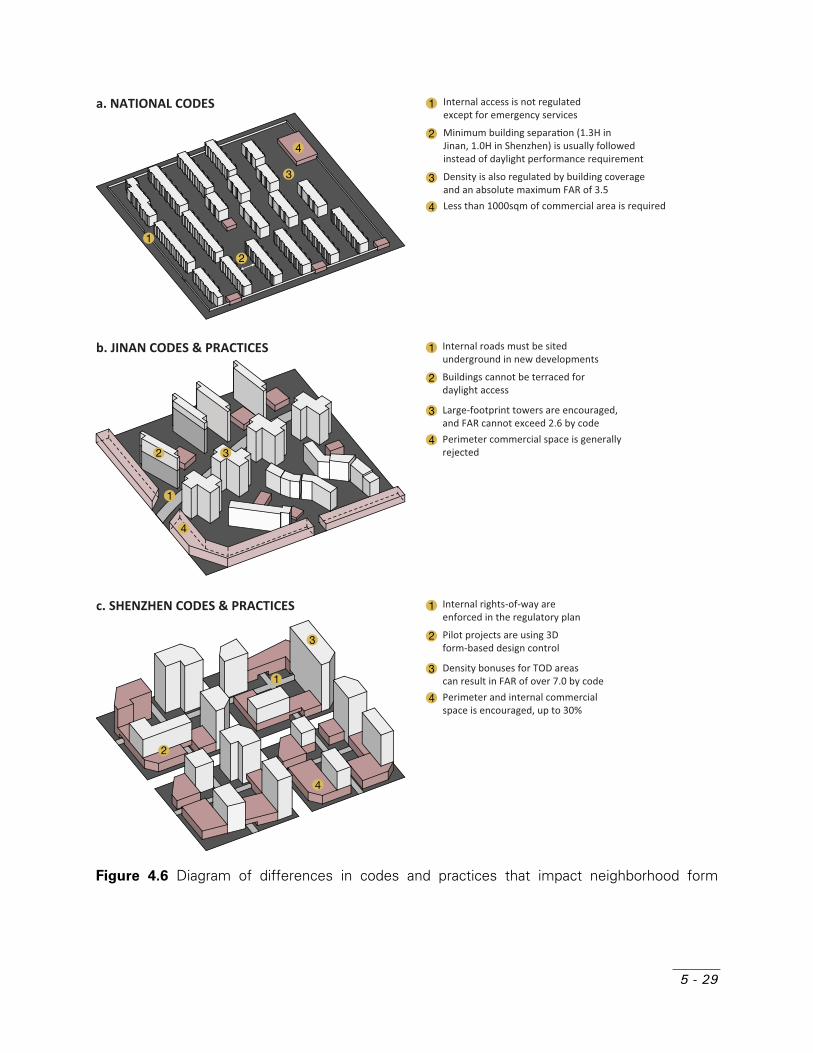
5 - 29
Figure 4.6 Diagram of differences in codes and practices that impact neighborhood form
a. NATIONAL CODES
b. JINAN CODES & PRACTICES
c. SHENZHEN CODES & PRACTICES
Internal access is not regulatedexcept for emergency services
Minimum building separa�on (1.3H in Jinan, 1.0H in Shenzhen) is usually followed instead of daylight performance requirement
Less than 1000sqm of commercial area is required
Density is also regulated by building coverageand an absolute maximum FAR of 3.5
1
2
3
4
Internal roads must be sited underground in new developments
Buildings cannot be terraced fordaylight access
Perimeter commercial space is generally rejected
Large-footprint towers are encouraged,and FAR cannot exceed 2.6 by code
1
2
3
4
Internal rights-of-way are enforced in the regulatory plan
Pilot projects are using 3Dform-based design control
Perimeter and internal commercialspace is encouraged, up to 30%
Density bonuses for TOD areascan result in FAR of over 7.0 by code
1
2
3
4
1
2
3
4
1
2 3
4
1
2
3
4
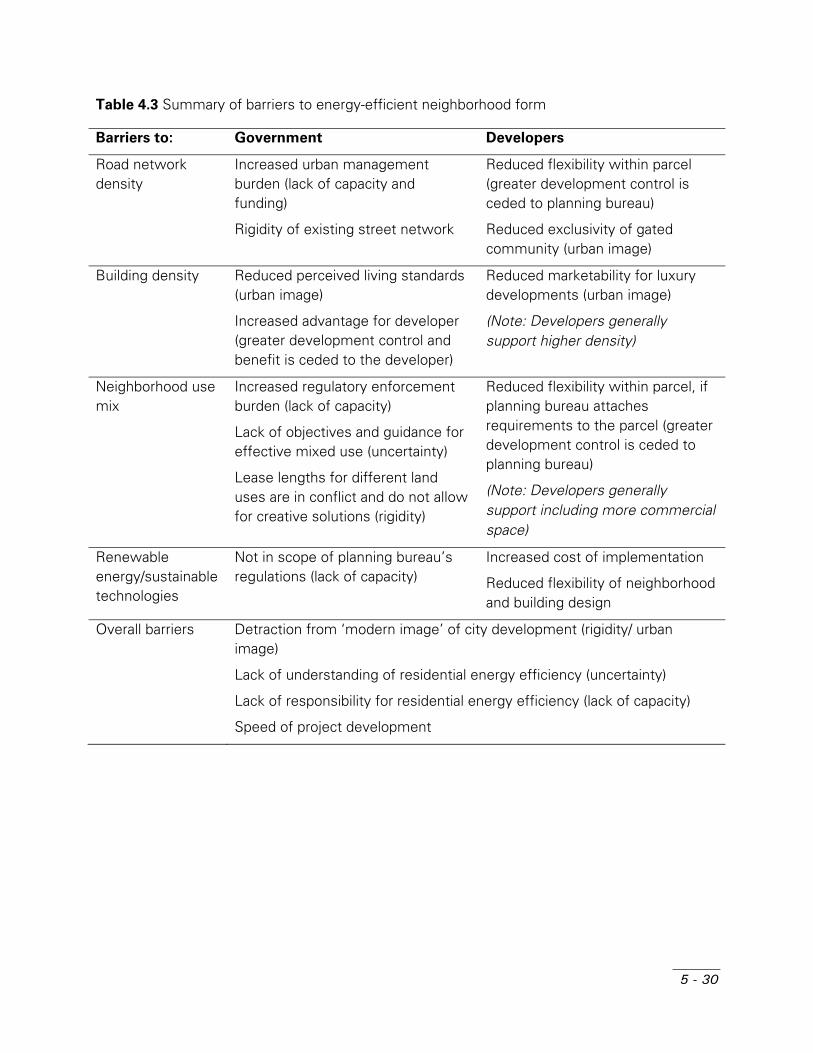
5 - 30
Table 4.3 Summary of barriers to energy-efficient neighborhood form
Barriers to: Government Developers
Road network density
Increased urban management burden (lack of capacity and funding)
Rigidity of existing street network
Reduced flexibility within parcel (greater development control is ceded to planning bureau)
Reduced exclusivity of gated community (urban image)
Building density Reduced perceived living standards (urban image)
Increased advantage for developer (greater development control and benefit is ceded to the developer)
Reduced marketability for luxury developments (urban image)
(Note: Developers generally support higher density)
Neighborhood use mix
Increased regulatory enforcement burden (lack of capacity)
Lack of objectives and guidance for effective mixed use (uncertainty)
Lease lengths for different land uses are in conflict and do not allow for creative solutions (rigidity)
Reduced flexibility within parcel, if planning bureau attaches requirements to the parcel (greater development control is ceded to planning bureau)
(Note: Developers generally support including more commercial space)
Renewable energy/sustainable technologies
Not in scope of planning bureau’s regulations (lack of capacity)
Increased cost of implementation
Reduced flexibility of neighborhood and building design
Overall barriers Detraction from ‘modern image’ of city development (rigidity/ urban image)
Lack of understanding of residential energy efficiency (uncertainty)
Lack of responsibility for residential energy efficiency (lack of capacity)
Speed of project development

5 - 31
5 Guiding Design Codes and Practice toward Energy-Efficient Form Outcomes
From the perspective of the urban planning bureau, how can design changes for energy efficiency be promoted in practice or enforced through regulations? Three classes of development control instrumentscan enable policymakers to implement energy efficiency strategies in a multi-stakeholder design process, to achieve widespread change in neighborhood design outcomes:
Pilot projects: Usually government-led, these unique construction projects can demonstrate either an experimental design strategy that might be incorporated into the city’s planning guidelines (i.e., small-scale street networks), or simply a strategy that might be adopted by the real estate market instead of becoming codified (i.e., double-height balconies that allow the homeowner to construct more floor area).
Prescriptive standards: These standards provide explicit design requirements (i.e., 10m perimeter setbacks or 5,000sq.m. of commercial space per parcel).
Performance-based standards: These standards set a performance goal (i.e., 2 hours of direct sunlight per apartment, or a 15% reduction in energy use compared to a baseline residential tower), but do not designate a specific strategy for achieving the goal. Performance standards instead allow designers to adopt potentially innovative strategies for reaching or exceeding the desired performance.
I also consider how these instruments respond to the constraints of planning codes and practice described by stakeholders in Section 4. These three tools for incrementally transforming development already have a strong basis in planning and city-making practice. Although the effects of current guidelines and standards have been almost universally mediocre, they do have the potential to produce high-quality neighborhoods through systematic experimentation and policy revision.

5 - 32
5.1 Pilot Projects
Each city needs to develop its own demonstration projects, to define the scope of the city’s expectations for neighborhood development. Developers and design institutes will achieve greater compliance with energy efficiency standards and guidelines, if they are first provided with these prototypical implementations. Ideally, these projects should extinguish the city-making administration’s perception that the Modernist development model is the only form that enhances marketability and urban competitiveness. This goal of diversifying the viable development models, and the associated diversity of lifestyles, is gradually being achieved across China, in developments including Shanghai’s Xintiandi and some Beijing SOHO projects (He and Wu 2005; Ren 2011).
The process of policy experimentation, which is usually initiated through pilot projects, may be effective in certain spheres of policy formulation such as healthcare or tax reform, but it has unique implications within the arena of urban development. First, policy innovation through demonstration projects leads to solidified models, especially when the pilot project is a built form. China’s system of developing—then nationally promoting—standardized models often precludes more diverse and locally-appropriate policy solutions. Second, replication of a state-sanctioned model is the most efficient and safe path to success for developers. The tendency of both state institutions and the market to follow successful models, such as the towers-in-the-park form, is difficult to transcend. When one real estate firm makes a profitable innovation in a real estate product, that feature can rapidly become a standard characteristic of the local real estate model. However, developers are unwilling to participate in experiments or pilot projects unless other local projects have succeeded (JRM). The effectiveness of both technologies and strategies is still uncertain, and the associated risk of not recovering the initial investment, whether through higher sales prices or operating cost reduction, is still too great for conventional developers to accept. Even if the technology itself carries a guarantee of effectiveness, the quality of installation is so undependable that developers will perceive that the adoption risk is too high. Therefore, national energy efficiency standards may be the most direct path to overall market adjustment. City-making institutions also replicate the forms and ideologies of large-scale urban development models, leaving few alternatives for the scale and distribution of neighborhood development. This tendency towards diffusion of both the models and their supporting policies is advantageous for the evolution of more tangible, marketable concepts such as transport-oriented development or pedestrian commercial streets. Conversely, pilots that demonstrate financial disadvantages for the developer and higher municipal funding and management costs, such as dense street network demonstration zones in Kunming (JFD) and Shenzhen (SPZ) (Figure 4.5), require a strong initiative from the local government.
One pilot project that demonstrates the Shenzhen government’s interest in innovation within the sustainability agenda, as well as the necessity of government participation in creating new development models, is the Pingshan Green Public Housing project. The LDI, Shenzhen New City (深圳新城市) Planning and Design, produced the first ‘green’ superblock development

5 - 33
model for Shenzhen, attempting to consider both strategies and technologies for reducing energy consumption. This step towards low- and middle-income housing that incorporates sustainable design principles would not have been possible without the government’s partnership and pressure to develop affordable housing, imposed by the central government. As of 2012, the Jinan planning bureau has expressed interest in an ‘ecological housing’ demonstration project but has not made a commitment to start a project. Both the Jinan and Shenzhen planning officials asserted that pilot projects are a prerequisite for the revision of both formal and informal standards (JPD, SPC).
5.2 Prescriptive Standards and Guidelines
In the near term, design codes and guidelines have an important role to play in guiding residential development practices towards energy efficiency. Past instances of developers manipulating design regulations and becoming locked into particular development models demonstrate that conventional developers and designers need the guidance provided by prescriptive standards, in order to change built form outcomes. For example, if the Jinan government issues a document that requires developers to install rooftop solar collectors, then the developer is more likely to consider this change; if designers propose a costly addition, the average developer is unlikely to accept the proposal (JRM). Planning bureaus can most easily implement and enforce energy efficiency guidelines through preexisting urban planning guideline procedures, to continue supporting the legitimacy and regulatory capacity of the agencies. This approach to policy implementation is also complementary to the top-down implementation of performance standards.
Shenzhen has developed a systematic yet flexible procedure for revising guidelines, reflecting its unique stage of spatial and institutional development. This local policymaking process may enable a more rapid transition to energy-efficient form than in the Jinan planning bureau, which is more dependent on the design preferences of individual directors. After its first round of implementing the nationally mandated regulatory plans, however, the Jinan planning bureau has recognized that it should conduct a systematic and localized revision process of the development regulations (JPP, JPD), following both Shenzhen and other major cities in China, such as Chongqing and Kunming.
To encourage mixed use development, one consultant suggested that a split FAR for commercial and residential might be practicable, to ensure that services are balanced and coordinated with all the parcels in a residential zone instead of leaving the final decision on non-residential service provision to individual developers’ preferences (JFD). New requirements in the regulatory plan, such as more descriptive FAR requirements, should be accompanied by revisions to restrictive and problematic existing standards. For example, planners will need to reevaluate building setbacks, defined by current practice in Jinan and by code in Shenzhen, in order to improve street designs. Shenzhen has already experienced the detrimental effects of
5 - 34
wide setbacks, and code writers are working to eliminate the setback requirement for both new development and urban revitalization projects in future versions of the planning code, although setbacks of 10 meters or more now remain in effect (SPD).
5.3 Performance Standards
Performance standards may ultimately provide city administrators with effective, flexible tools for implementing energy-based neighborhood designs. Energy policymakers can then follow a top-down approach to standards setting and administration, by establishing a maximum neighborhood energy consumption value. Because the concept of performance standards differs from most current planning regulations, which favor prescriptive design standards, the effectiveness of this policy instrument is difficult to measure in current development processes. Performance-based design methods can also be undermined by the tendency to replicate successful physical models, potentially resulting in the same design and planning monoculture as the current superblock development model. The building-level energy performance standards, designated in MOHURD's Regulations for Energy Efficiency in Civil Buildings, are a precedent for regulating neighborhood-scale energy efficiency. However, these building standards have already suffered from an overdependence on formulaic construction solutions for building envelopes; most building energy efficiency compliance reviews have been reduced to a one-page checklist of wall assembly and HVAC equipment components.
Because of the government’s sensitivity to regulating energy consumption in daily life at the current stage of China's development, a number of intermediate steps may be necessary to reach a neighborhood energy performance standard, beginning with less stringent prescriptive standards as well as energy consumption reporting similar to New York City's reporting requirements for per-building energy use. In a study of effective implementations of the building energy efficiency policies, Zhong (2009) proposes that the central government should establish criteria and standards in addition to incentive policies for the local governments, and the local authorities should in turn produce an implementation plan, incentivize market compliance, and monitor the outcomes. To guide developers’ compliance with new energy performance standards for comprehensive residential development, the government may also need to bundle prescriptive standards with incentives (Table 5.2) that overcome burdens on both the municipality and the developer (Table 5.1). An interactive tool such as the Energy Proforma© will also be important for capacity building, by providing feedback to designers and developers on the range of design choices that can achieve the energy performance standard (MIT and Tsinghua 2012). In contrast to balanced incentives and regulations, the Western development control strategies of exactions and impact fees may only be feasible for land parcels in the most profitable locations (Stein 2012, 136), especially for cites such as Jinan that are still promoting widespread development.

5 - 35
In addition to advocacy and regulation, the urban planning bureau also serves as a repository of knowledge for best practices. In Shenzhen, the district planning bureaus are developing innovative regulatory plans, then diffusing these strategies through the city urban planning committee.
Table 5.1 Package of strategies that balance between interests of the government and developers
Government burden Developer burden
Road network density increases and management
Building density increases
Mixed use guidelines
Road network and access requirements
Mixed uses management
Renewable energy
Energy-efficient technology
Table 5.2 Potential regulations and incentives for residential development
Government regulations Developer incentives
Private road networks with public access (implemented in Shenzhen)
Form-based codes (experimentation in Shenzhen)
Mixed use guidelines (proposed but poorly implemented in some cities)
Building density bonuses (commonly practiced in China)
Renewable energy and energy-efficient technology subsidies (proposed but poorly implemented in some cities)
Less stringent daylighting requirements (requires better daylighting performance review by planning bureau)
5.4 Conclusion
In this paper, I have applied the challenges posed by ‘city-making’ agendas and development control in China to the question of how to encourage energy-efficient residential development. The strong regional differences that have evolved in urban planning practices, as well as the intensifying diversification of real estate development models across China, create a challenging regulatory environment that cannot evenly absorb top-down directives nor diffuse laterally across local administrations. All three of the energy efficiency strategies for residential form can and have been achieved in specific city-making contexts across China, but none of them is widely accepted by either regulatory enforcement or practice. At the same time, the urban planning official may cite a range of regulations and practices to prevent a residential

5 - 36
design from achieving a more energy-efficient outcome, if the design change is inconvenient or of little benefit to the stakeholders in a project’s development phase.
The two cases of residential development in Jinan and Shenzhen demonstrate that policymakers need to take different approaches to implementing energy-efficient changes in built form outcomes, within urban administrations at different stages of city-making. Jinan remains a rapidly-developing urban environment in which entrepreneurial and administrative urbanization agendas still constrain innovation in residential development, and changes depend on the administration’s interests and capacity. Meanwhile, Shenzhen is beginning to demonstrate its sustainable urbanization objectives in both pilot projects and design codes. The Shenzhen case also shows that urban planning bureaus are becoming both proactive problem-solvers and agents of change within the institutional environment of ‘city-making’. Innovations include both changes in planning practices as well as new lateral connections between urban planning, land management, transportation, and urban management departments, which lead to more flexible and integrated formulations of codes and standards.
The objective of energy-efficient form provides a useful trajectory for changing development patterns, but researchers need to develop better and more appropriate guidance to policymakers, in terms explicitly relevant to fast-paced development in urban China, for each of the elements of residential planning discussed in this paper. To support energy-efficient transportation development, which includes viable financing schemes and design handbooks for small streets and alternative transport, convincing arguments and studies of small-block development should be targeted at all stakeholders in the urban design and residential planning process. Alternative strategies for increasing development density, to ensure that failed models are not repeated and to encourage upmarket private developers to consider higher-density solutions, need to be considered in combination with improved tools and knowledge for daylight access requirements and the impact of density on urban services. Research on the recurring question of how much mixed use floor area a residential development can support, and what the composition of those services should be, must be accompanied by studies of effective post-occupancy management schemes and small-scale socioeconomic planning. Alternatives to the street-bounded parcelization and single-developer residential development delivery should also be part of the feasibility analysis for each of these design variables. If credible guidance is available to planning bureaus and practitioners, then first- and second-tier cities can lead the transformation of residential development into more energy-efficient and livable forms.
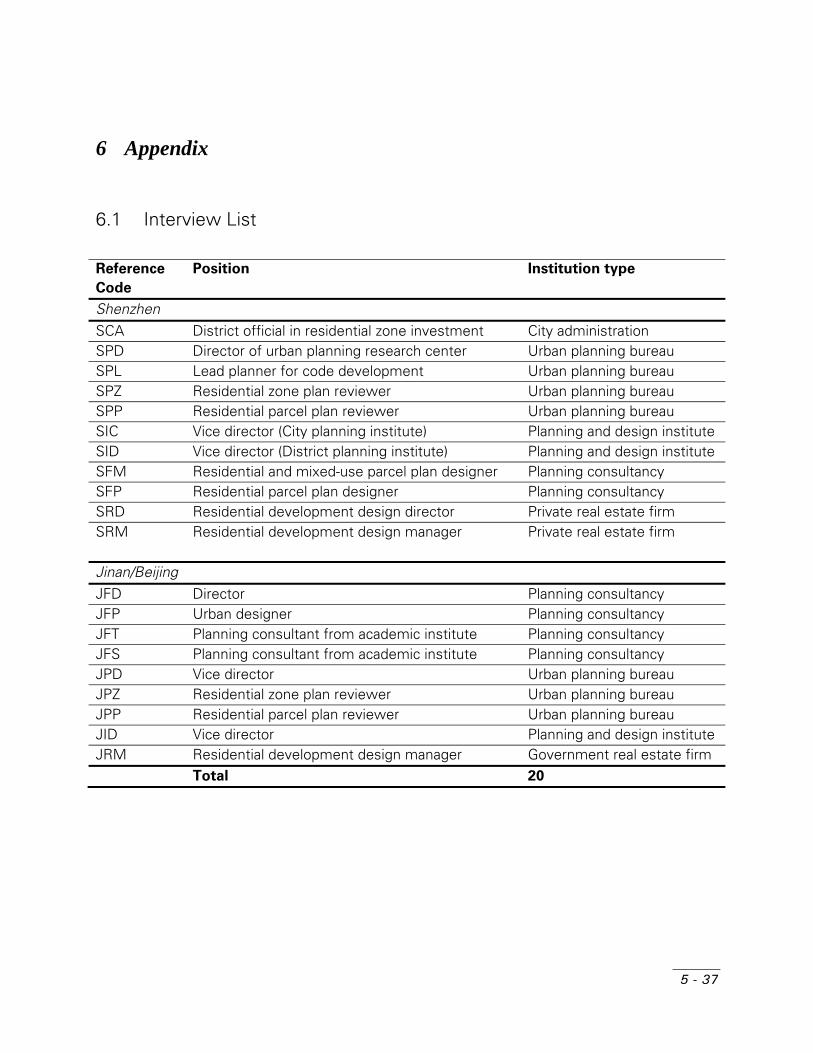
5 - 37
6 Appendix
6.1 Interview List
Reference
Code
Position Institution type
Shenzhen SCA District official in residential zone investment City administration SPD Director of urban planning research center Urban planning bureau SPL Lead planner for code development Urban planning bureau SPZ Residential zone plan reviewer Urban planning bureau SPP Residential parcel plan reviewer Urban planning bureau SIC Vice director (City planning institute) Planning and design institute SID Vice director (District planning institute) Planning and design institute SFM Residential and mixed-use parcel plan designer Planning consultancy SFP Residential parcel plan designer Planning consultancy SRD Residential development design director Private real estate firm SRM Residential development design manager Private real estate firm
Jinan/Beijing JFD Director Planning consultancy JFP Urban designer Planning consultancy JFT Planning consultant from academic institute Planning consultancy JFS Planning consultant from academic institute Planning consultancy JPD Vice director Urban planning bureau JPZ Residential zone plan reviewer Urban planning bureau JPP Residential parcel plan reviewer Urban planning bureau JID Vice director Planning and design institute JRM Residential development design manager Government real estate firm Total 20

5 - 38
6.2 Bibliography
Abramson, Daniel. 2007. “The Dialectics of Urban Planning in China.” In China’s Emerging Cities: The Making of New Urbanism, edited by Fulong Wu, 66–86. Routledge.
Barnett, Jonathan. 1982. An Introduction to Urban Design. New York: Harper & Row. Ben-Joseph, Eran. 2005. The Code of the City: Standards and the Hidden Language of Place
Making. Cambridge MA: MIT Press. Bressand, F., D. Farrell, F. Morin, J. Remes, J. Rosenfeld, J. Woetzel, and J. Yu. 2007.
“Leapfrogging to Higher Energy Productivity in China.” McKinsey Global Institute. Bruton, Michael J., Sheila G. Bruton, and Yu Li. 2005. “Shenzhen: Coping with Uncertainties in
Planning.” Habitat International 29 (2) (June): 227–243. doi:10.1016/j.habitatint.2003.09.004.
Charmaz, K. 2006. Constructing Grounded Theory: A Practical Guide through Qualitative Analysis. Sage Publications Ltd.
Chen, Liping. 2011. “Public Awareness and Performance Relating to the Implementation of a Low-Carbon Economy in China: A Case Study from Zhengzhou.” Low Carbon Economy 02: 54–61. doi:10.4236/lce.2011.22009.
Chien, S.S., and B. Ho. 2011. “Globalization and the Local Government Learning Process in post-Mao China: a Transnational Perspective.” Global Networks 11 (3): 315–333.
Duckett, Jane. 1998. The Entrepreneurial State in China: Real Estate and Commerce Departments in Reform Era Tianjin. Psychology Press.
Feng, Dianshu, Benjamin K. Sovacool, and Khuong Minh Vu. 2010. “The Barriers to Energy Efficiency in China: Assessing Household Electricity Savings and Consumer Behavior in Liaoning Province.” Energy Policy 38 (2) (February): 1202–1209. doi:10.1016/j.enpol.2009.11.012.
Feng, Sun. 2009. “From Technical Rationality to Policy Attribute: Floor Area Ration Regulation in Urban Planning Administration.” City Planning Review 11.
Friedmann, John. 2005. China’s Urban Transition. Minneapolis: University of Minnesota Press. Hald, Mary. 2009. “Sustainable Urban Development and the Chinese Eco-City”. Fridtjof
Nansen Institute. Han, S.S., and Y. Wang. 2003. “The Institutional Structure of a Property Market in Inland China:
Chongqing.” Urban Studies 40 (1): 91–112. Handy, S. L, M. G Boarnet, R. Ewing, and R. E Killingsworth. 2002. “How the Built Environment
Affects Physical Activity: Views from Urban Planning.” American Journal of Preventive Medicine 23 (2): 64–73.
Harvey, D. 1989. “From Managerialism to Entrepreneurialism: The Transformation in Urban Governance in Late Capitalism.” Geografiska Annaler. Series B. Human Geography: 3–17.
He, S., and F. Wu. 2005. “Property-led Redevelopment in Post-reform China: a Case Study of Xintiandi Redevelopment Project in Shanghai.” Journal of Urban Affairs 27 (1): 1–23.

5 - 39
Heilmann, S., and E. J Perry. 2011. Mao’s Invisible Hand: The Political Foundations of Adaptive Governance in China. Harvard University Asia Center.
Li, F., D. Hu, X. Liu, R. Wang, W. Yang, and J. Paulussen. 2008. “Comprehensive Urban Planning and Management at Multiple Scales Based on Ecological Principles: a Case Study in Beijing, China.” The International Journal of Sustainable Development & World Ecology 15 (6): 524–533.
Lin, G.C.S., and S.P.S. Ho. 2005. “The State, Land System, and Land Development Processes in Contemporary China.” Annals of the Association of American Geographers 95 (2): 411–436.
Liu, Yungang, Guanwen Yin, and Laurence J.C. Ma. 2011. “Local State and Administrative Urbanization in Post-reform China: A Case Study of Hebi City, Henan Province.” Cities (September). doi:10.1016/j.cities.2011.08.003.
Lü, Junhua, Peter G. Rowe, and Jie Zhang. 2001. Modern Urban Housing in China, 1840-2000. Prestel.
MIT, and Tsinghua. 2012. “Making the Clean Energy City in China.” http://energyproforma.scripts.mit.edu/documents/MIT_Clean_Energy_City_Year_2_Report_web.pdf.
Ng, M.K., and W.S. Tang. 2004. “Theorising Urban Planning in a Transitional Economy: The Case of Shenzhen, People’s Republic of China.” Town Planning Review 75 (2): 173–203.
Permana, A.S., R. Perera, and S. Kumar. 2008. “Understanding Energy Consumption Pattern of Households in Different Urban Development Forms: A Comparative Study in Bandung City, Indonesia.” Energy Policy 36 (11) (November): 4287–4297. doi:10.1016/j.enpol.2008.08.005.
Ren, Xuefei. 2011. Building Globalization: Transnational Architecture Production in Urban China. University of Chicago Press.
Sadownik, Bryn, and Mark Jaccard. 2001. “Sustainable Energy and Urban Form in China: The Relevance of Community Energy Management.” Energy Policy 29 (1) (January): 55–65. doi:10.1016/S0301-4215(00)00105-1.
Scott, James C. 1998. Seeing Like a State: How Certain Schemes to Improve the Human Condition Have Failed. Yale University Press.
Shim, Gyo-Eon, Sung-Mo Rhee, Kun-Hyuck Ahn, and Sung-Bong Chung. 2006. “The Relationship Between the Characteristics of Transportation Energy Consumption and Urban Form.” Annals of Regional Science 40 (2) (June): 351–367. doi:10.1007/s00168-005-0051-5.
Stein, Gregory M. 2012. Modern Chinese Real Estate Law. Surrey, United Kingdom: Ashgate. Tang, Peng. 2010. “Partial Adjustment of Regulatory Detailed Planning.” City Planning Review
34 (7). Tian, Li, and Wenjun Ma. 2009. “Government Intervention in City Development of China: A Tool
of Land Supply.” Land Use Policy 26 (3) (July): 599–609. doi:10.1016/j.landusepol.2008.08.012.
Tian, Li, and Tiyan Shen. 2011. “Evaluation of Plan Implementation in the Transitional China: A Case of Guangzhou City Master Plan.” Cities 28 (1) (February): 11–27. doi:10.1016/j.cities.2010.07.002.
5 - 40
Tiesdell, Steve, and David Adams. 2011. Urban Design in the Real Estate Development Process. 1st ed. Wiley-Blackwell.
Tomba, Luigi. 2010. “Gating Urban Spaces in China: Inclusion, Exclusion and Government.” In Gated Communities: Social Sustainability in Contemporary and Historical Gated Developments, edited by Samer Bagaeen and Ola Uduku. Earthscan.
Tsai, K.S. 2006. “Adaptive Informal Institutions and Endogenous Institutional Change in China.” World Politics 59 (01): 116–141.
Wang, R. 2009. “Sustainable Urban Development in China.” Watts, Jonathan. 2007. “Minister Rails at China, Land of a Thousand Identical Cities.” The
Guardian, June 12, sec. World news. http://www.guardian.co.uk/world/2007/jun/12/china.travel.
Woetzel, J., J. Devan, L. Jordan, S. Negri, and D. Farrell. 2008. “Preparing for China’s Urban Billion.” McKinsey Global Institute.
Wright, K. 2010. “The Relationship Between Housing Density and Built Form Energy Use.” Environment Design Guide 65: 1–8.
Wu, Fulong. 2002. “China’s Changing Urban Governance in the Transition Towards a More Market-oriented Economy.” Urban Studies 39 (7): 1071.
———. 2009. “Globalization, the Changing State, and Local Governance in Shanghai.” In Shanghai Rising: State Power and Local Transformations in a Global Megacity, edited by Xiangming Chen. U of Minnesota Press.
Wu, Fulong, Jiang Xu, and Anthony G. O. Yeh. 2007. Urban Development in Post-reform China: State, Market, and Space. Taylor & Francis.
Xu, Zhongping. 2010. “Institutional Design of Regulatory Detailed Planning.” City Planning Review 34 (5).
Yin, Robert K. 2009. Case Study Research: Design and Methods. SAGE. Zhang, X., L. Shen, Y. Wu, and G. Qi. 2011. “Barriers to Implement Green Strategy in the
Process of Developing Real Estate Projects.” The Open Waste Management Journal 4: 33–37.
Zhang, Xiaoling, Gefforey Q.P. Shen, Jingjun Feng, and Yuzhe Wu. 2012. “Delivering a Low-carbon Community in China: Technology Vs. Strategy?” Habitat International (0). doi:10.1016/j.habitatint.2011.12.010.
Zhao, Pengjun. 2011. “Managing Urban Growth in a Transforming China: Evidence from Beijing.” Land Use Policy 28 (1) (January): 96–109. doi:10.1016/j.landusepol.2010.05.004.
Zheng, N., N. Zhou, L. Price, and S. Ohshita. 2011. “A Low Carbon Development Guide for Local Government Actions in China”. Lawrence Berkeley National Laboratory.
Zhong, Y., W.G. Cai, Y. Wu, and H. Ren. 2009. “Incentive Mechanism Design for the Residential Building Energy Efficiency Improvement of Heating Zones in North China.” Energy Policy 37 (6) (June): 2119–2123. doi:10.1016/j.enpol.2008.11.038.
Zhu, J. 2004. “Local Developmental State and Order in China’s Urban Development During Transition.” International Journal of Urban and Regional Research 28 (2): 424–447.