Lululemon LULU FAIRLY VALUED Buying Index™ 6 Value Rating
16
Valuentum Retail Equity Research Ratings as of 10-Sep-2021 Data as of 9-Sep-2021 Buying Index™ 7 Value Rating Economic Castle Very Attractive Investment Considerations DCF Valuation Relative Valuation Stock Chart (weekly) ValueCreation™ ValueRisk™ ValueTrend™ Cash Flow Generation Financial Leverage Growth Technical Evaluation Relative Strength Money Flow Index (MFI) Upside/Downside Volume (U/D) Near-term Technical Support, 10-week MA DCF = Discounted Cash Flow; MFI, U/D = Please see glossary. MA = Moving Average Business Quality ValueCreation™ ValueRisk™ Very Poor Poor Good Excellent Company Vitals Investment Highlights Market Cap (USD) $55,059 Avg Weekly Vol (30 wks) 5,541 30-week Range (USD) 269.28 - 434.22 Valuentum Sector Next Generation 5-week Return 3.6% 13-week Return 20.8% 30-week Return 27.9% Dividend Yield % 0.0% Firms that generate economic profits with little operating variability score near the top right of the matrix. Dividends per Share 0.00 Relative Valuation Forward P/E PEG Price / FV Forward Dividend Payout Ratio 0.0% Monster Beverage 36.3 2.7 95.4% Est. Normal Diluted EPS 11.93 Roku 720.3 NMF 97.3% P/E on Est. Normal Diluted EPS 35.3 Wayfair 60.1 7.5 86.7% Est. Normal EBITDA 2,428 Zoom Video 64.5 3.5 83.0% Forward EV/EBITDA 36.1 Peer Median 62.3 3.5 91.0% EV/Est. Normal EBITDA 22.2 Lululemon 60.7 2.8 101.6% Forward Revenue Growth (5-yr) 18.9% Price / FV = Current Stock Price divided by Estimated Fair Value Forward EPS Growth (5-yr) 33.0% Financial Summary Projected NMF = Not Meaningful; Est. = Estimated; FY = Fiscal Year Fiscal Year End: Jan-20 Jan-21 Jan-22 Returns Summary 3-year Historical Average Revenue 3,979 4,402 5,912 Return on Equity 32.0% Revenue, YoY% 21.0% 10.6% 34.3% Return on Assets 21.2% Operating Income 889 850 1,247 ROIC, with goodwill 76.3% Operating Margin % 22.3% 19.3% 21.1% ROIC, without goodwill 83.2% Net Income 646 589 898 ROIC = Return on Invested Capital; NMF = Not Meaningful Net Income Margin % 16.2% 13.4% 15.2% Leverage, Coverage, and Liquidity Diluted EPS 4.93 4.50 6.93 In Millions of USD Diluted EPS, YoY % 36.5% -8.7% 53.9% Total Debt 0 Free Cash Flow (CFO-capex) 386 574 907 Net Debt -1,151 Free Cash Flow Margin % 9.7% 13.0% 15.3% Total Debt/EBITDA 0.0 In Millions of USD (except for per share items) Net Debt/EBITDA NMF LARGE-C EBITDA/Interest Excellent GOOD Current Ratio 2.4 Quick Ratio 1.4 Lululemon LULU FAIRLY VALUED Low LOW • Lululemon Athletica is a designer and retailer of technical athletic apparel operating primarily in North America and Australia. Its yoga-inspired apparel is marketed under the 'lululemon athletica' and 'ivivva' athletica brand names. The firm continues to drive global brand awareness. It was founded in the late 1990s and is based in Vancouver, Canada. Structure of the Luxury Goods Industry Luxury goods firms differentiate themselves based on brand name, perception, and quality in order to generate excess returns on invested capital through the economic cycle. Building a large, successful luxury brand is difficult, leaving those that possess them with intangible competitive advantages that are not easily overcome by new entrants. Growth in emerging middle classes and China will be the key demand drivers going forward, though the strongest brands will also grow successfully via market share gains. Though changes in consumer preferences should be watched closely, we like the structure of the group. • Lululemon acquired MIRROR, a home fitness company that provides digital workout offerings via a large screen, for ~$0.5 billion in cash through a deal that closed in July 2020. This acquisition supports Lululemon's long-term growth trajectory. 399.00 High EXCELLENT MEDIUM STRONG NEUTRAL Very High The information and data contained in this report is not represented or warranted to be timely, complete, accurate, or correct. This report is for informational purposes only and should not be considered a solicitation to buy or sell a security. Before acting on any information in this report, you should consider whether the information is suitable for your particular circumstances and, if necessary, seek professional advice. Assumptions, opinions, and estimates are based on our judgment as of the date of the report and are subject to change without notice. Valuentum is not responsible for any errors or omissions or for results obtained from the use of this report. Redistribution is prohibited without written permission. To license Valuentum research, contact us at [email protected]. AGGRESSIVE STRONG NEGATIVE Fair Value Range We raised our fair value estimate for Lululemon as its impressive growth runway is underpinned by its stellar omni-channel selling capabilities and its push into the digital fitness service provider space. Investment Style Industry $414.00 ATTRACTIVE LARGE-CAP GROWTH Next Generation Disruptive Innovation FAIRLY VALUED Sector $290.00 - $538.00 Estimated Fair Value BULLISH Medium • Lululemon’s omni-channel selling capabilities are stellar, and its e-commerce business held up incredibly well during the worst of the COVID-19 pandemic. It is ramping up its marketing efforts towards men, and sales of its products geared towards men and women have grown at a brisk pace in recent fiscal years. • Lululemon underscores the shift in consumption habits occurring in the US, such as the rise of athleisure wear. The firm’s revenue growth drivers include international expansion, product innovation, and digital initiatives. Sourcing, supply chain benefits, and building up a large digital subscription business represent some of its profit growth drivers. ----- Actual ----- • Our cash flow models assume Lululemon’s revenues grow at a brisk pace and that the firm realizes meaningful margin expansion going forward. Should it stumble for any reason, that would significantly pressure Lululemon’s intrinsic value. The week with the highest trading volume out of the last 30 weeks was a week of heavy selling, or distribution (red bar). NMF = Not Meaningful DETERIORATING 1 Visit us at www.valuentum.com 229.00 279.00 329.00 379.00 429.00 0 10,000,000 20,000,000 30,000,000 40,000,000 50,000,000 Page 1
Transcript of Lululemon LULU FAIRLY VALUED Buying Index™ 6 Value Rating

Valuentum Retail Equity Research Ratings as of 10-Sep-2021 Data as of 9-Sep-2021
Buying Index™ 7 Value RatingEconomic CastleVery Attractive
Investment ConsiderationsDCF ValuationRelative Valuation
Stock Chart (weekly) ValueCreation™ValueRisk™ValueTrend™Cash Flow GenerationFinancial LeverageGrowthTechnical EvaluationRelative StrengthMoney Flow Index (MFI)Upside/Downside Volume (U/D)Near-term Technical Support, 10-week MADCF = Discounted Cash Flow; MFI, U/D = Please see glossary. MA = Moving Average
Business Quality ValueCreation™
ValueRisk™ Very Poor Poor Good ExcellentCompany Vitals Investment HighlightsMarket Cap (USD) $55,059Avg Weekly Vol (30 wks) 5,54130-week Range (USD) 269.28 - 434.22Valuentum Sector Next Generation5-week Return 3.6%13-week Return 20.8%30-week Return 27.9%Dividend Yield % 0.0% Firms that generate economic profits with little operating variability score near the top right of the matrix.
Dividends per Share 0.00 Relative Valuation Forward P/E PEG Price / FV
Forward Dividend Payout Ratio 0.0% Monster Beverage 36.3 2.7 95.4%Est. Normal Diluted EPS 11.93 Roku 720.3 NMF 97.3%P/E on Est. Normal Diluted EPS 35.3 Wayfair 60.1 7.5 86.7%Est. Normal EBITDA 2,428 Zoom Video 64.5 3.5 83.0%Forward EV/EBITDA 36.1 Peer Median 62.3 3.5 91.0%EV/Est. Normal EBITDA 22.2 Lululemon 60.7 2.8 101.6%Forward Revenue Growth (5-yr) 18.9% Price / FV = Current Stock Price divided by Estimated Fair Value
Forward EPS Growth (5-yr) 33.0% Financial Summary ProjectedNMF = Not Meaningful; Est. = Estimated; FY = Fiscal Year
Fiscal Year End: Jan-20 Jan-21 Jan-22
Returns Summary 3-year Historical Average Revenue 3,979 4,402 5,912Return on Equity 32.0% Revenue, YoY% 21.0% 10.6% 34.3%Return on Assets 21.2% Operating Income 889 850 1,247ROIC, with goodwill 76.3% Operating Margin % 22.3% 19.3% 21.1%ROIC, without goodwill 83.2% Net Income 646 589 898ROIC = Return on Invested Capital; NMF = Not Meaningful Net Income Margin % 16.2% 13.4% 15.2%Leverage, Coverage, and Liquidity Diluted EPS 4.93 4.50 6.93In Millions of USD Diluted EPS, YoY % 36.5% -8.7% 53.9%Total Debt 0 Free Cash Flow (CFO-capex) 386 574 907Net Debt -1,151 Free Cash Flow Margin % 9.7% 13.0% 15.3%Total Debt/EBITDA 0.0 In Millions of USD (except for per share items)
Net Debt/EBITDA NMF LARGE-CEBITDA/Interest Excellent GOODCurrent Ratio 2.4Quick Ratio 1.4
Lululemon LULU FAIRLY VALUED
Low
LOW
• Lululemon Athletica is a designer and retailer oftechnical athletic apparel operating primarily in NorthAmerica and Australia. Its yoga-inspired apparel ismarketed under the 'lululemon athletica' and 'ivivva'athletica brand names. The firm continues to driveglobal brand awareness. It was founded in the late1990s and is based in Vancouver, Canada.
Structure of the Luxury Goods IndustryLuxury goods firms differentiate themselves based on brand name, perception, and quality in order to generate excess returns on invested capital through the economic cycle. Building a large, successful luxury brand is difficult, leaving those that possess them with intangible competitive advantages that are not easily overcome by new entrants. Growth in emerging middle classes and China will be the key demand drivers going forward, though the strongest brands will also grow successfully via market share gains. Though changes in consumer preferences should be watched closely, we like the structure of the group.
• Lululemon acquired MIRROR, a home fitnesscompany that provides digital workout offerings via alarge screen, for ~$0.5 billion in cash through a dealthat closed in July 2020. This acquisition supportsLululemon's long-term growth trajectory.
399.00
High
EXCELLENTMEDIUM
STRONGNEUTRAL
Very High
The information and data contained in this report is not represented or warranted to be timely, complete, accurate, or correct. This report is for informational purposes only and should not be considered a solicitation to buy or sell a security. Before acting on any information in this report, you should consider whether the information is suitable for your particular circumstances and, if necessary, seek professional advice. Assumptions, opinions, and estimates are based on our judgment as of the date of the report and are subject to change without notice. Valuentum is not responsible for any errors or omissions or for results obtained from the use of this report. Redistribution is prohibited without written permission. To license Valuentum research, contact us at [email protected].
AGGRESSIVE
STRONGNEGATIVE
Fair Value Range
We raised our fair value estimate for Lululemon as its impressive growth runway is underpinned by its stellar omni-channel selling capabilities and its push into the digital fitness service provider space.
Investment Style Industry $414.00
ATTRACTIVE
LARGE-CAP GROWTH Next Generation Disruptive Innovation
FAIRLY VALUED
Sector $290.00 - $538.00
Estimated Fair Value
BULLISH
Medium
• Lululemon’s omni-channel selling capabilities arestellar, and its e-commerce business held up incrediblywell during the worst of the COVID-19 pandemic. It isramping up its marketing efforts towards men, andsales of its products geared towards men and womenhave grown at a brisk pace in recent fiscal years.
• Lululemon underscores the shift in consumptionhabits occurring in the US, such as the rise ofathleisure wear. The firm’s revenue growth driversinclude international expansion, product innovation,and digital initiatives. Sourcing, supply chain benefits,and building up a large digital subscription businessrepresent some of its profit growth drivers.
----- Actual -----
• Our cash flow models assume Lululemon’s revenuesgrow at a brisk pace and that the firm realizesmeaningful margin expansion going forward. Shouldit stumble for any reason, that would significantlypressure Lululemon’s intrinsic value.
The week with the highest trading volume out of the last 30 weeks was a week of heavy selling, or distribution (red bar).
NMF = Not Meaningful
DETERIORATING
1
Visit us at www.valuentum.com
229.00
279.00
329.00
379.00
429.00
0
10,000,000
20,000,000
30,000,000
40,000,000
50,000,000
Page 1

Valuentum Retail Equity Research (10=best) Data as of 9-Sep-2021
Buying Index™ 7 Value RatingEconomic CastleVery Attractive
Economic Profit Analysis
ValueCreation™ EXCELLENT Return on Invested Capital (ROIC)
ROIC - WACC Spread, 3-year historical average 74.0%ROIC - WACC Spread, 5-year projected average 107.0%These spreads equal the firm's annual average ROIC (excluding goodwill) less its WACC.
ValueTrend™ NEGATIVE
Weighted Average Cost of Capital (WACC) The graph above shows the firm's ROIC (excluding goodwill) compared with historical averages and its WACC.
ROIC CalculationFiscal Year End: Jan-19 Jan-20 Jan-21
Earnings before InterestOperating Income after Depreciation 706 889 850- Adjusted Taxes (at 28% of EBIT) 198 249 238+ Amortization 0 0 5+ Non-cash Operating Items 137 -99 29- Minority Interest 0 0 0Earnings before Interest 645 541 646
Cost of Equity Invested CapitalRisk Free Rate Assumption Inventories 405 519 647Fundamental Beta (ERP multiplier) + Receivables 36 40 62Estimated Equity Risk Premium + Current Deferred Income Taxes 0 0 0Cost of Equity Assumption + Other Current Assets 107 156 264
+ Property, Plant and Equipment, Net 567 672 746After-tax Cost of Debt + Goodwill, Net (Cost in Excess) 24 24 387Risk Free Rate Assumption + Intangibles 0 0 80Synthetic Credit Spread + Non Current Deferred Income Taxes 27 31 7Cost of Debt Assumption - Accounts Payable 163 106 180Cash Tax Rate Assumption - Other Current Liabilities 125 269 357After-tax Cost of Debt Assumption
Invested Capital, with goodwill 878 1,067 1,656Cost of Preferred Stock Invested Capital, without goodwill 854 1,043 1,269Preferred DividendsValue of Preferred Stock Return on Invested Capital, with goodwill 95.6% 72.8% 60.6%Cost of Preferred Assumption Return on Invested Capital, without goodwill 99.2% 75.2% 75.1%
In Millions of USD
Weighted Average Cost of Capital (WACC)ERP = Equity Risk Premium
Lululemon LULU FAIRLY VALUED
0
NA28.0%
0NA
9.2%
NA
Note: Valuentum may provide an adjusted ROIC measure to better reflect the economic substance of a company's operations, as in the case of companies with negative invested capital.
Disruptive Innovation
4.3%NA
---------- Actual ----------
4.3%
9.2%
$414.00 $290.00 - $538.00 LARGE-CAP GROWTH
Lululemon receives a ValueTrend™ rating of NEGATIVE, which is based on thecompany's trailing three-year performance. The firm's ROIC (excluding goodwill) fellto 75.1% last year from its trailing 3-year average of 83.2%. We expect ROIC(excluding goodwill) to be in the ballpark of about 131% by the end of our discreteforecast period, with downside risk to about 110% over that time period.
The best measure of a firm's ability to create value for shareholders is expressed bycomparing its return on invested capital (ROIC) with its weighted average cost ofcapital (WACC). The gap or difference between ROIC and WACC is called the firm'seconomic profit spread. Lululemon's 3-year historical return on invested capital(without goodwill) is 83.2%, which is above the estimate of its cost of capital of 9.2%.As such, we assign the firm a ValueCreation™ rating of EXCELLENT. In the chart tothe right, we show the probable path of ROIC in the years ahead based on the estimatedvolatility of key drivers behind the measure. The solid grey line reflects the most likelyoutcome, in our opinion, and represents the scenario that results in our fair valueestimate.
6.5%
Next Generation Estimated Fair Value Fair Value Range Investment Style Sector Industry
0.8
The information and data contained in this report is not represented or warranted to be timely, complete, accurate, or correct. This report is for informational purposes only and should not be considered a solicitation to buy or sell a security. Before acting on any information in this report, you should consider whether the information is suitable for your particular circumstances and, if necessary, seek professional advice. Assumptions, opinions, and estimates are based on our judgment as of the date of the report and are subject to change without notice. Valuentum is not responsible for any errors or omissions or for results obtained from the use of this report. Redistribution is prohibited without written permission. To license Valuentum research, contact us at [email protected].
152.5%131.5%
99.2%
75.2% 75.1%
110.4%
WACC, 9.2%0.0%
20.0%
40.0%
60.0%
80.0%
100.0%
120.0%
140.0%
160.0%
180.0%
100.0%
0.0% Equity
Debt
Preferred
Capital Structure
Page 2
Valuentum Retail Equity Research (10=best) Data as of 9-Sep-2021
Buying Index™ 7 Value RatingEconomic CastleVery Attractive
Growth Analysis
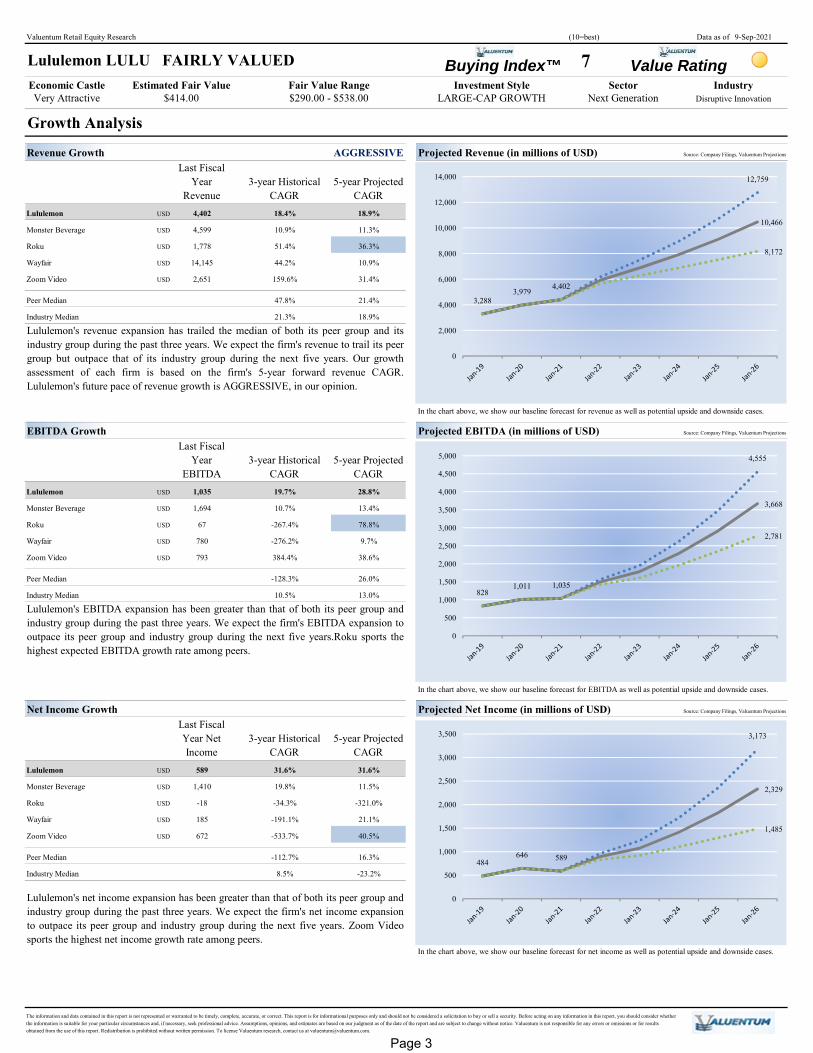
Revenue Growth AGGRESSIVE Projected Revenue (in millions of USD) Source: Company Filings, Valuentum Projections
Last Fiscal Year
Revenue3-year Historical
CAGR5-year Projected
CAGRLululemon USD 4,402 18.4% 18.9%
Monster Beverage USD 4,599 10.9% 11.3%
Roku USD 1,778 51.4% 36.3%
Wayfair USD 14,145 44.2% 10.9%
Zoom Video USD 2,651 159.6% 31.4%
Peer Median 47.8% 21.4%
Industry Median 21.3% 18.9%
In the chart above, we show our baseline forecast for revenue as well as potential upside and downside cases.
EBITDA Growth Projected EBITDA (in millions of USD) Source: Company Filings, Valuentum Projections
Last Fiscal Year
EBITDA3-year Historical
CAGR5-year Projected
CAGRLululemon USD 1,035 19.7% 28.8%
Monster Beverage USD 1,694 10.7% 13.4%
Roku USD 67 -267.4% 78.8%
Wayfair USD 780 -276.2% 9.7%
Zoom Video USD 793 384.4% 38.6%
Peer Median -128.3% 26.0%
Industry Median 10.5% 13.0%
In the chart above, we show our baseline forecast for EBITDA as well as potential upside and downside cases.
Net Income Growth Projected Net Income (in millions of USD) Source: Company Filings, Valuentum Projections
Last Fiscal Year Net Income
3-year Historical CAGR
5-year Projected CAGR
Lululemon USD 589 31.6% 31.6%
Monster Beverage USD 1,410 19.8% 11.5%
Roku USD -18 -34.3% -321.0%
Wayfair USD 185 -191.1% 21.1%
Zoom Video USD 672 -533.7% 40.5%
Peer Median -112.7% 16.3%
Industry Median 8.5% -23.2%
In the chart above, we show our baseline forecast for net income as well as potential upside and downside cases.
Lululemon's revenue expansion has trailed the median of both its peer group and itsindustry group during the past three years. We expect the firm's revenue to trail its peergroup but outpace that of its industry group during the next five years. Our growthassessment of each firm is based on the firm's 5-year forward revenue CAGR.Lululemon's future pace of revenue growth is AGGRESSIVE, in our opinion.
Lululemon's EBITDA expansion has been greater than that of both its peer group andindustry group during the past three years. We expect the firm's EBITDA expansion tooutpace its peer group and industry group during the next five years.Roku sports thehighest expected EBITDA growth rate among peers.
Lululemon's net income expansion has been greater than that of both its peer group andindustry group during the past three years. We expect the firm's net income expansionto outpace its peer group and industry group during the next five years. Zoom Videosports the highest net income growth rate among peers.
Lululemon LULU FAIRLY VALUED
The information and data contained in this report is not represented or warranted to be timely, complete, accurate, or correct. This report is for informational purposes only and should not be considered a solicitation to buy or sell a security. Before acting on any information in this report, you should consider whether the information is suitable for your particular circumstances and, if necessary, seek professional advice. Assumptions, opinions, and estimates are based on our judgment as of the date of the report and are subject to change without notice. Valuentum is not responsible for any errors or omissions or for results obtained from the use of this report. Redistribution is prohibited without written permission. To license Valuentum research, contact us at [email protected].
$414.00 $290.00 - $538.00 LARGE-CAP GROWTH Next Generation Disruptive Innovation Estimated Fair Value Fair Value Range Investment Style Sector Industry
3,2883,979
4,402
12,759
10,466
8,172
0
2,000
4,000
6,000
8,000
10,000
12,000
14,000
8281,011 1,035
4,555
3,668
2,781
0
500
1,000
1,500
2,000
2,500
3,000
3,500
4,000
4,500
5,000
484646 589
3,173
2,329
1,485
0
500
1,000
1,500
2,000
2,500
3,000
3,500
Page 3
Valuentum Retail Equity Research (10=best) Data as of 9-Sep-2021
Buying Index™ 7 Value RatingEconomic CastleVery Attractive
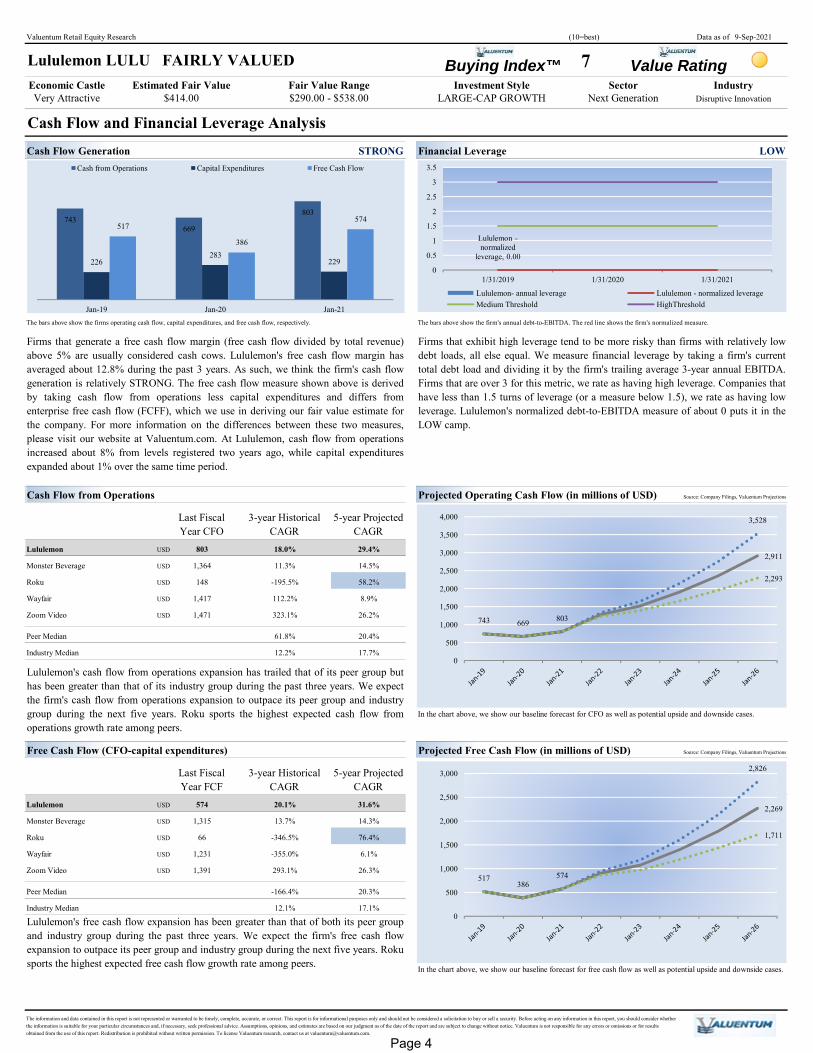
Cash Flow and Financial Leverage AnalysisCash Flow Generation STRONG Financial Leverage LOW
The bars above show the firms operating cash flow, capital expenditures, and free cash flow, respectively. The bars above show the firm's annual debt-to-EBITDA. The red line shows the firm's normalized measure.
Cash Flow from Operations Projected Operating Cash Flow (in millions of USD) Source: Company Filings, Valuentum Projections
Last Fiscal Year CFO
3-year Historical CAGR
5-year Projected CAGR
Lululemon USD 803 18.0% 29.4%
Monster Beverage USD 1,364 11.3% 14.5%
Roku USD 148 -195.5% 58.2%
Wayfair USD 1,417 112.2% 8.9%
Zoom Video USD 1,471 323.1% 26.2%
Peer Median 61.8% 20.4%
Industry Median 12.2% 17.7%
In the chart above, we show our baseline forecast for CFO as well as potential upside and downside cases.
Free Cash Flow (CFO-capital expenditures) Projected Free Cash Flow (in millions of USD) Source: Company Filings, Valuentum Projections
Last Fiscal Year FCF
3-year Historical CAGR
5-year Projected CAGR Source: Company Filings, Valuentum Projections
Lululemon USD 574 20.1% 31.6%
Monster Beverage USD 1,315 13.7% 14.3%
Roku USD 66 -346.5% 76.4%
Wayfair USD 1,231 -355.0% 6.1%
Zoom Video USD 1,391 293.1% 26.3%
Peer Median -166.4% 20.3%
Industry Median 12.1% 17.1%
In the chart above, we show our baseline forecast for free cash flow as well as potential upside and downside cases.
Firms that generate a free cash flow margin (free cash flow divided by total revenue)above 5% are usually considered cash cows. Lululemon's free cash flow margin hasaveraged about 12.8% during the past 3 years. As such, we think the firm's cash flowgeneration is relatively STRONG. The free cash flow measure shown above is derivedby taking cash flow from operations less capital expenditures and differs fromenterprise free cash flow (FCFF), which we use in deriving our fair value estimate forthe company. For more information on the differences between these two measures,please visit our website at Valuentum.com. At Lululemon, cash flow from operationsincreased about 8% from levels registered two years ago, while capital expendituresexpanded about 1% over the same time period.
LARGE-CAP GROWTH Next Generation
Lululemon LULU FAIRLY VALUED
The information and data contained in this report is not represented or warranted to be timely, complete, accurate, or correct. This report is for informational purposes only and should not be considered a solicitation to buy or sell a security. Before acting on any information in this report, you should consider whether the information is suitable for your particular circumstances and, if necessary, seek professional advice. Assumptions, opinions, and estimates are based on our judgment as of the date of the report and are subject to change without notice. Valuentum is not responsible for any errors or omissions or for results obtained from the use of this report. Redistribution is prohibited without written permission. To license Valuentum research, contact us at [email protected].
Estimated Fair Value $414.00
Lululemon's cash flow from operations expansion has trailed that of its peer group buthas been greater than that of its industry group during the past three years. We expectthe firm's cash flow from operations expansion to outpace its peer group and industrygroup during the next five years. Roku sports the highest expected cash flow fromoperations growth rate among peers.
Lululemon's free cash flow expansion has been greater than that of both its peer groupand industry group during the past three years. We expect the firm's free cash flowexpansion to outpace its peer group and industry group during the next five years. Rokusports the highest expected free cash flow growth rate among peers.
Fair Value RangeDisruptive Innovation $290.00 - $538.00
Firms that exhibit high leverage tend to be more risky than firms with relatively lowdebt loads, all else equal. We measure financial leverage by taking a firm's currenttotal debt load and dividing it by the firm's trailing average 3-year annual EBITDA.Firms that are over 3 for this metric, we rate as having high leverage. Companies thathave less than 1.5 turns of leverage (or a measure below 1.5), we rate as having lowleverage. Lululemon's normalized debt-to-EBITDA measure of about 0 puts it in theLOW camp.
Sector IndustryInvestment Style
743669
803
226283
229
517
386
574
Jan-19 Jan-20 Jan-21
Cash from Operations Capital Expenditures Free Cash Flow
Lululemon -normalized
leverage, 0.00
0
0.5
1
1.5
2
2.5
3
3.5
1/31/2019 1/31/2020 1/31/2021
Lululemon- annual leverage Lululemon - normalized leverageMedium Threshold HighThreshold
743 669 803
3,528
2,911
2,293
0
500
1,000
1,500
2,000
2,500
3,000
3,500
4,000
517386
574
2,826
2,269
1,711
0
500
1,000
1,500
2,000
2,500
3,000
Page 4

Valuentum Retail Equity Research (10=best) Data as of 9-Sep-2021
Buying Index™ 7 Value RatingEconomic CastleVery Attractive
Valuation Analysis
Valuation Assumptions Valuation BreakdownIn Millions of USD (except for per share items)
Revenue CAGR %Avg. EBIT Margin %Avg. Cash Tax Rate %Earnings Before Interest CAGR %Earnings Per Share CAGR %Free Cash Flow to the Firm CAGR %Earnings before interest = Net operating profits less adjusted taxes
Phase II --> III FCFF CAGR % 8.8% (II) 3% (III)Cost of Equity %After-tax Cost of Debt %Discount Rate (WACC) %Synthetic credit spread = 0.46%
Phase I Present ValuePhase II Present ValuePhase III Present ValueTotal Firm Value
Net Balance Sheet Impact
Total Equity ValueDiluted Shares OutstandingFair Value per Share
DCF Valuation Summary Enterprise Free Cash FlowFiscal Year End: 1/31/2019 1/31/2020 1/31/2021
645 541 646122 122 180226 283 229-66 31 -12
- Acquisitions 16 0 453591 349 156
In Millions of USD
Source: Company Filings, Valuentum Projections
Company NameValuentum Buying
Index™Forward Price-to-
Earnings
Price/Earnings-to-Growth (PEG), 5-
yearEV/Est. Normal
EBITDA
5-year Forward Earnings per Share CAGR
3-year Hist Avg ROIC, without
goodwillDividend Yield
%
Stock Price / Fair Value Estimate
Lululemon 7 60.7 2.8 22.2 33.0% 83.2% 0.0% 101.6%
Monster Beverage 7 36.3 2.7 19.9 13.7% 62.9% 0.0% 95.4%
Roku 3 720.3 NMF 65.2 -300.2% -64.0% 0.0% 97.3%
Wayfair 3 60.1 7.5 20.5 19.3% 42.7% 0.0% 86.7%
Zoom Video 3 64.5 3.5 33.5 38.3% Negative IC 0.0% 83.0%7 24 5 1 7 # 14 1 20 9% 35 4% 2 2% 108 3%
Peer Median 3.0 62.3 3.5 27.0 16.5% 42.7% 0.0% 91.0%
Industry Median 5.0 32.7 2.4 26.1 -26.0% 22.0% 0.0% 96.3%
The information and data contained in this report is not represented or warranted to be timely, complete, accurate, or correct. This report is for informational purposes only and should not be considered a solicitation to buy or sell a security. Before acting on any information in this report, you should consider whether the information is suitable for your particular circumstances and, if necessary, seek professional advice. Assumptions, opinions, and estimates are based on our judgment as of the date of the report and are subject to change without notice. Valuentum is not responsible for any errors or omissions or for results obtained from the use of this report. Redistribution is prohibited without written permission. To license Valuentum research, contact us at [email protected].
Earnings before Interest
54,133
Forward EV/EBITDA
- Change in Working Capital
Enterprise Free Cash Flow (FCFF)
Our future forecasts for key valuation drivers result in a future free enterprise cashflow stream. Above, we show how we calculate enterprise free cash flow and thehistorical performance of the metric for Lululemon. Over the next five years, weexpect the firm's enterprise free cash flow to expand at about a 71% compoundannual growth rate. During years 6 through 20, we expect the measure to grow at a8.8% rate. Beyond year 20 (in perpetuity), we grow the firm's free cash flow atinflation (3%).
We think Lululemon is worth $414 per share with a fair value range of $290.00 -$538.00. The margin of safety around our fair value estimate is driven by the firm'sMEDIUM ValueRisk™ rating, which is derived from an evaluation of the historicalvolatility of key valuation drivers and a future assessment of them. Our near-termoperating forecasts, including revenue and earnings, do not differ much from consensusestimates or management guidance. Our model reflects a compound annual revenuegrowth rate of 18.9% during the next five years, a pace that is higher than the firm's 3-year historical compound annual growth rate of 18.4%. Our model reflects a 5-yearprojected average operating margin of 25.3%, which is above Lululemon's trailing 3-year average. Beyond year 5, we assume free cash flow will grow at an annual rate of8.8% for the next 15 years and 3% in perpetuity. For Lululemon, we use a 9.2%weighted average cost of capital to discount future free cash flows.
In Millions of USD
26.4
35.3
5,52324,574
View back of report for a full list of industry constituents covered by Valuentum. VBI: Valuentum's ranking for the attractiveness of this investment at the date of the report.
IndustryInvestment Style Sector
33.0%
---------- Actual ----------
25.9
P/E on Est. Normal Diluted EPS
21.7
Long-term Projections
9.2%
39.7
146.2
41.7
41.8
Lululemon LULU FAIRLY VALUED
1,151
225.5
24.0
130.9
70.9%
$414.00
52.9
18.9%25.3%
9.2%
In the chart below, we show the build up to our estimate of total enterprise value forLululemon and the break down to the firm's total equity value, which we estimate tobe about 54.13USD billion. The present value of the enterprise free cash flowsgenerated during each phase of our model and the net balance sheet impact isdisplayed. We divide total equity value by diluted shares outstanding to arrive at our$414 per share fair value estimate.
52,98222,886
- Capital Expenditures
Estimated Fair Value
Results
Fair Value Range
28.0%
NA
5-year Projections
36.1
+ Depreciation
$414.00 $290.00 - $538.00 LARGE-CAP GROWTH
45.3
Company Metrics versus Peer and Industry Medians
49.0
31.7%
Disruptive InnovationNext Generation
5,523
24,574
22,886
1,151
54,133
0
10,000
20,000
30,000
40,000
50,000
60,000
Yr 1-5 Yr 6-20 Perpetuity Net Balance SheetImpact
Equity Value
Page 5
Valuentum Retail Equity Research (10=best) Data as of 9-Sep-2021
Buying Index™ 7 Value RatingEconomic CastleVery Attractive
Margin of Safety Analysis
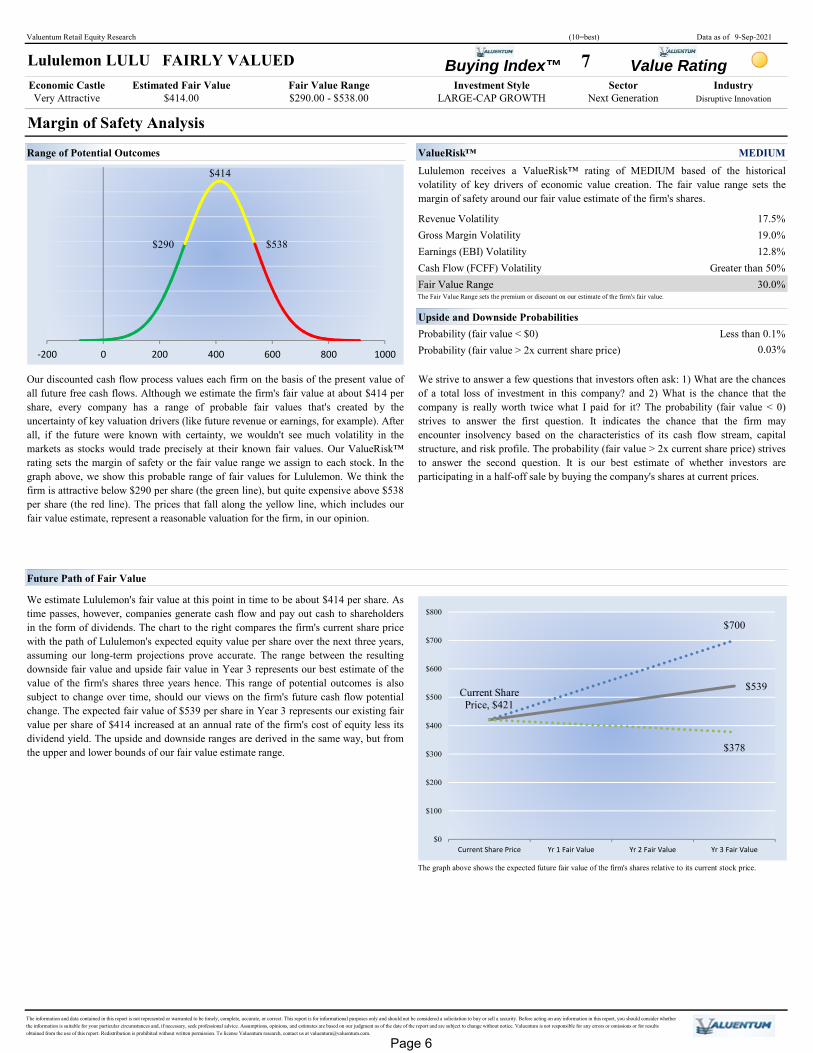
Range of Potential Outcomes ValueRisk™ MEDIUM
Revenue Volatility 17.5%Gross Margin Volatility 19.0%Earnings (EBI) Volatility 12.8%Cash Flow (FCFF) Volatility Greater than 50%Fair Value Range 30.0%The Fair Value Range sets the premium or discount on our estimate of the firm's fair value.
Upside and Downside ProbabilitiesProbability (fair value < $0) Less than 0.1%Probability (fair value > 2x current share price) 0.03%
Future Path of Fair Value
The graph above shows the expected future fair value of the firm's shares relative to its current stock price.
$290.00 - $538.00Sector Fair Value Range Investment Style
LARGE-CAP GROWTH Estimated Fair Value
$414.00
Lululemon LULU FAIRLY VALUED
Our discounted cash flow process values each firm on the basis of the present value ofall future free cash flows. Although we estimate the firm's fair value at about $414 pershare, every company has a range of probable fair values that's created by theuncertainty of key valuation drivers (like future revenue or earnings, for example). After all, if the future were known with certainty, we wouldn't see much volatility in themarkets as stocks would trade precisely at their known fair values. Our ValueRisk™rating sets the margin of safety or the fair value range we assign to each stock. In thegraph above, we show this probable range of fair values for Lululemon. We think thefirm is attractive below $290 per share (the green line), but quite expensive above $538per share (the red line). The prices that fall along the yellow line, which includes ourfair value estimate, represent a reasonable valuation for the firm, in our opinion.
The information and data contained in this report is not represented or warranted to be timely, complete, accurate, or correct. This report is for informational purposes only and should not be considered a solicitation to buy or sell a security. Before acting on any information in this report, you should consider whether the information is suitable for your particular circumstances and, if necessary, seek professional advice. Assumptions, opinions, and estimates are based on our judgment as of the date of the report and are subject to change without notice. Valuentum is not responsible for any errors or omissions or for results obtained from the use of this report. Redistribution is prohibited without written permission. To license Valuentum research, contact us at [email protected].
We strive to answer a few questions that investors often ask: 1) What are the chancesof a total loss of investment in this company? and 2) What is the chance that thecompany is really worth twice what I paid for it? The probability (fair value < 0)strives to answer the first question. It indicates the chance that the firm mayencounter insolvency based on the characteristics of its cash flow stream, capitalstructure, and risk profile. The probability (fair value > 2x current share price) strivesto answer the second question. It is our best estimate of whether investors areparticipating in a half-off sale by buying the company's shares at current prices.
Lululemon receives a ValueRisk™ rating of MEDIUM based of the historicalvolatility of key drivers of economic value creation. The fair value range sets themargin of safety around our fair value estimate of the firm's shares.
Next Generation
We estimate Lululemon's fair value at this point in time to be about $414 per share. Astime passes, however, companies generate cash flow and pay out cash to shareholdersin the form of dividends. The chart to the right compares the firm's current share pricewith the path of Lululemon's expected equity value per share over the next three years,assuming our long-term projections prove accurate. The range between the resultingdownside fair value and upside fair value in Year 3 represents our best estimate of thevalue of the firm's shares three years hence. This range of potential outcomes is alsosubject to change over time, should our views on the firm's future cash flow potentialchange. The expected fair value of $539 per share in Year 3 represents our existing fairvalue per share of $414 increased at an annual rate of the firm's cost of equity less itsdividend yield. The upside and downside ranges are derived in the same way, but fromthe upper and lower bounds of our fair value estimate range.
IndustryDisruptive Innovation
$290
$414
$538
-200 0 200 400 600 800 1000
$700
$539Current Share Price, $421
$378
$0
$100
$200
$300
$400
$500
$600
$700
$800
Current Share Price Yr 1 Fair Value Yr 2 Fair Value Yr 3 Fair Value
Page 6

Valuentum Retail Equity Research (10=best) Data as of 9-Sep-2021
Buying Index™ 7 Value RatingEconomic CastleVery Attractive
Technical Analysis
Technical Evaluation BULLISH Money Flow Index (MFI) NEUTRAL
30-week Price and Volume Chart (weekly)Relative Price Strength STRONG
5-week Company Performance 3.6%5-week Market Benchmark Performance 2.6%5-week Relative Performance vs. Market Benchmark 0.9%13-week Company Performance 20.8%13-week Market Benchmark Performance 7.5%13-week Relative Performance vs. Market Benchmark 13.3%30-week Company Performance 27.9%30-week Market Benchmark Performance 17.5%30-week Relative Performance vs. Market Benchmark 10.4%
Upside/Downside Volume DETERIORATING Timeliness Matrix™ Equity Valuation
Relative Strength
Firms that are undervalued and currently showing near-term pricing strength score near the top right of the matrix.
Overvalued
Industry $414.00
UndervaluedFairly Valued
Investment Style
The Money Flow Index (MFI) is an oscillator that uses price and volume to measurebuying and selling pressure. Chartists often look for overbought (above 80) andoversold (below 20) levels to warn of unsustainable near-term price extremes.Lululemon's MFI of 79 is neutral, suggesting the firm's stock is neither overboughtnor oversold at this time. However, a score over 50 tends to favor bulls. The MFI canalso be used to gauge the strength or weakness of a firm's price trend. In Lululemon'scase, its stock price and money flow neither reveals a bullish nor bearish divergence,further supporting our neutral view on its money flow action.
The firm's near-term moving average (5-week, grey line) and medium-term movingaverage (13-week, red line) are shown in the chart above. Typically, when a shorter-term moving average crosses a medium- or longer-term moving average from below, itrepresents a bullish signal. If the short-term moving average crosses from above, tradersoften view this as bearish. Lululemon's 5-week moving average resides above its 13-week measure, indicating a BULLISH trend. We'd grow wary of the firm's technicalsshould its 5-week moving average drop below its 13-week moving average, as thefirm's 30-week uptrend could be threatened if this occurs.
Strong
Lululemon LULU FAIRLY VALUED
Neutral
Weak
Companies that are undervalued and showing near-term relative price strength couldrepresent timely buys, as the stock may be attractive to both value and momentuminvestors. A cross section of the firm's equity valuation and its relative share pricestrength is shown in the matrix above. We tend to prefer undervalued stocks that have strong pricing momentum, also called Valuentum stocks.
1
The level and trend of the Upside/Downside (U/D) volume ratio reveals whetherinstitutional participation has been bullish or bearish as of late. Although Lululemon'sU/D volume ratio of 2.1 is greater than 1, it resides below its trailing average,indicating bullish but DETERIORATING institutional interest during the past severalweeks.
Sector
The information and data contained in this report is not represented or warranted to be timely, complete, accurate, or correct. This report is for informational purposes only and should not be considered a solicitation to buy or sell a security. Before acting on any information in this report, you should consider whether the information is suitable for your particular circumstances and, if necessary, seek professional advice. Assumptions, opinions, and estimates are based on our judgment as of the date of the report and are subject to change without notice. Valuentum is not responsible for any errors or omissions or for results obtained from the use of this report. Redistribution is prohibited without written permission. To license Valuentum research, contact us at [email protected].
Estimated Fair Value Fair Value Range
A firm's relative price strength can be assessed over any number of time horizons. Weshow the firm's performance over the past 5 weeks, 13 weeks, and 30 weeks below.In arriving at our relative strength rating for each company, we assess the past 13weeks, which includes the market's reaction to the firm's most recently reportedquarter, where applicable, and other more recent economic events. During the past 13weeks, Lululemon's shares returned 20.8%, while the market benchmark returned7.5%. We think Lululemon's 13-week relative price performance is STRONG.
Disruptive Innovation $290.00 - $538.00 LARGE-CAP GROWTH
In the chart above, we pinpoint the heaviest accumulation or distribution week of thefirm, determined by the week with the highest trading volume during the past 30 weeks.A heavy accumulation (buying) or distribution (selling) week often determines thefuture near-term direction of the firm's share price, as money managers continue tomove in or out of the stock in the days and weeks ahead driving the stock up or down,respectively. For Lululemon, the week with the highest trading volume out of the last30 weeks was a week of heavy selling, or distribution (red bar). Such market activitycould indicate a reversal of an uptrend or further confirmation of a downtrend.
Next Generation
229
279
329
379
429
0
10,000,000
20,000,000
30,000,000
40,000,000
50,000,000
5-week Moving Average
13-week Moving Average
Stock Price
285305325345365385405425445
Overbought Line
Oversold Line
62
79
0102030405060708090
100
1.3
2.1Average, 2.1
0.0
0.5
1.0
1.5
2.0
2.5
3.0
3.5
- 10-week Moving Average
Page 7

Valuentum Retail Equity Research (10=best) Data as of 9-Sep-2021
Buying Index™ 7 Value RatingEconomic CastleVery Attractive
Pro Forma Income Statement -------------------- Historical --------------------
In Millions of USD (except for per share items)Jan-19 Jan-21
Total Revenue 3,288 4,402
Cost of Goods Sold 1,472 1,938
Selling, General and Administrative Expenses 1,110 1,609
Other Operating Expenses 0 5
Operating Income 706 850
Unusual items 0 0
Operating Income, including unusual items 706 850
Interest Expense 0 0
Other Non-operating Income 9 (31)
Pre-tax Income 715 819
Income Taxes 231 230
Income after tax 484 589
Minority Interest and Equity Income 0 0
Net Income, excluding extra items 484 589
Income Available to Common, excluding extra items 484 589
Diluted Earnings per Share, excluding extra items 3.61 4.50
Diluted Weighted Shares Outstanding 134.0 130.9
Source: Company Filings, Xignite, Valuentum Projections
Jan-20
1,756
1,334
0
1,493
0
Lululemon LULU FAIRLY VALUED
0
00
0
1,247
1,247 1,493
3,979
7
2,113
2,545
8
0 0
The information and data contained in this report is not represented or warranted to be timely, complete, accurate, or correct. This report is for informational purposes only and should not be considered a solicitation to buy or sell a security. Before acting on any information in this report, you should consider whether the information is suitable for your particular circumstances and, if necessary, seek professional advice. Assumptions, opinions, and estimates are based on our judgment as of the date of the report and are subject to change without notice. Valuentum is not responsible for any errors or omissions or for results obtained from the use of this report. Redistribution is prohibited without written permission. To license Valuentum research, contact us at [email protected].
8.38
889
Jan-23
2,940
2,441
8
349
1,493
418
1,247
0
Jan-22
0
6,8815,912
252
Note: Pro forma data in discounted cash-flow valuation may reflect significant adjustments from GAAP accounting data, including cash (not effective) tax rates and other analytical adjustments on a backward-looking and forward-looking basis. No individual data, by itself, found in this report should be used to make any investment decision.
129.6
6.93
Estimated Fair Value
646
128.3
1,075
1,075
0
1,075
---------- Projected ----------
889
LARGE-CAP GROWTH $414.00 $290.00 - $538.00
0
898
897
898
Industry Fair Value Range Investment StyleNext Generation Disruptive Innovation
Sector
4.93
131.0
898
646
646
Page 8

Valuentum Retail Equity Research (10=best) Data as of 9-Sep-2021
Buying Index™ 7 Value RatingEconomic CastleVery Attractive
Pro Forma Balance Sheet -------------------- Historical --------------------
In Millions of USD (except for per share items)Jan-19 Jan-21
AssetsTotal Cash (including marketable securities) 881 1,151Inventory 405 647Accounts Receivable 36 62Other Current Assets 107 264Total Current Assets 1,429 2,124
Gross Fixed Assets 972 1,437(Accumulated Depreciation) (405) (691)Net Property, Plant, and Equipment 567 746
Goodwill, Net 24 387Intangibles, Net 0 80Other Long-term Assets 65 849Total Assets 2,085 4,186
LiabilitiesAccounts Payable 163 180Other Current Liabilities 337 703Current Portion of Long-term Debt 0 0Total Current Liabilities 500 883
Long-term Debt 0 0Other Long-term Liabilities 139 744Total Liabilities 639 1,627
Preferred Stock 0 0
Shareholders' EquityCommon Stock and Additional Paid in Capital 316 390Retained Earnings 1,347 2,346Other Equity (217) (177)Total Shareholders' Equity 1,446 2,559
Total Liabilities and Shareholders' Equity 2,085 4,186
514 778 834
1,094
273
Estimated Fair Value Fair Value Range
Jan-22 Jan-23
249
4,877
0
2,251
839
5,692
(522)1,193
2,037
156
(225)
3,281 5,692
0 0
(528) (867)1,952 3,106 3,842
1,821 3,244
Next Generation
957
3,281
106
519
Disruptive Innovation
Jan-20
$414.00 $290.00 - $538.00 LARGE-CAP GROWTH
264
1,807
874 1,037
Sector
Lululemon LULU FAIRLY VALUED Investment Style Industry
1,507
---------- Projected ----------
264
1,771 1,850
0
0 0 0709 744 744
1,106
1,329
620 1,0270
4,319356 390
Source: Company Filings, Xignite, Valuentum Projections
0
390
81 92
3,3502,6921,808
777 849 849
24 387 3870 75 70
40
(933) (1,214)672
The information and data contained in this report is not represented or warranted to be timely, complete, accurate, or correct. This report is for informational purposes only and should not be considered a solicitation to buy or sell a security. Before acting on any information in this report, you should consider whether the information is suitable for your particular circumstances and, if necessary, seek professional advice. Assumptions, opinions, and estimates are based on our judgment as of the date of the report and are subject to change without notice. Valuentum is not responsible for any errors or omissions or for results obtained from the use of this report. Redistribution is prohibited without written permission. To license Valuentum research, contact us at [email protected].
4,877
Note: Pro forma data in discounted cash-flow valuation may reflect significant adjustments from GAAP accounting data, including cash (not effective) tax rates and other analytical adjustments on a backward-looking and forward-looking basis. No individual data, by itself, found in this report should be used to make any investment decision.
Page 9
Valuentum Retail Equity Research (10=best) Data as of 9-Sep-2021
Buying Index™ 7 Value RatingEconomic CastleVery Attractive
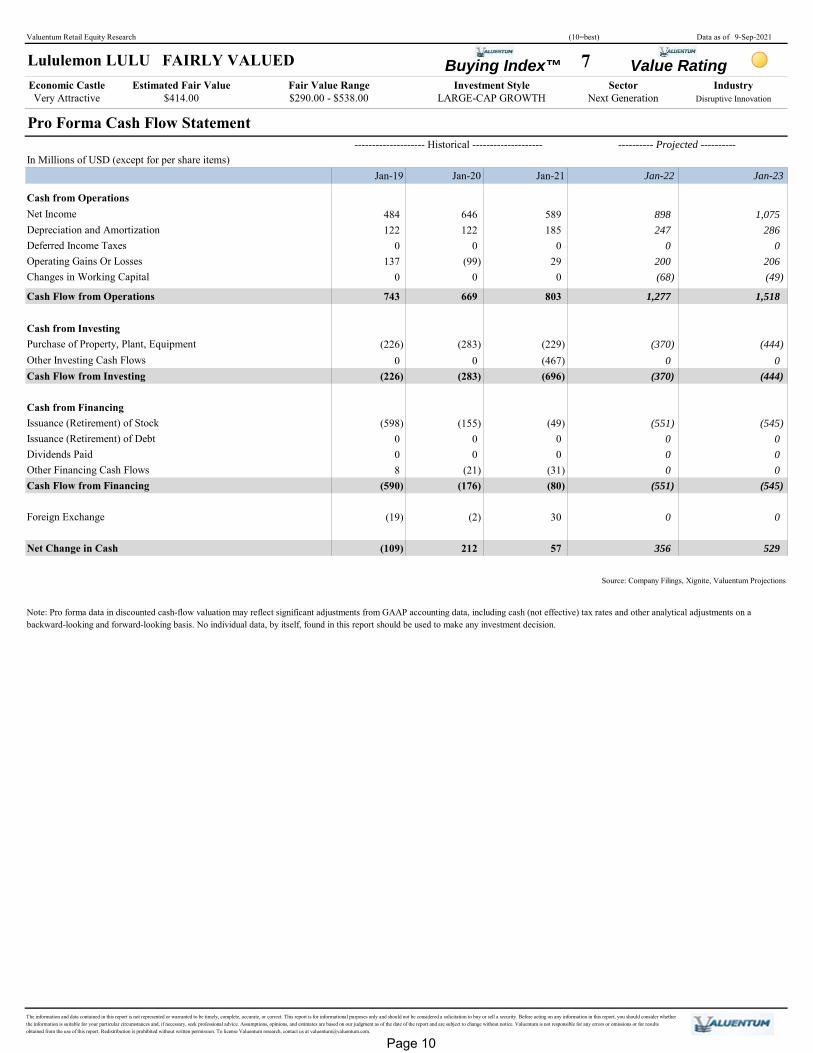
Pro Forma Cash Flow Statement -------------------- Historical --------------------
In Millions of USD (except for per share items)Jan-19 Jan-21
Cash from OperationsNet Income 484 589Depreciation and Amortization 122 185Deferred Income Taxes 0 0Operating Gains Or Losses 137 29Changes in Working Capital 0 0
Cash Flow from Operations 743 803
Cash from InvestingPurchase of Property, Plant, Equipment (226) (229)Other Investing Cash Flows 0 (467)Cash Flow from Investing (226) (696)
Cash from FinancingIssuance (Retirement) of Stock (598) (49)Issuance (Retirement) of Debt 0 0Dividends Paid 0 0Other Financing Cash Flows 8 (31)Cash Flow from Financing (590) (80)
Foreign Exchange (19) 30
Net Change in Cash (109) 57
(444)
Jan-20 Jan-22 Jan-23
Lululemon LULU FAIRLY VALUED Estimated Fair Value Fair Value Range Investment Style Sector Industry
$414.00 $290.00 - $538.00 LARGE-CAP GROWTH Next Generation Disruptive Innovation
0
---------- Projected ----------
0 0 0
(21) 0 0
(551) (545)
1,277 1,518
(283) (370)
646 898 1,075122 247 286
(155)
669
0 0 0(99) 200 206
0 (68) (49)
The information and data contained in this report is not represented or warranted to be timely, complete, accurate, or correct. This report is for informational purposes only and should not be considered a solicitation to buy or sell a security. Before acting on any information in this report, you should consider whether the information is suitable for your particular circumstances and, if necessary, seek professional advice. Assumptions, opinions, and estimates are based on our judgment as of the date of the report and are subject to change without notice. Valuentum is not responsible for any errors or omissions or for results obtained from the use of this report. Redistribution is prohibited without written permission. To license Valuentum research, contact us at [email protected].
(545)(551)(176)
212
Source: Company Filings, Xignite, Valuentum Projections
(283) (370) (444)
356 529
(2) 0 0
0 00 0 0
Note: Pro forma data in discounted cash-flow valuation may reflect significant adjustments from GAAP accounting data, including cash (not effective) tax rates and other analytical adjustments on a backward-looking and forward-looking basis. No individual data, by itself, found in this report should be used to make any investment decision.
Page 10

Valuentum Retail Equity Research (10=best) Data as of 9-Sep-2021
Buying Index™ 7 Value RatingEconomic CastleVery Attractive
Disruptive InnovationDisruptive Innovation FAIRLY VALUED
Company Name TickerMarket Cap (USD-
mil) DCF Valuation ValueCreation™ ValueRisk™ ValueTrend™ Technicals Relative Strength
Beyond Meat BYND 7,011 FAIRLY VALUED VERY POOR HIGH POSITIVE BEARISH WEAK
Boston Beer SAM 6,871 FAIRLY VALUED EXCELLENT MEDIUM POSITIVE NEUTRAL WEAK
Carvana Co. CVNA 21,372 FAIRLY VALUED VERY POOR HIGH POSITIVE VERY BEARISH STRONG
CRISPR Therapeutics CRSP 7,865 FAIRLY VALUED VERY POOR HIGH NEGATIVE BEARISH WEAK
Crocs CROX 9,525 FAIRLY VALUED EXCELLENT HIGH NEGATIVE BULLISH STRONG
DocuSign DOCU 52,611 FAIRLY VALUED EXCELLENT MEDIUM POSITIVE VERY BEARISH NEUTRAL
ETSY ETSY 29,423 FAIRLY VALUED EXCELLENT HIGH POSITIVE BULLISH STRONG
First Solar FSLR 10,378 FAIRLY VALUED VERY POOR MEDIUM NEGATIVE BULLISH STRONG
Fiverr International FVRR 5,929 FAIRLY VALUED VERY POOR MEDIUM POSITIVE BEARISH WEAK
GameStop GME 11,784 OVERVALUED EXCELLENT VERY HIGH NEGATIVE VERY BEARISH WEAK
Global Payments GPN 52,206 FAIRLY VALUED EXCELLENT LOW NEGATIVE NEUTRAL WEAK
IntercontinentalExchange ICE 66,689 FAIRLY VALUED EXCELLENT LOW NEGATIVE BULLISH NEUTRAL
JD.com JD 124,765 FAIRLY VALUED POOR MEDIUM NEGATIVE BULLISH STRONG
Lululemon LULU 55,059 FAIRLY VALUED EXCELLENT MEDIUM NEGATIVE BULLISH STRONG
Mercadolibre MELI 93,682 FAIRLY VALUED EXCELLENT MEDIUM POSITIVE BULLISH STRONG
Monster Beverage MNST 50,498 FAIRLY VALUED EXCELLENT MEDIUM POSITIVE BULLISH WEAK
NASDAQ NDAQ 33,037 FAIRLY VALUED EXCELLENT LOW POSITIVE BULLISH STRONG
Palo Alto PANW 45,204 FAIRLY VALUED EXCELLENT MEDIUM NEGATIVE NEUTRAL STRONG
Penn National PENN 11,247 FAIRLY VALUED POOR MEDIUM NEGATIVE BULLISH STRONG
Pinterest PINS 32,866 FAIRLY VALUED VERY POOR MEDIUM NEGATIVE BEARISH WEAK
Proto Labs PRLB 1,999 FAIRLY VALUED EXCELLENT MEDIUM NEGATIVE BEARISH WEAK
Roku ROKU 41,488 FAIRLY VALUED VERY POOR MEDIUM POSITIVE BEARISH WEAK
ServiceNow NOW 131,649 FAIRLY VALUED EXCELLENT MEDIUM POSITIVE NEUTRAL STRONG
Slack Tech WORK 17,512 FAIRLY VALUED VERY POOR MEDIUM POSITIVE BULLISH STRONG
Snap SNAP 109,606 FAIRLY VALUED VERY POOR MEDIUM POSITIVE BULLISH STRONG
Splunk SPLK 24,783 FAIRLY VALUED GOOD MEDIUM NEGATIVE NEUTRAL STRONG
Stitch Fix SFIX 3,960 FAIRLY VALUED EXCELLENT MEDIUM NEGATIVE BEARISH WEAK
Teradyne TER 22,335 FAIRLY VALUED EXCELLENT MEDIUM POSITIVE BEARISH WEAK
Uber UBER 70,098 FAIRLY VALUED VERY POOR VERY HIGH POSITIVE BEARISH WEAK
VeriSign VRSN 25,504 FAIRLY VALUED EXCELLENT MEDIUM NEGATIVE BEARISH WEAK
Verisk VRSK 33,942 FAIRLY VALUED EXCELLENT MEDIUM POSITIVE NEUTRAL STRONG
Virgin Galactic SPCE 5,561 FAIRLY VALUED POOR VERY HIGH NEGATIVE BEARISH WEAK
Wayfair W 26,700 FAIRLY VALUED EXCELLENT MEDIUM POSITIVE BEARISH WEAK
Zoom Video ZM 90,828 FAIRLY VALUED GOOD MEDIUM POSITIVE BEARISH WEAK
Estimated Fair Value Fair Value Range Investment Style Sector Industry
Lululemon LULU FAIRLY VALUED
$290.00 - $538.00 LARGE-CAP GROWTH Next Generation Disruptive Innovation
Relative Valuation
NEUTRAL
ATTRACTIVE
NEUTRAL
NEUTRAL
NEUTRAL
UNATTRACTIVE
NEUTRAL
ATTRACTIVE
UNATTRACTIVE
NEUTRAL
ATTRACTIVE
LARGE-CAP CORE
LARGE-CAP GROWTH
ATTRACTIVE
UNATTRACTIVE
$414.00
MID-CAP BLEND
LARGE-CAP CORE
LARGE-CAP BLEND
LARGE-CAP BLEND
LARGE-CAP GROWTH
LARGE-CAP GROWTH
UNATTRACTIVE
The above bar chart reveals the price/fair value of the company, its peers, and the industry as a whole.
LARGE-CAP VALUE
LARGE-CAP BLEND
LARGE-CAP BLEND
LARGE-CAP CORE
LARGE-CAP BLEND
We think the Disruptive Innovation industry is fairly valued at this time. The industry'smarket cap is trading between 80% and 120% of our estimate of its fair value based onour DCF process. Although we use a firm-specific ValueRisk™ measure to determinewhether a firm is undervalued or overvalued based on our DCF process, we consider anindustry to be undervalued if it is trading below 80% of our estimate of its fair valueand overvalued if it is trading at over 120% of our estimate of its fair value. We thinkthese fair value ranges are appropriate given the diversification benefits of holding abasket of stocks. Although there may be individual opportunities within the DisruptiveInnovation industry, we don't find the industry as a whole attractive based solely onvaluation.
Shaded blue denotes that the firm has earned the highest rating for that respective category.Investment Style
MID-CAP GROWTH
MID-CAP BLEND
LARGE-CAP GROWTH
MID-CAP BLEND
MID-CAP BLEND
NEUTRAL
LARGE-CAP VALUE
MID-CAP BLEND
LARGE-CAP CORE
The information and data contained in this report is not represented or warranted to be timely, complete, accurate, or correct. This report is for informational purposes only and should not be considered a solicitation to buy or sell a security. Before acting on any information in this report, you should consider whether the information is suitable for your particular circumstances and, if necessary, seek professional advice. Assumptions, opinions, and estimates are based on our judgment as of the date of the report and are subject to change without notice. Valuentum is not responsible for any errors or omissions or for results obtained from the use of this report. Redistribution is prohibited without written permission. To license Valuentum research, contact us at [email protected].
LARGE-CAP BLEND
LARGE-CAP GROWTH
MID-CAP BLEND
LARGE-CAP BLEND
LARGE-CAP BLEND
SMALL-CAP VALUE
NEUTRAL
ATTRACTIVE
NEUTRAL
UNATTRACTIVE
ATTRACTIVE
ATTRACTIVE
UNATTRACTIVE
UNATTRACTIVE
LARGE-CAP BLEND
LARGE-CAP CORE
LARGE-CAP GROWTH
LARGE-CAP BLEND
LARGE-CAP GROWTH
LARGE-CAP BLEND
ATTRACTIVE
UNATTRACTIVE
NEUTRAL
UNATTRACTIVE
ATTRACTIVE
LARGE-CAP BLEND
NEUTRAL
ATTRACTIVE
ATTRACTIVE
NEUTRAL
UNATTRACTIVE
UNATTRACTIVE
101.6%
91.0%
96.3%
84%
86%
88%
90%
92%
94%
96%
98%
100%
102%
104%
Lululemon Peer Median Disruptive Innovation
Page 11

Valuentum's Full Page Stock Report
The information and data contained in this report is not represented or warranted to be timely, complete, accurate, or correct. This report is for informational purposes only and should not be considered a solicitation to buy or sell a security. Before acting on any information in this report, you should consider whether the information is suitable for your particular circumstances and, if necessary, seek professional advice. Assumptions, opinions, and estimates are based on our judgment as of the date of the report and are subject to change without notice. Valuentum is not responsible for any errors or omissions or for results obtained from the use of this report. Redistribution is prohibited without written permission. To license Valuentum research, contact us at [email protected].
BA
G
I
N
C
J
D
M
H
E
L
K
A DCF ValuationShows whether the firm is undervalued, fairly valued, or overvalued based on our DCF process and by how much.
B Valuentum Buying Index (VBI)Provides insight into the timeliness of an investment opportunity. We rank firms from 1 to 10 based on rigorous fiancial, valuation, and technical analysis. A 10 represents one of our top picks.
C Valuentum Value Rating (VVR) Indicates whether we think a firm is undervalued, fairly valued, or overvalued on the basis of our DCF process.
D Investment ConsiderationsEvaluates firms on 12 different measures, from the firm's growth and cash flow generation to the stock's money flow index and upside/downside volume. We reveal technical support and resistance levels.
E 30-week Price and Volume ActionDisplays the last accumulation or distribution week of the stock and historical price and volume action.
G Company VitalsShows sector,industry and other relevant company information.
H Business QualitySummary of the firm's ability to create value for shareholders compared wth the underlying risk of its operations.
I Normalized EPS and EBITDAEstimation of the firm's normalized earnings measures and the corresponding valuation mutliples.
J Investment HighlightsOur opinion of the company, including analysis of its financial and technical strengths and weaknesses.
K Relative ValuationComparison of the firm's PE, PEG, and Price/FV ratios versus peers.
L Returns Summary3-year averages of the firm's key return measures, including return on invested capital, with and without goodwill.
M Leverage, Coverage, and LiquidityA snapshot of the company's financial health.
N Financial SummaryA summary of the proforma financial statements found in the extended report.
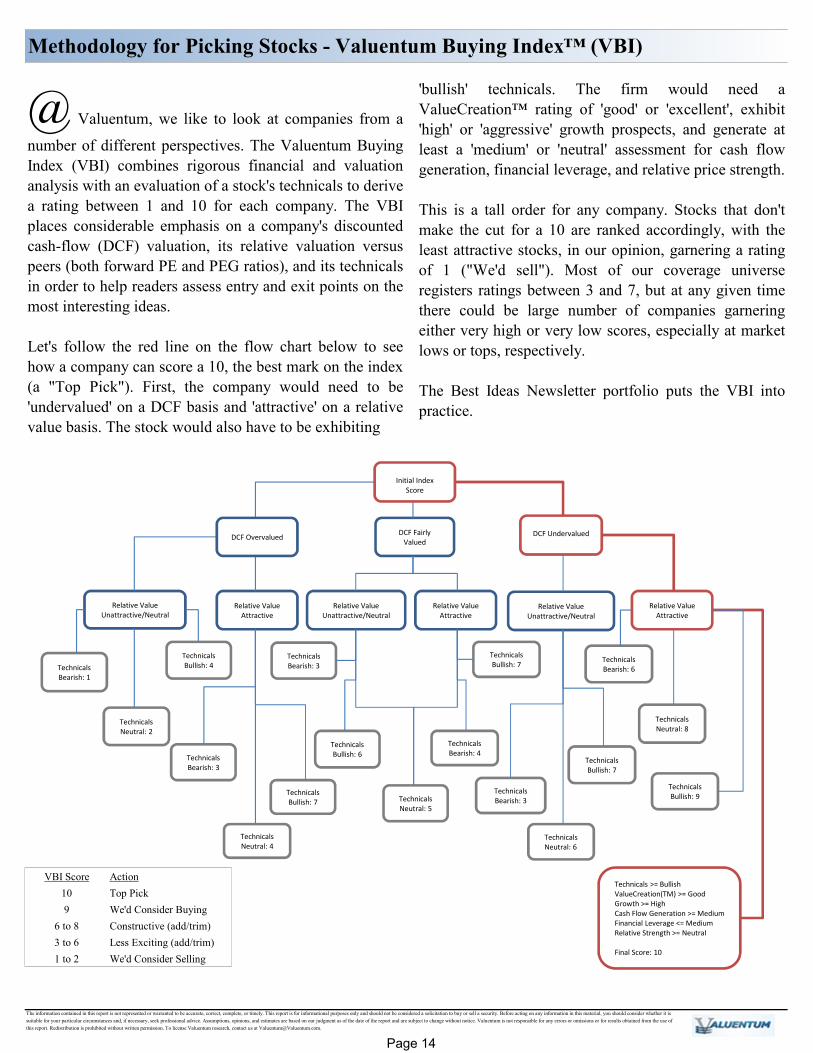
VBI Score Action10 Top Pick9 We'd Consider Buying
6 to 8 Constructive (add/trim)3 to 6 Less Exciting (add/trim)1 to 2 We'd Consider Selling
Page 12
UNDERVALUED
FAIRLY VALUED
OVERVALUED
• Revenue Volatility • Margin Volatility • Earnings Volatility • Cash Flow VolatilityThe information and data contained in this report is not represented or warranted to be timely, complete, accurate, or correct. This report is for informational purposes only and should not be considered a solicitation to buy or sell a security. Before acting on any information in this report, you should consider whether the information is suitable for your particular circumstances and, if necessary, seek professional advice. Assumptions, opinions, and estimates are based on our judgment as of the date of the report and are subject to change without notice. Valuentum is not responsible for any errors or omissions or for results obtained from the use of this report. Redistribution is prohibited without written permission. To license Valuentum research, contact us at [email protected].
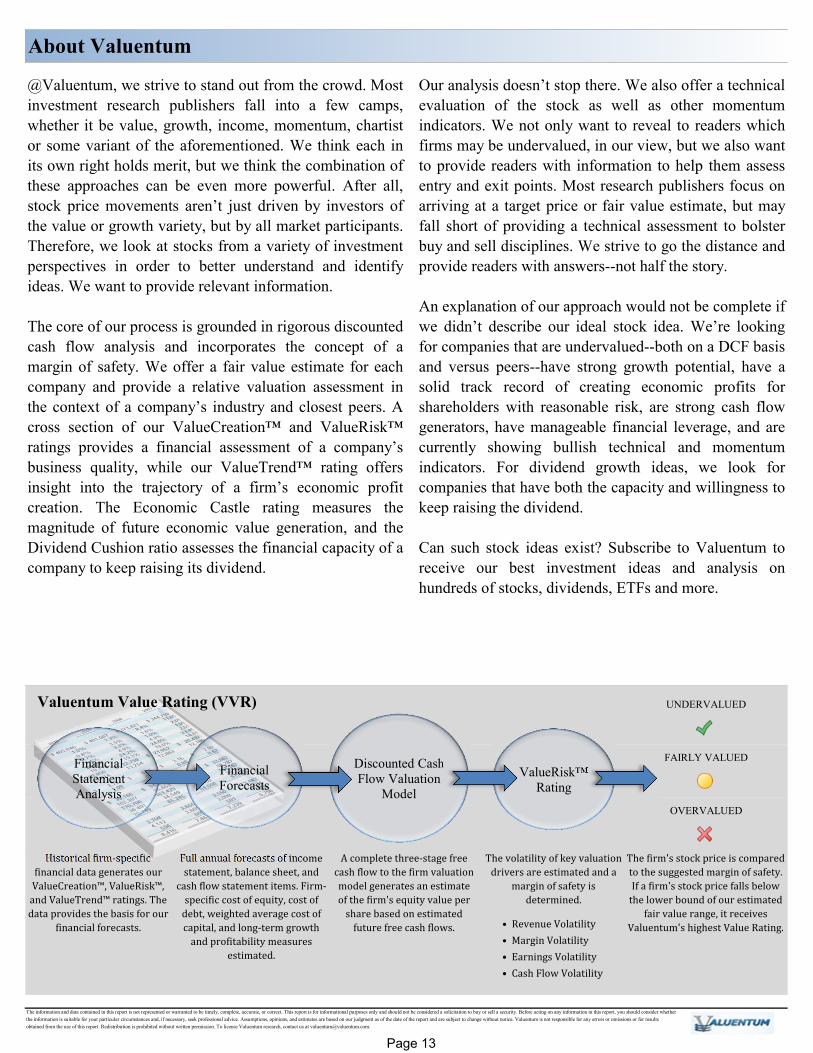
Historical firm-specific financial data generates our ValueCreation™, ValueRisk™, and ValueTrend™ ratings. The data provides the basis for our financial forecasts. Full annual forecasts of income statement, balance sheet, and cash flow statement items. Firm-specific cost of equity, cost of debt, weighted average cost of capital, and long-term growth and profitability measures estimated.
Our analysis doesn’t stop there. We also offer a technicalevaluation of the stock as well as other momentumindicators. We not only want to reveal to readers whichfirms may be undervalued, in our view, but we also wantto provide readers with information to help them assessentry and exit points. Most research publishers focus onarriving at a target price or fair value estimate, but mayfall short of providing a technical assessment to bolsterbuy and sell disciplines. We strive to go the distance andprovide readers with answers--not half the story.
An explanation of our approach would not be complete ifwe didn’t describe our ideal stock idea. We’re lookingfor companies that are undervalued--both on a DCF basisand versus peers--have strong growth potential, have asolid track record of creating economic profits forshareholders with reasonable risk, are strong cash flowgenerators, have manageable financial leverage, and arecurrently showing bullish technical and momentumindicators. For dividend growth ideas, we look forcompanies that have both the capacity and willingness tokeep raising the dividend.
Can such stock ideas exist? Subscribe to Valuentum toreceive our best investment ideas and analysis onhundreds of stocks, dividends, ETFs and more.
About Valuentum
The volatility of key valuation drivers are estimated and a margin of safety is determined.A complete three-stage free cash flow to the firm valuation model generates an estimate of the firm's equity value per share based on estimated future free cash flows.
The firm's stock price is compared to the suggested margin of safety. If a firm's stock price falls below the lower bound of our estimated fair value range, it receives Valuentum's highest Value Rating.
@Valuentum, we strive to stand out from the crowd. Mostinvestment research publishers fall into a few camps,whether it be value, growth, income, momentum, chartistor some variant of the aforementioned. We think each inits own right holds merit, but we think the combination ofthese approaches can be even more powerful. After all,stock price movements aren’t just driven by investors ofthe value or growth variety, but by all market participants.Therefore, we look at stocks from a variety of investmentperspectives in order to better understand and identifyideas. We want to provide relevant information.
The core of our process is grounded in rigorous discountedcash flow analysis and incorporates the concept of amargin of safety. We offer a fair value estimate for eachcompany and provide a relative valuation assessment inthe context of a company’s industry and closest peers. Across section of our ValueCreation™ and ValueRisk™ratings provides a financial assessment of a company’sbusiness quality, while our ValueTrend™ rating offersinsight into the trajectory of a firm’s economic profitcreation. The Economic Castle rating measures themagnitude of future economic value generation, and theDividend Cushion ratio assesses the financial capacity of acompany to keep raising its dividend.
Financial Forecasts
Financial Statement Analysis
Discounted Cash Flow Valuation
ModelValueRisk™
Rating
Valuentum Value Rating (VVR)
Page 13
VBI Score Action10 Top Pick9 We'd Consider Buying
6 to 8 Constructive (add/trim)3 to 6 Less Exciting (add/trim)1 to 2 We'd Consider Selling
@ Valuentum, we like to look at companies from anumber of different perspectives. The Valuentum BuyingIndex (VBI) combines rigorous financial and valuationanalysis with an evaluation of a stock's technicals to derivea rating between 1 and 10 for each company. The VBIplaces considerable emphasis on a company's discountedcash-flow (DCF) valuation, its relative valuation versuspeers (both forward PE and PEG ratios), and its technicalsin order to help readers assess entry and exit points on themost interesting ideas.
Let's follow the red line on the flow chart below to seehow a company can score a 10, the best mark on the index(a "Top Pick"). First, the company would need to be'undervalued' on a DCF basis and 'attractive' on a relativevalue basis. The stock would also have to be exhibiting
Methodology for Picking Stocks - Valuentum Buying Index™ (VBI)
The information contained in this report is not represented or warranted to be accurate, correct, complete, or timely. This report is for informational purposes only and should not be considered a solicitation to buy or sell a security. Before acting on any information in this material, you should consider whether it is suitable for your particular circumstances and, if necessary, seek professional advice. Assumptions, opinions, and estimates are based on our judgment as of the date of the report and are subject to change without notice. Valuentum is not responsible for any errors or omissions or for results obtained from the use of this report. Redistribution is prohibited without written permission. To license Valuentum research, contact us at [email protected].
'bullish' technicals. The firm would need aValueCreation™ rating of 'good' or 'excellent', exhibit'high' or 'aggressive' growth prospects, and generate atleast a 'medium' or 'neutral' assessment for cash flowgeneration, financial leverage, and relative price strength.
This is a tall order for any company. Stocks that don'tmake the cut for a 10 are ranked accordingly, with theleast attractive stocks, in our opinion, garnering a ratingof 1 ("We'd sell"). Most of our coverage universeregisters ratings between 3 and 7, but at any given timethere could be large number of companies garneringeither very high or very low scores, especially at marketlows or tops, respectively.
The Best Ideas Newsletter portfolio puts the VBI intopractice.
DCF FairlyValued
DCF Undervalued
Relative ValueUnattractive/Neutral
Relative Value Attractive
Relative ValueUnattractive/Neutral
Relative Value Attractive
Technicals Bearish: 1
Technicals Neutral: 2
TechnicalsBullish: 4
Technicals Bullish: 7
TechnicalsBearish: 6
Technicals >= BullishValueCreation(TM) >= GoodGrowth >= HighCash Flow Generation >= MediumFinancial Leverage <= MediumRelative Strength >= Neutral
Final Score: 10
Technicals Bullish: 9
Technicals Neutral: 8
TechnicalsBearish: 3
Relative Value Unattractive/Neutral
Relative Value Attractive
Technicals Bearish: 3
Technicals Neutral: 6
Technicals Bullish: 7
Technicals Bearish: 3
Technicals Bullish: 6
Technicals Bullish: 7
Technicals Neutral: 5
Technicals Bearish: 4
Technicals Neutral: 4
Initial Index Score
DCF Overvalued
Page 14
The information contained in this report is not represented or warranted to be accurate, correct, complete, or timely. This report is for informational purposes only and should not be considered a solicitation to buy or sell a security. Before acting on any information in this material, you should consider whether it is suitable for your particular circumstances and, if necessary, seek professional advice. Assumptions, opinions, and estimates are based on our judgment as of the date of the report and are subject to change without notice. Valuentum is not responsible for any errors or omissions or for results obtained from the use of this report. Redistribution is prohibited without written permission. To license Valuentum research, contact us at [email protected].
Estimated Fair Value. This measure is our opinion of the fair equity value per share ofthe company. If our forecasts prove accurate, which may not always be the case, wemay expect a firm's stock price to converge to this value within the next 3 years.
Fair Value Range. The fair value range represents an upper bound and lower bound,between which we would consider the firm to be fairly valued. The range considers ourestimate of the firm's fair value and the margin of safety suggested by the volatility ofkey valuation drivers, including revenue, gross margin, earnings before interest, andenterprise free cash flow (the determinants behind our ValueRisk™ rating).
ValueCreation™. This is a proprietary Valuentum measure. ValueCreation™indicates the firm's historical track record in creating economic value for shareholders,taking the average difference between ROIC (without goodwill) and the firm'sestimated WACC during the past three years. The firm's performance is measured alongthe scale of EXCELLENT, GOOD, POOR, and VERY POOR. Those firms withEXCELLENT ratings have a demonstrated track record of creating economic value,while those that register a VERY POOR mark have been destroying economic value.
ValueRisk™. This is a proprietary Valuentum measure. ValueRisk™ indicates thehistorical volatility of key valuation drivers, including revenue, gross margin, earningsbefore interest, and enterprise free cash flow. The standard deviation of each measure iscalculated and scaled against last year's measure to arrive at a percentage deviation foreach item. These percentage deviations are weighted equally to arrive at thecorresponding fair value range for each stock, measured in percentage terms. The firm'sperformance is measured along the scale of LOW, MEDIUM, HIGH, and VERY HIGH.The ValueRisk™ rating for each firm also determines the fundamental beta of eachfirm along the following scale: LOW (0.85), MEDIUM (1), HIGH (1.15), VERY HIGH(1.3).
ValueTrend™. This is a proprietary Valuentum measure. ValueTrend™ indicates thetrajectory of the firm's return on invested capital (ROIC). Firms that earned an ROIClast year that was greater than the 3-year average of the measure earn a POSITIVErating. Firms that earned an ROIC last year that was less than the 3-year average of themeasure earn a NEGATIVE rating.
Business Quality Matrix. We compare the firm's ValueCreation™ and ValueRisk™ratings. The box is an easy way for investors to quickly assess the business quality ofa company. Firms that generate economic profits with little operating variabilityscore near the top right of the matrix.
Return on Invested Capital. At Valuentum, we place considerable emphasis onreturn on invested capital (both with and without goodwill). The measure focuses onthe return (earnings) the company is generating on its operating assets and is superiorto return on equity and return on assets, which can be skewed by a firm's leverage orexcess cash balance, respectively.
Range of Potential Outcomes. The firm's margin of safety is shown in the graphicof a normal distribution. We consider a firm to be undervalued if its stock price fallsalong the green line and overvalued if the stock price falls along the red line. Weconsider the firm to be fairly valued if its stock price falls along the yellow line.
Money Flow Index (MFI). The MFI is a technical indicator that measures buyingand selling pressure based on both price and volume. Traders typically use thismeasure to identify potential reversals with overbought and oversold levels. We use a14-week measure to rank firms along the following scale: EXTREMELYOVERBOUGHT (>90), OVERBOUGHT (80-90), NEUTRAL (20-80), OVERSOLD(10-20), EXTREMELY OVERSOLD (0-10).
Relative Value. We compare the firm's forward price-to earnings (PE) ratio and itsprice/earnings-to-growth (PEG) ratio to that of its peers. If both measures fall below thepeer median, the firm receives an ATTRACTIVE rating. If both are above the peermedian, the firm receives an UNATTRACTIVE rating. Any other combination resultsin a NEUTRAL rating.
Cash Flow Generation. Firms' cash flow generation capacity are measured along thescale of STRONG, MEDIUM, and WEAK. A firm with a 3-year historical free cashflow margin (free cash flow divided by sales) greater than 5% receives a STRONGrating, while firms earning less than 1% of sales as free cash flow receive a WEAKrating.
Financial Leverage. Based on the firm's normalized debt-to-EBITDA metric, we rank firms on the following scale: LOW, MEDIUM, and HIGH. Companies with a normalized debt-to-EBITDA ratio below 1.5 receive a LOW score, while those with a measure above 3 receive a HIGH score.
Timeliness Matrix. We compare the company's recent stock performance relative tothe market benchmark with our assessment of its valuation. Firms that areexperiencing near-term stock price outperformance and are undervalued by ourestimate may represent timely buys.
Glossary
Company Vitals. In this section, we list key financial information and the sector andindustry that Valuentum assigns to the stock. The P/E-Growth (5-yr), or PEG ratio,divides the current share price by last year's earnings (EPS) and then divides thatquotient by our estimate of the firm's 5-year EPS growth rate. The estimatednormalized diluted EPS and estimated normalized EBITDA represent the five-yearforward average of these measures used in our discounted cash flow model. The P/Eon estimated normalized EPS divides the current share price by estimated normalizeddiluted EPS. The EV/estimated normalized EBITDA considers the current enterprisevalue of the company and divides it by estimated normalized EBITDA. EV is definedas the firm's market capitalization plus total debt, minority interest, preferred stockless cash and cash equivalents.
Technical Evaluation. We evaluate a firm's near-term and medium-term movingaverages and money flow index (MFI) to assign each firm a rating along thefollowing scale: VERY BULLISH, BULLISH, NEUTRAL, BEARISH, and VERYBEARISH.
DCF Valuation. We opine on the firm's valuation based on our DCF process. Firmsthat are trading with an appropriate discount to our fair value estimate receive anUNDERVALUED rating. Firms that are trading within our fair value range receive aFAIRLY VALUED rating, while firms that are trading above the upper bound of ourfair value range receive an OVERVALUED rating.
Investment Style. Valuentum uses its own proprietary stock-classification system.Nano-cap: Less than $50 million; Micro-cap: Between $50 million and $200 million;Small-cap: Between $200 million and $2 billion; Mid-cap: Between $2 billion and$10 billion; Large-cap: Between $10 billion and $200 billion; Mega-cap: Over $200billion. Blend: Firm's that we think are undervalued and exhibit high growthprospects (growth in excess of three times the rate of assumed inflation). Value:Firm's that we believe are undervalued, but do not exhibit high growth prospects.Growth: Firms that are not undervalued, in our opinion, but exhibit high growthprospects. Core: Firms that are neither undervalued nor exhibit high growthprospects.
Stock Price Relative Strength. We assess the perfomance of the company's stockduring the past quarter, 13 weeks, relative to an ETF that mirrors the aggregateperformance of constituents of the stock market. Firms are measured along the scaleof STRONG, NEUTRAL, and WEAK. Companies that have outperformed themarket index by more than 2.5% during this 13-week period receive a STRONGrating, while firms that trailed the market index by more than 2.5% during this 13-week period receive a WEAK rating.
Upside/Downside Volume. Heavy volume on up days and lower volume on down days suggests that institutions are heavily participating in a stock's upward advance. We use the trailing 14-week average of upside and downside volume to calculate an informative ratio. We rank each firm's U/D volume ratio along the following scale: BULLISH, IMPROVING, DETERIORATING, and BEARISH.
Page 15
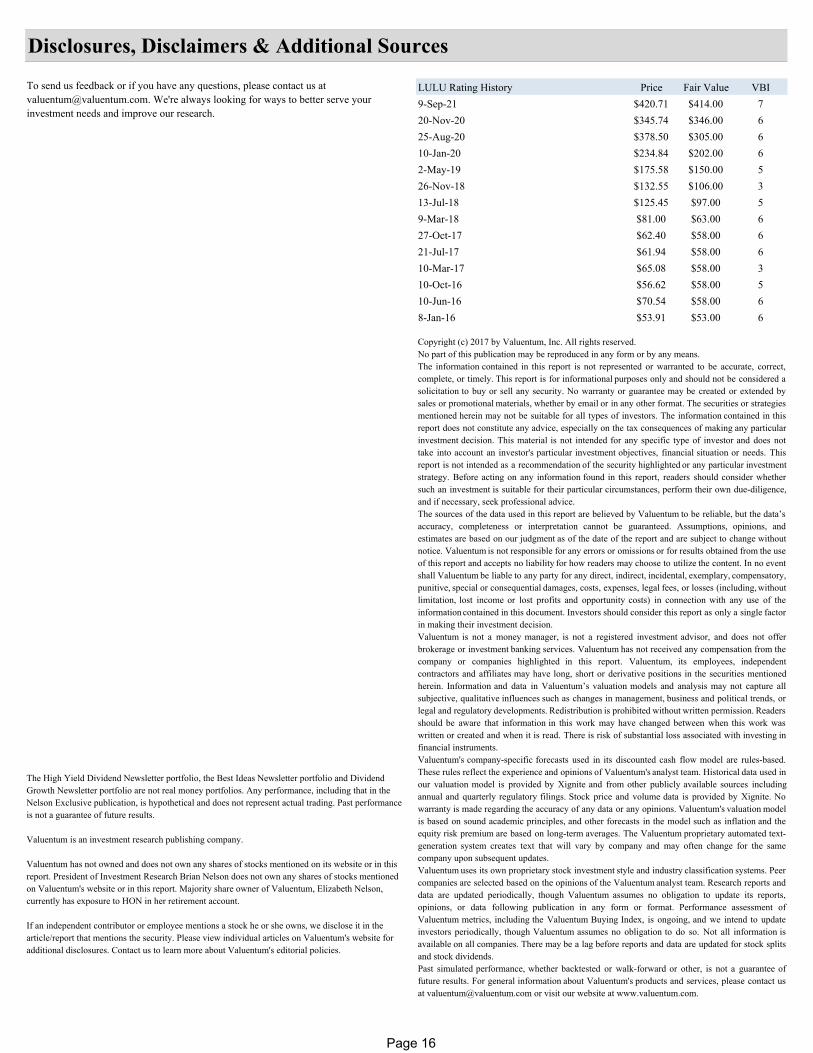
LULU Rating History Price Fair Value VBI9-Sep-21 $420.71 $414.00 720-Nov-20 $345.74 $346.00 625-Aug-20 $378.50 $305.00 610-Jan-20 $234.84 $202.00 62-May-19 $175.58 $150.00 526-Nov-18 $132.55 $106.00 313-Jul-18 $125.45 $97.00 59-Mar-18 $81.00 $63.00 627-Oct-17 $62.40 $58.00 621-Jul-17 $61.94 $58.00 610-Mar-17 $65.08 $58.00 310-Oct-16 $56.62 $58.00 510-Jun-16 $70.54 $58.00 68-Jan-16 $53.91 $53.00 6
Copyright (c) 2017 by Valuentum, Inc. All rights reserved.No part of this publication may be reproduced in any form or by any means.The information contained in this report is not represented or warranted to be accurate, correct,complete, or timely. This report is for informational purposes only and should not be considered asolicitation to buy or sell any security. No warranty or guarantee may be created or extended bysales or promotional materials, whether by email or in any other format. The securities or strategiesmentioned herein may not be suitable for all types of investors. The information contained in thisreport does not constitute any advice, especially on the tax consequences of making any particularinvestment decision. This material is not intended for any specific type of investor and does nottake into account an investor's particular investment objectives, financial situation or needs. Thisreport is not intended as a recommendation of the security highlighted or any particular investmentstrategy. Before acting on any information found in this report, readers should consider whethersuch an investment is suitable for their particular circumstances, perform their own due-diligence,and if necessary, seek professional advice. The sources of the data used in this report are believed by Valuentum to be reliable, but the data’saccuracy, completeness or interpretation cannot be guaranteed. Assumptions, opinions, andestimates are based on our judgment as of the date of the report and are subject to change withoutnotice. Valuentum is not responsible for any errors or omissions or for results obtained from the useof this report and accepts no liability for how readers may choose to utilize the content. In no eventshall Valuentum be liable to any party for any direct, indirect, incidental, exemplary, compensatory,punitive, special or consequential damages, costs, expenses, legal fees, or losses (including, withoutlimitation, lost income or lost profits and opportunity costs) in connection with any use of theinformation contained in this document. Investors should consider this report as only a single factorin making their investment decision. Valuentum is not a money manager, is not a registered investment advisor, and does not offerbrokerage or investment banking services. Valuentum has not received any compensation from thecompany or companies highlighted in this report. Valuentum, its employees, independentcontractors and affiliates may have long, short or derivative positions in the securities mentionedherein. Information and data in Valuentum’s valuation models and analysis may not capture allsubjective, qualitative influences such as changes in management, business and political trends, orlegal and regulatory developments. Redistribution is prohibited without written permission. Readersshould be aware that information in this work may have changed between when this work waswritten or created and when it is read. There is risk of substantial loss associated with investing infinancial instruments. Valuentum's company-specific forecasts used in its discounted cash flow model are rules-based.These rules reflect the experience and opinions of Valuentum's analyst team. Historical data used inour valuation model is provided by Xignite and from other publicly available sources includingannual and quarterly regulatory filings. Stock price and volume data is provided by Xignite. Nowarranty is made regarding the accuracy of any data or any opinions. Valuentum's valuation modelis based on sound academic principles, and other forecasts in the model such as inflation and theequity risk premium are based on long-term averages. The Valuentum proprietary automated text-generation system creates text that will vary by company and may often change for the samecompany upon subsequent updates. Valuentum uses its own proprietary stock investment style and industry classification systems. Peercompanies are selected based on the opinions of the Valuentum analyst team. Research reports anddata are updated periodically, though Valuentum assumes no obligation to update its reports,opinions, or data following publication in any form or format. Performance assessment ofValuentum metrics, including the Valuentum Buying Index, is ongoing, and we intend to updateinvestors periodically, though Valuentum assumes no obligation to do so. Not all information isavailable on all companies. There may be a lag before reports and data are updated for stock splitsand stock dividends. Past simulated performance, whether backtested or walk-forward or other, is not a guarantee offuture results. For general information about Valuentum's products and services, please contact usat [email protected] or visit our website at www.valuentum.com.
The High Yield Dividend Newsletter portfolio, the Best Ideas Newsletter portfolio and Dividend Growth Newsletter portfolio are not real money portfolios. Any performance, including that in the Nelson Exclusive publication, is hypothetical and does not represent actual trading. Past performance is not a guarantee of future results.
Valuentum is an investment research publishing company.
Valuentum has not owned and does not own any shares of stocks mentioned on its website or in this report. President of Investment Research Brian Nelson does not own any shares of stocks mentioned on Valuentum's website or in this report. Majority share owner of Valuentum, Elizabeth Nelson, currently has exposure to HON in her retirement account.
If an independent contributor or employee mentions a stock he or she owns, we disclose it in the article/report that mentions the security. Please view individual articles on Valuentum's website for additional disclosures. Contact us to learn more about Valuentum's editorial policies.
To send us feedback or if you have any questions, please contact us at [email protected]. We're always looking for ways to better serve your investment needs and improve our research.
Disclosures, Disclaimers & Additional Sources
Page 16


![Lululemon brand audit_presentation_with_music[1]](https://static.fdocuments.us/doc/165x107/554cb22bb4c90536578b4e1d/lululemon-brand-auditpresentationwithmusic1.jpg)