LOW-LEVEL SARIN VAPOR EXPOSURE IN RATS: … chemical biological center ... william t. muse, jr. ......
40
EDGEWOOD CHEMICAL BIOLOGICAL CENTER U.S. ARMY SOLDIER AND BIOLOGICAL CHEMICAL COMMAND ECBC-TR-235 LOW-LEVEL SARIN VAPOR EXPOSURE IN RATS: EFFECT OF EXPOSURE CONCENTRATION AND DURATION ON PUPIL SIZE Robert J. Mioduszewski James H. Manthei Ruth A Way David C. Burnett Bernardita P. Gaviola William T. Muse, Jr. Sandra A Thomson Douglas R. Sommerville Ronald B. Crosier Jacqueline A Scotto David A McCaskey RESEARCH AND TECHNOLOGY DIRECTORATE Charles L. Crouse Kathy L. Matson GEO-CENTERS, INC. Abingdon, MD 21009 May 200 Approved for public release; distribution is unlimited. GEO-CENTERS Aberdeen Proving Ground, MD 21010-5424 20020619 012
Transcript of LOW-LEVEL SARIN VAPOR EXPOSURE IN RATS: … chemical biological center ... william t. muse, jr. ......

EDGEWOOD CHEMICAL BIOLOGICAL CENTER
U.S. ARMY SOLDIER AND BIOLOGICAL CHEMICAL COMMAND
ECBC-TR-235
LOW-LEVEL SARIN VAPOR EXPOSURE IN RATS: EFFECT OF EXPOSURE CONCENTRATION AND
DURATION ON PUPIL SIZE
Robert J. Mioduszewski James H. Manthei
Ruth A Way David C. Burnett
Bernardita P. Gaviola William T. Muse, Jr. Sandra A Thomson
Douglas R. Sommerville Ronald B. Crosier
Jacqueline A Scotto David A McCaskey
RESEARCH AND TECHNOLOGY DIRECTORATE
Charles L. Crouse Kathy L. Matson
GEO-CENTERS, INC. Abingdon, MD 21009
May 200
Approved for public release; distribution is unlimited.
GEO-CENTERS
Aberdeen Proving Ground, MD 21010-5424
20020619 012
Disclaimer
The findings in this report are not to be construed as an official Department of the Army position unless so designated by other authorizing documents.

REPORT DOCUMENTATION PAGE Form Approved OMB No. 0704-0188
Public reporting burden for this collection of information is estimated to average 1 hour per response, including the time for reviewing instructions, searching existing data sources, gathering and maintaining the data needed, and completing and reviewing the collection of information. Send comments regarding this burden estimate or any other aspect of this collection of information, including suggestions for reducing this burden, to Washington Headquarters Services, Directorate for Information Operations and Reports, 1215 Jefferson Davis Highway, Suite 1204, Arlington, VA 22202-4302, and to the Office of Management and Budget, Paperwork Reduction Project (0704-0188), Washington, DC 20503.
1. AGENCY USE ONLY (Leave Blank) \l. REPORT DATE | 3. REPORT TYPE AND DATES COVERED
2002 May Final; 00 Aug - 01 Sep 4. TrriH AND SUBTITLE
Low-Level Sarin Vapor Exposure in Rats: Effect of Exposure Concentration and Duration on Pupil Size
5. FUNDING NUMBERS
PR-206023
6. AUTHOR(S)
Mioduszewski, Robert J.; Manthei, James H.; Way, Ruth A.; Burnett, David C; Gaviola, Bernardita P.; Muse, William T. Jr.; Thomson, Sandra A.; Sommerville, Douglas R.; Crosier, Ronald B.; Scotto, Jacqueline A.; McCaskey, David A. (ECBC); Crouse, Charles L.; and Matson, Kathy L (GEO-CENTERS, INCORPORATED) 7. PERFORMING ORGANIZATION NAME(S) AND ADDRESS(ES)
DIR, ECBC, ATTN: AMSSB-RRT-TT, APG, MD 21010-5424 GEO-CENTERS, INCORPORATED, Abingdon, MD 21009
PERFORMING ORGANIZATION REPORT NUMBER
ECBC-TR-235
9. SPONSORING/MONITORING AGENCY NAME(S) AND ADDRESS(ES)
Defense Threat Reduction Agency, 8725 John J. Kingman Road, MS 6201, Fort Belvoir, VA 22060-6201
10. SPONSORING/MONITORING AGENCY REPORT NUMBER
11. SUPPLEMENTARY NOTES
12a. DISTRIBUTION/AVAILABILITY STATEMENT
Approved for public release; distribution is unlimited. 12b. DISTRIBUTION CODE
13. ABSTRACT (Maximum 200 words)
The probability of sarin (GB) vapor-induced miosis was estimated in rats exposed to various combinations of exposure concentration and duration. Groups of male and female rats (Sprague-Dawley) were exposed to one of a series of GB vapor concentrations for a single duration (10 - 240 minutes), in a whole-body dynamic chamber. Separate effective concentrations for miosis (defined as a post-exposure pupil diameter 50% or less of the pre-exposure pupil diameter) in 50% of the exposed population (EC50) and corresponding dose-response slopes were determined, for each exposure time, by the Bliss probit method. Contrary to that predicted by Habeas rule, ECT50 values increased with exposure duration (i.e., the CT for 50% of the exposed population to show miosis was not constant over time). Linear regression analysis was used to derive a model of low-level GB vapor-induced pupil diameter changes in the rat as a function of exposure concentration and time. Female rats were more sensitive to GB vapor toxicity than male rats. Miosis was the only clinical sign noted following GB vapor exposure. Blood esterase (acetyl- cholinesterase, butyrylcholinesterase, and carboxylesterase) activities were not inhibited by exposure to the low-level range of GB vapor. 14. SUBJECT TERMS
Duration Eye Concentration Miosis
Low Level Inhalation
Rats Sarin
Ct GB
17. SECURITY CLASSIFICATION OF REPORT
UNCLASSIFIED
18. SECURITY CLASSIFICATION OF THIS PAGE
UNCLASSIFIED
19. SECURrTY CLASSIFICATION OF ABSTRACT
UNCLASSIFIED
15. NUMBER OF PAGES
38
16. PRICE CODE
20. LIMITATION OF ABSTRACT
UL NSN 7540-01-280-5500 Standard Form 298 (Rev. 2-89)
Prescribed by ANSI Std. Z39-18 298-102

Blank

PREFACE
The work described in this report was authorized under Project No. 206023, Low Level Toxicology. The work was started August 2000 and completed in September 2001. The experimental data are contained in laboratory notebooks 99-0091 and 99-0092. Raw data and the final report from this study are stored in the Life Sciences Archives, Building E-3150, Aberdeen Proving Ground, MD.
In conducting this study, investigators adhered to the "Guide for the Care and Use of Laboratory Animals," Institute of Laboratory Animal Resources, Commission of Life Sciences, National Research Council, National Academy Press, Washington, D.C., 1996. These investigations were also performed in accordance with the requirements of AR 70-18, "Laboratory Animals, Procurement, Transportation, Use, Care, and Public Affairs," and the U.S. Army Edgewood Chemical Biological Center Institutional Animal Care and Use Committee (IACUC), which monitors the use of laboratory animals. This project's assigned IACUC Protocol, No. 99-328, was approved on 11 August 2000.
All animals were cared for as stated in this research protocol and as specified in "Guide for the Care and Use of Laboratory Animals," National Academy Press, Washington, D.C., 1996. Records were maintained in official ECBC Notebooks in the Life Sciences Archives (Building E3150) and/or in the Technical Library (Building E3330). Studies were conducted under, and in compliance with current GLP standards, and they were reviewed periodically by either the QA Coordinator or his designee.
The performance of this study was consistent with the objectives and standards in "Good Laboratory Practices for Non-clinical Laboratory Studies" (21 CFR 58, Food and Drug Administration, U.S. Department of Health and Human Services, April 1988).
The use of trade or manufacturers, names in this report does not constitute an official endorsement of any commercial products. This report may not be cited for purposes of advertisement.
This report has been approved for public release. Registered users should request additional copies from the Defense Technical Information Center; unregistered users should direct such requests to the National Technical Information Service.
Acknowledgments
The authors thank Dr. Julie Watson, Dennis Johnson, Carl Kurnas, Jill Jarvis, and Dean Bona, Veterinary Services Team, ECBC, for their support in the care and handling of the animals used in these studies and for quality assurance assistance. In addition, the clinical laboratory support of Dr. John Skvorak, Connie Clark, and Steve Tucker (USAMRICD) is greatly appreciated.

QUALITY ASSURANCE
This study, conducted as described in Protocol 99-328, was examined for compliance with Good Laboratory Practices as published by the U.S. Environmental Protection Agency in 40 CFR Part 792 (effective 17 AUG 1989). The dates of inspections and the dates the results of those inspections were reported to the Study Director and management were as follows:
Phase Inspected Date Date Reported
Study parameters and exposure Pupil Measurement Data and Final Report
To the best of my knowledge, the methods described were the methods followed during the study. The report was determined to be an accurate reflection of the raw data obtained.
2 Nov 99 10 Apr 01 01 Mar 02
2 Nov 99 10 Apr 01 01 Mar 02
ENNIS W. JOHNSON Quality Assurance Coordinator Research and Technology Directorate

CONTENTS
1. INTRODUCTION 9
2. MATERIALS AND METHODS 10
2.1 Chemicals 10 2.2 Vapor Generation 11 2.3 Inhalation Chamber 11 2.4 Vapor Sampling/Analysis 11 2.5 Solid Sorbent Tube System 12 2.6 Animal Exposures 12 2.6.1 Whole-Body Inhalation Exposures 13 2.6.2 Blood Sample Collection 13 2.6.3 Assessing Pupil Diameter 13 2.6.4 Data Analysis 14
3. RESULTS 14
3.1 Effect of Sarin Vapor on Miosis 14 3.2 A Toxic Load Model for Probability of Miosis 15 3.3 A Toxic Load Model for Pupil Diameter 15 3.4 Blood Esterase Activities. 16
4. DISCUSSION 16
4.1 Bliss Slope from Probit Analysis 17 4.2 Bliss Slope for Miosis from Modeling Pupil Diameter 17 4.3 Comparison to Lethality 18 4.4 Pupil Response to GB Vapor Exposure 19 4.5 Assessing Estimates of GB Vapor-Induced Miosis 19 4.6 Low-level GB Vapor Effects on Blood Esterase Activity 20
5. CONCLUSIONS 21
LITERATURE CITED 37

FIGURES
1. Mean and Standard Error of Pupil Diameters for Female Rats Exposed to GB Vapor at 10,60 or 240 minutes 23
2. Mean and Standard Error of Pupil Diameters for Male Rats Exposed to GB Vapor at 10,60 or 240 minutes 23
3. Mean and Standard Error of Pupil Diameters for Female Rats Exposed to Air at 10, 60 or 240 minutes 24
4. Mean and Standard Error of Pupil Diameters for Male Rats Exposed to Air at 10, 60 or 240 minutes '^24
5. Ratio of post-exposure (30 min) to pre-exposure pupil diameter in female rats exposed to fixed concentrations of GB vapor for 10 minutes 25
6. Ratio of post-exposure (30 min) to pre-exposure pupil diameter in male rats exposed to fixed concentrations of GB vapor for 10 minutes 25
7. Ratio of post-exposure (30 min) to pre-exposure pupil diameter in male rats exposed to fixed concentrations of GB vapor for 60 minutes 26
8. Ratio of post-exposure (30 min) to pre-exposure pupil diameter in female rats exposed to fixed concentrations of GB vapor for 60 minutes 26
9. Ratio of post-exposure (30 min) to pre-exposure pupil diameter in female rats exposed to fixed concentrations of GB vapor for 240 minutes 27
10. Ratio of post-exposure (30 min) to pre-exposure pupil diameter in male rats exposed to fixed concentrations of GB vapor for 240 minutes 27
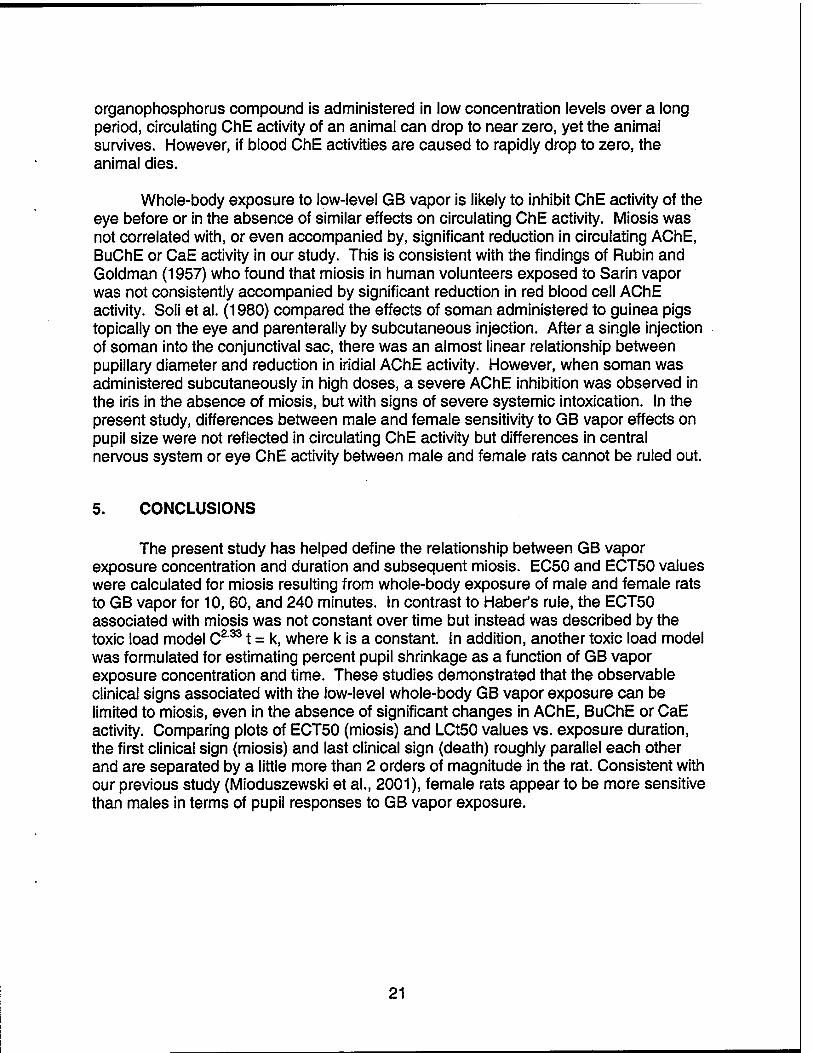
11. Ratio of post-exposure (30 min) to pre-exposure blood acetylcholine activity in air-exposed control and GB vapor exposed female and male rats 28
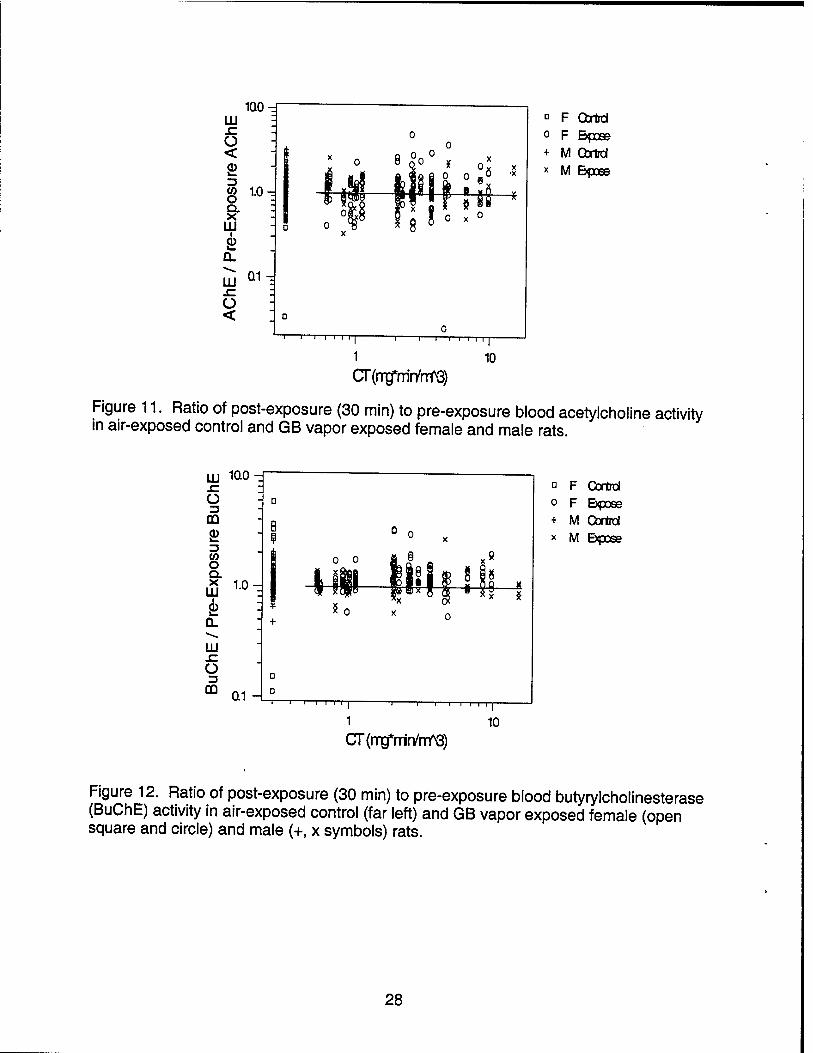
12. Ratio of post-exposure (30 min) to pre-exposure blood butyrylcholinesterase (BuChE) activity in air-exposed control and GB vapor exposed female and male rats 28
13. Ratio of post-exposure (30 min) to pre-exposure blood carboxylesterase (CaE) activity in air-exposed control and GB vapor exposed female and male rats 29

14. Illustration of Bliss slope theory for three rats: Z transform of pupil diameter ratio vs. vapor concentration 29
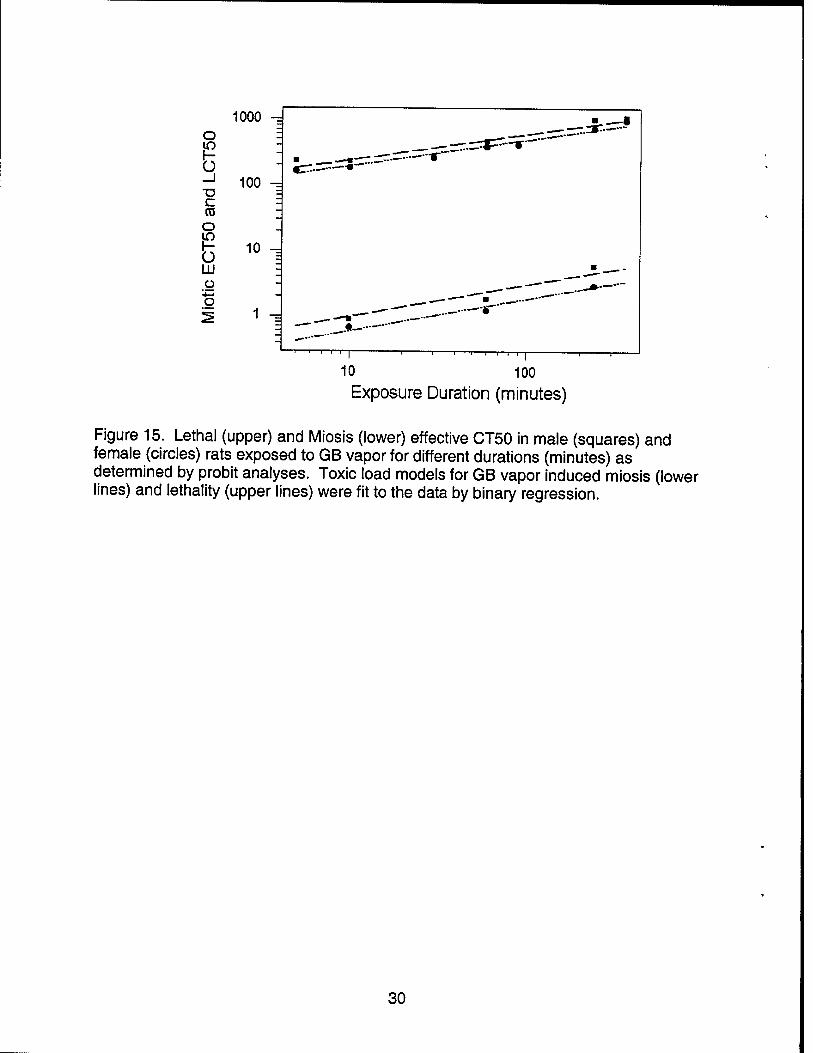
15. Lethal and Miosis effective CT50 in male and female rats exposed to GB vapor for different durations (minutes) as determined by probit analyses 30
TABLES
1. Mean Pupil Diameters and Standard Errors Observed in Female Rats Prior to- and at 30 Minutes, 1, 2, and 7- Days Post-Exposure to a Fixed Concentration of GB Vapor for a Fixed Duration 31
2. Mean Pupil Diameters and Standard Errors Observed in Male Rats Prior to- and at 30 Minutes, 1,2, and 7- Days Post-Exposure to a Fixed Concentration of GB Vapor for a Fixed Duration 33
3. Fraction of Exposed Male and Female Rats That Developed Miosis at Each Combination of GB Vapor Concentration and Duration 35
4. Summary of Slope, EC50, ECT50, and Fiducial Intervals for GB Vapor-Induced Miosis (30 minutes Post-Exposure) at Each of Three Exposure Durations 36

Blank
8

LOW-LEVEL SARIN VAPOR EXPOSURE IN RATS: EFFECT OF EXPOSURE CONCENTRATION AND DURATION ON PUPIL SIZE
1. INTRODUCTION
Acute low-level exposure to sarin (GB) vapor results in both systemic and local toxic effects, which are mediated primarily via inhalation and ocular routes, respectively. Military personnel may be exposed to such concentrations either from residual vapor in the field or in collective protection as a result of carry-through or off- gassing from clothing or equipment. Since there are often no other signs of poisoning, effects on the eye may occur unexpectedly. Large numbers of personnel may be affected for several days. The first eye sign to appear following ocular exposure to low dose nerve agent vapor is miosis, which may be accompanied by a sensation of dimness of vision. With increasing doses, this may be accompanied by ciliary spasm, headache, and eye pain (Sidell, 1992). In addition, there may be contraction of the ciliary muscle of the lens, leading to blurred distance vision and pain on attempting to accommodate for near vision (Rubin and Goldberg, 1957). Conjunctival absorption of sarin results in the local inhibition of acetylcholinesterase (AChE) at target organs such as those associated with the eye. The subsequent accumulation of the neurotransmitter acetylcholine (ACh) causes contraction of the sphincter muscle of the iris, reducing pupil diameter and restricting the amount of light reaching the retina.
In estimating the biological impact of sarin vapor exposure on the eye, it is necessary to quantitatively relate the probability of eye responses, such as miosis, to exposure parameters. At minimum, these exposure parameters include atmospheric concentration (C) and exposure duration or time (T). Reports of the threshold for development of GB vapor-induced miosis range from a CT (product of exposure concentration and time) of 1 to 3 mgmin/m3 (McKee and Woolcott, 1949; Johns, 1952). Sarin vapor effects on the eye gradually increase with the dose of nerve agent received. Depending upon the dose, they include miosis, a sensation of dimness of vision and reduction in the field of view, conjunctivitis, eye pain, headache, sensitivity to bright lights, inability to focus on near objects and pain on trying to do so. Miosis may last for several days, with the duration of the effect dependent on the dose. Historically, GB vapor-induced miosis studies have generally involved relatively short exposure times (less than 40 minutes). Eye effects were evaluated after, rather than during, exposure to a constant concentration of GB vapor for a fixed exposure duration.
The difficulty in using CT to compare data from different studies, is the traditional assumption that integration of vapor concentration overtime (Ct or dosage) is constant overtime, i.e., concentration and time are inversely related and equally important in determining the probability of response. Thus, any combination of GB vapor concentration and time resulting in the same CT would be expected to yield the same level of toxic effect. In addition, the published data on GB vapor-induced miosis

represent estimates of threshold miotic responses in humans and did not investigate dose-response parameters such as the effective concentrations in 50% of the exposed population (EC50) and associated probit slope. The latter is especially useful for modeling and risk assessment applications.
Previously, we examined the relationship between exposure concentration-time and lethal response in rats exposed to GB vapor (Mioduszewski et al., 2001). It was found that the assumption regarding the relationship between exposure dose and lethality used historically (Haber's rule; Haber, 1924) to predict CW agent toxicity is not adequate to describe the lethal response data. Consequently, an empirical model (CT not constant over time) was developed to describe the relative impact of exposure concentration and duration on the probability of lethality in rats exposed to sarin vapor. The objective of the present study was two-fold: a) to determine the EC50 for GB vapor-induced miosis and associated probit slope in the rat and b) to model the relationship between GB vapor exposure concentration (C), duration of exposure (T), and the probability of miosis. This study examined the relationship between exposure concentration and miosis in rats exposed to GB vapor for 10,60 or 240 minutes.
2. MATERIALS AND METHODS
2.1 Chemicals.
Isopropyl methyl phosphono fluoridate (sarin or GB) was used for all vapor exposures in this study. Chemical agent standard analytical reagent material (CASARM)-grade sarin (lot # GB-U-6814-CTF-N (GB2035)) was verified as 98.3 + 0.48 wt. % pure (as determined by quantitative NMR 31P) and stored in sealed ampoules containing nitrogen. Ampoules were opened as needed to prepare external standards or to be used as neat agent for vapor dissemination. All external standards for GB vapor quantification were prepared on a daily basis. Triethylphosphate (99.9% purity), obtained from Aldrich Chemicals, Milwaukee, Wl, was used as the internal standard for the GB purity assay.
Analysis for GB impurities was conducted using acid-base titration as well as Gas Chromatography/Mass spectrometry (GC-MS) and 1H NMR. Acid-base titration showed the following impurity percentages based on mole ratios:
Compound Mole % Calculated Wt % Methyphosphonofluoridic acid (Fluor Acid) 0.3 0.2 Diisopropyl methylphosphonate (DIMP) 0.2 0.3 Methylphosphonic difluoride (DF) 0.2 0.2
GC-MS positively identified DIMP, Diisopropyl phosphorofluoridate, Tributylamine, and Isopropyl ethylphosphonofluoridate, but did not quantify the amount. Tributylamine was also confirmed using 1H NMR with a concentration of <0.1 weiqht % ofGB.
10

2.2 Vapor Generation.
Saturated GB vapor streams were generated by directing nitrogen carrier gas through a glass vessel (multi-pass saturator cell) containing liquid GB. The saturator cell consisted of a 100-mm long, 25-mm o.d. cylindrical glass tube with two (inlet, outlet) vertical 7-mm o.d. tubes connected at each end. The main body of the saturator cell contained a hollow ceramic cylinder that served to increase the contact area between the liquid GB and the nitrogen. The saturator cell was fabricated to allow nitrogen to make three passes along the surface of the wetted ceramic cylinder before exiting the outlet arm of the glass cell. The saturator cell body was also immersed in a constant temperature bath so that a combination of nitrogen flow and temperature could regulate the amount of GB vapor going into the inhalation chamber. This entire apparatus was contained within a generator box mounted at the top of the inhalation chamber.
Typically, the saturator cell was loaded with 2-3 ml of liquid GB (CASARM grade). Immediately after loading, a low nitrogen flow rate (1-2 ml/min) continuously flowed through the cell to maintain the integrity of the liquid GB. This allowed the saturator cell to be used as a generation source for approximately 1-2 weeks.
In this study, the GB vapor concentration in the chamber ranged from 0.01-0.48 mg/m3. Generation and chamber parameters to achieve this range corresponded to a nitrogen generator flow rate of 1-13 ml/min with a water bath temperature of 15-16° C and a chamber flow of 1,600 -1,700 LVnin.
2.3 Inhalation Chamber.
Whole body exposures were conducted in a 750 L dynamic airflow inhalation chamber. The Rochester style chamber was constructed of stainless steel with Plexiglas windows on each of its six sides. The interior of the exposure chamber was maintained under negative pressure (0.50" H20), which was monitored with a calibrated magnehelix (Dwyer, Michigan City, IN). A thermoanemometer (Model 8565, Alnor, Skokie, IL) was used to monitor chamber airflow at the chamber outlet.
2.4 Vapor Sampling/Analysis.
Two sampling methods were used to monitor and analyze the GB vapor concentration in the exposure chamber. The first method was a quantitative technique using solid sorbent tubes (Tenax/Haysep) to trap GB vapor, followed by thermal desorption and gas Chromatographie (GC) analysis (HP Model 6890, Agilent Technology, Baltimore, MD). The second method was a continuous monitoring technique using a phosphorus monitor (HYFED, Model PH262", Columbia Scientific, Austin, TX). Output from the HYFED provided a continuous strip chart record of the rise, equilibrium, and decay of the chamber vapor concentration during an exposure.
All samples were drawn from the same area (middle) of the chamber. Solid sorbent tube samples were drawn after the chamber attained equilibrium (defined as
11

99% of the target concentration for the run) while the HYFED monitored the entire run. Solid sorbent tube samples were drawn from the chamber approximately every 10 min with each sample draw lasting 1-8 min depending upon chamber concentration and duration of exposure. All sample flow rates for the solid sorbent tube systems were controlled with calibrated mass flow controllers (Matheson Gas Products, Montgomeryville, PA). Typical flow rates were 400 seem (standard cubic centimeters per minute) for the sorbent tubes. Flow rates were verified before and after sampling by temporarily connecting a calibrated flow meter (DryCal®, Bios International, Pompton Plains, NJ) in-line to the sample stream.
2.5 Solid Sorbent Tube System.
The automated solid sorbent tube sampling system consisted of four parts: (1) a heated sample transfer line (2) heated external switching valve (3) thermal desorption unit and (4) gas Chromatograph. A stainless steel sample line (1/16" o.d. x 0.004" i.d. x 6' length) extended from the middle of the chamber to an external sample valve. The sample line was commercially treated with a silica coating (Silicasteel® Restek, Bellefonte, PA) and covered with a heated (60° C) sample transfer line (CMS, Birmingham, AL). The combination line coating and heating minimized GB absorption onto sample surfaces. From the transfer line, the sample entered a heated (125° C) 6- port gas-switching valve (UWP, Valco Instruments, Houston, TX). In the by-pass mode, GB vapor from the chamber continuously purged through the sample line and out to a charcoal filter. In the sample mode, the gas sample valve redirected GB vapors from the sample line to a Tenax TA/Haysep sorbent tube (60-80 mesh) located in the thermal desorption unit (ACEM-900, Dynatherm Analytical Instruments, Kelton, PA). Temperature and flow programming within the Dynatherm was used to desorb GB from the sorbent tube directly onto the GC column (RTX-5, 30m, 0.32mm i.d., 1 mm thickness); this was followed by flame photometric detection (FPD - phosphorus mode).
The solid sorbent tube sampling system was calibrated by direct injection of external standards (GB/hexane - ug/ml) into the heated sample line of the Dynatherm. In this way, injected GB standards were put through the same sampling and analysis stream as the chamber samples. A linear regression fit (r2 = 0.999) of the standard data was used to compute for the GB concentration of each chamber sample. The GB exposure concentration represented the mean value of all the sorbent tube samples taken for each exposure.
2.6 Animal Exposures.
Young adult male and female Sprague-Dawley rats (8 to 10 weeks) were purchased from Charles River Laboratories, Inc., Wilmington, MA. Rats were identified by tail tattoo and housed individually in plastic shoebox cages in an Association for Assessment and Accreditation of Laboratory Animal Care International (AAALAC) accredited facility. Ambient holding conditions were maintained at 21 ± 3° C, 40 - 70% relative humidity, and a 12:12 hour light-dark cycle. Rats were provided with certified laboratory rat chow and water ad libitum (automatic watering system using a reverse
12

osmosis process), except during vapor exposure. Animals were quarantined for at least 5 days prior to exposure.
2.6.1 Whole-Body Inhalation Exposures.
All animals were exposed (whole-body) to GB vapor in a 750-liter dynamic airflow inhalation chamber. Rats were exposed to a fixed concentration of GB vapor for a fixed duration, and observed for clinical signs for up to seven days post-exposure. In most exposures, groups of 10 or 20 rats [half male (M) and half female (F)] were exposed in the chamber. However, in one instance male and female rats were exposed separately. The rats of an exposure group were placed in stainless steel compartmentalized cages (20"w x 14"l x 4" h) with each rat in a separate compartment. Physical parameters monitored during exposure included chamber airflow (monitored continuously), as well as chamber room temperature and relative humidity. During inhalation chamber operations, the airflow through the chamber was kept constant. The concentration-time profile generated with this type of inhalation chamber is described in a review by MacFarland (1987). His definition of exposure duration was the one used in this study: the interval from the start of the flow of agent into the chamber to the time-point when the agent supply is stopped. The time required for the vapor concentration to reach 99% of its equilibrium value is denoted as t99. The t99 is also the time required for the chamber to lose 99% of its equilibrium concentration after the agent supply is stopped. Immediately after completion of the exposure period, the chamber was purged with air for a minimum time of t99. Control rats were exposed to air in a separate chamber that was identical in construction to the agent chamber, but was never used for agent exposures.
2.6.2 Blood Sample Collection.
Three blood samples were collected (within 24 hours prior to exposure, within 60 minutes following exposure, and at the time of euthanasia, 7 days post-exposure) from each rat for the purpose of measuring carboxylesterase activity and cholinesterase activity in both red blood cell and plasma components. Blood samples were collected from the tail vein (at 24 hours prior to exposure and within 60 minutes following exposure) and the heart (post-mortem) into glass tubes containing ethylene diamino tetraacetic acid (EDTA). Assays of red blood cell acetyl cholinesterase (AChE), plasma butyryl cholinesterase (BuChE), and carboxylesterase (CaE) activity were performed by the U.S. Army Medical Research Institute of Chemical Defense (USAMRICD), APG, MD, using a modification of the Ellman reference method (Ellman, et al., 1961).
2.6.3 Assessing Pupil Diameter.
The pupil diameter of the left eye was assessed using a simple microscope (Bausch & Lomb, 20x) with a reticule eyepiece insert (Lennox, 1969) under a 100 foot- candle light source, which was verified by a light meter (Davis, Model 401025, Extech Instruments, Waltham, MA). This procedure consisted of counting the number of reticule lines covering the pupil diameter (20 lines/mm or 0.05 mm between lines).
13

2.6.4 Data Analysis.
Statistical analysis routines, including Bliss probit analysis, Mann-Whitney Rank Sum test, Wilcoxon Signed Rank test, analysis of variance, and regression analysis, contained within Minitab®, Version 13 (Minitab, Inc., State College PA), were used for the analysis of the data.
3. RESULTS
Table 1 gives mean pupil diameters and their standard errors for both GB- exposed and air-exposed (control) groups of female rats; Table 2 gives the same information for male rats. Tables 1 and 2 include the initial range-finding runs, which have a single pre-exposure measurement. Some groups did not have control rats. There were 43 rats in the range-finding tests, 120 rats in groups without controls, 10 rats that were exposed to GB the day after their controls (10 rats) were exposed to air, and 120 rats that were exposed to GB at the same time as their controls (120 rats) were exposed to air, for a total of 423 rats. Figures 1-4 show the average pupil diameter pre-exposure, about 30 minutes post-exposure, and at 1,2, and 7 days post- exposure for exposed and control rats by gender.
Each rat was classified as having miosis or not, and statistical methods appropriate for quantal data were used to analyze the data. A rat was classified as having miosis if its pupil diameter, measured approximately 30 minutes after exposure, was half or less of its pre-exposure pupil diameter. The pre-exposure pupil diameter was the geometric mean of several pre-exposure pupil diameter measurements of the rat. By this definition of miosis, six of the 130 control rats Oust under 5%) developed miosis after exposure to air. Table 3 gives the fraction of female and male rats in each GB-exposed group that developed miosis.
Figures 5-10 show the ratio (post-exposure pupil diameter)/(pre-exposure pupil diameter) plotted against the exposure concentration for each exposure duration and gender of rat. Because zero cannot be plotted on a log scale, the pupil diameter ratios for control rats are plotted at arbitrary concentrations less than the lowest concentration actually used. Each control group was assigned a different concentration for plotting in Figures 5-10. A vertical line separates the control and exposed rats.
3.1 Effect of Sarin Vapor on Miosis.
Probit analyses can be found in Table 4 for each duration of exposure, including estimates of EC50's, ECT50's, 95% fiducial intervals, and probit slopes. The difference between male and female rats was statistically significant for 10-minute exposures (p = .014) and 240-minute exposures (p = 0.023), but not quite significant for 60-minute exposures (p =0.054). The EC50 for male rats was approximately 50% higher than the EC50 for female rats. The ratio of male to female rat EC50 increased with exposure duration, but this trend was not statistically significant.
14

3.2 A Toxic Load Model for Probability of Miosis.
Combining all the data on exposed rats (a total of 293 rats, of which 157 had miosis) yielded the following model describing the relationship between probability of miosis and exposure conditions; where sex is coded -1 for female rats and 1 for male rats and the standard error (SE) of each coefficient-is listed below the-coefficient).
Normit1 = 2.5013 - 0.32521- Sex + 3.3137 Log(C) +1.4202 Log(T) [1 ] SE: 0.3728 0.08607 0.4120 0.2458
All model terms in [1] are highly significant (p < .001 ).2 However, the terms Sex- Log(C) and Sex Log(T) were not statistically significant. Hence, the effect of gender is only a change in the constant of the model. The toxic load exponent is 2.33, with approximate standard error 0.24 {from the propagation of error formula (Mood et al. 1974)
SE(A/B) =(A/B)[var(A)/A2 + var(B)/B2-2 covar(A,B)/(A B)](1,2) [2]
where var indicates variance and covar indicates covariance.} Equation [1] determines the combinations of exposure concentration and duration (on the right hand side of the equation) that produce the fraction of rats (on the left hand side) with at least 50% pupil shrinkage.
3.3 A Toxic Load Model for Pupil Diameter.
The Z transform for pupil diameter was used in order to achieve a straight-line relationship between miotic response and exposure conditions. The Z transform requires a number between zero and one as input; we used the ratio (group geometric mean post-exposure pupil diameter) / (group geometric mean pre-exposure diameter) as the input. The group ratios were calculated separately for male and female rats of each exposure group. Thus, there were 48 data points for the analysis. We regressed the Z transform on sex (coded -1 for female and 1 for male), log(C), and log(T). The result was:
Z = -1.1254 + 0.19849 Sex - 1.8356 Log(C) - 0.9372 Log(T) [3] SE: 0.2900 0.08333 0.2377 0.1785
Higher order terms, such as Sex- Log(C) and Log(C)- Log(T), were not statistically significant. The toxic load exponent is 1.96, with approximate standard error 0.29, from Equation [2]. Within the range of the data, equation [3] can be used to find the EC for any definition of miosis. For example, to find the EC for 70% pupil shrinkage (that is, a pupil diameter 30% of pre-exposure size) after a one hour
1 Normit is the Z transform (the inverse cumulative distribution function of the standard normal distribution) of the fraction of rats with miosis. 2 All logarithms in this report are base 10 logarithms; concentrations are given in mg/m3 and exposure durations in minutes.
15
exposure, substitute Z(0.3) for the left hand side of the equation, use T = 60 minutes and Sex = 1 or -1, and solve for Log(C), which is the logarithm of the EC. Equation [3] determines the combinations of exposure concentration and duration (on the right hand side of the equation) that produce the definition of miosis (on the left hand side) in 50% of exposed rats.
3.4 Blood Esterase Activities.
Red blood cell acetylcholinesterase (AChE), plasma butyrylcholinesterase (BuChE), and carboxylesterase (CaE) activities were not significantly inhibited as a result of exposure to various combinations of GB vapor concentration and exposure duration (see Figures 11-13, where control rats are arbitrarily plotted at CT = 0.3 to fit on the log scale for CT). Each rat's post-exposure AChE, BuChE, and CaE activity was divided by its pretreatment value collected at 24 hours prior to exposure. Median pretreatment levels of BuChE activity were consistently higher (P< 0.001) in female (1312 U/ml) than in male rats (494 U/ml), as determined by the Mann-Whitney Rank Sum test. The gender difference was reversed for pretreatment CaE activity, with male rats having a significantly (P<0.001) higher median activity (5.98 U/ml) than female rats (4.90 U/ml), as determined by the Mann-Whitney Rank Sum test. No difference was noted between pretreatment male (1.90 U/ml) and female (1.90 U/ml) median AChE activity. Although the median post- /pre-exposure activity ratio was greater than 1 for both control and exposed rats for each type of esterase activity (p < 0.05 by the Wilcoxon Signed Rank test), there was no difference between the medians of exposed and control rats (by Mann-Whitney Rank Sum test applied to rats in groups with both exposed and control rats) for each type of esterase activity. At seven days post- exposure, there was no statistically significant difference in esterase activity values between exposed and their respective control rats.
4. DISCUSSION
Estimates of EC50 and ECT50 values for miosis and their respective probit slopes were calculated for rats exposed to GB vapor (Table 4). As seen in Figures 5- 10, there is not only variability within a group, but there is a large amount of variability between groups, having similar exposure conditions. For example, of two groups exposed to 0.015 mg/m3 of GB for 240 minutes, the ratio (post-exposure pupil diameter) / (pre-exposure pupil diameter) ranged from 0.09 to 0.30 for one group, and from 0.33 to 0.80 for the other group. Pupil diameter of rats exposed to GB vapor may vary due to causes other than the experimental factors of GB concentration and exposure duration. Possible types of variability are classified into seven component categories and listed with their respective sources below:
16

Number Component Source Component Name « . . . .. .. .. Between-rat variance in
1 Some rats have larger pupils than others. pupj| djameter
A *. -i _i- ii *■». Within-rat variance in 2 A rat's pupil diameter will vary over time. pupj| djameter
3 Error associated with measuring pupil Short-term measurement diameter. error
. Measurement error affecting a group of rats Long-term measurement rather than individual rats. error
Between-rat variance in sensitivity Within-rat variance in sensitivity
Other factors affecting pupil diameter may Extraneous factors vary during the experiment.
5 Differences in sensitivity to GB among rats.
6 Sensitivity to GB varies over time.
7
4.1 Bliss Slope from Probit Analysis.
The Bliss slope should be based only on the total of between-rat sensitivity to GB and within-rat sensitivity to GB (numbers 5 and 6 above). The between-rat variance in pupil diameter is removed by using the ratio of post-exposure pupil diameter to pre-exposure pupil diameter. Other sources of variance in the measurements are not so easily removed from a probit analysis. The classification of rats as having miosis or not, based on pupil diameter, does not eliminate the measurement errors or the within-rat variance in pupil diameter. Misclassification of some rats can contribute to variability of the measurements resulting in a lower Bliss slope. Extraneous factors can also reduce the Bliss slope in both lethality studies and studies of miosis. However, measurement error and within-rat variance in pupil diameter reduce the Bliss slope in studies of miosis, but not in lethality studies.
For comparison, in a lethality experiment, the first four components either do not exist, or are very small. For example, there is no between-rat variance because none of the rats would be dead at the beginning of the experiment; nor would there be within- rat variance because rats do not alternate between being alive and being dead. The measurement error in a lethality study is extremely small because the probability of classifying a live rat as dead is small, and the probability of classifying a dead rat as alive is even smaller.
4.2 Bliss Slope for Miosis from Modeling Pupil Diameter.
For fixed exposure duration, every rat has a concentration that is just sufficient to produce miosis (that is, 50% pupil shrinkage). These just-sufficient concentrations are called effective concentrations to distinguish them from the exposure concentrations used in an experiment. If we knew the effective concentration (EC) for each rat, we could compute the Bliss slope directly as 1/{standard deviation[log(EC)]}, which is the definition of the slope in the Bliss Probit method. But we do not know the effective
17
concentrations; instead, we have measurements of the pupil diameters of the rats in each exposure group. This situation for three hypothetical rats exposed to a GB vapor concentration of 0.2 mg/m3 is illustrated in Figure 14. The solid dots represent their effective concentrations and the circles represent the Z transform of their pupil diameter ratios (post-exposure / pre-exposure). The lines show how equation [3] can be used to convert results for Z(post/pre ratio) to log(EC). Hence, we calculate the standard deviation of Z(post/pre ratio) and use the regression coefficient on log(C) from [3] to convert that standard deviation to a standard deviation of log(EC).
The values of Z(post/pre ratio) for rats of one gender in an exposure group vary due to measurement error and within-rat variance in pupil size as well as differences in sensitivity to sarin. However, the variance of Z(post/pre ratio) due to differences in sensitivity to sarin can be separated from the other sources of variance by an analysis of variance. The analysis of variance requires at least two pre-exposure readings and at least two post-exposure readings made during the period of strong miotic response. The observations for each rat are defined (in an obvious notation) as Z(post1/pre1), Z(post2/pre2), etc. The analysis of variance has factors exposure group (G), sex (S), rat (R) nested within exposure group and sex, observation (O), and interactions GxS, G x O, S x O, G x S x O, and R x O. In this analysis of variance, pupil diameter variance (not due to sarin exposure) has been eliminated by dividing by the pre- exposure readings. Within-rat variance in pupil diameter (not due to sarin exposure) and short-term measurement error go into the R x O interaction. Long-term measurement error goes into the group factor or the G x O interaction. The component of variance for rats in this analysis of variance is the variance of Z(post/pre ratio) due to between-rat and within-rat variance in sensitivity to sarin. The square root of the rat variance component is the standard deviation of Z(post/pre ratio) due to differences in sensitivity to sarin exposure. This method was applied using 3 pre-exposure readings and 3 post-exposure readings made at 10, 30, and 120 minutes post-exposure. Data were collected on rats from three exposure groups (T = 240 minutes; C = 0.019, 0 040 0.011 [female], and 0.062 [male] mg/m3). No data were lost due to a post/pre ratio greater than or equal to one. The variance component for rat was .1346; its square root is .3669, yielding a Bliss slope of 1.836/0.3669 = 5.0 (with approximate standard error 1.1) for concentration and 0.937/0.3669 = 2.6 (with approximate standard error 0.7) for exposure duration. These Bliss slopes are higher than the probit-analysis slopes from equation [1], which is to be expected because the probit-analysis slopes contain measurement error and within-rat variability.
4.3 Comparison to Lethality.
Figure 15 shows the LCT50 for lethality (within two weeks of exposure) from Mioduszewski et al, 2001 and the ECT50 for miosis (from Table 4) as a function of exposure duration. The straight lines through the LCT50 points are a fit of the toxic load model with a term for gender difference to the lethality data. The lines through the miotic ECT50 points are a prediction of the CT required for 50% pupil shrinkage from [3], the model for pupil diameter as a continuous response. That these lines appear to be a good fit to the ECT50 points from the probit analyses shows reasonable agreement between the analysis of pupil diameter as a continuous response and the
18
analysis of miosis as a quantal response. Although the effect of sex appears larger for miosis than lethality, this difference was not statistically significant when tested in a model using the combined lethality and (quantal) miosis data.
Combining data from several exposure durations typically lowers the estimate of the Bliss slope on concentration. Thus, we must compare slopes from studies of miosis and lethality by similar analyses. The toxic load model for the lethality data of Mioduszewski et al (2001) has probit slopes of 6.4 (with standard error 0.5) for concentration and 3.8 (with standard error 0.3) for duration. Thus, we can say that the Bliss slopes on C and T for miosis (5.0 ± 1.1 for concentration and 2.6 ± .7 for duration) are not statistically different from the slopes for lethality.
4.4 Pupil Response to GB Vapor Exposure.
Unlike our earlier study (Mioduszewski et al., 2001) where marked miosis progressed temporarily to mydriasis in rats exposed to dosages of GB vapor in the lethal range, mydriasis was not consistently found with low-level exposures in the present study (Figures 1-4). Although this is likely to be a function of exposure dose, the possibility that the measurement times used in our study may have missed this phenomenon cannot be ruled out.
4.5 Assessing Estimates of GB Vapor-Induced Miosis.
Several investigators have reported miosis in animals and humans following controlled and measured exposure doses of GB vapor (McKee and Woolcott, 1949; Johns, 1952, Jacobson, et al., 1954; Van Helden et al., 2001). Consequently, most have estimated threshold exposure doses for GB-induced miosis. However, none of the previous studies were designed to estimate dose-response relationships with associated slopes and confidence intervals for GB vapor-induced miosis (a fixed level of response) for an exposed population. When comparing the results of various studies involving GB vapor-induced miosis, it is important to distinguish between different estimates of miosis, how they were derived and how they should be applied. For example, McKee and Woolcott (1949) reported that nominal GB vapor concentrations of 0.082 mg/m3 for 40 min (3.3 mg min/m3) resulted in miosis in human volunteers on the first day of a three day repeated exposure whereas the same nominal concentration for 20 minutes did not result in miosis until the third day of a repeated exposure.3 Their estimates of effective concentrations for GB-induced miosis in humans are greater than those observed in the present study (Table 4) for miosis in the rat. Furthermore, in the same study, McKee and Woolcott (1949) reported miosis occurred when four men were exposed to 0.6 mg/m3 GB vapor over 1 minute (0.6 mg min/m3). Their results appear to be consistent with those of the present study in which CT (miosis) is not constant over time.
3 Analytical concentrations were considered to be approximately % of nominal, i.e., 0.062 mg/m3 for 40 min (2.4 mg.min/m3) in McKee and Woolcott (1949).
19
According to Johns (1952), the ECT50 (miosis) for humans exposed to GB vapor is 2-4 mg min/m . He also estimated that 0.5 mg min/m3 GB vapor would not result in miosis if the exposure was less than 20 minutes, i.e., 0.025 mg/m3 for less than 20 min. Likewise, the results of our study would not predict miosis to occur at 0.025 mg/m3 GB vapor for 10 or possibly even 20 minute exposures in rats.
Jacobson et al. (1954) reported miosis during the first exposure of dogs to GB vapor (0.5 mg/m3 for 20 min or 0.04 mg/m3 for 240 min). Also, subsequent daily GB vapor exposure at these two conditions over a six month period produced miosis. The latter concentration-time is consistent with the EC50 values reported for 240 min in rats in the present study.
In order to assess the lowest adverse effect level (LOAEL; miosis) for GB vapor, Van Helden et al. (2001) exposed guinea pigs (one per concentration) to 7.5,15,25,50 or 150 Mg/m3 GB vapor for 5 hrs. Van Helden et al. (2001) reported a minimum (5%) but statistically significant decrease in pupil size (versus air exposed controls) which occurred during the last hour of a five hour exposure at the lowest concentration tested (7.5 pg/m ). Miosis was manifest much earlier in the 5 hr exposure period at higher concentrations (15-150 Mg/m3). The relationship of guinea pig pupil size to GB vapor exposure duration appears as a backwards S-shaped curve in Figure 6 of Van Helden et al. (2001). They used a "gas to effect" study design, as opposed to the "gas for fixed time and observe effect" approach used in the present study. The former design approach is sufficient to estimate a threshold concentration-time for miosis, whereas an estimate of the exposed population EC50 (miosis) and probit slope require additional data. Comparisons of our results with those of Van Helden et al. (2001) are further complicated by the following differences: a) species (restrained guinea pigs vs. unrestrained rats), b) exposure conditions (gas to effect vs. gas for fixed time), c) pupil measurement lighting (100 lux vs 100 foot candles), and d) definition of miosis (5% vs 50% decrease in pupil size from baseline), just to name a few. Nevertheless, it appears that miosis was occurring at GB vapor dosages (CT) that were roughly similar between Van Helden et al. (2001) [1.8 ± 0.3 mg.min/m3, (average for male guinea pigs)] and the present study [1.8 (1.34 -2.58) mg.min/m3 (male rats) for 1 hour] in spite of the differences mentioned above. The one-hour values were chosen for comparison because miosis was usually noted within the first hour of GB vapor exposure.
The present study is distinguished from others in that it determined: a) EC50s for GB vapor-induced miosis and associated probit slope in the rat for several exposure durations and b) modeled the relationship between GB vapor exposure concentration (C), duration of exposure (T), and the probability of miosis.
4.6 Low-Level GB Vapor Effects on Blood Esterase Activity.
Although red blood cell and plasma cholinesterase activities are routinely monitored as a sensitive index of exposure to anti-cholinesterase agents, they by no means imply anti-cholinesterase intoxication (Koelle, 1994). Sidell (1992) suggests that activity of the circulating ChE does not parallel the activity of ChE in tissue and that tissue function can be reasonably normal even with minimal blood ChE activity. If an
20
organophosphorus compound is administered in low concentration levels over a long period, circulating ChE activity of an animal can drop to near zero, yet the animal survives. However, if blood ChE activities are caused to rapidly drop to zero, the animal dies.
Whole-body exposure to low-level GB vapor is likely to inhibit ChE activity of the eye before or in the absence of similar effects on circulating ChE activity. Miosis was not correlated with, or even accompanied by, significant reduction in circulating AChE, BuChE or CaE activity in our study. This is consistent with the findings of Rubin and Goldman (1957) who found that miosis in human volunteers exposed to Sarin vapor was not consistently accompanied by significant reduction in red blood cell AChE activity. Soli et al. (1980) compared the effects of soman administered to guinea pigs topically on the eye and parenterally by subcutaneous injection. After a single injection of soman into the conjunctival sac, there was an almost linear relationship between pupillary diameter and reduction in iridial AChE activity. However, when soman was administered subcutaneously in high doses, a severe AChE inhibition was observed in the iris in the absence of miosis, but with signs of severe systemic intoxication. In the present study, differences between male and female sensitivity to GB vapor effects on pupil size were not reflected in circulating ChE activity but differences in central nervous system or eye ChE activity between male and female rats cannot be ruled out.
5. CONCLUSIONS
The present study has helped define the relationship between GB vapor exposure concentration and duration and subsequent miosis. EC50 and ECT50 values were calculated for miosis resulting from whole-body exposure of male and female rats to GB vapor for 10, 60, and 240 minutes. In contrast to Habeas rule, the ECT50 associated with miosis was not constant over time but instead was described by the toxic load model C2331 = k, where k is a constant. In addition, another toxic load model was formulated for estimating percent pupil shrinkage as a function of GB vapor exposure concentration and time. These studies demonstrated that the observable clinical signs associated with the low-level whole-body GB vapor exposure can be limited to miosis, even in the absence of significant changes in AChE, BuChE or CaE activity. Comparing plots of ECT50 (miosis) and LCt50 values vs. exposure duration, the first clinical sign (miosis) and last clinical sign (death) roughly parallel each other and are separated by a little more than 2 orders of magnitude in the rat. Consistent with our previous study (Mioduszewski et al., 2001), female rats appear to be more sensitive than males in terms of pupil responses to GB vapor exposure.
21

Blank
22

(0 CD c
Ü2
£ £ m E v tr .sS 8 n
cö ©
3 ,_ Q. -~~ O OS s CD
3
18
16
14
12
10
8
6
4
2
Exposed Duration (Female Rats)
♦ 10 min H 60 min A 240 min
Pre-Exposure Post-Exposure 1 Day Post- Exposure
When Observed
2 Days Post- Exposure
7 Days Post- Exposure
Figure 1. Mean and Standard Error of Pupil Diameters for Female Rats Exposed to GB Vapor at 10, 60 or 240 minutes.
CO
c
3 I rr fc
<- w •- 9
CD ,,' N "
W § ö.^ 3 T- O. w
CD
£? to CD > <
16
14
12
10
8
6
4
2
0
T
T /k k. s /-L^t F^ ̂ ^^ w— "^f
X
^^*^ ̂ r ^r Ex posed Male Rat
~"♦""10 min
-*-240 min
Pre-Exposure Post-Exposure 1 Day Post- Exposure
When Observed
2 Days Post- Exposure
7 Days Post- Exposure
Figure 2. Mean and Standard Error of Pupil Diameters for Male Rats Exposed to GB Vapor at 10, 60 or 240 minutes.
23

n u c
CE e
8 »' (0
3 T- a -^ 0 O) 2
I
16
14
12
10
8
6
4
2
0
K *=^ Ov,
^4—■= —AiHExposed—
(Female Rats)
• 10 min
■ 60 min
— A 240 min
—
Pre-Exposure Post-Exposure 1 Day Post- Exposure
When Observed
2 Days Post- Exposure
7 Days Post- Exposure
Figure 3. Mean and Standard Error of Pupil Diameters for Female Rats Exposed to Air at 10, 60 or 240 minutes.
M a c
if DC fc
in £ a 8 li 8s a — 3 J- o. w
0) en 2
1
16
14
12
10
8
6
4
2
0
Air Exposed /Male Ratet
♦ 10 min ■ 60 min
_ A 240 min
Pre-Exposure Post-Exposure 1 Day Post- Exposure
When Observed
2 Days Post- Exposure
7 Days Post- Exposure
Figure 4. Mean and Standard Error of Pupil Diameters for Male Rats Exposed to Air at 10, 60 or 240 minutes.
24

£ 1.0 Q_
CO o Q_
CD
E 22 b 0.1
Q.
Q.
■I
-i—i—i i i ii ii -i—i—i i i 11 II
0.001 1.000 0.010 0.100
Concentration (mg/mA3)
Control Rats at Arbitrary Concentrations to the Left of the Vertical Line
Figure 5. Ratio of post-exposure (30 min) to pre-exposure pupil diameter in female rats exposed to fixed concentrations of GB vapor for 10 minutes.
8> 1.0 Q_
+■* CO o i_
E .co b o.i "5. a.
9
■ l ■ 1 1 ;•
■ J ' ■ ■ ■•
■ 1 ■
'.4 ■■
■ •* ■ • •
1 f— i »ii MM 1
•
i i i i i i II
■
i i i i i 1111
0.001 1.000 0.010 0.100
Concentration (nrg/m^)
Control Rats at Arbitrary Concentrations to the Left of the Vertical Line
Figure 6. Ratio of post-exposure (30 min) to pre-exposure pupil diameter in male rats exposed to fixed concentrations of GB vapor for 10 minutes.
25

CD
(0 o CL i_
E eg b
1.0 -
— 0.1 - Q. =3
CL
0.01 0.10
Concentration (mg/nY^)
Control Rats at Arbitrary Concentrations to the Left of the Vertical Line
Figure 7. Ratio of post-exposure (30 min) to pre-exposure pupil diameter in male rats exposed to fixed concentrations of GB vapor for 60 minutes.
^ S> 1.0- ■ ■ Q- : : ' i i
i . ■ t— (O i •1 ■ o i
D_ * ■ i •
^*—■" ■ U.
o • ■*-> ■ <D E ■
CO
5 ei- • ■ CL ■ 3 Q. :
- i i ~
0.01 0.10 Concentration (mg/rrV^)
Control Rats at Arbitrary Concentrations to the Left of the Vertical Line
Figure 8. Ratio of post-exposure (30 min) to pre-exposure pupil diameter in female rats exposed to fixed concentrations of GB vapor for 60 minutes.
26

• •
st /
Pre ö
11 I.I
■■■!-si: 1 ! ■
■ • •
o ■ " 1
0- -i •
"*■"' •
1_
CD +■> o • E 9 m ■ • CO
Q ■ • ■ 1
1. 0.1 - ■ 1
■
D Q. "
-
0.10 T
0.01 Concentration (mg/mA3)
Control Rats at Arbitrary Concentrations to the Left of the Vertical Line
Figure 9. Ratio of post-exposure (30 min) to pre-exposure pupil diameter in female rats exposed to fixed concentrations of GB vapor for 240 minutes.
I • : ■ !- •
: > •■:: i ■ ■ ■ ■
1
■ 1
I • l
• •
• : • ■ ■
■
* ■
■
• ■ •
1 •
■ a
■ 1
■
•
1 1 1 1 1 1 1 1 i l l l l l |
£ 1.0 -\ a. CO o 0-
& CD
E eg Q 1. 0.1 H
Q_
0.01 0.10
Concentration (mg/rry^)
Control Rats at Arbitrary Concentrations to the Left of the Vertical Line
Figure 10. Ratio of post-exposure (30 min) to pre-exposure pupil diameter in male rats exposed to fixed concentrations of GB vapor for 240 minutes.
27
1Q(W 111
Ü <
Q. X
111
8> 0.
UJ
O <
Q1 -
T""" i " I1" i i n i t i i i i
D F Qrtd o F Bpoee + M Qrtd x M Bpoee
1 10
CT(ntfm'rVrrft3)
Figure 11. Ratio of post-exposure (30 min) to pre-exposure blood acetylcholine activity in air-exposed control and GB vapor exposed female and male rats.
UJ 10.0 ^f .c Ü Z3
00 8> CO O Q. x 10 - UJ u ^ ■ e
0_
LU
Ü 3
CD 01
o o
441- $ sap
~i—i—i—i—111 -T—i—i—r-
D F Cortrol o F Bpose + M Cortrol x M Bqxee
10
Cr(mg*m'iYrr^3)
Figure 12. Ratio of post-exposure (30 min) to pre-exposure blood butyrylcholinesterase (BuChE) activity in air-exposed control (far left) and GB vapor exposed female (open square and circle) and male (+, x symbols) rats.
28

LU CO Ü S> CO o Q. X 1
111 I
CD Q.
LU CO Ü
o °o
-1 1—I—I—I I I
6 9 x 5 x
TO o ■ x 5
So * >p
T 1 1 1 I—I I I
10 CT(mg*rrirVrrr\3)
D F Control 0 F Expose + M Cortrol X M Expose
Figure 13. Ratio of post-exposure (30 min) to pre-exposure blood carboxylesterase (CaE) activity in air-exposed control (far left) and GB vapor exposed female (open square and circle) and male (+, x symbols) rats.
E CO
b '5.
Q. ■*-1
CO o
N
2-
0-
-2-
\ I I i i i
0.01
1 1—i—\—i—i i 11
0.10
Oonoentration (mg / mfö)
Figure 14. Illustration of Bliss slope theory for three rats: Z transform of (post/pre) pupil diameter ratio vs. vapor concentration. Measured pupil diameters (open circles) are obtained at exposure concentration, but effective concentrations (solid dots) are just sufficient to cause miosis.
29
o
I _J ■o c (0 o
e 111 o
1000 -r
100 -=
10 -=
10 100
Exposure Duration (minutes)
Figure 15. Lethal (upper) and Miosis (lower) effective CT50 in male (squares) and female (circles) rats exposed to GB vapor for different durations (minutes) as determined by probit analyses. Toxic load models for GB vapor induced miosis (lower lines) and lethality (upper lines) were fit to the data by binary regression.
30

Table 1. Mean Pupil Diameters and Standard Errors (SE) Observed in Female Rats Prior to- and at 30 Minutes (POST), 1, 2, and 7- Days Post-Exposure to a Fixed Concentration (C) of GB Vapor for a Fixed Duration (T). Measurement units are reticule lines; 1 line = 0.05 mm
T (min)
C (mg/m3) Group P* N" Value Pre Post 1-day 2-day 7-day
10 0.0100 Exposed 1 5 Mean 9.00 7.80 10.20 10.00 8.20
10 0.0100 Exposed 1 5 SE 0.63 0.73 0.66 0.55 0.49 10 0.0600 Exposed 2 10 Mean 9.50 7.00 7.60 10.30 12.90 10 0.0600 Exposed 2 10 SE 0.24 0.56 0.54 0.83 0.67 10 0.0630 Exposed 3 5 Mean 8.73 3.80 5.60 5.40 7.40 10 0.0630 Exposed 3 5 SE 1.01 0.66 0.40 0.40 0.25 10 0.0630 Control 3 5 Mean 8.27 5.80 8.20 6.00 7.00 10 0.0630 Control 3 5 SE 0.66 0.58 1.07 0.84 0.71 10 0.0800 Exposed 1 4 Mean 10.40 3.60 8.20 9.00 * 10 0.0800 Exposed 1 4 SE 0.93 0.40 1.16 0.89 * 10 0.1000 Exposed 3 5 Mean 8.67 3.40 5.60 12.40 6.60 10 0.1000 Exposed 3 5 SE 0.99 1.03 0.40 2.18 0.68 10 0.1000 Control 3 5 Mean 8.27 5.60 6.40 9.00 6.40 10 0.1000 Control 3 5 SE 0.41 0.40 0.25 1.45 0.40 10 0.1100 Exposed 2 10 Mean 14.70 4.40 9.70 11.70 8.00 10 0.1100 Exposed 2 10 SE 1.60 0.34 0.47 0.73 0.42 10 0.2000 Exposed 4 5 Mean 11.85 1.10 6.20 11.20 8.20 10 0.2000 Exposed 4 5 SE 0.65 0.25 0.73 0.58 0.58 10 0.2000 Control 4 5 Mean 11.85 10.80 8.20 9.40 8.00 10 0.2000 Control 4 5 SE 0.65 1.11 0.49 0.40 0.71 10 0.2200 Exposed 1 4 Mean 9.40 1.60 6.80 9.60 * 10 0.2200 Exposed 1 4 SE 0.98 0.19 1.02 1.63 * 10 0.4800 Exposed 1 2 Mean 11.50 1.25 7.00 15.50 11.50 10 0.4800 Exposed 1 2 SE 3.50 0.75 4.00 7.50 3.50
40 0.0100 Exposed 1 5 Mean 11.00 10.80 11.40 11.60 11.20 40 0.0100 Exposed 1 5 SE 1.05 0.58 0.60 1.44 0.97
60 0.0150 Exposed 2 10 Mean 9.50 6.70 9.10 10.30 16.80 60 0.0150 Exposed 2 10 SE 0.44 0.60 0.77 0.21 1.13 60 0.0160 Exposed 3 5 Mean 10.10 5.40 8.50 8.00 7.25 60 0.0160 Exposed 3 5 SE 1.42 0.75 0.96 1.22 0.85 60 0.0160 Control 3 5 Mean 9.27 6.60 7.60 8.00 7.80 60 0.0160 Control 3 5 SE 0.88 0.51 0.75 0.55 0.49 60 0.0340 Exposed 2 10 Mean 11.85 5.40 6.10 6.40 7.30 60 0.0340 Exposed 2 10 SE 0.67 0.40 0.28 0.43 0.30 60 0.0430 Exposed 3 5 Mean 10.80 2.80 5.40 7.20 6.40 60 0.0430 Exposed 3 5 SE 0.79 0.58 0.93 1.20 0.40 60 0.0430 Control 3 5 Mean 10.33 6.00 6.80 9.40 8.40
31
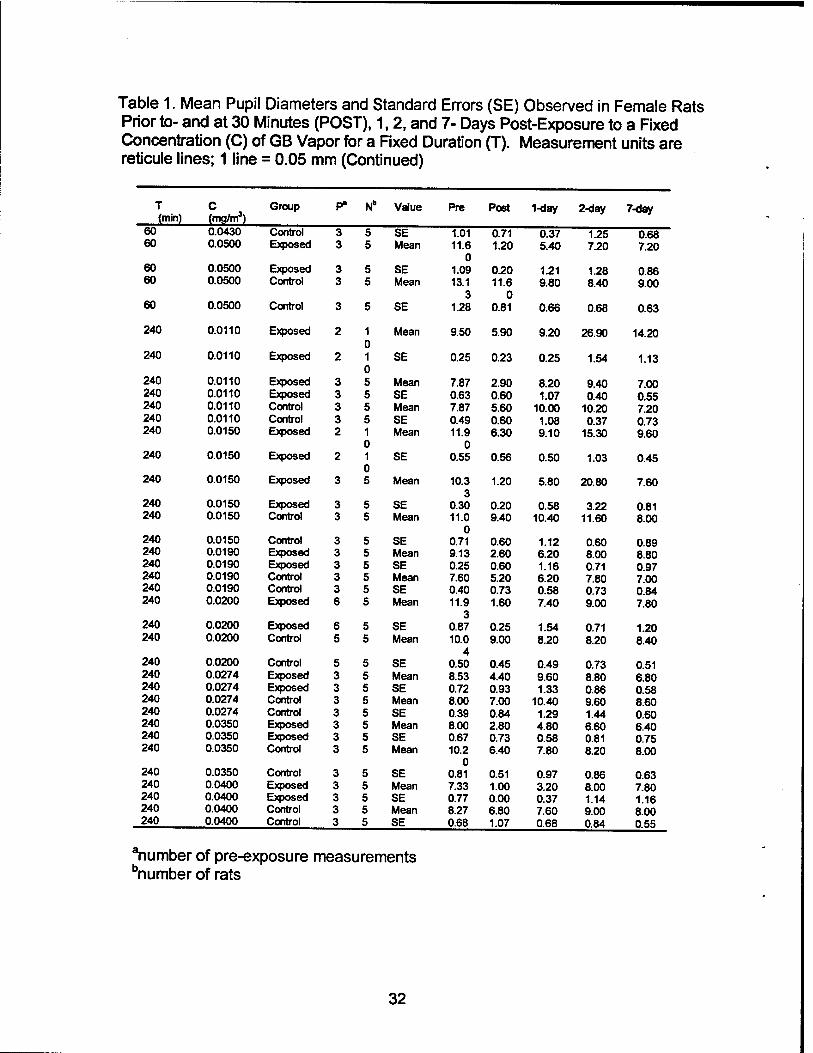
Table 1. Mean Pupil Diameters and Standard Errors (SE) Observed in Female Rats Prior to- and at 30 Minutes (POST), 1,2, and 7- Days Post-Exposure to a Fixed Concentration (C) of GB Vapor for a Fixed Duration (T). Measurement units are reticule lines; 1 line = 0.05 mm (Continued)
T C Group P" Nb Value Pre Post 1-day 2-day 7-day (min) (mg/m3)
60 0.0430 Control 3 5 SE 1.01 0.71 0.37 1.25 0.68 60 0.0500 Exposed 3 5 Mean 11.6
0 1.09
1.20 5.40 7.20 7.20
60 0.0500 Exposed 3 5 SE 0.20 1.21 1.28 0.86 60 0.0500 Control 3 5 Mean 13.1
3 1.28
11.6 0
0.81
9.80 8.40 9.00
60 0.0500 Control 3 5 SE 0.66 0.68 0.63
240 0.0110 Exposed 2 1 0 1 0 5
Mean 9.50 5.90 9.20 26.90 14.20
240 0.0110 Exposed 2 SE 0.25 0.23 0.25 1.54 1.13
240 0.0110 Exposed 3 Mean 7.87 2.90 8.20 9.40 7.00 240 0.0110 Exposed 3 5 SE 0.63 0.60 1.07 0.40 0.55 240 0.0110 Control 3 5 Mean 7.87 5.60 10.00 10.20 7.20 240 0.0110 Control 3 5 SE 0.49 0.60 1.08 0.37 0.73 240 0.0150 Exposed 2 1
0 1 0 5
Mean 11.9 0
0.55
6.30 9.10 15.30 9.60
240 0.0150 Exposed 2 SE 0.56 0.50 1.03 0.45
240 0.0150 Exposed 3 Mean 10.3 3
0.30
1.20 5.80 20.80 7.60
240 0.0150 Exposed 3 5 SE 0.20 0.58 3.22 0.81 240 0.0150 Control 3 5 Mean 11.0
0 0.71
9.40 10.40 11.60 8.00
240 0.0150 Control 3 5 SE 0.60 1.12 0.60 0.89 240 0.0190 Exposed 3 5 Mean 9.13 2.60 6.20 8.00 8.80 240 0.0190 Exposed 3 5 SE 0.25 0.60 1.16 0.71 0.97 240 0.0190 Control 3 5 Mean 7.60 5.20 6.20 7.80 7.00 240 0.0190 Control 3 5 SE 0.40 0.73 0.58 0.73 0.84 240 0.0200 Exposed 6 5 Mean 11.9
3 0.87
1.60 7.40 9.00 7.80
240 0.0200 Exposed 6 5 SE 0.25 1.54 0.71 1.20 240 0.0200 Control 5 5 Mean 10.0
4 0.50
9.00 8.20 8.20 8.40
240 0.0200 Control 5 5 SE 0.45 0.49 0.73 0.51 240 0.0274 Exposed 3 5 Mean 8.53 4.40 9.60 8.80 6.80 240 0.0274 Exposed 3 5 SE 0.72 0.93 1.33 0.86 0.58 240 0.0274 Control 3 5 Mean 8.00 7.00 10.40 9.60 8.60 240 0.0274 Control 3 5 SE 0.39 0.84 1.29 1.44 0.60 240 0.0350 Exposed 3 5 Mean 8.00 2.80 4.80 6.60 6.40 240 0.0350 Exposed 3 5 SE 0.67 0.73 0.58 0.81 0.75 240 0.0350 Control 3 5 Mean 10.2
0 0.81
6.40 7.80 8.20 8.00
240 0.0350 Control 3 5 SE 0.51 0.97 0.86 0.63 240 0.0400 Exposed 3 5 Mean 7.33 1.00 3.20 8.00 7.80 240 0.0400 Exposed 3 5 SE 0.77 0.00 0.37 1.14 1.16 240 0.0400 Control 3 5 Mean 8.27 6.80 7.60 9.00 8.00 240 0.0400 Control 3 5 SE 0.68 1.07 0.68 0.84 0.55
dumber of pre-exposure measurements "number of rats
32

Table 2. Mean Pupil Diameters and Standard Errors (SE) Observed in Male Rats Prior to- (PRE) and at 30 Minutes (POST), 1,2, and 7- Days Post-Exposure to a Fixed Concentration (C) of GB Vapor for a Fixed Duration (T). Measurement units are reticule lines; 1 line = 0.05 mm
T (min)
C (mg/m3) Group P* Nb Value Pre Post 1-day 2-day 7-day
10 0.0100 Exposed 1 5 Mean 11.00 10.20 10.60 9.80 11.00 10 0.0100 Exposed 1 5 SE 1.00 1.32 0.98 0.66 0.45 10 0.0600 Exposed 2 10 Mean 9.00 8.50 9.60 9.10 13.80 10 0.0600 Exposed 2 10 SE 0.57 0.64 0.22 0.35 0.98 10 0.0630 Exposed 3 5 Mean 10.80 7.00 9.80 7.60 8.40 10 0.0630 Exposed 3 5 SE 0.69 0.84 0.58 0.40 0.51 10 0.0630 Control 3 5 Mean 10.60 8.80 10.40 7.40 9.00 10 0.0630 Control 3 5 SE 0.70 0.58 0.25 0.51 0.32 10 0.0800 Exposed 1 4 Mean 11.20 5.60 10.40 9.40 * 10 0.0800 Exposed 1 4 SE 1.24 0.68 1.63 1.25 * 10 0.1000 Exposed 3 5 Mean 9.00 4.00 6.00 11.60 8.60 10 0.1000 Exposed 3 5 SE 0.33 1.10 0.84 0.93 0.68 10 0.1000 Control 3 5 Mean 8.67 7.20 7.00 10.80 7.20 10 0.1000 Control 3 5 SE 0.38 0.58 0.32 0.86 0.97 10 0.1100 Exposed 2 10 Mean 12.80 5.80 9.60 8.10 8.80 10 0.1100 Exposed 2 10 SE 0.47 0.51 0.52 0.46 0.33 10 0.2000 Exposed 4 5 Mean 12.55 2.60 6.40 12.60 10.80 10 0.2000 Exposed 4 5 SE 1.10 0.68 0.81 2.40 1.32 10 0.2000 Control 4 5 Mean 12.30 11.40 8.60 9.80 9.40 10 0.2000 Control 4 5 SE 1.31 1.54 1.12 1.46 0.60 10 0.2200 Exposed 1 4 Mean 9.80 2.80 8.20 10.20 * 10 0.2200 Exposed 1 4 SE 0.66 0.58 0.97 1.74 * 10 0.4800 Exposed 1 1 Mean 10.00 1.00 6.00 10.00 11.00 10 0.4800 Exposed 1 1 SE * * * * *
40 0.0100 Exposed 1 5 Mean 10.40 8.20 8.60 8.20 9.40 40 0.0100 Exposed 1 5 SE 0.75 0.49 0.60 0.73 0.40
60 0.0150 Exposed 2 10 Mean 9.35 6.90 9.40 12.10 14.70 60 0.0150 Exposed 2 10 SE 0.37 0.71 0.60 0.69 0.97 60 0.0160 Exposed 3 5 Mean 9.07 7.20 7.40 7.80 9.40 60 0.0160 Exposed 3 5 SE 1.09 0.58 0.68 0.58 0.40 60 0.0160 Control 3 5 Mean 10.67 8.20 8.40 8.80 9.40 60 0.0160 Control 3 5 SE 0.81 0.66 0.60 0.80 0.40 60 0.0340 Exposed 2 10 Mean 13.95 7.50 7.40 7.20 8.60 60 0.0340 Exposed 2 10 SE 0.87 0.52 0.31 0.47 0.56 60 0.0430 Exposed 3 5 Mean 11.20 5.20 7.20 10.60 8.60 60 0.0430 Exposed 3 5 SE 0.56 0.49 0.49 1.21 0.25 60 0.0430 Control 3 5 Mean 12.87 8.00 9.20 10.60 9.20
33

Table 2. Mean Pupil Diameters and Standard Errors (SE) Observed in Male Rats Prior to- (PRE) and at 30 Minutes (POST), 1,2, and 7- Days Post-Exposure to a Fixed Concentration (C) of GB Vapor for a Fixed Duration (T). Measurement units are reticule lines; 1 line = 0.05 mm (Continued) I
T (min)
c mg/m*) Group P» N6 Value Pre Post 1-day 2-day 7-day
60 0.0430 Control 3 5 SE 0.65 0.84 0.37 1.08 0.37 60 0.0500 Exposed 3 5 Mean 14.00 2.40 8.60 8.80 8.40 60 0.0500 Exposed 3 5 SE 1.30 0.25 2.58 1.24 1.21 60 0.0500 Control 3 5 Mean 12.60 11.0
0 6.60 7.00 9.40 60 0.0500 Control 3 5 SE 0.71 0.45 0.68 0.63 1.03
240 0.0110 Exposed 2 10 Mean 8.55 8.30 10.20 26.00 13.00 240 0.0110 Exposed 2 10 SE 0.47 0.47 0.33 1.39 0.54 240 0.0150 Exposed 2 10 Mean 12.35 6.70 7.80 12.60 9.10 240 0.0150 Exposed 2 10 SE 0.75 0.52 0.88 1.08 0.38 240 0.0150 Exposed 3 5 Mean 10.87 2.40 5.80 12.80 8.40 240 0.0150 Exposed 3 5 SE 0.48 0.40 0.97 2.76 0.81 240 0.0150 Control 3 5 Mean 10.73 9.00 8.80 11.80 9.00 240 0.0150 Control 3 5 SE 0.41 0.84 0.20 1.32 0.63 240 0.0190 Exposed 3 5 Mean 8.87 4.40 8.00 10.20 9.20 240 0.0190 Exposed 3 5 SE 0.37 0.81 1.18 1.56 0.58 240 0.0190 Control 3 5 Mean 8.73 5.40 7.40 8.40 9.00 240 0.0190 Control 3 5 SE 0.39 0.68 0.40 0.68 0.45 240 0.0200 Exposed 6 5 Mean 10.10 1.80 5.40 7.40 6.60 240 0.0200 Exposed 6 5 SE 0.27 0.49 0.68 0.40 0.40 240 0.0200 Control 5 5 Mean 8.96 9.80 8.25 6.80 8.00 240 0.0200 Control 5 5 SE 0.31 0.86 0.48 0.58 0.71 240 0.0274 Exposed 3 5 Mean 8.33 6.00 9.40 10.00 7.60 240 0.0274 Exposed 3 5 SE 0.49 0.89 1.17 1.41 0.68 240 0.0274 Control 3 5 Mean 7.80 5.80 9.80 10.80 8.00 240 0.0274 Control 3 5 SE 0.52 0.73 1.28 0.80 0.63 240 0.0350 Exposed 3 5 Mean 11.60 5.60 8.40 7.60 8.40 240 0.0350 Exposed 3 5 SE 0.95 1.21 1.29 0.81 0.75 240 0.0350 Control 3 5 Mean 12.40 7.80 9.00 8.00 8.25 240 0.0350 Control 3 5 SE 0.56 0.97 0.91 0.71 0.63 240 0.0400 Exposed 3 5 Mean 8.33 4.60 6.80 10.20 9.60 240 0.0400 Exposed 3 5 SE 0.70 0.51 1.02 0.58 0.51 240 0.0400 Control 3 5 Mean 8.67 7.40 8.20 10.40 9.20 240 0.0400 Control 3 5 SE 0.53 1.03 0.80 0.60 0.86 240 0.0620 Exposed 3 5 Mean 8.73 1.90 4.40 10.00 9.00 240 0.0620 Exposed 3 5 SE 0.41 0.60 0.75 0.32 0.77 240 0.0620 Control 3 5 Mean 7.40 6.40 5.60 8.60 7.80 240 0.0620 Control 3 5 SE 0.40 0.25 0.40 0.51 0.66
anumber of pre-exposure measurements number of rats
-
34

Table 3. Fraction of Exposed Male and Female Rats That Developed Miosis at Each Combination of GB Vapor Concentration (C) and Duration (T)
T (min) C (mg/m3) Female Male
10 0.0100 0/5 0/5
10 0.0600 1/10 0/10
10 0.0630 3/5 1/5
10 0.0800 5/5 3/5
10 0.1000 4/5 3/5
10 0.1100 10/10 8/10
10 0.2000 5/5 5/5
10 0.2200 5/5 5/5
10 0.4800 2/2 1/1
40 0.0100 0/5 0/5
60 0.0150 3/10 3/10
60 0.0160 2/5 0/5
60 0.0340 7/10 3/10
60 0.0430 5/5 4/5
60 0.0500 5/5 5/5
240 0.0110 1/10 0/10
240 0.0110 3/5 *
240 0.0150 5/10 4/10
240 0.0150 5/5 5/5
240 0.0190 4/5 2/5
240 0.0200 5/5 5/5
240 0.0274 3/5 0/5
240 0.0350 3/5 3/5
240 0.0400 5/5 1/5
240 0.0620 * 5/5
*Single sex exposed at GB vapor concentration listed.
35

Table 4. Summary of Slope, EC50, ECT50, and Fiducial Intervals for GB Vapor- Induced Miosis (30 minutes Post-Exposure) at Each of Three Exposure Durations
Exposure Duration
(min) Slope Std Err
Slope
EC50 (mg /m3)
Female
95% F.I. EC50 (mg /m3) 95% F.I.
Female Male Male
10 9.56 1.88 0.068 0.059 - 0.078 .087 0.076 - .099
60 3.65 0.84 0.020 0.014 - 0.027 .030 0.022 - .043
240 2.01 0.63 0.012 0.006-0.019 .024 0.016-.044
Exposure Duration
(min)
ECT50 (mgmin/m3) 95% F.I. ECT50
(mgmin/m3) 95% F.I.
Female Female Male Male
10 0.68 0.59 - 0.78 0.87 0.76 - 0.99
60 1.20 0.84-1.62 1.80 1.34-2.58
240 2.88 1.44-4.56 5.76 3.84-10.56
36

LITERATURE CITED
Bliss, C.I., The method of probits," Science 79:38-39 (1934).
Ellman, G.L., Courtney, K.D., Andres, V., Jr., and Featherstone, R.M., "A new rapid colormetric determination of acetylcholinesterase activity," Biochem. Pharm. 7:88-95(1961).
Haber, F.R., "Zur geschichte des gaskrieges," In Fünf Vortrage aus Jahren 1920-1923. Spinger, Berlin (1924).
Jacobson, K., Christensen, M.K., DeArmon, I., Jr., and Oberst, F.W., Studies on chronic exposures of dogs to GB vapor, Medical Laboratories Research Report No. 328. Army Chemical Center, Edgewood, MD, 1954 (UNCLASSIFIED Report).
Johns, R., The effects of low concentrations of GB on the human eye (U), Medical Laboratories Research Report No. 100. Army Chemical Center, Edgewood, MD, February 1952 (UNCLASSIFIED Report).
Koelle, G.B., "Pharmacology of oroanophosohates." Journ. APPI. Toxicol. 14(2): 105-109 (1994).
Lennox, W. A., Method of screening compounds for gross actions in mice, EASP 100-22. Edgewood Arsenal, MD, April 1969 (UNCLASSIFIED Report).
MacFarland, H.N., "Designs and Operational Characteristics of Inhalation Exposure Equipment," Chapter 4, Salem, H., Ed., In Inhalation Toxicology, Marcel Dekker, Inc., New York, pp 93-120 (1987).
McKee, W.H.E., and Woolcott, B., Report on exposures of unprotected men and rabbits to low concentrations of nerve gas vapour, PRP-143. Porton Down, 1949 (UNCLASSIFIED Report).
Mood, AM., Graybill, F.A., and Boes, D.C., Introduction to the Theory of Statistics. 3rd Edition, McGraw-Hill, New York, 1974.
Mioduszewski, R.J., Manthei, J.H., Way, R.A., Burnett, D.C., Gaviola, B.P., Muse, W.T., Jr., Anthony, J.S., Durst, H.D., Sommerville, D.R., Crosier, R.B., Thomson, S.A., and Crouse, C.L., ECBC Low Level Operational Toxicology Program: Phase I— inhalation toxicity of sarin vapor in rats as a function of exposure concentration and duration, ECBC-TR-183, U.S. Army Edgewood Chemical Biological Center, Aberdeen Proving Ground, MD, August 2001 (UNCLASSIFIED Report).
• MINITAB®, Version 13, Minitab Inc., State College, PA, 1999.
37

Rubin, L.S., and Goldberg, M.N., "Effect of sarin on dark adaptation in man: threshold changes," J. ADPI. Phvsiol. 11(3): 439-444 (1957).
Sidell, R.F., "Clinical considerations in nerve agent intoxication," Somani, S.M., Ed., In Chemical Warfare Agents, New York, NY, Academic Press, 1992.
Soli, N.E., Karisen, R.L, Psahl, M., and Fonnum, F., "Correlations between acetyl cholinesterase activity in guinea-pig iris and papillary function: a biochemical and pupillographic study," Journal of Neurochemistrv 35(3): 7213-728 (1980).
Van Helden, H.P.M., Trap, H.C., Kuijpers, W.C., Groen, B., Oostdijk, J.P., Vanwersch, A.P., Phillippens, I.H.C., Langenberg, J.P., and Benschop, H.P., "Low level exposure to GB vapor in air: diagnosis/dosimetry, lowest observable effect level and performance incapacitation," In Proceedings of the Spring 2001 HFM Symposium on Operational, Medical Issues in Chemical and Biological Defense. May 18, Lisbon, Portugal.
38