IN VIVO EXPOSURE OF RATS TO 1.8GHz ELECTROMAGNETIC …
20
Progress In Electromagnetics Research, PIER 94, 133–152, 2009 A REVERBERATION CHAMBER TO INVESTIGATE THE POSSIBLE EFFECTS OF “IN VIVO” EXPOSURE OF RATS TO 1.8GHz ELECTROMAGNETIC FIELDS: A PRELIMINARY STUDY P. F. Biagi, L. Castellana, T. Maggipinto, G. Maggipinto T. Ligonzo, L. Schiavulli, and D. Loiacono Department of Physics University of Bari Via Amendola, 173, Bari 70126, Italy A. Ermini Department of Mechanical Engineering University of Roma Tor Vergata Via di Tor Vergata, Rome 00133, Italy M. Lasalvia Department of Medical and Occupational Science University of Foggia Via L. Pinto, Foggia 71100, Italy G. Perna and V. Capozzi Department of Biomedical Sciences University of Foggia Via L. Pinto, Foggia 71100, Italy Abstract—A system generating 1.8 GHz electromagnetic fields for bio-medical and behavioral study on laboratory animals was designed and implemented. The system is based on a reverberation chamber. An input power up to 5 W can be sent to an indoor transmitting antenna and an electric field strength (E) more than 90 V/m can be reached inside the chamber. The system was characterized at different input powers measuring E in different points by means of a miniature sensor. Then, boxes with 300 cc of physiological liquid inside were realized as simple phantoms simulating laboratory animals (rats) Corresponding author: P. F. Biagi (biagi@fisica.uniba.it).
Transcript of IN VIVO EXPOSURE OF RATS TO 1.8GHz ELECTROMAGNETIC …
Progress In Electromagnetics Research, PIER 94, 133–152, 2009
A REVERBERATION CHAMBER TO INVESTIGATETHE POSSIBLE EFFECTS OF “IN VIVO” EXPOSUREOF RATS TO 1.8 GHz ELECTROMAGNETIC FIELDS: APRELIMINARY STUDY
P. F. Biagi, L. Castellana, T. Maggipinto, G. MaggipintoT. Ligonzo, L. Schiavulli, and D. Loiacono
Department of PhysicsUniversity of BariVia Amendola, 173, Bari 70126, Italy
A. Ermini
Department of Mechanical EngineeringUniversity of Roma Tor VergataVia di Tor Vergata, Rome 00133, Italy
M. Lasalvia
Department of Medical and Occupational ScienceUniversity of FoggiaVia L. Pinto, Foggia 71100, Italy
G. Perna and V. Capozzi
Department of Biomedical SciencesUniversity of FoggiaVia L. Pinto, Foggia 71100, Italy
Abstract—A system generating 1.8 GHz electromagnetic fields forbio-medical and behavioral study on laboratory animals was designedand implemented. The system is based on a reverberation chamber.An input power up to 5 W can be sent to an indoor transmittingantenna and an electric field strength (E) more than 90 V/m canbe reached inside the chamber. The system was characterized atdifferent input powers measuring E in different points by means of aminiature sensor. Then, boxes with 300 cc of physiological liquid insidewere realized as simple phantoms simulating laboratory animals (rats)
Corresponding author: P. F. Biagi ([email protected]).

134 Biagi et al.
and E inside the liquid was measured, performing several simulationsby moving the phantoms (1, 2) in the chamber and/or putting themstill in different positions. On the basis of these measurements,the SAR (Specific Absorption Rate) and the Pe (power efficiency =SAR/input power) were determined at different powers. The actualsystem is characterized by a low power efficiency with respect to the “invivo” exposition systems based on transversal electromagnetic (TEM)cells. Its advantage is to have inside the chamber a habitat similar tothe usual one for the laboratory animals.
1. INTRODUCTION
In the last years, several experiments have been carried out inmany worldwide laboratories in order to study the possible healtheffects of electromagnetic exposure. The results often have beencontradictory among them and are still object of scientific debate [1–14]. The problem cannot be considered definitely clarified and furtherexperiments are necessary in order to increase the experimental results.
Generally “in vivo” investigations are carried out on animalsimmobilized in narrow cells [1–6]. The main drawback of such aprocedure is the existence of other stressing agents on the animals inaddition to the electromagnetic exposure. Therefore, the developmentof more suitable systems should be promoted. In particular, theexposure equipment should be devoid of collateral perturbations(noise, temperature and humidity variations, etc.); the laboratoryanimals should live in a habitat similar to their usual one and theelectromagnetic field should have a well defined and accurately setfrequency and intensity. The use of a reverberation chamber, thatis a metallic cavity whose dimensions are large with respect to thewavelength of the indoor electromagnetic field, can give a solutionto the mentioned requirements. The internal electromagnetic field ischaracterized by stochastic values, but it is (on the average) uniformand isotropic one [14–17]. Particularly, the reverberation chambersare able to simulate usual habitat of the animals so that the problemsrelated to the use of immobilized animals can be overcome.
In this study, a preliminary set up of an exposure system basedon a reverberation chamber is presented.
2. EXPOSURE SYSTEM AT 1.8 GHz AND ELECTRICFIELD MEASUREMENT
A system for electromagnetic exposure of laboratory animals wasdesigned and built by an Italian research Team (Department of Physics,
Progress In Electromagnetics Research, PIER 94, 2009 135
University of Bari; Department of Biomedical Sciences, University ofFoggia). The system consists of: a) a cage used as habitat for theanimals; b) a reverberation chamber to be used either as an exposureor not exposure environment; c) a rack with the instrumentation.The cage, with dimensions (60 × 40 × 42) cm3, is built in Plexiglas(1 cm thick) and it is provided with a Plexiglas manger and a plasticswatering system for feeding the animals (Figure 1(a)). Many holes onthe walls need to increase the airing inside the cage. The reverberationchamber, with dimensions (150 × 85 × 85) cm3, is made (ITEL-Telecomunicazioni Company, Italy) in aluminum and it has an electricfield tight door (Figure 1(b)); inside the chamber, the cage for theanimals can be inserted (Figure 1(c)). A reverberation chamber workscorrectly at a frequency f if the number of eigen-mode N is larger than60 [15]; N is given by:
N =83π
abd
(f
c
)3
− (a + b + d)f
c+
12
(1)
where a, b and d represent the size of the chamber and c is the wavevelocity in free space. In our reverberation chamber for f = 1.8GHz,that is the frequency we used in this study, the previous calculationgives N ∼ 180.
The reverberating chamber includes: a) one transmitting antenna;b) illumination lamps for day-like (white) and night-like (red) light;c) two electric tight filters dedicated to the air exchange, one on theroof (Figure 1(b)) and the other one on the right lateral wall; d) onehumidity-temperature sensor; e) one screened video camera; f) a stirrerconsisting of two metallic paddles (Figure 1(d)) connected by a drivebelt to an external motor which controls the rotation of the stirrerwithout making noises and vibrations inside the chamber. Differentantennae can be installed in the chamber. In this study, a stick antenna4.15 cm long (the length is λ/4 for 1.8 GHz) fixed orthogonally on theright lateral wall of the chamber, below the air filter, was used. Theprevious filter is arranged to be connected to a suction pump for betterairing the inside environment and for avoiding bad smells producedby the animals. The instrumentation in the rack consists of: a) oneclock for controlling and alternating (day-night) illumination insidethe chamber; b) one RF generator (f = 100 kHz–2112 MHz) withan output amplitude ranging, for frequencies 1056 MHz and above,from −140 dBm to +10 dBm; c) one power amplifier (up to 5 W in thefrequency range 1.5–2.0 GHz) connected to the transmitting antenna;d) a milliwatt-meter (100 kHz–20000 MHz) in order to measure theinput power to the transmitting antenna; e) one viewer for the videocamera; f) one personal computer with a video-recording card for vid

136 Biagi et al.
(a) (b)
(c) (d) (e)
(f) (g) (h)
Figure 1. (a) Cage (60 × 40 × 42) cm3 in Plexiglas with a mangerand a plastics watering system for laboratory animals. The holes onthe walls are for the airing inside the cage. (b) Reverberation chamber(150 × 85 × 85) cm3, made of aluminium and having an electric fieldtight door. The lump at the top is one of the electric tight filters.(c) Cage inside the chamber. Two tracks allow the insertion of thecage and constitute its building. (d) Stirrer, i.e., two rotating metallicshovels, located inside the chamber on its right hand side. (e) Twolaboratory animals inside the cage. (f) Electric field probe PMM EP-600 suitable for small rooms. The probe is formed by 6 monopoles.The dimensions are: 17 mm — sphere; 17mm — sensor; 53 mm —overall. (g) Mobile bearing EB for the use outside the cage zone. Thepossibility of tilting and raising in every point is shown in the Figure.(h) Mobile bearing IB for the use in the cage zone, with or without thecage itself. In Figure the possible rotation and raising of the systemfor every position (three, every 5 cm) of the probe on the horizontalpole are shown.

Progress In Electromagnetics Research, PIER 94, 2009 137
data acquisition (up to 900 hours continuous recording); g) one digitalinstrument, to be connected to the humidity-temperature sensor forthe data recording with an adjustable sampling rate ranging from 1 sto 3600 s.
The video camera with the viewer is used for controlling the insidesituation. Besides, behavioral studies on the laboratory animals canbe performed.
The electric field strength (E) inside the chamber was measuredby a Field Meter (NARDA STS Company, Segrate (MI), Italy, PMM8053B) connected with an optical fiber to an Electric Field Probe(NARDA STS Company, Segrate (MI), Italy, EP-600). The probeis shown in Figure 1(f); the whole dimension is 53mm and the weightis 90 g. The sensitivity and frequency ranges are 0.15–90 V/m and100 kHz–9.25GHz, respectively. The probe was calibrated in air at thePMM Manufacturing Plant and EMC Laboratory. The Portable FieldMeter has various measurement options such as the measurement ofE averaged on a fixed time interval, that is the option we used inthis paper choosing a 6 min range time. The probe was located indifferent points inside the chamber using the mobile external bearingEB Figure 1(g) far from the cage zone and the mobile internal bearingIB Figure 1(h) inside the cage zone, with or without the cage itself.Both the bearings are made in PVC and can be tilted and extendedas shown in Figures 1(g) and 1(h). As an advantage with respect tothe EB bearing, the IB can be moved in several different positionswithout having to stop the exposure and opening the chamber door.In any case the measurements were made at a minimum distance of20 cm from the chamber halls (metal) in order for their readings to beminimally affected by coupling with the shields [18].
3. PRELIMINARY TESTS AND SETTING UP
The first problem to solve was carrying out a good habitat for thelaboratory animals. The main characteristics of such a habitat are: a)intense white lighting at day time and red at night time; b) facilitiesfor eating and drinking; c) temperature in the range 20◦C–24◦C; d)humidity (percent) in the range 45%–65%. The first two items areaccomplished in our system, as it is described in Section 2. In order toobtain the climatic conditions, in addition to the airing we describedpreviously, the system must operate in an air-conditioned environment.In such a condition, variations of the temperature and of the humidityinside the mentioned limits can be obtained as we verified in severaltests with the laboratory animals (Figure 1(e)) inside the cage. As anexample Figure 2 shows the temperature and humidity trends recorded
138 Biagi et al.
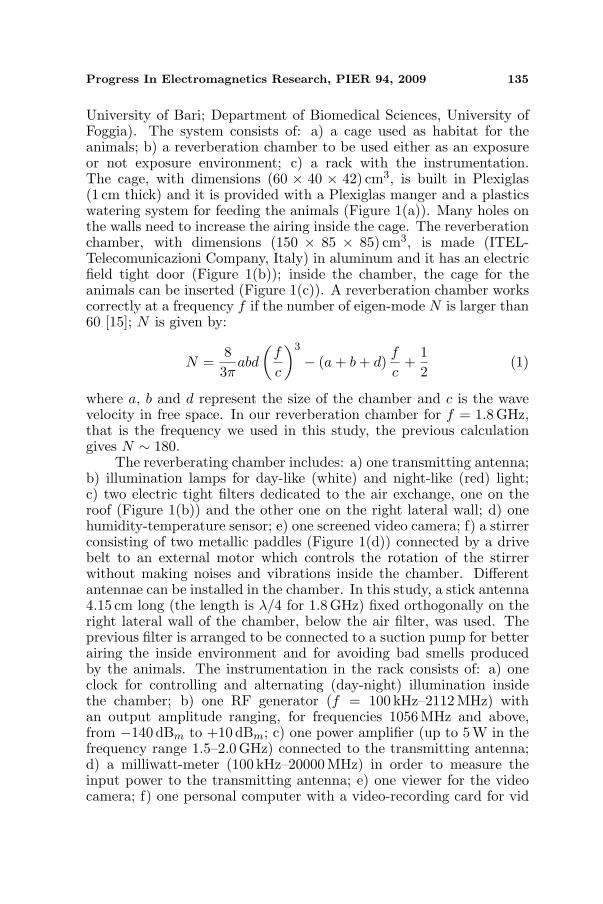
by the humidity-temperature sensor during about six days running ofthe system, with several hours of exposure every day.
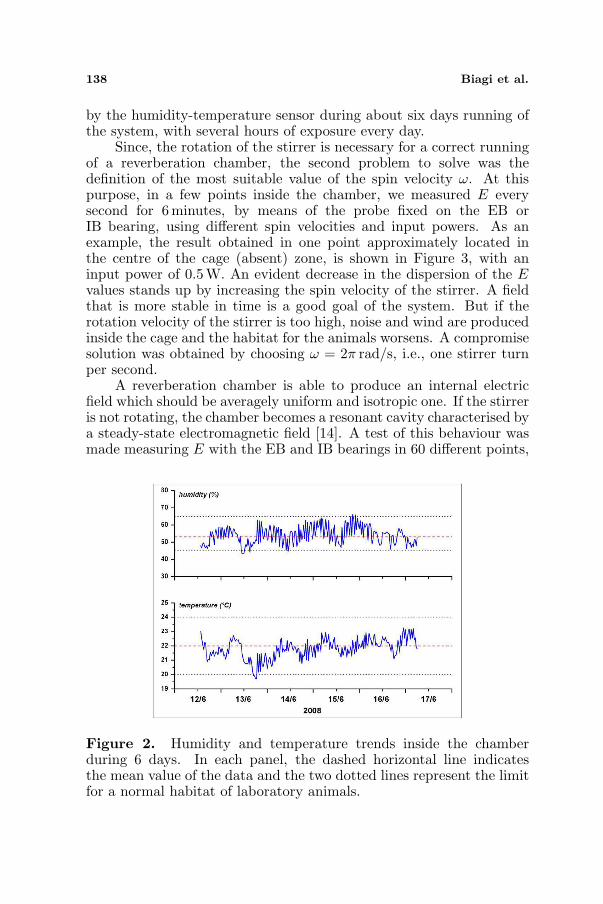
Since, the rotation of the stirrer is necessary for a correct runningof a reverberation chamber, the second problem to solve was thedefinition of the most suitable value of the spin velocity ω. At thispurpose, in a few points inside the chamber, we measured E everysecond for 6minutes, by means of the probe fixed on the EB orIB bearing, using different spin velocities and input powers. As anexample, the result obtained in one point approximately located inthe centre of the cage (absent) zone, is shown in Figure 3, with aninput power of 0.5 W. An evident decrease in the dispersion of the Evalues stands up by increasing the spin velocity of the stirrer. A fieldthat is more stable in time is a good goal of the system. But if therotation velocity of the stirrer is too high, noise and wind are producedinside the cage and the habitat for the animals worsens. A compromisesolution was obtained by choosing ω = 2π rad/s, i.e., one stirrer turnper second.
A reverberation chamber is able to produce an internal electricfield which should be averagely uniform and isotropic one. If the stirreris not rotating, the chamber becomes a resonant cavity characterised bya steady-state electromagnetic field [14]. A test of this behaviour wasmade measuring E with the EB and IB bearings in 60 different points,
Figure 2. Humidity and temperature trends inside the chamberduring 6 days. In each panel, the dashed horizontal line indicatesthe mean value of the data and the two dotted lines represent the limitfor a normal habitat of laboratory animals.
Progress In Electromagnetics Research, PIER 94, 2009 139
Figure 3. (a) Time series of the electric field strength at four differentspin velocities of the stirrer. The horizontal dashed line in each trendrepresents the mean value of the relative data set. The measurementsare collected at a 0.5 W input power in a point located approximatelyin the center of the cage zone without the cage itself, inside thereverberation chamber. (b) Relative dispersion (Emax − Emin)/Emean
of the electric field strength values as a function of the spin velocity.
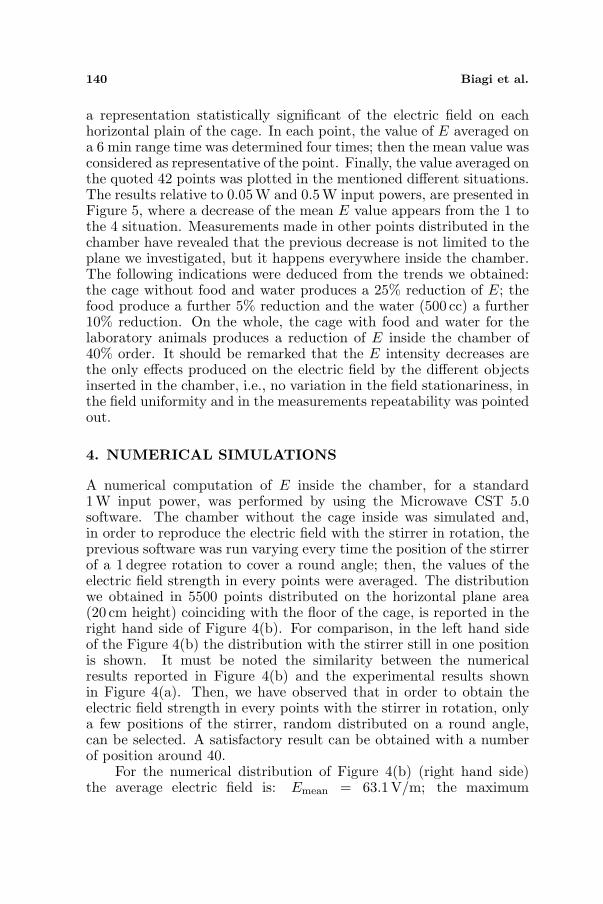
regularly distributed inside the chamber on three different horizontalplanes at 20 cm, 30 cm and 45 cm height, avoiding the zone of thestirrer. This choice seems able to give a significant representation of thefeatures of the electric field in the chamber. In the case of still stirrereach value of E was obtained directly by a single measurement; withthe stirrer rotating each value was obtained as average on a 6 min rangetime. The result obtained using a 0.5 W input power, is reported inFigure 4(a), where the distribution of the electric field strength valueswith the stirrer either still or in rotation is shown. A fair uniformityof the field appears when the stirrer is in rotation unlike when it isstill. We have checked that the quality of the uniformity practicallydoes not change using values of rotation velocity of the stirrer differentfrom the one we selected.
In principle, every object introduced inside the chamber producesa perturbation in the electric field. We verified this effect consideringthe following four situations: 1) absence of the cage inside the chamber,2) cage inside without food and water; 3) cage inside with food butwithout water, 4) cage inside with food and water (500 cc). In eachcase, 42 points distributed on the horizontal plane area representingthe floor of the cage, that is a part of the plane at 20 cm height,were considered. Taking into account the dimensions of the cage andof the electric probe, this number represents a choice able to give
140 Biagi et al.
a representation statistically significant of the electric field on eachhorizontal plain of the cage. In each point, the value of E averaged ona 6 min range time was determined four times; then the mean value wasconsidered as representative of the point. Finally, the value averaged onthe quoted 42 points was plotted in the mentioned different situations.The results relative to 0.05 W and 0.5W input powers, are presented inFigure 5, where a decrease of the mean E value appears from the 1 tothe 4 situation. Measurements made in other points distributed in thechamber have revealed that the previous decrease is not limited to theplane we investigated, but it happens everywhere inside the chamber.The following indications were deduced from the trends we obtained:the cage without food and water produces a 25% reduction of E; thefood produce a further 5% reduction and the water (500 cc) a further10% reduction. On the whole, the cage with food and water for thelaboratory animals produces a reduction of E inside the chamber of40% order. It should be remarked that the E intensity decreases arethe only effects produced on the electric field by the different objectsinserted in the chamber, i.e., no variation in the field stationariness, inthe field uniformity and in the measurements repeatability was pointedout.
4. NUMERICAL SIMULATIONS
A numerical computation of E inside the chamber, for a standard1W input power, was performed by using the Microwave CST 5.0software. The chamber without the cage inside was simulated and,in order to reproduce the electric field with the stirrer in rotation, theprevious software was run varying every time the position of the stirrerof a 1 degree rotation to cover a round angle; then, the values of theelectric field strength in every points were averaged. The distributionwe obtained in 5500 points distributed on the horizontal plane area(20 cm height) coinciding with the floor of the cage, is reported in theright hand side of Figure 4(b). For comparison, in the left hand sideof the Figure 4(b) the distribution with the stirrer still in one positionis shown. It must be noted the similarity between the numericalresults reported in Figure 4(b) and the experimental results shownin Figure 4(a). Then, we have observed that in order to obtain theelectric field strength in every points with the stirrer in rotation, onlya few positions of the stirrer, random distributed on a round angle,can be selected. A satisfactory result can be obtained with a numberof position around 40.
For the numerical distribution of Figure 4(b) (right hand side)the average electric field is: Emean = 63.1V/m; the maximum
Progress In Electromagnetics Research, PIER 94, 2009 141
(a)
(b)
Figure 4. (a) From top panel downward: distribution ofthe experimental values of the electric field strength inside thereverberation chamber (cage zone) over horizontal planes at 20 cm,30 cm and 45 cm height respectively. In the panels x indicates thelength of the chamber and y its width. (b) Theoretical simulation ofthe chamber in the horizontal plane area (cage zone) at 20 cm height.In both the cases (a) and (b) the panels in the left column are forstationary stirrer and those in the right column are for rotating stirrer.
and minimum values are Emax = 93.6V/m and Emin = 39.6V/m,respectively. In order to evaluate the corresponding experimentalvalues, the chamber without the cage inside was considered and1W input power was used. Using the 42 points mentioned in theprevious section and the same measurement method we obtained:

142 Biagi et al.
Figure 5. Electric field strength averaged on 42 points distributed inthe horizontal plane area (20 cm height) representing the floor of thecage, in the configurations: 1) without the cage in the chamber, 2) cageinside without food and water; 3) cage inside with food but withoutwater, 4) cage inside with food and water (500 cc). At the top theplot for a 0.05 W input power; at the bottom for a 0.5W input power.The measurement in every point has been repeated four times and theaveraged value with the relative semi dispersion has been considered.In each panel the dashed line represent the 3th order polynomial fit.

Progress In Electromagnetics Research, PIER 94, 2009 143
Emean = 61.9 V/m, Emax = 73.6V/m and Emin = 45.8V/m. So, agood agreement between theory and measurements stands up; only alarger dispersion of the numerical values can be noted. The justificationof this discrepancy is that, in the computation, each point correspondsto a geometric point, but experimentally each point has more or less thedimensions of the probe (Section 2), that is a volume of about 25 cm3;so, the measured value represents the mean value over all the geometricpoints inside this volume. Practically, the experimental values withrespect to the numerical ones are adjacent averaging smoothed. So, asmaller dispersion of the experimental values than the numerical onesshould exist.
5. CHARACTERIZATION OF THE EXPOSURE SYSTEM
The E inside the cage with food and water (500 cc) in the reverberationchamber was measured for the input powers: 0.02W, 0.05W, 0.5 Wand 2.0W. These powers were selected to obtain E values rangingfrom few units to several dozen. Higher powers were avoided becausethey might produce some damage to the measurement equipment,taking into account the temporal variability of the electric field in eachpoint mentioned in Section 2 and the 90 V/m upper limit value of themeasurement probe. Only the zone at the bottom of the cage, that isthe part where the laboratory animals generally live, was investigatedusing 84 points: 42 points distributed on the horizontal plane (plane 0)representing the floor of the cage and 42 points on the horizontalplane (plane 1) 5 cm higher than the previous one. The value ofthe E averaged on a 6 min range time was measured in every point.Each measurement was repeated four times and the mean value of the
Table 1. Mean values of the electric field strength E at differentinput powers in the bottom part of the cage: on its floor (plane 0), onthe horizontal plane 5 cm higher (plane 1) and on the space includingplane 0 and plane 1. The error is the semi dispersion of the values.
input power(W)
E(V/m)
0.02 6± 1 6± 1 6± 10.05 11± 2 10± 1 11± 20.5 36± 8 33± 5 35± 82.0 63± 12 60± 7 61± 12
plane 0 plane 1 space
144 Biagi et al.
four measurements in every point was determined. Then, the valuesaveraged on the 42 points of the plane 0, on the 42 points of the plane 1and on the total spatial distributed 84 points (space) were calculatedwith the relative semi dispersion. The results are reported in Table 1;practically, these values characterize the exposure in the environmentfor the laboratory animals without them. Table 1 points out that theE-field intensity increases about by 10 times when the input powerincreases from 0.02 to 2 W (100 times).
6. PHANTOMS AND THEIR EFFECT ON THEELECTRIC FIELD
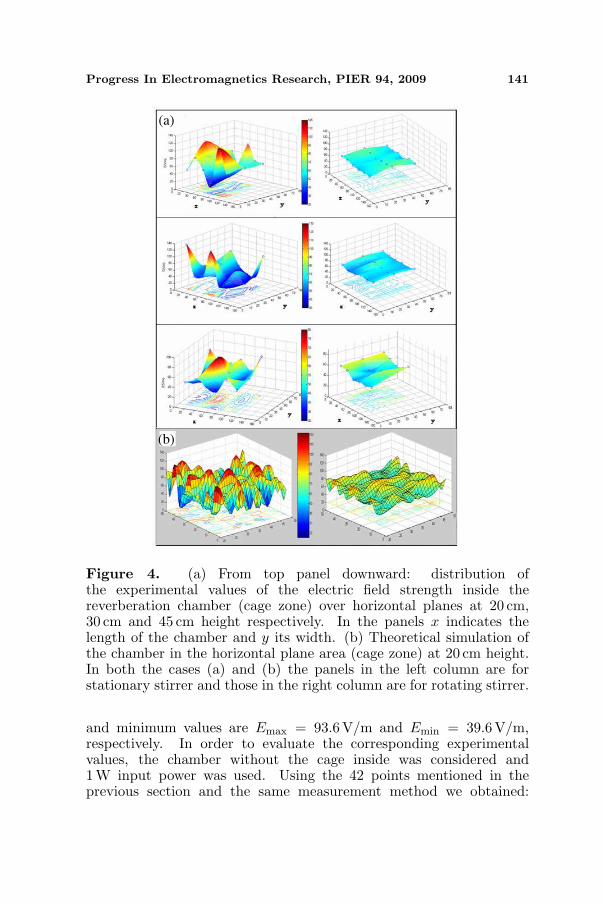
Traditionally, phantoms are used to simulate laboratory animals.Many different phantom forms have been proposed as well as manydifferent phantom materials have been developed to simulate theproperties of the body and of the head of the animals at differentfrequencies [19–22]. In this preliminary study we used very simplephantoms; each one is made of Plexiglas (2 mm thick) and is formedby a parallelepipedal box (8 × 6 × 8) cm3 with a mobile cover and issuitable to contain substances to simulate the animals (Figure 6(a)). Aphysiological liquid characterized by σ(conductivity) = 1.585 S/m andρ(density) = 1006 kg/m3 was selected. An amount of 300 cc of liquidwas used so that as concerns the weight, rats are simulated.
According to the statements in Section 3, a phantom introducedin the chamber produces a decrease of the electric field strength. Weevaluated the perturbation with respect to the environment composed
Table 2. Mean spatial values of the electric field strength at differentinput powers in the bottom part of the cage, with one (E1) or two (E2)phantoms. The error is evaluated by the semi dispersion of the values.The SAR and the power efficiency (Pe=SAR/input power) values arereported, too.
1 phantom 2 phantoms
inputpower(W)
E1
(V/m)
SAR(W/kg)
Pe(W/kgWinp)
E2
(V/m)
SAR(W/kg)
Pe(W/kgWinp)
0.02 5± 1 3.2×10⁻⁴ 1.6× 10⁻² 4± 1 2.8×10⁻⁴ 1.4× 10⁻²
0.05 10± 2 9.3×10⁻⁴ 1.9× 10⁻² 9± 2 7.2×10⁻⁴ 1.4× 10⁻²
0.5 30± 7 1.0×10⁻² 2.0× 10⁻² 29± 7 5.4×10⁻³ 1.1× 10⁻²
2.0 54± 9 3.2×10⁻² 1.6× 10⁻² 52± 9 2.2×10⁻² 1.1× 10⁻²
4.5 ∼ 90 7.8×10⁻² 1.7× 10⁻² ∼ 75 5.2×10⁻² 1.2× 10⁻²
Progress In Electromagnetics Research, PIER 94, 2009 145
(a) (b)
(c)
Figure 6. (a) The box (8×6×8) cm3 in Plexiglas with a mobilecap used as phantom. (b) The inflatable balloon with inside theelectric field probe PMM EP-600 to waterproof the probe. (c)The waterproofed probe located inside the physiological liquid of aphantom.
by the cage inside the chamber, with food and water (500 cc), usingone or two phantoms in a still position in different sites inside the cage.Using the 84 points mentioned in Section 5 and the same measurementmethod, the mean values of E on the two planes and the correspondingspace were evaluated. In the case of one phantom, a 12% mean decreaseof E was obtained; in the case of two phantoms, a 16% decrease wasevaluated on average. Generally, no particular relation of the decreaseswith the position of the phantoms was pointed out. The spatial valuesof E obtained with one phantom or two at the different input powers
146 Biagi et al.
are reported in Table 2. Practically, these values indicate the electricfield strength to which one or two laboratory animals (rats) could beexposed in the system. In Table 2, approximated E values at the4.5W input power are reported, too. These values cannot be obtaineddirectly because they are too large and damages of the electric probe(Section 2) could be produced. So, they were extrapolated by theE values measured inside the phantoms (Section 7) for a 4.5 W inputpower taking into account that such values in the other cases are aboutone tenth of the corresponding external values.
7. DOSIMETRY
The specific absorption rate (SAR) is very useful in the medical andbiological research on the effects of the RF exposure. The SAR (W/kg)can be obtained by the relation:
SAR = σE2/ρ (2)
where σ is the electrical conductivity (S/m), ρ the mass density(kg/m3) and E the effective electric field strength (V/m) inside thebody.
In our case, we had to settle the technique for the measurementof E inside the physiological liquid of the phantoms.
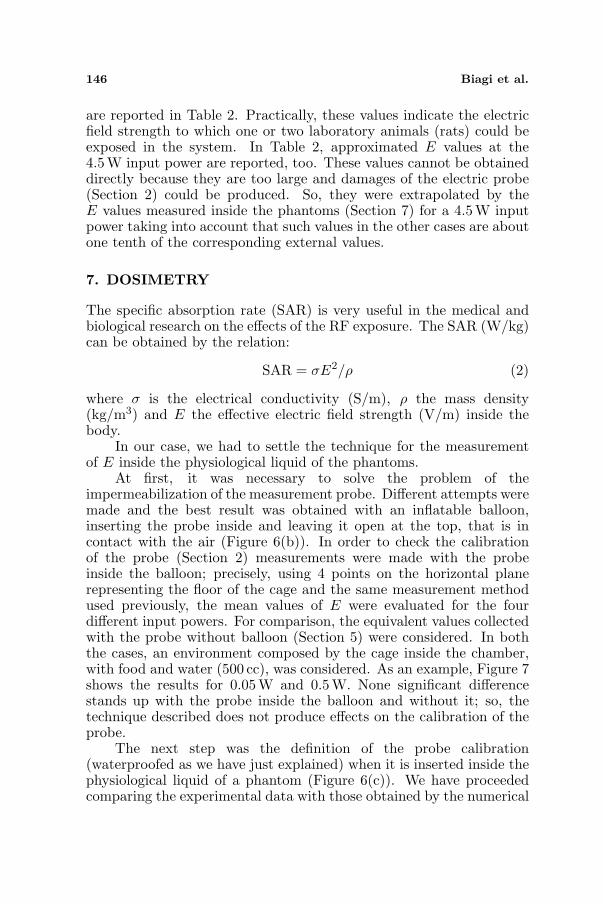
At first, it was necessary to solve the problem of theimpermeabilization of the measurement probe. Different attempts weremade and the best result was obtained with an inflatable balloon,inserting the probe inside and leaving it open at the top, that is incontact with the air (Figure 6(b)). In order to check the calibrationof the probe (Section 2) measurements were made with the probeinside the balloon; precisely, using 4 points on the horizontal planerepresenting the floor of the cage and the same measurement methodused previously, the mean values of E were evaluated for the fourdifferent input powers. For comparison, the equivalent values collectedwith the probe without balloon (Section 5) were considered. In boththe cases, an environment composed by the cage inside the chamber,with food and water (500 cc), was considered. As an example, Figure 7shows the results for 0.05 W and 0.5 W. None significant differencestands up with the probe inside the balloon and without it; so, thetechnique described does not produce effects on the calibration of theprobe.
The next step was the definition of the probe calibration(waterproofed as we have just explained) when it is inserted inside thephysiological liquid of a phantom (Figure 6(c)). We have proceededcomparing the experimental data with those obtained by the numerical
Progress In Electromagnetics Research, PIER 94, 2009 147
Figure 7. Electric field strength on the points A, B, C and Ddistributed in the horizontal plane area representing the floor ofthe cage. The values indicated with stars were obtained with theprobe inside the balloon (Figure 6(b)); the values indicated withsquares without the balloon. At the top the plot for a 0.05 W inputpower; at the bottom for a 0.5 W input power. In each point themeasurements has been repeated four times and the averaged valuehas been considered with the relative semi dispersion. The points(A, B, C, D) are the same for the two types of measurements, butin both the plots the relative abscissa was a little separated to avoidsuperimpositions in the graphic.

148 Biagi et al.
computation. At this purpose, in the chamber without the cageinside, a phantom similar to the experimental one (Section 6) wasinserted. For the filling liquid the following parameters were used:conductivity = 1.585 S/m, density = 1006 kg/m3, permittivity =76.3(real)− 23.3(imaginary).
Then, numerical estimations of E inside the liquid of the phantomin four different location inside the cage were performed using, eachtime, 40 different stirrer positions. At the same time, using thewaterproofed probe, E inside the physiological liquid of a phantomlocated each time in the same four places was measured using 1 Winput power. The numerical estimations represent the values of Ein a volume corresponding to that occupied by the probe; in fact, ineach location, the E value was calculated by averaging the values inthe points contained in this volume. The comparison between thenumerical and experimental data has indicated a correction factore = E/Eact = 1.3, where Eact is the effective electric field strengthvalue inside the liquid and E is the value averaged on 6 min indicatedby the instrumentation. It must be noted that the probe inside theliquid phantoms is big and so it can perturb the field in the liquiditself. The previous correction includes also this effect.
Figure 8. SAR values for 1 phantom (squares) and 2 phantoms(circles) versus the input power to the transmitting antenna. Thedashed lines represent the best linear fitting.

Progress In Electromagnetics Research, PIER 94, 2009 149
Finally, the measurement of the E were performed for the inputpowers: 0.02W, 0.05W, 0.5W, 2.0 W and 4.5 W. To simulate themoving of the rats, a plastic plate on which a phantom can be put wasused. Four wires were fixed at this plate; the wires reach the outside ofthe chamber and they can be pulled from outside the chamber. For thementioned input powers, E was measured several times. In the case ofonly one phantom, we obtained values either in the phantom in a stillposition in different sites of the cage or in the phantom moving insidethe cage. No significant difference of the values was revealed in the twomentioned configurations. In the case of two phantoms either in stillposition or moving in the cage, we measured E with the electric probeinside one or the other one phantom. Again, no significant differenceof the values was observed.
The correction factor we mentioned previously was applied tothe mean E values of these measurements obtaining in such way theeffective electric field strength (Eact) values inside the liquid. Usingthese values the SAR was calculated by the relation (2) and the resultsin the different cases are reported in Table 2. These values rangefrom 2.8× 10⁻⁴ to 7.8× 10⁻² W/kg. The minimum value is related totwo phantoms with an exposure of 4 V/m (0.02 W input power) andthe maximum one to one phantom with an exposure of about 90V/m(4.5W input power).
From the mentioned results the power efficiency Pe, that isSAR/input power, can be evaluated. These values are reported inTable 2 and the average power efficiency is 1.8×10⁻² W/kgWinp (witha semi dispersion of 2×10⁻³) for one phantom and 1.3×10⁻² W/kgWinp
(with a semi dispersion of 2× 10⁻³) for two phantoms. The trends inFigure 8 show the SAR values in function of the input power in the caseof one and two phantoms. In both the cases a good linearity appears,as expected.
Recently, an average power efficiency of about 4.0×10⁻¹ W/kgWinp
was obtained for a RF (900 MHz) “in vivo” exposure system consist-ing of TEM cells [23]. From the previous data, our system based on areverberation chamber, is characterized by a very low power efficiency.
8. CONCLUSION
A preliminary study regarding a system for researching bio-medical andbehavioural effects on laboratory animals at 1.8 GHz electromagneticexposure was carried out. The system is based on a reverberationchamber with a cage inside. An input power up to 5 W can beused. The system has been characterized determining the electricfield strength inside the cage with food and water (500 cc) for different

150 Biagi et al.
input powers. A 53 mm large probe was used. Then, Plexiglas boxescontaining 300 cc of physiological liquid were used as simple phantoms(1–2) in the cage and the electric field strength was determined inside,using the same probe waterproofed. A correction factor for thecalibration of the probe was estimated, using numerical computation.Then, the SAR have been obtained in different cases. Values in therange 2.8× 10⁻⁴− 7.8× 10⁻² W/kg were obtained; such values are toolow for the bio-medical studies and this is a drawback of the actualsystem. But, the system reproduces a habitat similar to the usualone for the animals and this is a great advantage and, as concerns thebehavioural research, it is ready for use.
Further analysis should be carried out using larger input powers.Different transmitting antennae as well as different cages with foodand water for the animals, should be tested. Other techniques for thecalibration of the probe inside the phantoms should to be investigated.Finally, in order to obtain useful SAR values, more realistic phantomsmight to be used.
ACKNOWLEDGMENT
This research was conducted in the framework of the project PE 100titled “Sistema espositivo a radiofrequenza per animali da laboratorio”supported by the Puglia Region (Italy). The authors are very gratefulto Fabiana Di Maio for carrying out a large amount of measurementsand to Prof. Vincenzo Petruzzelli of the Electrical Engineering BariFaculty for helpful discussion. The authors wish to thank the reviewersfor helpful suggestions and constructive criticism.
REFERENCES
1. Adey, W. R., et al., “Spontaneous and nitrosourea-inducedprimary tumors of the central nervous system in Fischer 344 ratschronically exposed to 836MHz modulated microwaves,” Radiat.Res., Vol. 152, 293–302, 1999.
2. Adey, W. R., et al., “Spontaneous and nitrosourea-inducedprimary tumors of the central nervous system in Fischer 344 ratsexposed to frequency-modulated microwave fields,” Cancer Res.,Vol. 60, 1857–1863, 2000.
3. Frei, M. R., et al., “Chronic exposure of cancer-prone mice to low-level 2450 MHz radiofrequency radiation,” Bioelectromag., Vol. 19,20–31, 1998.
4. Gatta, L., R. Pinto, V. Ubaldi, L. Pace, P. Galloni, G. A. Lovisolo,

Progress In Electromagnetics Research, PIER 94, 2009 151
C. Marino, and C. Pioli, “Effects of in vivo exposure to GSM-modulated 900MHz on mouse peripheral hymphocytes,” Radiat.Res., Vol. 160, 600–605, 2003.
5. Wu, B. I., F. C. A. I. Cox, and J. A. Kong, “Experimentalmethodology for non-thermal effects of electromagnetic radiationon biologics,” Journal of Electromagnetic Waves and Applications,Vol. 21, No. 4, 533–548, 2007.
6. Lopez-Martin, E., J. C. Bregains, F. J. Jorge-Barreiro,J. L. Sebastian-Franco, E. Moreno-Piquero, and F. J. Ares-Pena, “An experimental set-up for measurement of the powerabsorbed from 900MHz GSM standing waves by small animals,illustrated by application to picrotoxin-treated rats,” Progress InElectromagnetics Research, PIER 87, 149–165, 2008.
7. Heikkinen, P., V. M. Kosma, T. Hongisto, H. Huuskonen,P. Hyysalo, H. Komulainen, T. Kumlin, J. T. Laitinen, S. Lang,L. Puranen, and J. Juutilainen, “Effects of mobile phone radiationon x-ray-induced tumorigenesis in mice,” Radiat. Res., Vol. 156,775–785, 2001.
8. Heikkinen, P., V. M. Kosma, L. Alhonen, H. Huuskonen,H. Komulainen, T. Kumlin, J. T. Laitinen, S. Lang, L. Puranen,and J. Juutilainen, “Effects of mobile phone radiation on UV-induced skin tumourigenesis in ornithine decarboxylase transgenicand non-transgenic mice,” Int. J. Radiat. Biol., Vol. 79, 221–233,2003.
9. Imaida, K., M. Taki, T. Yamaguchi, T. Ito, S. Watanabe, K. Wake,A. Aimoto, Y. Kamimura, and T. Shirai, “Lack of promotingeffects of the electromagnetic near-field used for cellular phones(929MHz) on rat liver carcinogenesis in medium-term bioassay,”Carcinogenesis, Vol. 19, 311–314, 1998.
10. Imaida, K., M. Taki, S. Watanabe, Y. Kamimura, T. Ito, andT. Shirai, “The 1.5 GHz electromagnetic near-field used for cellularphones does not promote rat liver carcinogenesis in a medium termliver bioassay,” Japan J. Cancer Res., Vol. 89, 995–1002, 1998.
11. Malyapa, R. S., et al., “DNA damage in rat brain cells after invivo exposure to 2450 MHz electromagnetic radiation and variousmethods of euthanasia,” Radiat. Res., Vol. 149, 637–645, 1998.
12. Toler, J. C., et al., “Long-term low-level exposure of mice prone tomammary tumors to 435MHz radiofrequency radiation,” Radiat.Res., Vol. 148, 227–234, 1997.
13. Verschaeve, L. and A. Maes, “Genetic, carcinogenic andteratogenic effects of radiofrequency fields,” Mutation Research,141–165, 410, 1998.
152 Biagi et al.
14. Corona, P., G. Ferrara, and M. Migliaccio, “Reverberatingchambers as sources of stochastic electromagnetic fields,” IEEETransactions on Electromagnetic Compatibility, Vol. 38, 3, 1996.
15. Hill, D. A., “Electromagnetic theory of reverberation cham-bers,”NIST Technical Note 1506, National Institute of Standardsand Technology, Boulder, Colorado 80303-3328, USA, 1998.
16. Kouveliotis, N. K., P. T. Trakadas, and C. N. Capsalis, “FDTDmodeling of a vibrating intrinsic reverberation chamber,” ProgressIn Electromagnetics Research, PIER 39, 47–59, 2003.
17. Crawford, L. and G. H. Koepke, “Design, evaluation anduse of a reverberation chamber for performing electromagneticsusceptibility/vulnerability measurements,” National Bureau ofStandard (NBS), Technical Note 1092, 1986.
18. IEEE C95.3-2002, IEEE Recommended Practice for Measure-ments and Computations of Radio Frequency ElectromagneticFields with Respect to Human Exposure to Such Fields, 100 kHz–300GHz, The Institute of Electrical and Electronic Engineers,Inc., New York, NY, 10016–5997, 2002.
19. Andreuccetti, D., M. G. Bini, A. Ignesti, R. Olmi, N. Rubino, andR. Vanni, “Use of polyacrylamide as a tissue-equivalent material inthe microwave range,” IEE Trans. Microw. Theory Tech., Vol. 35,275–277, 1988.
20. Chou, C.-K., G.-W. Chen, A. Guy, and K. H. Luk, “Formulasfor preparing phantom muscle tissue at various radiofrequencies,”Bioelectromag., Vol. 5, 435–441, 1984.
21. Lazebnik, M., E. L. Madsen, G. R. Frank, and S. C. Hagness,“Tissue-mimicking phantom materials for narrowband andultrawideband microwave applications,” Phys. Med. Biol., Vol. 50,4245–4258, 2005.
22. McCann, C., J. C. Kumaradas, M. R. Gertner, S. R. H. Davidson,A. M. Dolan, and M. D. Sherar, “Feasibility of salvage interstitialmicrowave thermal therapy for prostate carcinoma following failedbrachytherapy: Study in a tissue equivalent phantom,” Phys. Med.Biol., Vol. 48, 1041–1052, 2003.
23. Ardoino, L., V. Lopresto, S. Mancini, C. Marino, R. Pinto,and G. A. Lovisolo, “A radio-frequency system for in vivopilot experiments aimed at the studies on biological effects ofelectromagnetic fields,” Phys. Med. Biol., Vol. 50, 3643–3654,2005.