LOS ANGELES HARBOR COLLEGE Student Survey Report for Web.pdfCatherine Crouch Anjanette Crum ......
38
Spring 2012 Student Survey RESULTS LOS ANGELES LOS ANGELES HARBOR COLLEGE HARBOR COLLEGE
Transcript of LOS ANGELES HARBOR COLLEGE Student Survey Report for Web.pdfCatherine Crouch Anjanette Crum ......

Spring 2012 Student Survey
RESULTS
LOS ANGELESLOS ANGELES
HARBOR COLLEGEHARBOR COLLEGE

This page intentionally left blank.

SSPRINGPRING 2012 2012
SSTUDENTTUDENT SSURVEYURVEY
RRESULTSESULTS
LOS ANGELES LOS ANGELES
HARBOR COLLEGEHARBOR COLLEGE
OFFICE OF INSTITUTIOOFFICE OF INSTITUTIONAL EFFECTIVENESSNAL EFFECTIVENESS
NOVEMBER 2012NOVEMBER 2012

BBOARDOARD OFOF TTRUSTEESRUSTEES
Steve Veres, President
Tina Park, First Vice President
Nancy Pearlman, Second Vice President
Kelly Candaele
Mona Field
Miguel Santiago
Scott J. Svonkin
Steve Veres
Daniel Campos, Student Trustee
DDISTRICTISTRICT AADMINISTRATIONDMINISTRATION
Dr. Daniel J. LaVista, Chancellor
Dr. Adriana D. Barrera, Deputy Chancellor
Dr. Yasmin Delahoussaye, Vice Chancellor for Educational Programs & Institutional Effectiveness
Dr. Felicito Cajayon, Vice Chancellor for Economic and Workforce Development
Jeanette Gordon, Chief Financial Officer/Treasurer
Camille A. Goulet, General Counsel
James D. O’Reilly, Executive Director, Facilities Planning and Development
CCOLLEGEOLLEGE AADMINISTRATIONDMINISTRATION
Marvin Martinez, President
Luis M. Rosas, Vice President of Academic Affairs
Dr. Ann Tomlinson, Vice President of Administrative Services
Abbie L. Patterson, Vice President of Student Services
Nestor Tan, Associate Vice President of Administrative Services
Dr. Kristi V. Blackburn, Dean of Institutional Effectiveness
Leige C. Doffoney, Dean of Academic Affairs
Mark Wood, Dean of Academic Affairs
Sandra Sanchez, Dean of Economic & Workforce Development
David Ching, Dean of Admissions and Records & Evening Operations
Mercy Yanez, Associate Dean of EOP&S/CARE
Susan Rhi-Kleinert, Associate Dean of Grants Management & Resource Development

TTABLEABLE OFOF CCONTENTSONTENTS
Page 5
COLLEGE EXPERIENCE ................................... 22 Student Participation Computer Use Interaction with Instructors Community and College Activity Participation
Improved Abilities Due to College Experiences Additional Hours on Campus Student Involvement Opportunities on Campus College Educational Practices
CAMPUS FACILITIES AND SERVICES ............ 28
COMMENTS ................................................... 29 Highlights on What’s Best About LAHC Highlights on Suggested Changes to LAHC
APPENDIX
LACCD Spring 2012 Student Survey ................. 33
SPRING 2012 STUDENT SURVEY RESPONSES
ACKNOWLEDGEMENTS .................................. 6
CAVEATS .......................................................... 7
INTRODUCTION .............................................. 7 DEMOGRAPHY & BACKGROUND .................... 8 Age Ethnicity Gender Language Class Status Length of Stay in the U.S. Educational Level of Family Members Marital Status Dependents Disability
GOALS & PLANS .............................................. 13 Degree Objective Feeling about Attending College Problem with Reaching Academic Goals
FINANCIAL RESOURCES ................................ 15 Hours of Employment Changes to Employment Hours Eligibility for Financial Aid Cost of Text Books
COUNSELING INFORMATION & SERVICES .. 18 First Meeting with Counselor Educational Plan Frequency of Visit to Campus Services Satisfaction with Visit to Campus Services

Page 6
AACKNOWLEDGEMENTSCKNOWLEDGEMENTS
T he Student Survey is a major undertaking and it takes the cooperation of the entire
college. We would like to especially thank the faculty members for their support by
taking class time and administering the survey:
We would also like to thank Mr. Maury Pearl of the District Office and his staff for sampling
and coordinating with all the nine colleges; Ken Roberts and the mailroom staff for the
distribution and collection; the Economic and Workforce Development student assistants;
and Learning Assistance Center staff for assisting with the survey clean‐up.
Peter Aguilera
Karen Amano
Joachin Arias
Jenny Arzaga
Juan Baez
William Barlow
Cassandra Betts
Allison Boyce
Bonnie Burstein
Albert Campbell
Katherine Campbell
Daisy Carr
King Carter
James Carver
John Corbally
Christina Couroux
Catherine Crouch
Anjanette Crum
Charles Davis
Giovanni Delrosario
Deanna Drew
Denise Dumars
Claudio Egalon
Michael Eula
Claude Fiddler
Robyn Fishman
Michael Fradkin
Beverly Fridley
Barbara Gallardo
James Garcia
Lisa Gaydosh
Abraham Gill
Leonard Glover
Steven Goomas
Wallace Graves
Laura Gray
Jean Grooms
Michael Hiscocks
Fredrick Ho
Wendy Hoole
Jeffrey Hoppenstand
Delores Hudson
Basil Ibe
Gail Jacobs
Maritza Jimenez
George Judd
Daniel Keller
Shazia Khan
Stacy Komai
Doc Le
Donald Lechman
Ronald Linden
William Loiterman
Frank Ma
John Mack
Dee Masters
Jay Mccafferty
Timothy Mccord
Paul Mcleod
Gary Miller
Steven Morris
Tissa Munasinghe
Son Nguyen
Susan Nowinski
David O’Shaughnessy
Michael Oates
Joneen Ohlaker
William Ohm
Laxmi Pandey
Joyce Parker
Jane Pavlina
Brett Peabody
Mona Reddick
Michael Reid
Melanie Renfrew
Delia Renteria
Jeffrey Rigby
Rey Rojo
Zahra Romero
Farzaneh Saddigh
Stanley Sandell
Richard Sibner
Alicia Sichan
Byron Smith
Kent Stoddart
Jack Thomas
Leslie Trujillo
Kisha Turner
Theresa Ursic
Kym Valvieja
Ruben Vega
Randy Wade
Ann Warren
Jontae Watkins
Nancy Webber
Robert Weber
Glenn Weiss
Russ Whiting
Aileen Wilson
Susan Yoder

Page 7
LOS ANGELES HARBOR COLLEGE SPRING 2012 STUDENT SURVEY RESULTS
INTRODUCTIONINTRODUCTION
Los Angeles Harbor College participated in the Los Angeles Community College District‐
wide Student Survey in the spring of 2012. This survey is conducted biennially. It is an
important resource to gain a better understanding of current and specific needs of our
students as well as provide data for grants, program review, and other assessment
needs.
About 5,000 surveys were distributed to 143 credit sections. Outreach classes,
non‐revenue generating sections, work experience, and cooperative education were
excluded. Interest in specific occupational areas, highest level of education in the
family, financial aid, and changes in the number of work hours were among the new
questions included in this survey.
The main sections were Goals and Plans; Background; Financial Resources;
Counseling Information and Services; College Experiences; and Campus Facilities and
Services.
This report summarizes the responses from 2,928 students.
CCAVEATSAVEATS
The survey was conducted during March 2012 so any activities that have occurred after that period are not be reflected in the results.
The survey sampled sections of students, not students directly. Because of this, there is a possibility that the sample is not as representative as a sample of students would be. To correct for this, we have used a weighting procedure developed by the LACCD Research Office.
The following types of classes were excluded from the survey: Outreach classes—at the time the survey was conducted, many of these classes
were not in session Non‐revenue generating sections (contract education/grant paid sections) Work Experience and Cooperative Education
Students who chose not to respond to certain questions were included in the “No Response” percentages. However, those who stopped responding to subsequent items were deleted from the calculations.
Harbor College also surveyed our online population. The sampling error of the survey is ± 5%. The response rate was 84%.

Page 8
LOS ANGELES HARBOR COLLEGE SPRING 2012 STUDENT SURVEY RESULTS
STUDENT DEMOGRAPHY AND BACKGROUND
The table below shows demographic comparison of those who responded to the
survey and the fall 2011 student population.
The age groups of the 25‐34 and 35 and over were slightly under represented.
Conversely, the less than 20 and 20‐24 groups were slightly over represented. Thus
affecting the average age of respondents of 24.8 years old, compared to the college
population of 26.2 years old.
Similar to the college‐wide population, Hispanics comprised the majority (50.6%) of
respondents, followed by Asian (15.8%), White (15.0%), and African American (13.2%).
Unknown and Decline to State categories were excluded.
Fifty‐five percent of respondents were female and 45.0% were male, while the entire
student body comprised of 57.8% females and 42.2% males.
Table 1.a
Fall 2011 Student
Population
Spring 2012 Student
Survey Percent
AGE Under 20 31.2% 37.8%
20‐24 34.2% 36.1%
25‐34 20.1% 16.1%
35 and over 20.1% 16.1%
Average Age 26.2 24.8
ETHNICITY African American 17.1% 13.2%
Asian 16.2% 15.8%
Hispanic 48.8% 50.6%
White 16.4% 15.0%
GENDER Female 57.8% 55.0%
Male 42.2% 45.0%

Page 9
LOS ANGELES HARBOR COLLEGE SPRING 2012 STUDENT SURVEY RESULTS
STUDENT DEMOGRAPHY AND BACKGROUND
Most (86.6%) of those surveyed claimed English as their primary language; Spanish as
second (8.9%), and Filipino (2.0%) as the third primary language.
Fifty‐four percent of respondents were continuing students and another 18% were first
time students.
Table 1.b
Table 1.c
STATUS
Student Survey
Percent
Concurrent High School Student 3.3%
First Time Student 18.0%
Former Concurrent Student This College 3.1%
Former Concurrent Student Another College 0.8%
New Transfer 9.9%
Continuing Student 53.5%
Returning Student 11.3%
LANGUAGE
Fall 2011 Student
Population Percent
Spring 2012 Student
Survey Percent
English 86.4% 86.6%
Spanish 9.0% 8.9%
Filipino 1.5% 2.0%
Other 1.1% 1.0%
Japanese 0.3% 0.2%
Korean 0.7% 0.8%
Farsi 0.3% 0.1%
Chinese 0.3% 0.2%
Vietnamese 0.2% 0.1%
Armenian 0.2% 0.1%

Page 10
LOS ANGELES HARBOR COLLEGE SPRING 2012 STUDENT SURVEY RESULTS
STUDENT DEMOGRAPHY AND BACKGROUND
Any student whose parents never enrolled in postsecondary education is considered a
first generation college student. There were 1,104 or 37.7% who placed in this
category.
Table 1.d
Table 1.e
TIME IN UNITED STATES
Student Survey
Percent
Less than five years 3.7%
Between five and ten years 7.0%
More than ten years, not born here 12.0%
Born here, but parents were not 30.8%
At least one parent born here, grandparents not 17.3%
All grandparents born here 28.1%
Highest education level Father Mother Sibling
Elementary school or less (grades 1‐6) 9.8% 9.2% 1.9%
Middle School (grades 7‐8) 7.2% 7.3% 4.4%
Some high school/secondary school,
did not graduate13.5% 12.7% 9.6%
Completed high school/secondary
school graduate20.5% 18.9% 15.5%
Some college, no degree 14.3% 16.7% 17.6%
Two‐year college degree 7.1% 9.4% 7.4%
Four‐year college degree 11.8% 12.8% 15.3%
Advanced degree 7.5% 7.5% 8.2%
No response 8.4% 5.5% 20.0%

Page 11
LOS ANGELES HARBOR COLLEGE SPRING 2012 STUDENT SURVEY RESULTS
STUDENT DEMOGRAPHY AND BACKGROUND
Table 1.f
Table 1.g
Table 1.h
Marital StatusStudent Survey
Percent
Single 85.1%
Married or
domestic partner 11.5%
No response 3.4%
Do you have dependent
children?
Student Survey
Percent
No/No Response 70.7%
Yes, 5 years old or younger 11.2%
Yes, 6‐18 years old 10.8%
Yes, over 18 years old 7.3%
Number of dependent
children
Marital Status:
Single
Marital Status:
Married
With dependent children
18 years old or younger 12.3% 5.7%
No Children 70.3% 4.6%
With Children 14.8% 6.9%
Total 85.1% 11.5%

Page 12
LOS ANGELES HARBOR COLLEGE SPRING 2012 STUDENT SURVEY RESULTS
STUDENT DEMOGRAPHY AND BACKGROUND
Table 1.i
If you have a disability, have you
informed the Disabled Students Office?
Student
Survey
Percent
Yes 5.4%
No 5.8%
No disability 99.8%
No response 2.5%
Respondents were largely single (85.1%).
Most (70.7%) had no dependent children.
Of those who had children 18 years old or younger, 12.3% were single parents.
About 11% have some kind of a disability and only half of them have sought help from
the Disabled Students Office.

LOS ANGELES HARBOR COLLEGE SPRING 2012 STUDENT SURVEY RESULTS
GOALS AND PLANS
Page 13
Table 2.a
Table 2.b
What is the highest degree or certificate that you
ever intend to obtain?
Student
Survey
Percent
High school diploma or GED 23.0%
Certificate in a vocational program 2.7%
Associate Degree 6.8%
Bachelor's Degree 20.5%
Master's Degree 25.4%
Professional Degree 6.7%
Academic Doctorate 7.6%
Not seeking Degree/Certificate or already have 0.3%
Undecided 5.7%
No Response 1.3%
How do you feel about attending college?Strongly
AgreeAgree Disagree
Strongly
Disagree
No
Response
Being a college student is very important to me 76.8% 18.5% 0.9% 1.1% 2.8%
In my family, going to college is highly valued 58.5% 25.4% 4.2% 1.6% 10.3%If I could find another way to achieve my goals I
would not go to college 8.2% 18.5% 34.7% 27.9% 10.7%

LOS ANGELES HARBOR COLLEGE SPRING 2012 STUDENT SURVEY RESULTS
GOALS AND PLANS
Page 14
Table 2.c
The top three educational goals were to obtain a Master’s Degree (25.4%), Bachelor’s
Degree (20.5%), and high school diploma/GED (23.0%),
Most (62.6%) considered college education as valuable; and going to college as
important to them and their family.
Students were asked about the factors that prevent them from succeeding in class. The
top five moderate or major problems were:
Financial factors (43.6%)
Course availability (38.3%)
Job obligations (33.4%)
High school preparation (25.4%)
Study skills (24.8%)
Have any of the following been a problem for you
in succeeding in your classes?
Not a
problem
Minor
problem
Moderate
problem
Major
Problem
No
Response
Quality of high school preparation in
reading/writing 56.6% 19.4% 10.3% 4.6% 9.1%
Quality of high school preparation in math 44.2% 21.9% 14.5% 10.9% 8.4%
Study skills (e.g., note taking, test preparation) 41.3% 25.6% 16.1% 8.7% 8.3%
English is not my primary language 78.0% 6.6% 3.3% 3.0% 9.0%
Too much is expected by instructors 53.8% 26.8% 7.7% 2.5% 9.3%
Financial factors 26.4% 22.6% 22.7% 20.9% 7.4%
Job obligations 35.7% 23.5% 21.0% 12.4% 7.4%
Family obligations 43.9% 23.7% 14.8% 8.9% 8.6%
Course is not relevant to me 58.2% 20.4% 7.7% 4.0% 9.7%
Lack of motivation 52.3% 25.1% 8.9% 5.1% 8.6%
Other personal probelms 47.4% 25.5% 11.8% 6.8% 8.5%
Unable to enroll onto classes I need 34.8% 19.2% 18.5% 19.7% 7.8%

Page 15
LOS ANGELES HARBOR COLLEGE SPRING 2012 STUDENT SURVEY RESULTS
FINANCIAL RESOURCES
Table 3.a
Table 3.b
A little over half (51.1%) of our students were employed, with 11% working 40 hours a
week or more and the rest (40%) as part‐timers. The other 46.9% were not working.
Have your hours changed over the past year?
Student
Survey
Percent
No change 47.7%
Increased 12.8%
Decreased 13.3%
Was employed, now unemployed 13.6%
Was unemployed, now employed 8.0%
No Response 4.6%
How many hours per week do you
currently work?
Student
Survey
Percent
40 hours or more 11.1%
20‐39 hours 22.3%
10‐19 hours 12.9%
Less than 10 hours 4.8%
I don't work 46.9%
No response 2.0%

Page 16
LOS ANGELES HARBOR COLLEGE SPRING 2012 STUDENT SURVEY RESULTS
FINANCIAL RESOURCES
Table 3.c
Figure 3.a
Have you applied for federal financial aid?
Student
Survey
Percent
Yes, and I am eligible for financial aid 56.2%
Yes, but I am not eligible for financial aid 13.9%
No 28.0%
No Response 1.9%
Over half (56.2%) have applied for and were eligible for financial aid.
Financial aid information was mainly obtained from a high school counselor (26%), other
source of information (21%), and the college financial aid office (20%).
Thirteen percent of those who did not apply for aid said they did not think they would be
eligible.
From a high
school
counselor, 26%
College
orientation,
10%
In a college
class, 4%
From a college
counselor, 9%
College
financial aid
office, 20%
College
website, 11%
Government
financial aid
website, 9%
Other source of
information,
21%
If you applied for federal financial aid, where or from whom
did you get information about financial aid?

Page 17
LOS ANGELES HARBOR COLLEGE SPRING 2012 STUDENT SURVEY RESULTS
FINANCIAL RESOURCES
Table 3.d
Table 3.e
Only one fourth of our students did not consider the cost of textbooks as a problem.
Almost 30% delayed purchasing and another 22% did not buy all of the required
textbooks.
*AB540 is a type of exemption from the payment of nonresident tuition for certain nonresident students who have
attended high school in California and received a high school diploma or its equivalent.
Are costs for textbooks a problem for you?
Student
Survey
Percent
Yes, I take a fewer courses as a result 16.6%
Yes, I don’t buy all of the required books 22.4%
Yes, I delay buying books 28.9%
Yes, I don’t buy any books 2.4%
I rent one or more books 20.2%
No 25.2%
If you did not apply for financial aid, why not?
Student
Survey
Percent
I did not think I would be eligible 13.1%
The application forms were too complicated 1.3%
I did not have the information about my family's
income1.2%
I did not want to reveal my family's income 0.1%
The money was not large enough to be worth the
effort0.6%
I don't like to receive public assistance 1.0%
I was not aware of financial aid oppurtunities 1.6%
I am an *AB 540 student 2.2%
Other reason for not applying 10.5%
No response 68.4%
Page 18
LOS ANGELES HARBOR COLLEGE SPRING 2012 STUDENT SURVEY RESULTS
COUNSELING INFORMATION & SERVICES
Table 4.a
Table 4.b
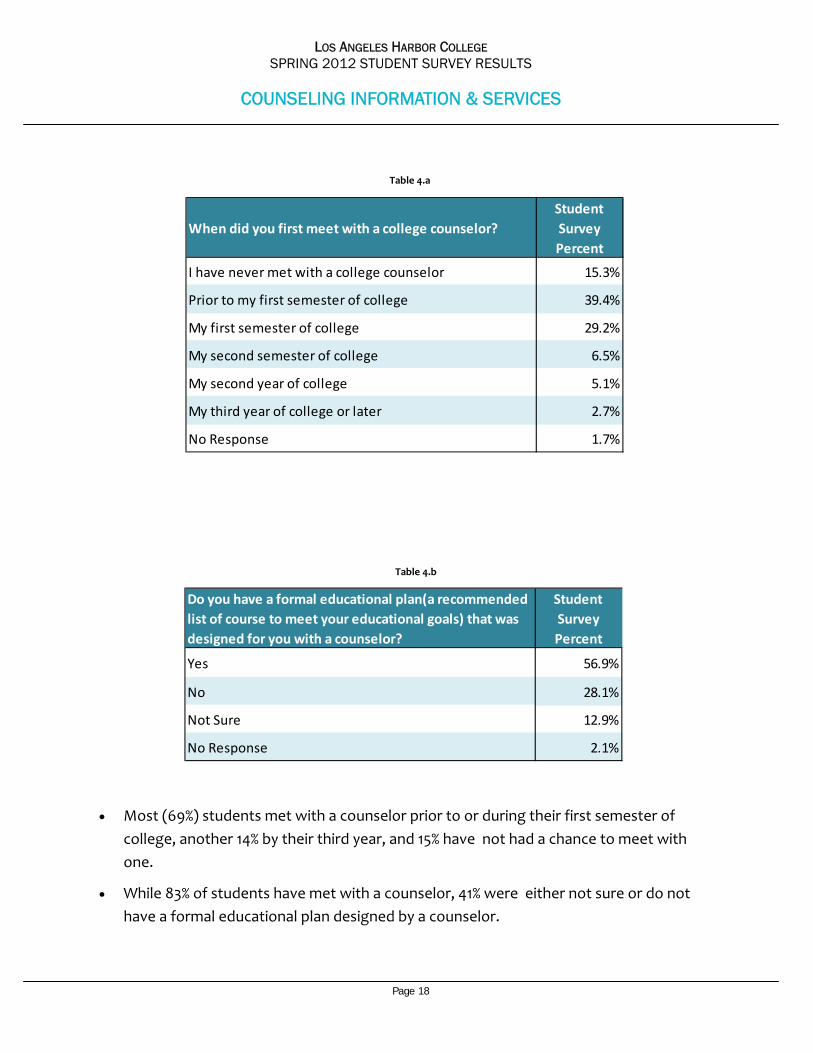
When did you first meet with a college counselor?
Student
Survey
Percent
I have never met with a college counselor 15.3%
Prior to my first semester of college 39.4%
My first semester of college 29.2%
My second semester of college 6.5%
My second year of college 5.1%
My third year of college or later 2.7%
No Response 1.7%
Do you have a formal educational plan(a recommended
list of course to meet your educational goals) that was
designed for you with a counselor?
Student
Survey
Percent
Yes 56.9%
No 28.1%
Not Sure 12.9%
No Response 2.1%
Most (69%) students met with a counselor prior to or during their first semester of
college, another 14% by their third year, and 15% have not had a chance to meet with
one.
While 83% of students have met with a counselor, 41% were either not sure or do not
have a formal educational plan designed by a counselor.

Page 19
LOS ANGELES HARBOR COLLEGE SPRING 2012 STUDENT SURVEY RESULTS
COUNSELING INFORMATION & SERVICES
Table 4.c
Have you been able to follow the recommened list of
courses in your educational plan?
Student
Survey
Percent
Yes 51.8%
No, some of the courses I need have not been offered
when I can attend10.9%
No, there has not been space in the classes I need 12.8%
No, I've changed my mind about my program or goals 3.7%
I do not have an educational plan 17.5%
No Response 3.3%
Over half (51.8%) have been able to follow their educational plan.
Only 11% cannot attend the recommended classes at the time they are offered .
Nearly thirteen percent say space in the class has been an issue in completing their
educational plan.
Page 20
LOS ANGELES HARBOR COLLEGE SPRING 2012 STUDENT SURVEY RESULTS
COUNSELING INFORMATION & SERVICES
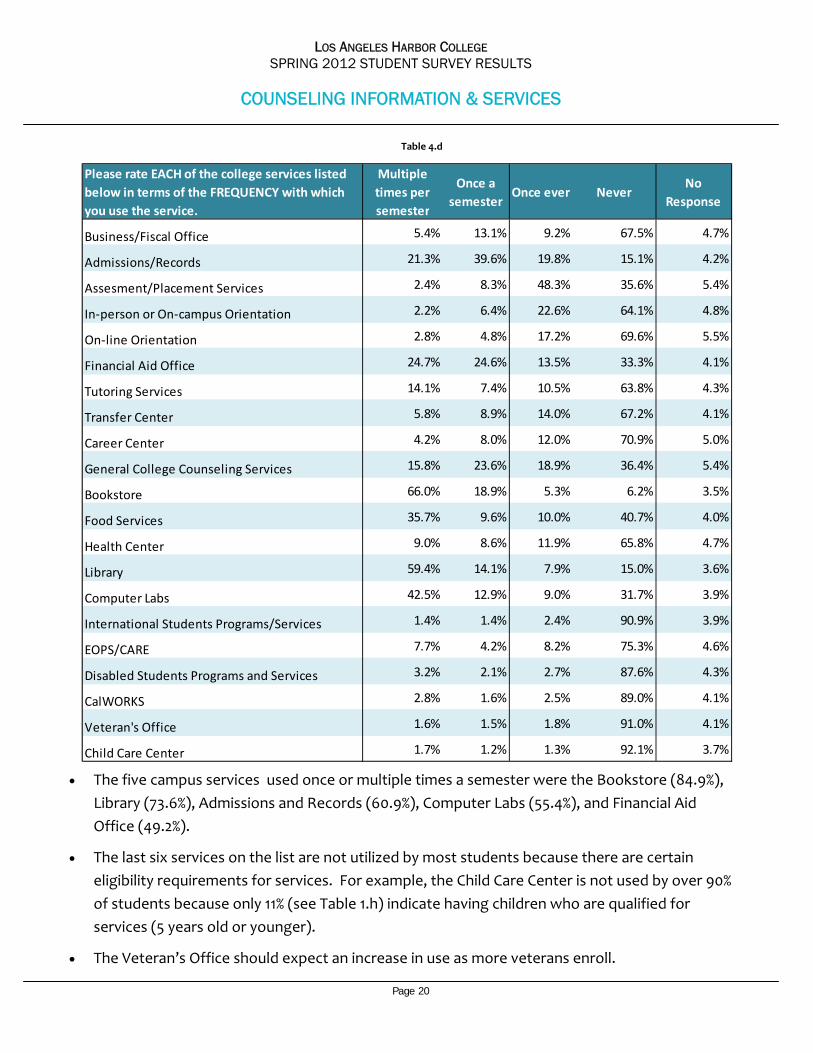
Table 4.d
The five campus services used once or multiple times a semester were the Bookstore (84.9%),
Library (73.6%), Admissions and Records (60.9%), Computer Labs (55.4%), and Financial Aid
Office (49.2%).
The last six services on the list are not utilized by most students because there are certain
eligibility requirements for services. For example, the Child Care Center is not used by over 90%
of students because only 11% (see Table 1.h) indicate having children who are qualified for
services (5 years old or younger).
The Veteran’s Office should expect an increase in use as more veterans enroll.
Please rate EACH of the college services listed
below in terms of the FREQUENCY with which
you use the service.
Multiple
times per
semester
Once a
semesterOnce ever Never
No
Response
Business/Fiscal Office 5.4% 13.1% 9.2% 67.5% 4.7%
Admissions/Records 21.3% 39.6% 19.8% 15.1% 4.2%
Assesment/Placement Services 2.4% 8.3% 48.3% 35.6% 5.4%
In‐person or On‐campus Orientation 2.2% 6.4% 22.6% 64.1% 4.8%
On‐line Orientation 2.8% 4.8% 17.2% 69.6% 5.5%
Financial Aid Office 24.7% 24.6% 13.5% 33.3% 4.1%
Tutoring Services 14.1% 7.4% 10.5% 63.8% 4.3%
Transfer Center 5.8% 8.9% 14.0% 67.2% 4.1%
Career Center 4.2% 8.0% 12.0% 70.9% 5.0%
General College Counseling Services 15.8% 23.6% 18.9% 36.4% 5.4%
Bookstore 66.0% 18.9% 5.3% 6.2% 3.5%
Food Services 35.7% 9.6% 10.0% 40.7% 4.0%
Health Center 9.0% 8.6% 11.9% 65.8% 4.7%
Library 59.4% 14.1% 7.9% 15.0% 3.6%
Computer Labs 42.5% 12.9% 9.0% 31.7% 3.9%
International Students Programs/Services 1.4% 1.4% 2.4% 90.9% 3.9%
EOPS/CARE 7.7% 4.2% 8.2% 75.3% 4.6%
Disabled Students Programs and Services 3.2% 2.1% 2.7% 87.6% 4.3%
CalWORKS 2.8% 1.6% 2.5% 89.0% 4.1%
Veteran's Office 1.6% 1.5% 1.8% 91.0% 4.1%
Child Care Center 1.7% 1.2% 1.3% 92.1% 3.7%
Page 21
LOS ANGELES HARBOR COLLEGE SPRING 2012 STUDENT SURVEY RESULTS
COUNSELING INFORMATION & SERVICES
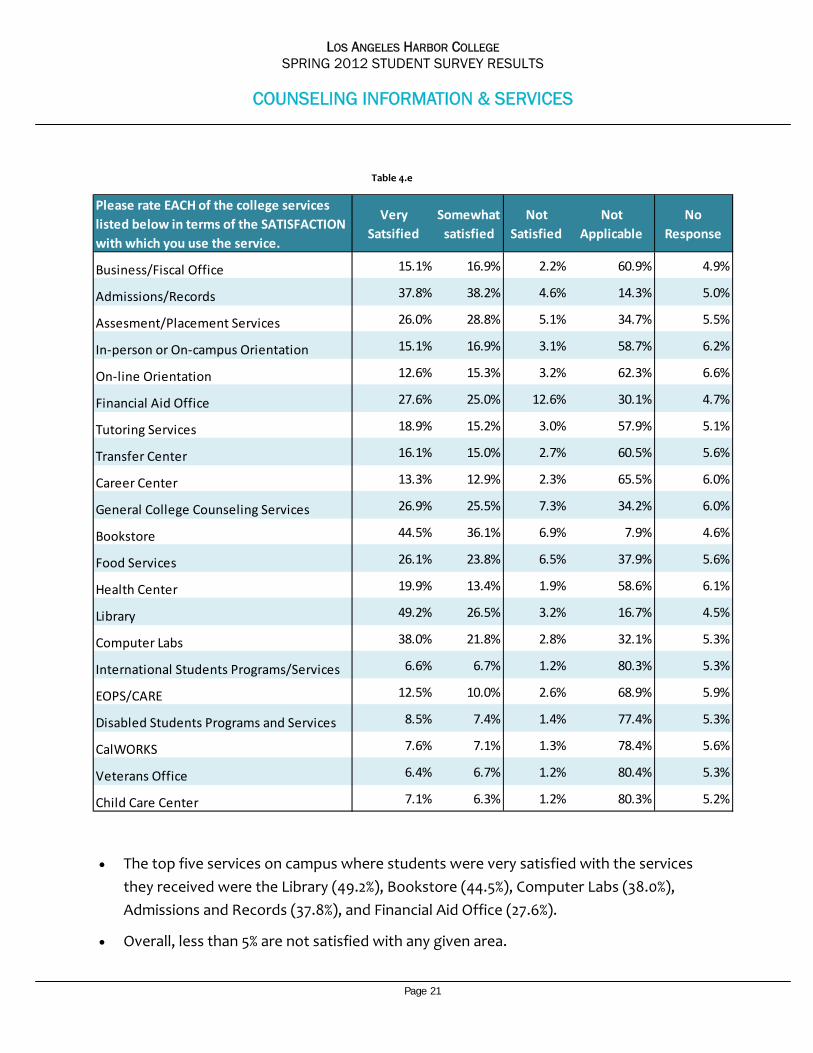
Table 4.e
The top five services on campus where students were very satisfied with the services
they received were the Library (49.2%), Bookstore (44.5%), Computer Labs (38.0%),
Admissions and Records (37.8%), and Financial Aid Office (27.6%).
Overall, less than 5% are not satisfied with any given area.
Please rate EACH of the college services
listed below in terms of the SATISFACTION
with which you use the service.
Very
Satsified
Somewhat
satisfied
Not
Satisfied
Not
Applicable
No
Response
Business/Fiscal Office 15.1% 16.9% 2.2% 60.9% 4.9%
Admissions/Records 37.8% 38.2% 4.6% 14.3% 5.0%
Assesment/Placement Services 26.0% 28.8% 5.1% 34.7% 5.5%
In‐person or On‐campus Orientation 15.1% 16.9% 3.1% 58.7% 6.2%
On‐line Orientation 12.6% 15.3% 3.2% 62.3% 6.6%
Financial Aid Office 27.6% 25.0% 12.6% 30.1% 4.7%
Tutoring Services 18.9% 15.2% 3.0% 57.9% 5.1%
Transfer Center 16.1% 15.0% 2.7% 60.5% 5.6%
Career Center 13.3% 12.9% 2.3% 65.5% 6.0%
General College Counseling Services 26.9% 25.5% 7.3% 34.2% 6.0%
Bookstore 44.5% 36.1% 6.9% 7.9% 4.6%
Food Services 26.1% 23.8% 6.5% 37.9% 5.6%
Health Center 19.9% 13.4% 1.9% 58.6% 6.1%
Library 49.2% 26.5% 3.2% 16.7% 4.5%
Computer Labs 38.0% 21.8% 2.8% 32.1% 5.3%
International Students Programs/Services 6.6% 6.7% 1.2% 80.3% 5.3%
EOPS/CARE 12.5% 10.0% 2.6% 68.9% 5.9%
Disabled Students Programs and Services 8.5% 7.4% 1.4% 77.4% 5.3%
CalWORKS 7.6% 7.1% 1.3% 78.4% 5.6%
Veterans Office 6.4% 6.7% 1.2% 80.4% 5.3%
Child Care Center 7.1% 6.3% 1.2% 80.3% 5.2%

Page 22
LOS ANGELES HARBOR COLLEGE SPRING 2012 STUDENT SURVEY RESULTS
COLLEGE EXPERIENCES
Table 5.a
Students were asked about their experiences at Harbor College as well as their
interactions with their peers, classmates, and instructors. Almost 80% were active in
class by asking questions and participating in class discussions. They also worked with
others in class group settings. A majority (71%) discussed class ideas with others outside
of class.
Almost all (91%) used a computer at home for school work.
Almost all (90%) used the Internet for college related transactions such as applying,
registering, and checking grades.
Less than 40% interacted with their instructors regarding educational plans and class
reading ideas.
Students also did not take advantage of instructor office hours. Sixty‐six percent
seldom or never visit instructors during office hours. This may be an area for further
investigation—do students have time conflicts with instructor hours or do they not use
them for other reasons?
At this college, how often do you do each of
the following?Often Sometimes Seldom Never
No
Response
Ask questions or participate in class
discussions39.7% 39.8% 15.6% 2.7% 2.2%
Give a presentation or performance in class 16.3% 39.0% 27.8% 14.4% 2.5%
Work with other students in groups during
class41.8% 37.9% 13.6% 4.1% 2.6%
Work with others outside of class to prepare
class assignments24.1% 31.0% 22.3% 19.7% 2.8%
Discuss ideas from your classes with others
outside of class (students, family members,
co‐workers, etc.)
37.0% 33.9% 16.0% 10.2% 2.9%
Have serious conversations with students
who differ from you in terms of their
religious beliefs, political opinions, or ethnic
background
17.0% 20.7% 23.1% 35.0% 4.2%
Go to class unprepared 3.3% 13.2% 33.9% 46.8% 2.8%
Skip class 1.6% 7.2% 28.3% 60.3% 2.5%

Page 23
LOS ANGELES HARBOR COLLEGE SPRING 2012 STUDENT SURVEY RESULTS
COLLEGE EXPERIENCES
Table 5.c
Table 5.b
How often do you use a computer for each of
the following activities?Often Sometimes Seldom Never
No
Response
Use a computer AT HOME to do school work 75.2% 15.7% 3.9% 3.4% 1.8%
Use a computer AT WORK to do school work 15.8% 9.2% 7.0% 65.1% 3.0%
Use a computer ON CAMPUS to do school
work29.3% 24.6% 15.4% 28.1% 2.7%
Use the internet to do research for an
assignment70.9% 17.7% 4.0% 3.2% 4.2%
Use email, instant messaging, texting, social
media or other electronic methods to do
work on an assignment with other students
44.1% 24.4% 14.4% 14.3% 2.8%
Use email, instant messaging, texting, social
media or other electronic methods to
communicate with an instructor
32.0% 31.5% 19.0% 14.5% 3.0%
Use a course website 35.3% 27.3% 15.6% 19.1% 2.7%
Use the college website 39.1% 32.5% 15.0% 10.7% 2.7%
Use the library website 22.5% 21.4% 20.5% 31.5% 4.1%
Use the internet to apply, register, check
grades, add or drop classes73.2% 17.0% 4.1% 3.1% 2.6%
How would you describe your interactions
with instructors?Often Sometimes Seldom Never
No
Response
I talk about educational/career plans with an
instructor12.2% 24.5% 27.3% 33.2% 2.9%
I discuss ideas from my readings or classes
with instructors outside of class12.3% 21.2% 26.1% 37.6% 2.8%
I visit instructors during their office hours 8.2% 22.7% 29.5% 36.8% 2.8%

Page 24
LOS ANGELES HARBOR COLLEGE SPRING 2012 STUDENT SURVEY RESULTS
COLLEGE EXPERIENCES
Table 5.d
Table 5.e
Forty‐two percent of our students spent 1‐5 hours a week to prepare for class and
another 26% spent between 6‐10 hours a week.
A fraction (12.7%) did not spend any of their time at college‐sponsored events. The
college may want to investigate the reasons why students are not participating in these
college activities.
Family responsibility topped the list of activities our students spent their time on.
Twenty‐two percent spent 30 or more hours attending to family needs and
responsibilities.
During your attendance at this college have
you done any of the following?Yes No
No
Response
Participated in a community service project
as a part of a class through a student club13.9% 83.4% 2.6%
Tutored or taught other students (paid or
voluntary)15.5% 81.5% 3.0%
Attended a college sporting event, theater
production or musical performance32.0% 65.1% 2.9%
Attended a college club meeting 13.0% 84.0% 3.0%
During the previous school week, how many
hours did you spend in each of the following
activities?
None 1 ‐ 5 6 ‐ 10 11 ‐ 20 21 ‐ 30 30 PlusNo
Response
Class preparation (studying, reading, writing,
rehearsing, doing homework)2.6% 42.0% 25.9% 16.2% 5.8% 5% 2.8%
Participation in college‐sponsored activities
(clubs, campus publications, student
government, intercollegiate or intramural
sports, etc.)
76.1% 12.7% 3.9% 1.6% 1.0% 1% 3.2%
Family responsibilities 4.1% 18.1% 21.3% 19.0% 12.3% 22% 3.7%
Commuting (to school and/or work) 6.0% 48.7% 18.4% 10.6% 5.8% 7% 3.7%
Socializing, watching TV, other recreation 6.0% 40.3% 23.3% 14.8% 6.6% 6% 2.7%

Page 25
LOS ANGELES HARBOR COLLEGE SPRING 2012 STUDENT SURVEY RESULTS
COLLEGE EXPERIENCES
Table 5.f
Based on their experiences at Harbor College, our students claimed to have very much
or quite a bit improved their skills in several areas. The top five are: Learn Effectively
Learn On My Own (73%), Acquire a Broad General Education (71%), Think Critically and
Analytically (70%), Work Effectively With Others (69%), and Understand Yourself (69%).
Forty‐three percent have gotten a job or advanced in their career.
Sixty‐four percent have more clear career goals.
Sixty percent have further developed values/ethics as a result of attending Harbor.
Fifty‐five percent have adopted a healthier lifestyle.
How much have your experiences at this
college both in and out of class
helped/improved your ability to do the
following?
Very
Much
Quite
a BitSome
Very
Little
No
Response
Acquire a broad general education 37.9% 33.3% 18.0% 7.3% 3.5%
Acquire a job or work‐related knowledge and
skills23.3% 24.9% 26.3% 21.9% 3.6%
Write clearly and effectively 31.8% 32.9% 23.4% 8.5% 3.4%
Speak clearly and effectively 33.0% 33.5% 20.4% 9.2% 3.8%
Think critically and analytically 37.0% 33.4% 19.5% 6.2% 3.8%
Solve numerical problems 29.4% 27.7% 23.2% 15.6% 4.1%
Use computers and other information and
technology33.8% 26.2% 21.2% 15.1% 3.7%
Work effectively with others 36.4% 32.3% 20.2% 7.3% 3.8%
Learn effectively on your own 41.1% 31.6% 17.6% 5.9% 3.8%
Understand yourself 40.8% 28.3% 17.8% 8.1% 4.9%
Understand people of other racial, cultural or
ethnic backgrounds38.6% 28.0% 19.8% 9.6% 3.9%
Develop a personal code of values and ethics 32.7% 27.2% 21.3% 14.7% 4.1%
Contribute to the welfare of our community 20.5% 20.6% 25.5% 29.1% 4.2%
Develop clearer career goals 36.8% 27.5% 20.3% 11.0% 4.4%
Get a job or advance your career 22.8% 20.6% 21.1% 30.7% 4.9%
Set educational goals and monitor your
progress35.7% 28.4% 22.3% 9.4% 4.3%
Adopt a healthier lifestyle 29.4% 25.4% 23.1% 18.1% 4.0%
Appreciate the arts 32.0% 23.1% 21.3% 19.6% 3.9%

Page 26
LOS ANGELES HARBOR COLLEGE SPRING 2012 STUDENT SURVEY RESULTS
COLLEGE EXPERIENCES
Table 5.g
Table 5.h
Twenty‐eight percent did not spend additional time on campus outside their class and
campus employment time. Another 35% spent an additional three hours or less on
campus for non‐class related activities. This is reflective of Harbor as a commuter
campus.
Although 63% were aware of opportunities for student involvement on campus, 32% did
not know how to get involved.
Student
Survey
Percent
28.3%
35.1%
18.3%
7.5%
3.2%
3.8%
3.7%
Twelve hours or more
No response
Outside of class time and time spent in on‐campus
employment, how many hours per week do you spend
on campus studying, using the library, and/or engaging
in cultural and/or leisure activities?
None
Three hours or less
Three to six hours
Six to nine hours
Nine to twelve hours
To what extent do you agree with the
following statements?
Strongly
AgreeAgree Disagree
Strongly
Disagree
Does Not
Apply
No
Response
I am aware of opportunities for involvement
in student clubs and activities20.7% 42.0% 21.2% 11.1% 4.1% 0.8%
I know how to bring forth an idea to college
leadership to improve a practice, program, or
service at the college
11.9% 31.0% 33.4% 17.6% 4.3% 1.8%
I know how to provide input on college
decisions13.9% 32.7% 28.9% 17.2% 4.3% 3.0%

Page 27
LOS ANGELES HARBOR COLLEGE SPRING 2012 STUDENT SURVEY RESULTS
COLLEGE EXPERIENCES
Table 5.i
To what extent do you agree with the
following statements about education
practices at this college?
Strongly
AgreeAgree Disagree
Strongly
Disagree
Does Not
Apply
No
Response
Textbooks and reading materials are useful
for the courses40.2% 47.1% 5.4% 1.8% 1.0% 4.5%
Grading practices in the courses are fair 29.1% 57.0% 6.7% 1.3% 0.7% 5.2%
Tests cover the course material presented 30.7% 53.3% 7.8% 1.3% 0.8% 6.1%
The policies and penalties for cheating are
provided and are followed45.5% 42.3% 3.6% 1.0% 2.2% 5.4%
College publications clearly and adequately
reflect the college's policies and procedures
(catalog, schedule of classes, website)
36.7% 49.5% 4.8% 1.2% 2.2% 5.5%
Course syllabi that describe the course
expectations and grading procedures are
distributed
48.6% 41.6% 2.8% 0.7% 0.7% 5.7%
Course syllabi are followed 41.8% 45.9% 4.1% 0.8% 0.7% 6.7%
Student learning outcomes for my classes are
presented or listed on course syllabi44.5% 45.1% 3.2% 0.5% 0.9% 5.7%
Instructors present data and information
fairly and objectively35.4% 49.8% 5.9% 1.4% 2.1% 5.5%
I would encourage others to attend this
college37.7% 50.2% 4.9% 1.0% 0.9% 5.3%
For the most part, 90% or more of respondents agreed or strongly agreed with Harbor
College’s educational practices.
Ninety percent said that the course syllabi are distributed and describe class
expectations and grading procedures.
Ninety percent strongly agreed or agreed that student learning outcomes are
presented or listed in the course syllabi.
Eighty‐eight percent would encourage others to attend Harbor College.

Page 28
LOS ANGELES HARBOR COLLEGE SPRING 2012 STUDENT SURVEY RESULTS
CAMPUS FACILITIES AND SERVICES
Table 6.a
Eighty‐four percent agreed or strongly agreed about feeling safe and secure on campus.
With the West Parking Structure opening in Spring 2011, over 93% agreed or strongly agreed that the campus has sufficient parking. This is an improvement to the responses from the 2009 Student Survey where only 48% thought parking was adequate.
While 64% feel the campus has adequate lighting after dark, 23% would like to have more lighting at night.
About 80% agreed or strongly agreed that the buildings, grounds, and public areas on campus are clean and well maintained.
To what extent do you agree with the following
statements about the facilities and services on this
campus?
Strongly
AgreeAgree Disagree
Strongly
Disagree
Does Not
Apply
No
Response
I feel safe and secure on this campus 31.0% 53.0% 8.8% 1.9% 0.8% 4.5%
Campus buildings are clean and well maintained 26.3% 52.5% 12.0% 3.4% 1.1% 4.8%
Food service on this campus is sufficient 18.0% 40.2% 12.0% 4.6% 20.0% 5.2%
The restrooms on this campus are clean and well
maintained19.0% 47.6% 18.3% 7.8% 2.2% 5.0%
The grounds and public areas on this campus are
clean and well maintained23.6% 56.8% 10.8% 2.7% 1.3% 4.8%
The campus is free of safety hazards 22.1% 52.3% 13.4% 4.1% 2.6% 5.5%
The campus has adequate outside lighting after
dark20.0% 43.4% 17.2% 6.0% 8.2% 5.1%
Sufficient parking is available on campus 26.6% 46.7% 10.5% 5.6% 5.5% 5.2%
The parking lots are safe, well lit, and well
maintained26.9% 50.0% 8.4% 3.7% 5.9% 5.2%
The college has made a good effort to reduce the
impact of construction on students24.9% 47.2% 14.8% 6.1% 2.2% 4.8%

Page 29
LOS ANGELES HARBOR COLLEGE SPRING 2012 STUDENT SURVEY RESULTS
COMMENTS
Describe the one or two things you like BEST about this college:
Next, students were asked to describe one or two things they like best about Harbor College. Over 200 pages and 2,500 qualitative responses were received.
Respondents cited several things about the college they liked best. The figure below names those reasons and the number of times they were identified.
The top three areas students like most about Harbor College are the faculty and staff (32.8%), campus ‐ buildings, technology, environment (30.4%), and services (14.7%).
Figure 7.a
768
19
830
304
372
80
155
Campus ‐ Buildings, Technology, Environment
Cost
Faculty/Staff
Location
Student Services
Parking
Academics
Describe the one or two things
you like best about this college.

Page 30
LOS ANGELES HARBOR COLLEGE SPRING 2012 STUDENT SURVEY RESULTS
COMMENTS
The teachers are down to earth and helpful.
I like how friendly and helpful most instructors are, I also like how helpful the staff is regarding classes or financial aid.
Good instructors, friendly staff
Teachers are objective and use logic when teaching. Teachers make time for students. Great and informing lectures that can only apply to the real world. Cognitive thinking. Professors treat us as adults not children.
It is very peaceful and a great place to study.
Nice campus, very clean and organized. New buildings and equipment.
This campus is small and has good atmosphere to study.
Easily accessible, less crowded
I like that they offer a lot of services for people that attend the college.
Whenever you need information its available.
You find help everywhere.
It provides lots of helpful resources that I do not have and not able to get such as computers and tutors.
Representative comments with high frequency:
FACULTY AND STAFF
BUILDINGS AND FACILITIES
SERVICES
OTHER COMMENTS
There is one thing I particularly love— the
melting pot of different races, cultures and
responsibilities.
I like that even though I am still in high school
I can take classes here, I also feel safe on
campus far away from home.
The culinary program makes great food for
such reasonable prices. The instructors here
are wonderfully involved and care for the
students greatly.
I like the fact that night classes and online
classes are available to someone like me that
works 4 days a week/10hrs a day.
You can rent books if you don’t have the money
to buy. That Harbor College has a lot of free
programs for us if we can’t afford.
There are always practice rooms available to me
in the music building. Music instruments are
encouraging.
I feel like the classes I have taken have helped
out only in my education, but my daily life.
Describe the one or two things you like BEST about this college:
Page 31
LOS ANGELES HARBOR COLLEGE SPRING 2012 STUDENT SURVEY RESULTS
COMMENTS
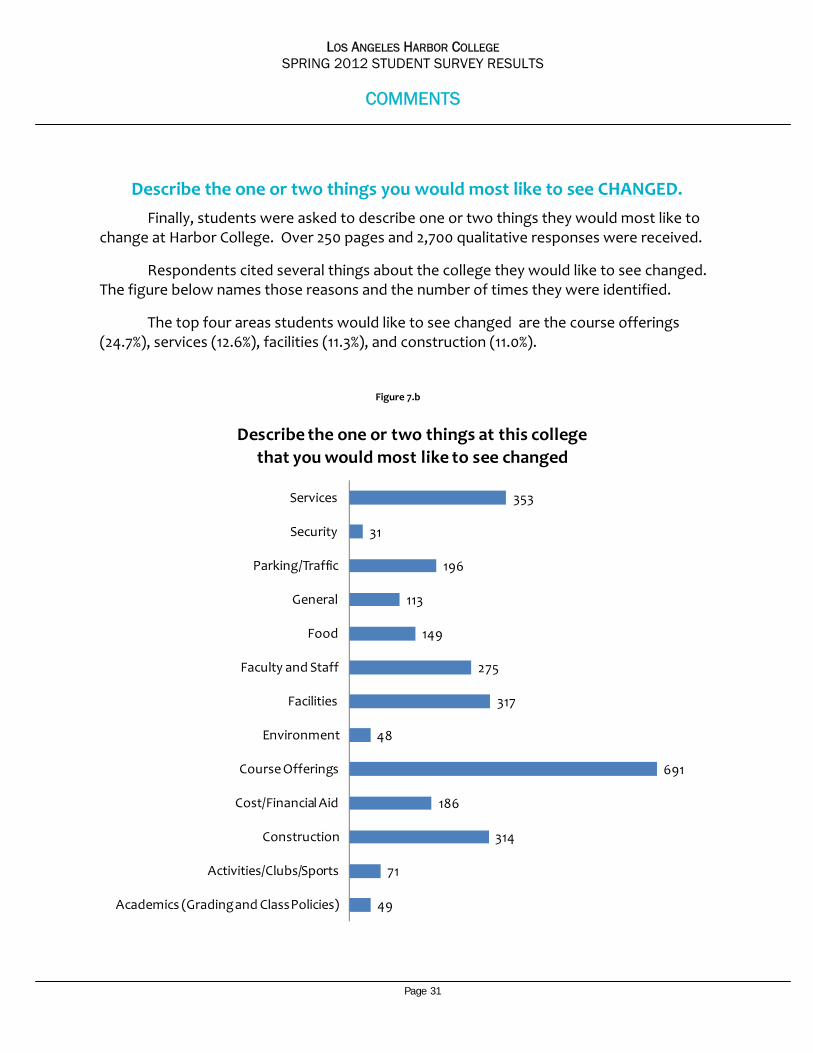
Describe the one or two things you would most like to see CHANGED.
Finally, students were asked to describe one or two things they would most like to change at Harbor College. Over 250 pages and 2,700 qualitative responses were received.
Respondents cited several things about the college they would like to see changed. The figure below names those reasons and the number of times they were identified.
The top four areas students would like to see changed are the course offerings (24.7%), services (12.6%), facilities (11.3%), and construction (11.0%).
49
71
314
186
691
48
317
275
149
113
196
31
353
Academics (Grading and Class Policies)
Activities/Clubs/Sports
Construction
Cost/Financial Aid
Course Offerings
Environment
Facilities
Faculty and Staff
Food
General
Parking/Traffic
Security
Services
Describe the one or two things at this college
that you would most like to see changed
Figure 7.b

Page 32
LOS ANGELES HARBOR COLLEGE SPRING 2012 STUDENT SURVEY RESULTS
COMMENTS
More online classes. Class availability. There are too many classes being cut. More English classes available. I would like to see more math and science
classes offered. More lower level math classes.
Adding more late evening classes. More PACE classes. Night classes in nursing. Have winter and summer sessions.
Construction is a hassle, complicates getting to class.
Less construction so there is more time to get to other classes.
Too much construction during school hours.
More people to direct you where classes are during the first days because construction makes everything confusing.
I would like to see the construction finished.
Representative comments with high frequency:
COURSE OFFERINGS
BUILDINGS AND FACILITIES
SERVICES
OTHER COMMENTS
The library needs funding, it’s sad to see that there is no tape, paper clips, paper, or pens in the library.
Math lab to be bigger with more ventilation.
I would like to see the Spanish department offer more help to students.
I would like to see more tutors for tutoring service.
Online registration isn't very helpful and can be very time consuming.
Updated information on the Web.
Educational plan provided at registration once major is specified.
The enrollment process is difficult especially for veterans who are trying to get benefits.
Some offices needs to open longer hours. Taking placement test on the weekends
after 6pm. More information about student services. I would like to be able to reach the
information desk by telephone when I have a question.
Teachers who can relate to college students.
Teachers who teach with more enthusiasm and passion. Teachers with less accents so we could understand them.
There should be more counselors to talk to, and counselors should be able to give more time to their students.
I would like to see campus events promoted more. I rarely hear about them, I would participate more of I knew more about them.
Describe the one or two things you would most like to see CHANGED.

Page 33
LOS ANGELES HARBOR COLLEGE SPRING 2012 STUDENT SURVEY RESULTS
APPENDIX

Page 34
LOS ANGELES HARBOR COLLEGE SPRING 2012 STUDENT SURVEY RESULTS
APPENDIX

Page 35
LOS ANGELES HARBOR COLLEGE SPRING 2012 STUDENT SURVEY RESULTS
APPENDIX

Page 36
LOS ANGELES HARBOR COLLEGE SPRING 2012 STUDENT SURVEY RESULTS
APPENDIX

This page intentionally left blank.
LOS ANGELES HARBOR COLLEGE