London Residential Breakfast Briefing 2015 | Estates Gazette
139
NIGEL EVANS HEAD OF LONDON RESIDENTIAL RESEARCH Copyright: LRR/EGi THIS PRESENTATION IS BASED ON DATA DERIVED FROM 3 OF LRR’S 2015 REPORTS. DOWNLOAD ALL 3 REPORTS HERE: http ://www.estatesgazette.com/egi-about/london-residential-market-analysis-2015 /
-
Upload
estatesgazettecom-rbi -
Category
Real Estate
-
view
126 -
download
1
Transcript of London Residential Breakfast Briefing 2015 | Estates Gazette

NIGEL EVANS HEAD OF LONDON RESIDENTIAL RESEARCH
Copyright: LRR/EGi
THIS PRESENTATION IS BASED ON DATA DERIVED FROM 3 OF LRR’S 2015 REPORTS.
DOWNLOAD ALL 3 REPORTS HERE:http://www.estatesgazette.com/egi-about/london-residential-market-analysis-2015/

Headlines from our latest reports:
• Construction Starts skyrocket
• More Towers in London than NY
• Where did all the social housing go?
• Were the commuted payments enough?
Where our data comes from
Copyright: LRR/EGi
DOWNLOAD ALL 3 REPORTS HERE:http://www.estatesgazette.com/egi-about/london-residential-market-analysis-2015/

DATA
Copyright: LRR/EGi

Where does it come from?The engine
Copyright: LRR/EGi
Methodology
Copyright: LRR/EGi

Trigger source:
Planning applications
Copyright: LRR/EGi

Was planning permission granted/refused/deferred?
• Deferred - we’ll get it next time• Refused - we’ll check for appeals• Granted - we’ll site visit it
*not just for Islington…
Copyright: LRR/EGi

City
Camden
Westminster
K&C
Islingt’n Hackney
Lambeth
City
Camden
Westminster
K&C
Islingt’n Hackney
Lambeth
All of LondonAll 33 Boroughs
No exceptionsNo arbitrary boundariesNo selected boroughs
All of itWe look at…

200,000 applications
1,000 committeesPer annum

Then we visit every single site with permission…
…as well as all those under construction

Site Visits
6 month cycle33 boroughs
4 questions…

Has it Started?
Has it Finished?
Is it being Marketed?
Has it Stalled?
Or perhaps more common these days

Have you sold it all off plan?

160 site visits per week

640 site visits per month

3,840 site visits per 6 month cycle

130 site visits per weekx
7,680 site visits per annum
1996All this to maintain a database of nearly
25,000 individual developments
updated daily since 19961996

Headlines

24,806Construction starts…the highest number of starts for over
PART 1

Copyright: LRR/EGi

Copyright: LRR/EGi

24,806Construction starts…the highest number of starts for over
Copyright: LRR/EGi

2DECADES
Copyright: LRR/Copyright:

To
we
r H
am
lets
So
uth
wa
rk
Wa
nd
sw
ort
h
Ha
mm
ers
mith
& F
ulh
am
We
stm
ins
ter
Ha
ck
ne
y
La
mb
eth
Ca
md
en
Islin
gto
n
Ke
ns
ing
ton
& C
he
lse
a
City
Ne
wh
am
Le
wis
ha
m
Gre
en
wic
h
Cro
yd
on
Bre
nt
Ba
rne
t
Hill
ing
do
n
Wa
ltha
m F
ore
st
Ea
ling
Ho
un
slo
w
Ha
rro
w
En
field
Ha
ve
rin
g
Su
tto
n
Ha
rin
ge
y
Ba
rkin
g &
Da
ge
nh
am
Bro
mle
y
Me
rto
n
Be
xle
y
Re
db
rid
ge
Ric
hm
on
d
Kin
gs
ton
0
500
1000
1500
2000
2500
3000
STARTS by Borough 2014
Copyright: LRR/EGi

innerTOP5

STARTSTOP 5 INNER BOROUGHS PRIVATE UNITS 2014 TOWER HAMLETS – 2,307
UNITS STARTED
SOUTHWARK – 2,188 UNITS STARTED
WANDSWORTH – 1,703 UNITS STARTED
HAMMERSMITH & FULHAM – 964 UNITS STARTED
WESTMINSTER – 942UNITS STARTED
Copyright: LRR/EGi

outer
5TOP more polarised

STARTSNEWHAM – 2,591 UNITS STARTED
LEWISHAM – 1,247 UNITS STARTED
GREENWICH– 1,187 UNITS STARTED
CROYDON – 1,179 UNITS STARTED
BRENT – 1,074 UNITS STARTED
TOP 5 OUTER BOROUGHS PRIVATE UNITS 2014
Copyright: LRR/EGi
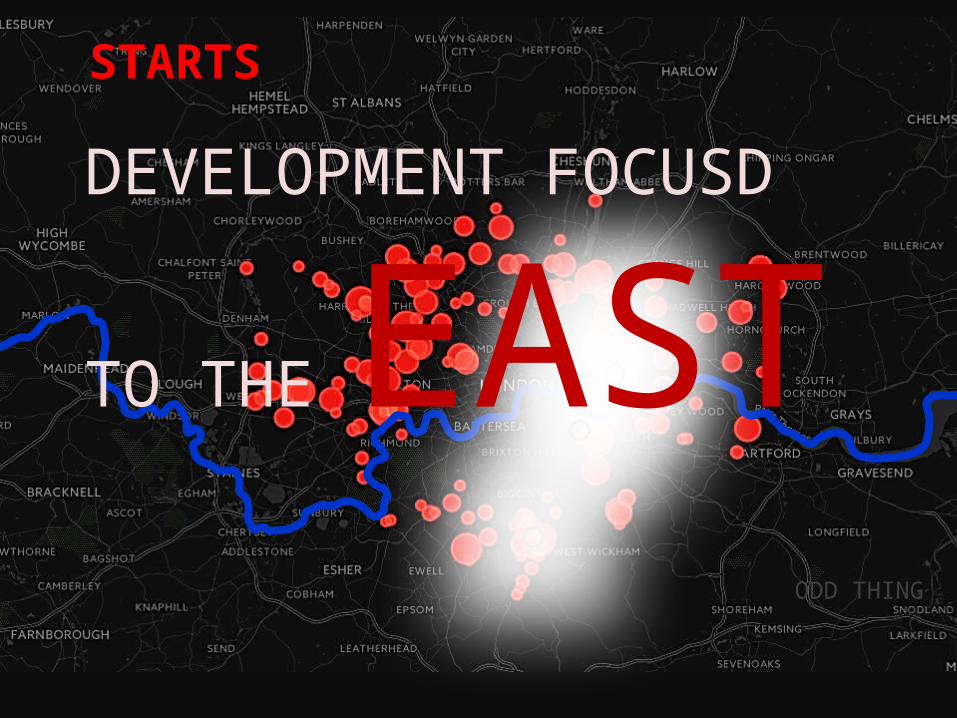
STARTS
DEVELOPMENT FOCUSD TO THE
EASTODD THING

ODD THING

Starts/under construction
up completions
down
…another look at our main table again
UP
DOWN**on what we expected
Copyright: LRR/EGi:

Copyright: LRR/EGi:

connection with UNITS under construction one year
Copyright: LRR/EGi:

and completions the next
Copyright: LRR/EGi:

on average 70% of units U/C one year complete the following one…until you get to
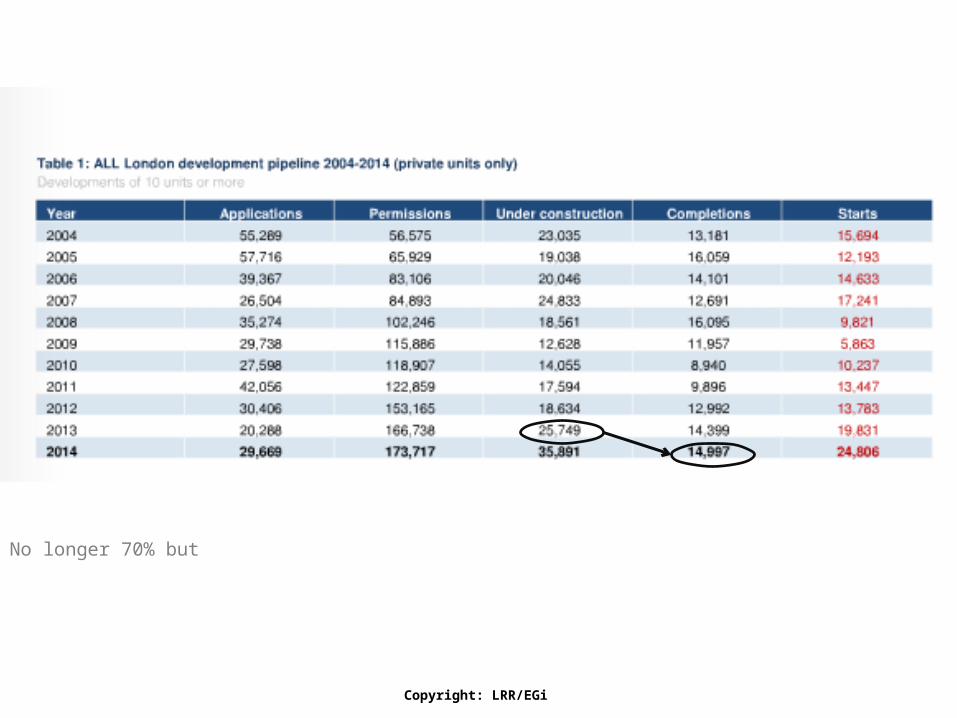
No longer 70% but
Copyright: LRR/EGi:

Only 58% of UNITS under construction in 2013 completed in 2014. 58%
Copyright: LRR/EGi:

despite 7,000 MORE UNITS U/C in 2013 compared to 2012
Copyright: LRR/EGi:

despite 7,000 MORE UNITS U/C in 2013 compared to 2012
18,634 units
25,749units
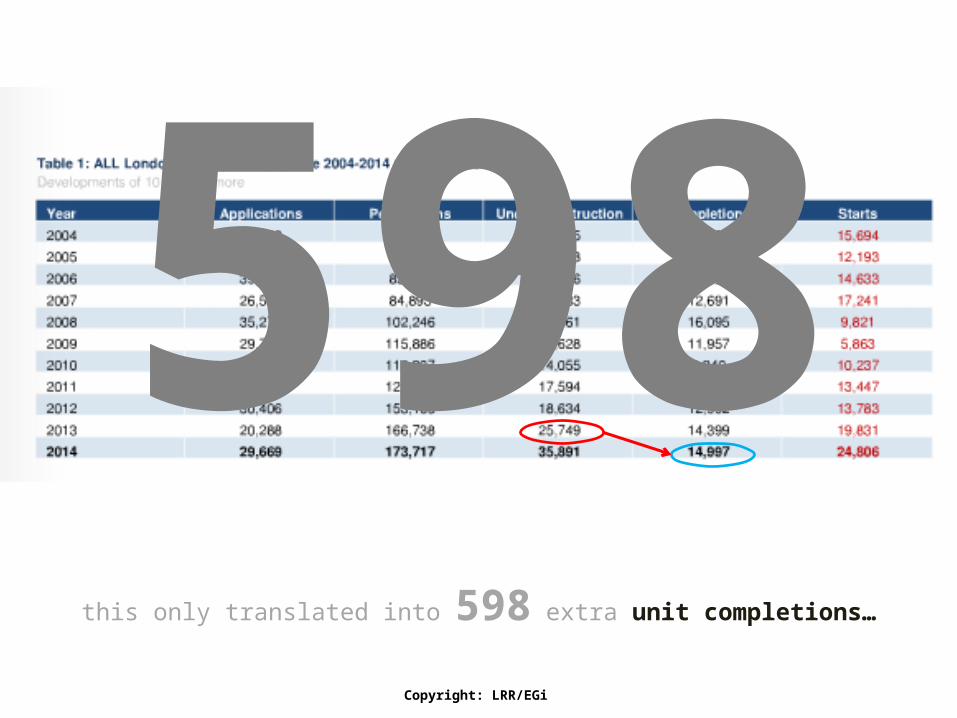
this only translated into 598 extra unit completions…
598Copyright: LRR/EGi:

Had we’d seen the normal 70% relationship
then we would have got a graph like this:
70%Copyright: LRR/EGi:
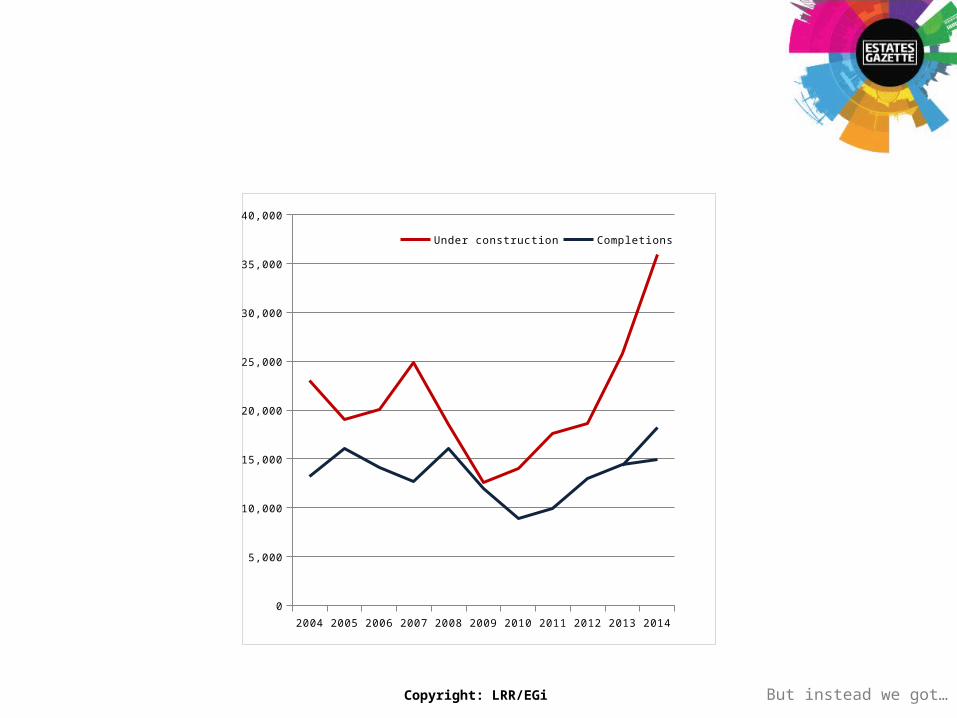
But instead we got…
2004 2005 2006 2007 2008 2009 2010 2011 2012 2013 2014
0
5,000
10,000
15,000
20,000
25,000
30,000
35,000
40,000
Under construction Completions
Copyright: LRR/EGi:

2004 2005 2006 2007 2008 2009 2010 2011 2012 2013 2014
0
5,000
10,000
15,000
20,000
25,000
30,000
35,000
40,000
Under construction Completions
Copyright: LRR/EGi:
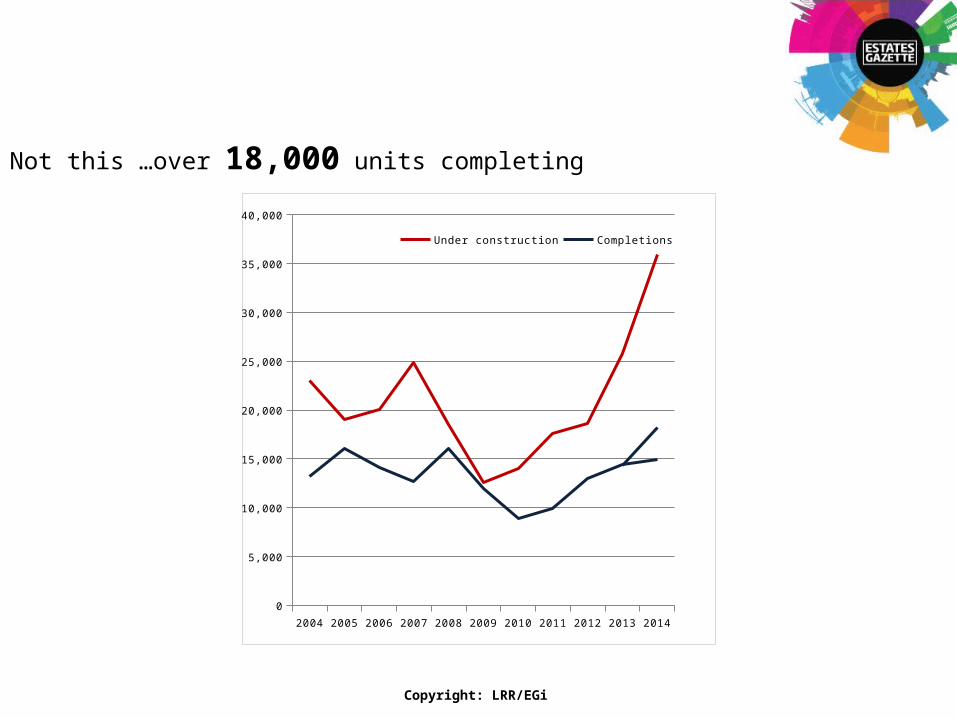
Not this …over 18,000 units completing
2004 2005 2006 2007 2008 2009 2010 2011 2012 2013 2014
0
5,000
10,000
15,000
20,000
25,000
30,000
35,000
40,000
Under construction Completions
Copyright: LRR/EGi:

But this… just under 15,000 units
2004 2005 2006 2007 2008 2009 2010 2011 2012 2013 2014
0
5,000
10,000
15,000
20,000
25,000
30,000
35,000
40,000
Under construction Completions
Copyright: LRR/EGi:

Not this
2004 2005 2006 2007 2008 2009 2010 2011 2012 2013 2014
0
5,000
10,000
15,000
20,000
25,000
30,000
35,000
40,000
Under construction Completions

But this
2004 2005 2006 2007 2008 2009 2010 2011 2012 2013 2014
0
5,000
10,000
15,000
20,000
25,000
30,000
35,000
40,000
Under construction Completions
Copyright: LRR/EGi:

What’s going on?

24,806Construction starts…the highest number of starts for over
PART 2

What’s going on is …
TOWERS
Tower starts since 2006…

2006 2007 2008 2009 2010 2011 2012 2013 20140
5
10
15
20
25
30
35
Tower Starts
20+ 30+ 40+ 50+
5 815
30
Copyright: LRR/EGi:

Where are they?

VNEBOA – Vauxhall6
The Elephant3
Stratford5
Copyright: LRR/EGi

NINE ELMS POINT28 & 37
VAUXHALL SKY GARDENS36
MERANO28
THE CORNICHE27 & 24
360 London44
South Village23
Eileen House44
CATALYST Copyright: LRR/EGi

NINE ELMS
VAUXHALL
WATERLOO
and may be a catalyst Copyright: LRR/EGi

171 BATTERSEA PK. RD:325 UNITS
BATTERSEA GARDENS:850 UNITS
THAMES WATER SITE:515 UNITS
46 PONTON ROAD:362 UNITS
TINTAGEL HOUSE:454 UNITS
TEXACO STATION:164UNITS
FLORIAN PLACE :275 UNITS
54 KENNINGTON RD:145 UNITS
374 WANDSWORTH RD:124 UNITS
BLORE CLOSE:20 UNITS
2 CORNELL SQUARE:9 UNITS
GAS WORKS SITE:500 UNITS
1 WORGAN STREET:13 UNITS
73 BLACK PRINCE RD:8 UNITS
123 W’MNST BRIDGE RD:5 UNITS
98 LOWER MARSH:34 UNITS
TEACHER CENTRE:17 UNITS
131 WATERLOO ROAD:6 UNITS
26 LOWER MARSH:6 UNITS
3 CARLISLE LANE:6 UNITS
THACKERY HOUSE:6 UNITS
POWER HOUSE:5 UNITS
BONNINGTON SQUARE:6UNITS
22 WYVIL ROAD:9 UNITS
1-30 DAVIDSON GDNS:12 UNITS
3-13 WILCOX ROAD:9 UNITS
438 WANDSWORTH RD:7 UNITS
3,100 units
Some withdrawn, refused, lapsed or master plans being formulated
Copyright: LRR/EGi

London was going to build
more towers than New York…?

JV New York YIMBY.
Last year they published a set of figures regarding the number of applications submitted during the course 2014 for residential towers, by their definition above 30 storeys.
LRR’s US counterparts


New York YIMBY.
Last year they published a set of figures regarding the number of applications submitted during the course 2014 for residential towers, by their definition above 30 storeys.
LRR’s US counterparts

51 applications for towers* in NY in 2014
*YIMBY definition of towers over 30 storeys
LRR definition over 20 storeys

In the same period London received 52applications for towers over 30 storeys
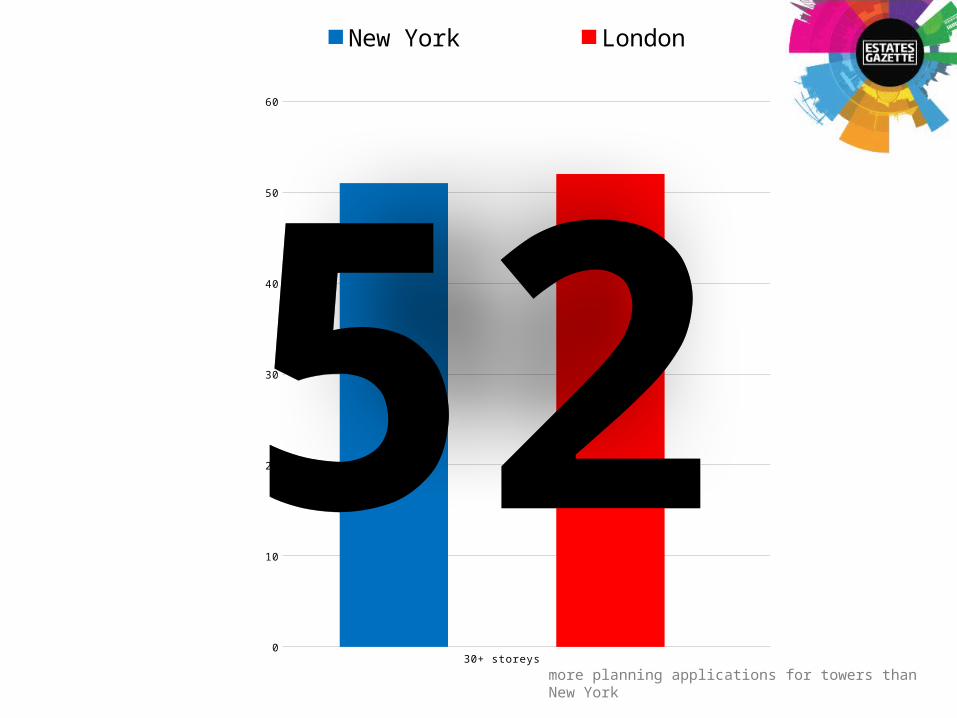
5230+ storeys 50+ storeys
0
10
20
30
40
50
60
New York London
more planning applications for towers than New York
52

Where are they?

Copyright: LRR/EGi

only a fraction of what’s in the pipeline

As well as those applications we can add…
157 permissions
Copyright: LRR/EGi

Copyright: LRR/EGi

and on top of those 17 possible sites
17 sites
Copyright: LRR/EGi

Copyright: LRR/EGi

possible future starts in the pipeline right now…and this is where they are
220Copyright: LRR/EGi

VNEBOA Elephant
Waterloo/Blackfriars
Stratford
But to really look to the future we must
we have to go back… back to where these towers started in the first place…
DOCKLANDS
Copyright: LRR/EGi
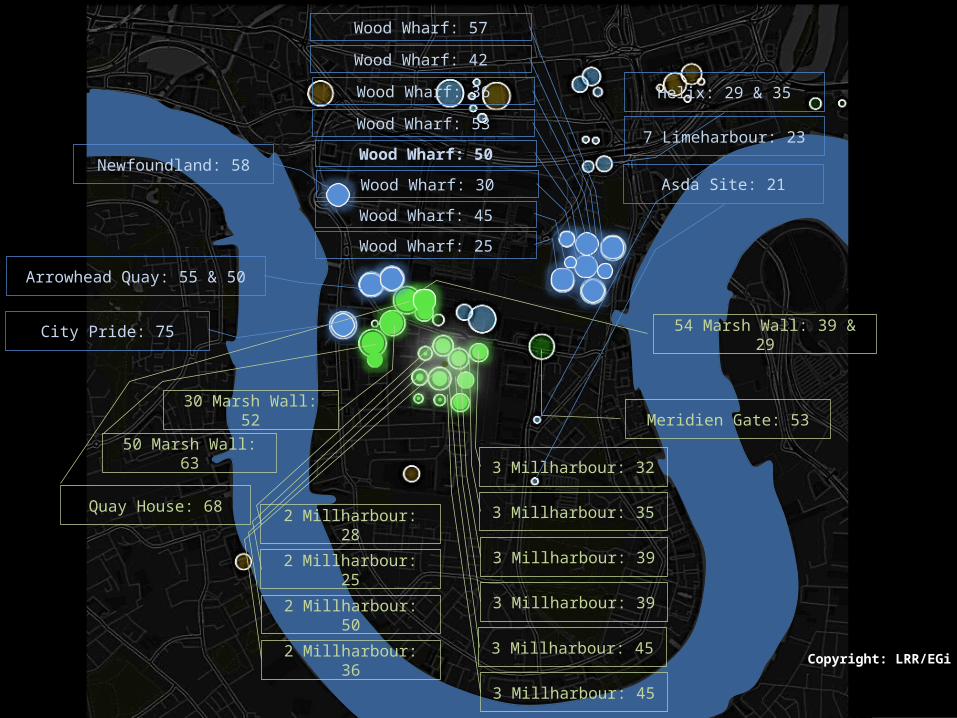
3 Millharbour: 32
54 Marsh Wall: 39 & 29
50 Marsh Wall: 63
30 Marsh Wall: 52
Quay House: 68
City Pride: 75
Arrowhead Quay: 55 & 50
Wood Wharf: 57
Wood Wharf: 42
Wood Wharf: 36
Wood Wharf: 53
Wood Wharf: 50
Wood Wharf: 30
Wood Wharf: 45
Wood Wharf: 25
3 Millharbour: 35
3 Millharbour: 39
3 Millharbour: 39
3 Millharbour: 45
3 Millharbour: 45
2 Millharbour: 28
2 Millharbour: 25
2 Millharbour: 50
2 Millharbour: 36
Meridien Gate: 53
Newfoundland: 58
Helix: 29 & 35
7 Limeharbour: 23
Asda Site: 21
Copyright: LRR/EGi

Why high?

0 5 10 15 20 25£900.00
£1,100.00
£1,300.00
£1,500.00
£1,700.00
£1,900.00
£2,100.00
Goodmans Fields
0 5 10 15 20 25 30 35 40 45 50£500.00
£600.00
£700.00
£800.00
£900.00
£1,000.00
£1,100.00
New Providence Tower
0 5 10 15 20 25 30 35£500.00
£600.00
£700.00
£800.00
£900.00
£1,000.00
£1,100.00
One The Elephant
4 9 14 19 24£900.00
£1,000.00
£1,100.00
£1,200.00
£1,300.00
£1,400.00
£1,500.00
£1,600.00The Eagle
Storeys Storeys
Storeys Storeys
£psq
ft
£psq
ft
£psq
ft
£psq
ft
UNITS UNITS
UNITSUNITS
Copyright: LRR/EGi

A note of caution
Copyright: LRR/EGi

In 2014 we saw
phenomenal increases in the number of construction
starts
Copyright: LRR/EGi

Was there a corresponding boost in the number of units sold?

No

The number of sales in
2013 totalled
12,700 units
Copyright: LRR/EGi

The number of sales in
2014 totalled
12,900 units
Copyright: LRR/EGi

a mere
1.6% increase.
Copyright: LRR/EGi

Some 800 more units remained un-sold and 7,000 more units remained un-launched at the end of 2014 compared to the end of 2013.
800
7,000Copyright: LRR/EGi

Causefor
Concern

Rapid and unprecedented rises
in the number of units being built…
Rapid unprecedented rises

without a corresponding spike in sales …

could be the precursor to oversupply and an
eventual drop in prices.

Not that we’re calling the top of the market…

Not that we’re calling the top of the market… not just yet.

24,806Construction starts…the highest number of starts for over
PART 3
Social Housing

Copyright: LRR/EGi

9,798Social Starts in 2014
Copyright: LRR/EGi

Social Housing STARTS by borough 2014
Alphabetically
Copyright: LRR/EGi
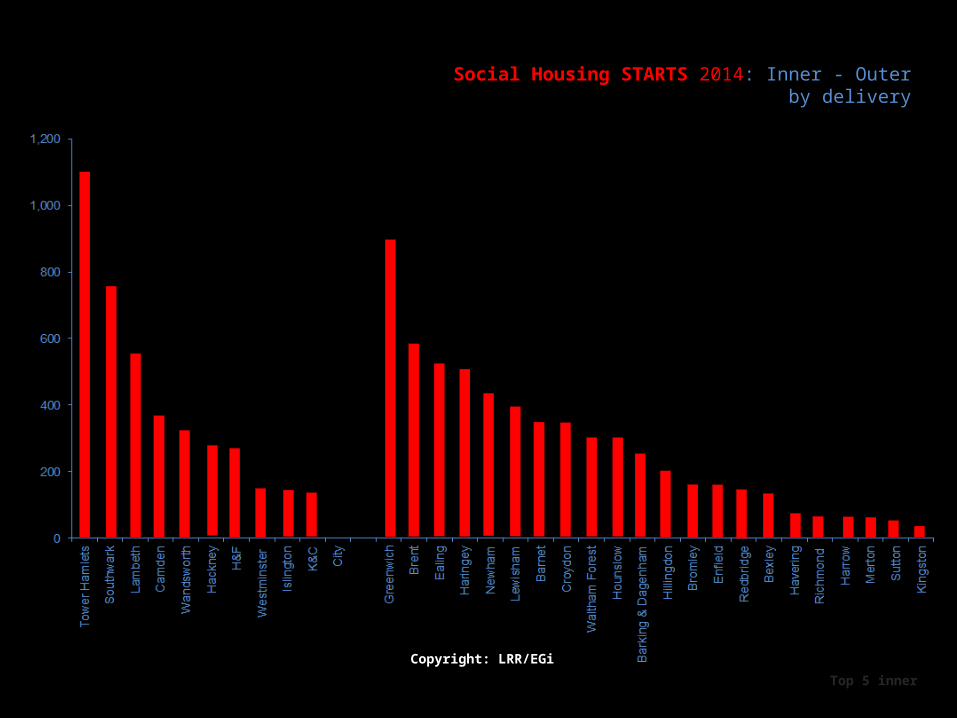
Top 5 inner
Social Housing STARTS 2014: Inner - Outer by delivery
Copyright: LRR/EGi

24,806Construction starts…the highest number of starts for over
LAMBETH – 544UNITS STARTED
SOUTHWARK – 743 UNITS STARTED
TOWER HAMLETS– 1,086 UNITS STARTED
CAMDEN – 359 UNITS STARTED
WANDSWORTH – 313 UNITS STARTED
Top 5 outer
TOP 5 BOROUGHS SOCIAL STARTS - INNER

24,806Construction starts…the highest number of starts for over
EALING – 510 UNITS STARTED
BRENT – 577 UNITS STARTED
GREENWICH – 809 UNITS STARTED
HARINGEY – 495 UNITS STARTED
NEWHAM – 425 UNITS STARTED
Compare private and social
TOP 5 BOROUGHS SOCIAL STARTS - OUTER
Copyright: LRR/EGi
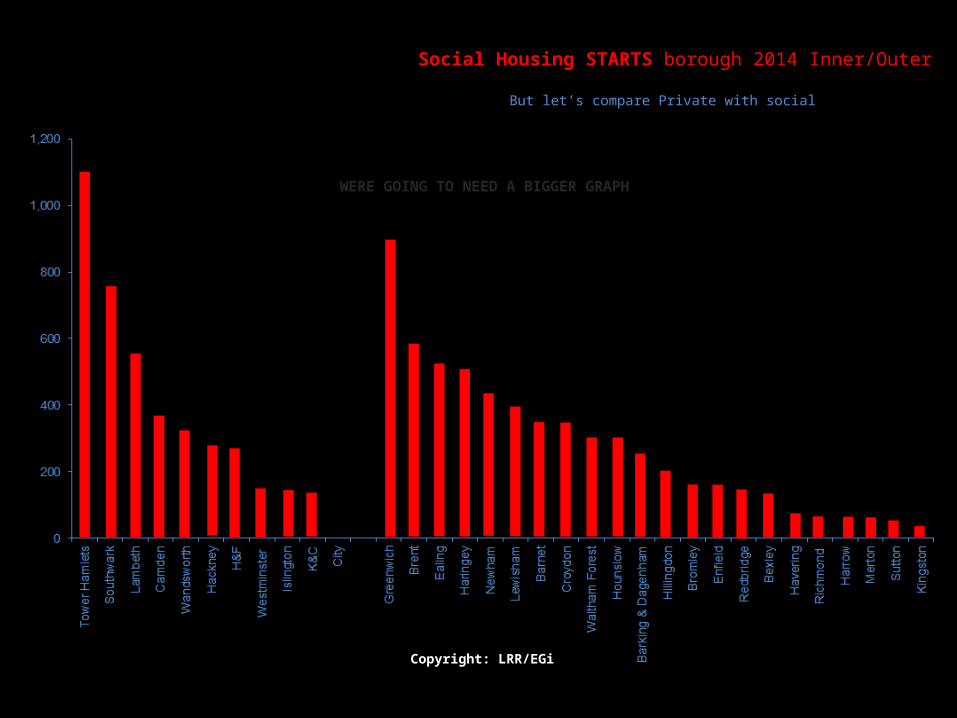
Social Housing STARTS borough 2014 Inner/Outer
But let’s compare Private with social
WERE GOING TO NEED A BIGGER GRAPH
Copyright: LRR/EGi

Construction starts…the highest number of starts for over
1,400
1,600
1,800
2,000
Social Housing AND PRIVATE STARTS borough 2014 Inner/Outer
Copyright: LRR/EGi

Copyright: LRR/EGi

24,806Construction starts…the highest number of starts for over
Copyright: LRR/EGi

2DECADES

Copyright: LRR/EGi

9,798Not such a magic number
Copyright: LRR/EGi

3YEARS

Private starts have shot up but social starts have remained roughly static
Stick this on a graph…
Copyright: LRR/EGi

24,806Construction starts…the highest number of starts for over
2004 2005 2006 2007 2008 2009 2010 2011 2012 2013 2014
0
5,000
10,000
15,000
20,000
25,000
30,000
a distinct symmetry.
PRIVATE STARTS
SOCIAL STARTS
PRIVATE V SOCIAL STARTS 2004-2014
Copyright: LRR/EGi
24,806Construction starts…the highest number of starts for over
2004 2005 2006 2007 2008 2009 2010 2011 2012 2013 2014
0
5,000
10,000
15,000
20,000
25,000
30,000
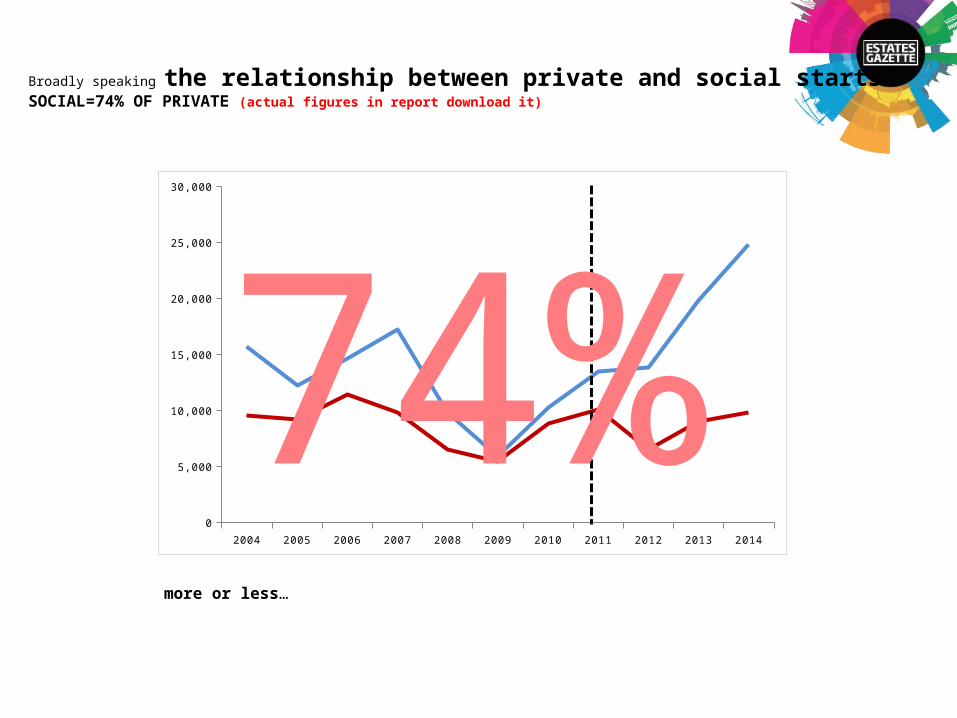
Broadly speaking the relationship between private and social starts SOCIAL=74% OF PRIVATE (actual figures in report download it)
74%more or less…
24,806Construction starts…the highest number of starts for over
2004 2005 2006 2007 2008 2009 2010 2011 2012 2013 2014
0
5,000
10,000
15,000
20,000
25,000
30,000
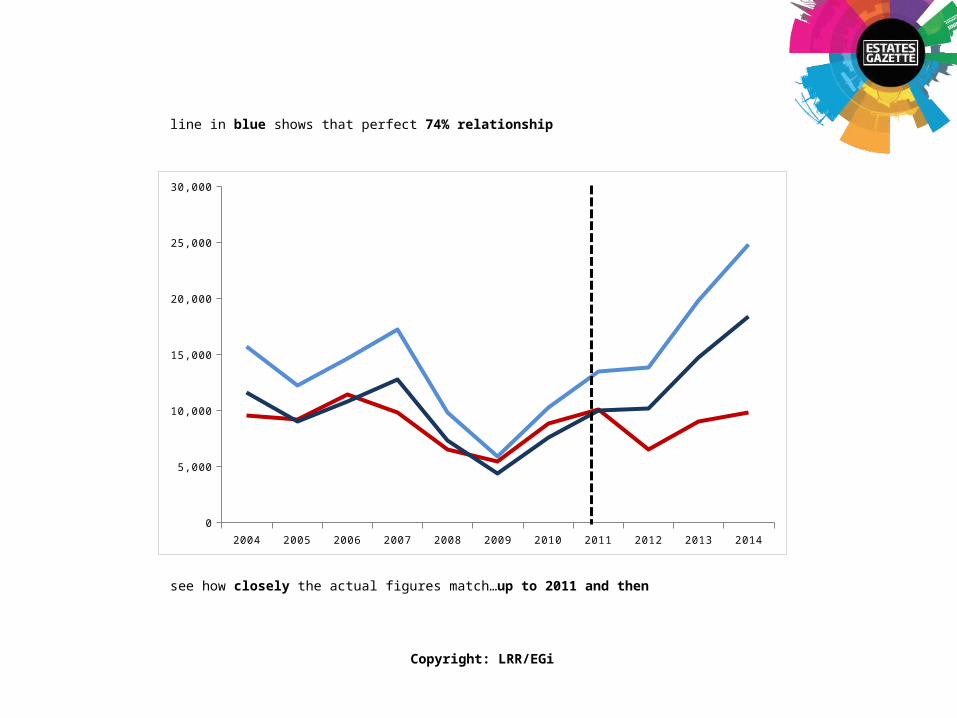
see how closely the actual figures match…up to 2011 and then
line in blue shows that perfect 74% relationship
Copyright: LRR/EGi
24,806Construction starts…the highest number of starts for over
2004 2005 2006 2007 2008 2009 2010 2011 2012 2013 2014
0
5,000
10,000
15,000
20,000
25,000
30,000
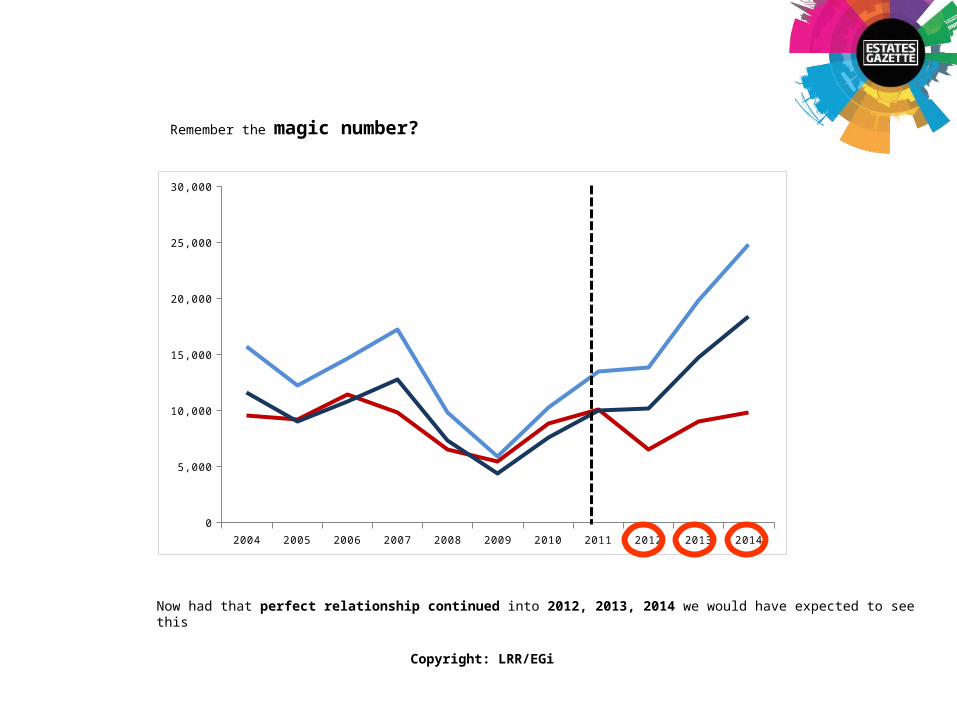
Now had that perfect relationship continued into 2012, 2013, 2014 we would have expected to see this
Remember the magic number?
Copyright: LRR/EGi

24,806Construction starts…the highest number of starts for over
2004 2005 2006 2007 2008 2009 2010 2011 2012 2013 2014
0
5,000
10,000
15,000
20,000
25,000
30,000
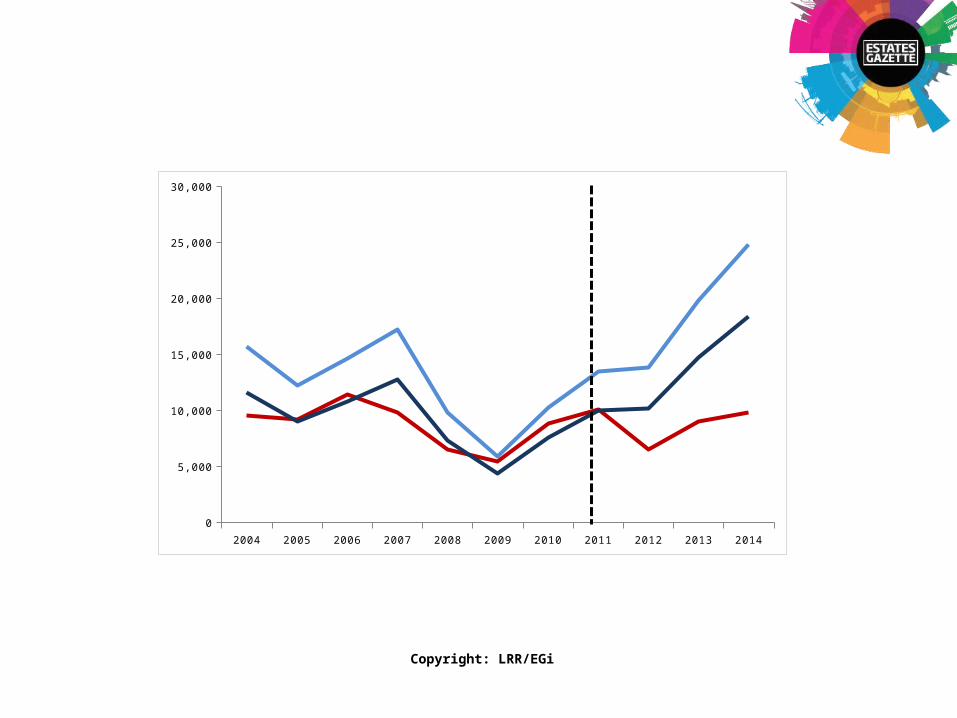
Just as social mirrored private starts in the past so it would in the future

24,806Construction starts…the highest number of starts for over
2004 2005 2006 2007 2008 2009 2010 2011 2012 2013 2014
0
5,000
10,000
15,000
20,000
25,000
30,000
But we didn’t get that…
Copyright: LRR/EGi

24,806Construction starts…the highest number of starts for over
2004 2005 2006 2007 2008 2009 2010 2011 2012 2013 2014
0
5,000
10,000
15,000
20,000
25,000
30,000
Copyright: LRR/EGi

24,806Construction starts…the highest number of starts for over
2004 2005 2006 2007 2008 2009 2010 2011 2012 2013 2014
0
5,000
10,000
15,000
20,000
25,000
30,000
Copyright: LRR/EGi
24,806Construction starts…the highest number of starts for over
2004 2005 2006 2007 2008 2009 2010 2011 2012 2013 2014
0
5,000
10,000
15,000
20,000
25,000
30,000
Copyright: LRR/EGi

24,806Construction starts…the highest number of starts for over
2004 2005 2006 2007 2008 2009 2010 2011 2012 2013 2014
0
5,000
10,000
15,000
20,000
25,000
30,000
Copyright: LRR/EGi

24,806Construction starts…the highest number of starts for over
2004 2005 2006 2007 2008 2009 2010 2011 2012 2013 2014
0
5,000
10,000
15,000
20,000
25,000
30,000
Copyright: LRR/EGi

24,806Construction starts…the highest number of starts for over
2004 2005 2006 2007 2008 2009 2010 2011 2012 2013 2014
0
5,000
10,000
15,000
20,000
25,000
30,000
on the graph represents a loss of nearly 18,000 units since 2011
18,000 shortfall in social units
Copyright: LRR/EGi

However, the provision of social housing can
take two forms.

the bricks on the ground failed? seriously stalled?
commuted payments in lieu of on/off-site provision?

S106

These are schemes that got permissions which included a payment in-lieu of social housing provision
2004 2005 2006 2007 2008 2009 2010 2011 2012 2013 2014
0
10
20
30
40
50
60
70
80
90
100
-
50,000,000
100,000,000
150,000,000
200,000,000
250,000,000
300,000,000
S106 payments v PPG with S106 conditions 2004-2010 Developments of 10 units or more
Number of schemes S106 payments (£)
S106 PAYMENTS
SCHEMES with S106
Copyright: LRR/EGi

Only 70 developments contained an S106 payment in lieu for this entire period
2004 2005 2006 2007 2008 2009 2010 2011 2012 2013 2014
0
10
20
30
40
50
60
70
80
90
100
-
50,000,000
100,000,000
150,000,000
200,000,000
250,000,000
300,000,000
S106 payments v PPG with S106 conditions 2004-2010 Developments of 10 units or more
Number of schemes S106 payments (£)
S106 PAYMENTS
SCHEMES with S106
Then after 2010…a seismic shift in the number of S106 payments coupled with an increase in schemes.
Copyright: LRR/EGi

2004 2005 2006 2007 2008 2009 2010 2011 2012 2013 2014
0
10
20
30
40
50
60
70
80
90
100
-
50,000,000
100,000,000
150,000,000
200,000,000
250,000,000
300,000,000
S106 payments v PPG with S106 conditions 2004-2010 Developments of 10 units or more
Number of schemes S106 payments (£)
S106 PAYMENTS
SCHEMES with S106
70 payments in lieu
239 payments in lieu
How does that translate to cash?Copyright: LRR/EGi

2004 2005 2006 2007 2008 2009 2010 2011 2012 2013 20140
5,000
10,000
15,000
20,000
25,000
30,000
£184m
£86m
£192m
2011:
2012:
2013:
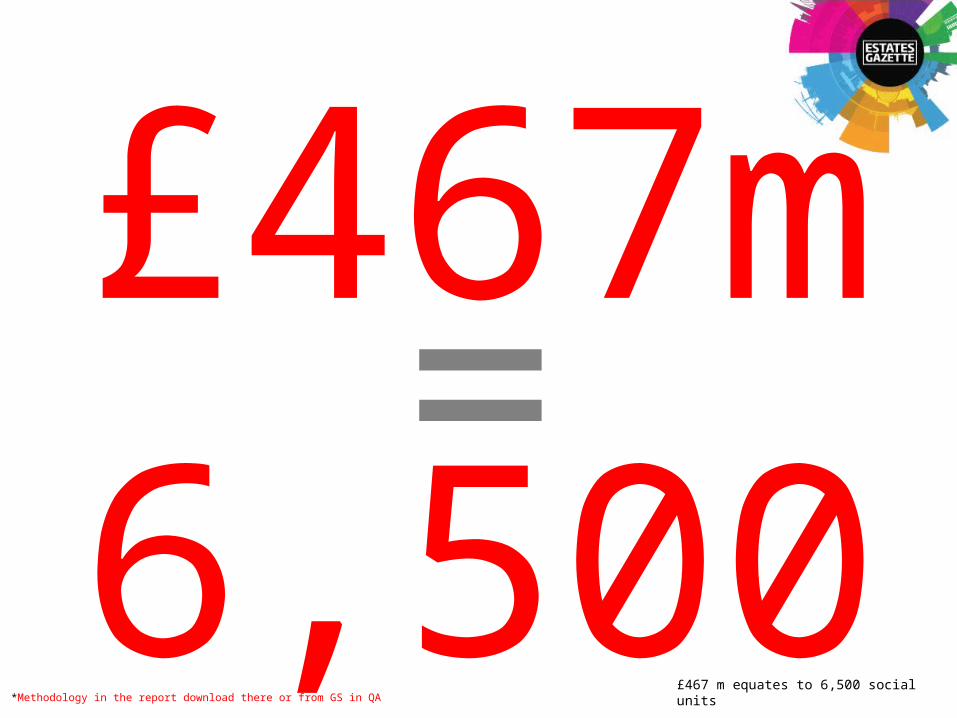
£467mCopyright: LRR/EGi

A huge increase in payments nearly £467m since 2011. So although the level of physical provision has gone down the level of cash in lieu payments has gone up….
£467m since 2011PHYSICAL PROVISION££PAYMENT IN LIEU££
Copyright: LRR/EGi

So the question we have to ask now is…

Were the payments enough?

24,806Construction starts…the highest number of starts for over
Can we build 18,000 social units with £467 m?
2004 2005 2006 2007 2008 2009 2010 2011 2012 2013 20140
5,000
10,000
15,000
20,000
25,000
30,000
18,000 shortfall in social units
£467mCopyright: LRR/EGi

Lets go back to the graph…
NO
=
Lets go back to the graph…
6,500*£467m
£467 m equates to 6,500 social units*Methodology in the report download there or from GS in QA
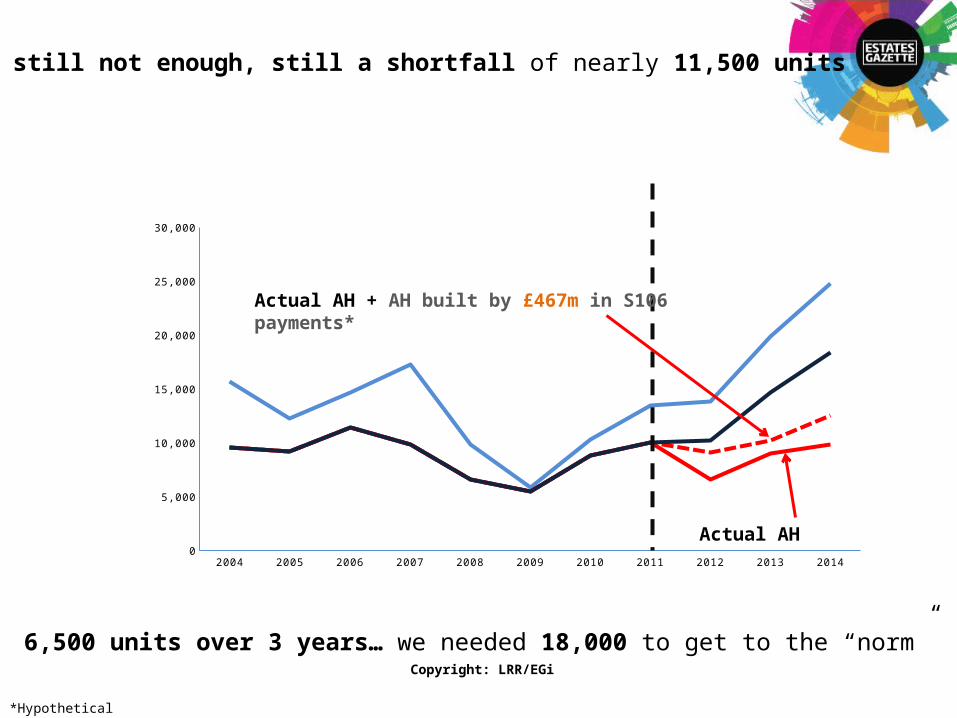
still not enough, still a shortfall of nearly 11,500 units
2004 2005 2006 2007 2008 2009 2010 2011 2012 2013 20140
5,000
10,000
15,000
20,000
25,000
30,000
Actual AH
Actual AH + AH built by £467m in S106 payments*
*Hypothetical
6,500 units over 3 years… we needed 18,000 to get to the “norm”Copyright: LRR/EGi

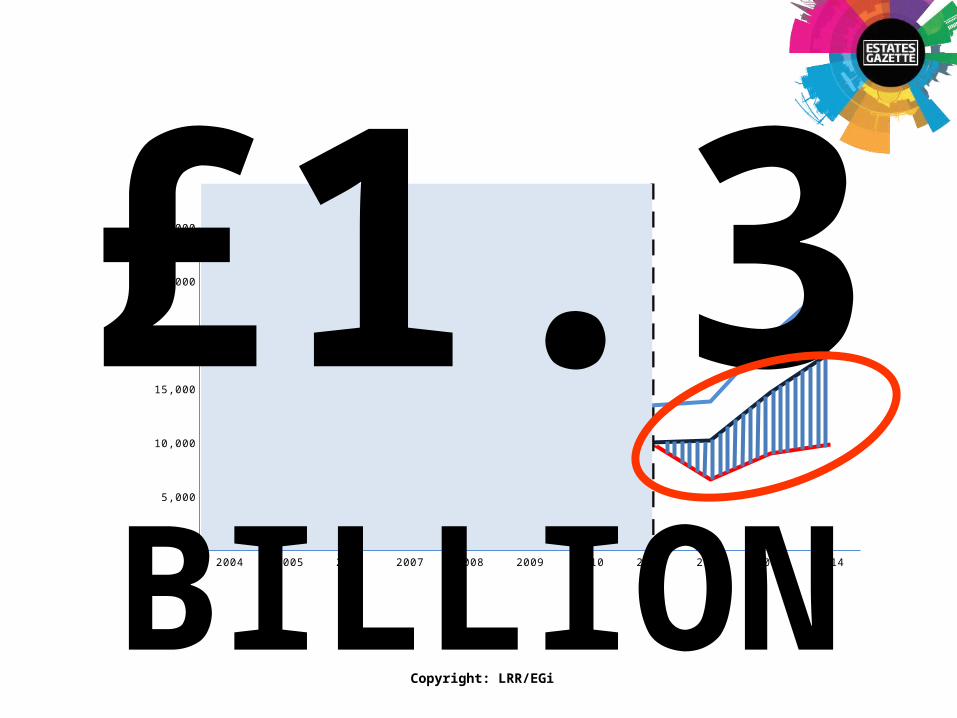
So if nearly £467m didn’t make up the shortfall – what amount would have?By our calculations…..
£467m
24,806Construction starts…the highest number of starts for over
2004 2005 2006 2007 2008 2009 2010 2011 2012 2013 20140
5,000
10,000
15,000
20,000
25,000
30,000£1.3BILLION
Copyright: LRR/EGi

Would be…
LONDON
Sites, withdrawn, refused, lapsed all were thought to have potential once…and they could have again
Used to take a lot of work to extract the dataand map it
But a new service by Egi makes finding these sites simple
It’s called Site Finder and it does just that
Follow this link: http://estatesgazette.com/site-finder
Or call Ken Norton on 0207 911 1785

NIGEL EVANS HEAD OF LONDON RESIDENTIAL RESEARCH
THIS PRESENTATION IS BASED ON DATA DERIVED FROM 3 OF LRR’S 2015 REPORTS.
DOWNLOAD ALL 3 REPORTS HERE:http://www.estatesgazette.com/egi-about/london-residential-market-analysis-2015/