London Health and Care Leaders Forum 11th March 2014 Payment Innovation Break-out 1.
33
London Health and Care Leaders Forum 11th March 2014 Payment Innovation Break-out 1
-
Upload
dashawn-brayshaw -
Category
Documents
-
view
213 -
download
0
Transcript of London Health and Care Leaders Forum 11th March 2014 Payment Innovation Break-out 1.
London Health and Care Leaders Forum 11th March 2014
Payment Innovation Break-out
1
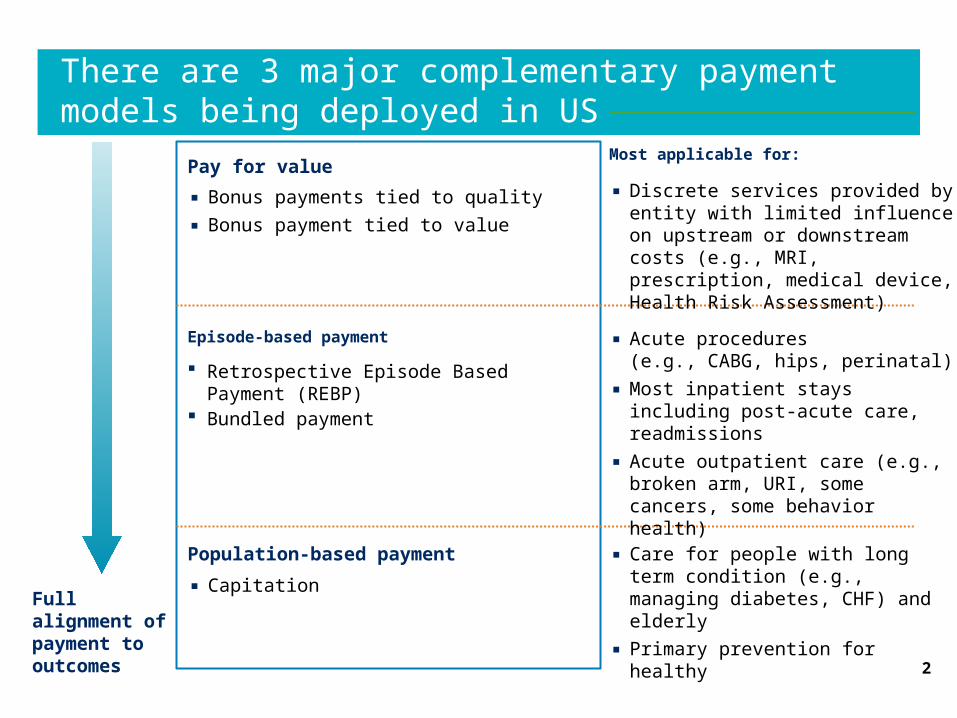
There are 3 major complementary payment models being deployed in US
2
Full alignment of payment to outcomes
Most applicable for:
Episode-based payment
Retrospective Episode Based Payment (REBP)
Bundled payment
Pay for value
▪ Bonus payments tied to quality
▪ Bonus payment tied to value
Population-based payment
▪ Capitation
▪ Care for people with long term condition (e.g., managing diabetes, CHF) and elderly
▪ Primary prevention for healthy
▪ Acute procedures (e.g., CABG, hips, perinatal)
▪ Most inpatient stays including post-acute care, readmissions
▪ Acute outpatient care (e.g., broken arm, URI, some cancers, some behavior health)
▪ Discrete services provided by entity with limited influence on upstream or downstream costs (e.g., MRI, prescription, medical device, Health Risk Assessment)
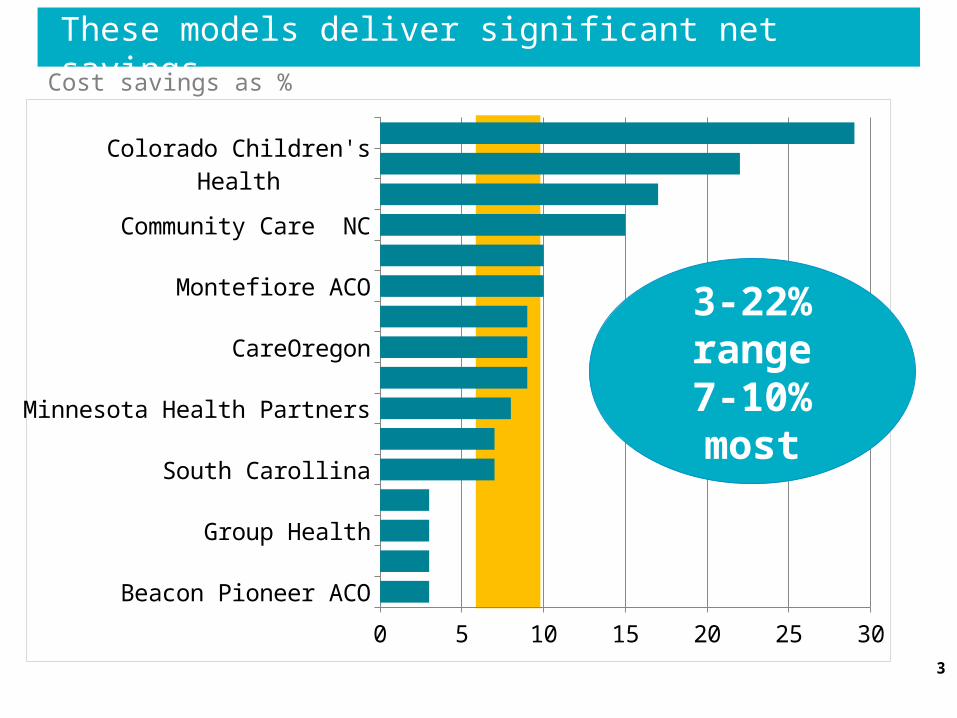
These models deliver significant net savings
3
Beacon Pioneer ACOCare First PCMH
Group HealthBCBSMA AQCSouth Carollina
Geisinger PCMHMinnesota Health Partners
BCBSM MichiganCareOregon
Sacramento ACOMontefiore ACO
Oklahoma MedicaidCommunity Care NCFlorida Capital Health
Colorado Children's HealthNY Care Coordination Program
0 5 10 15 20 25 30
3-22% range
7-10% most
Сost savings as %

Speakers
4
• Dr. Philip Ozuah
• John Wardell
• Ric Marshall
Payment Innovation
Philip O. Ozuah, MD, PhDChief Operating Officer
Montefiore Health System
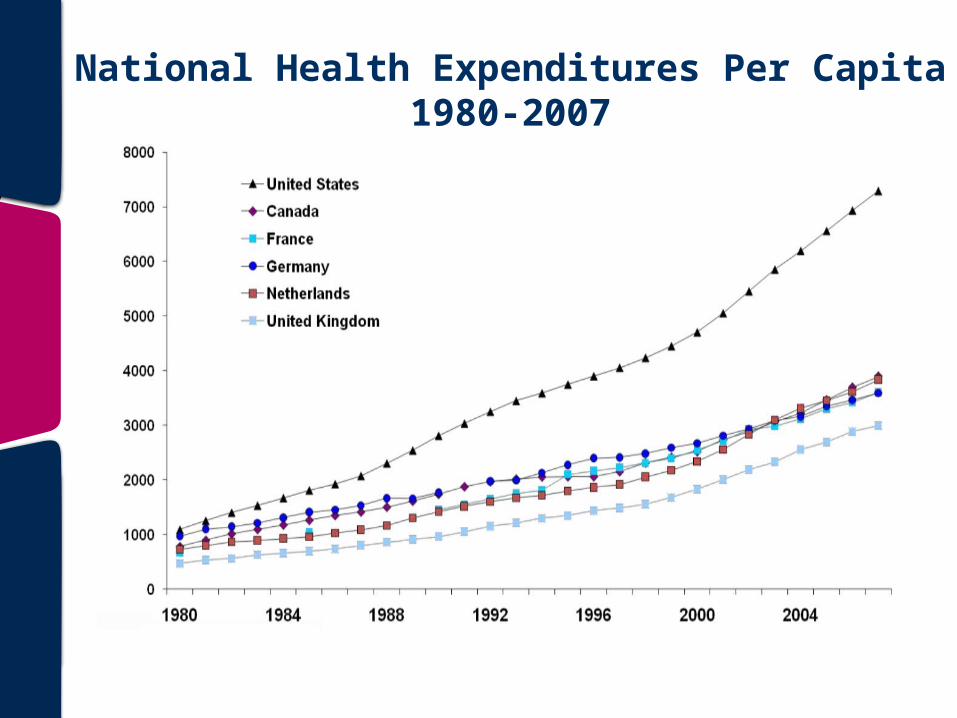
National Health Expenditures Per Capita1980-2007
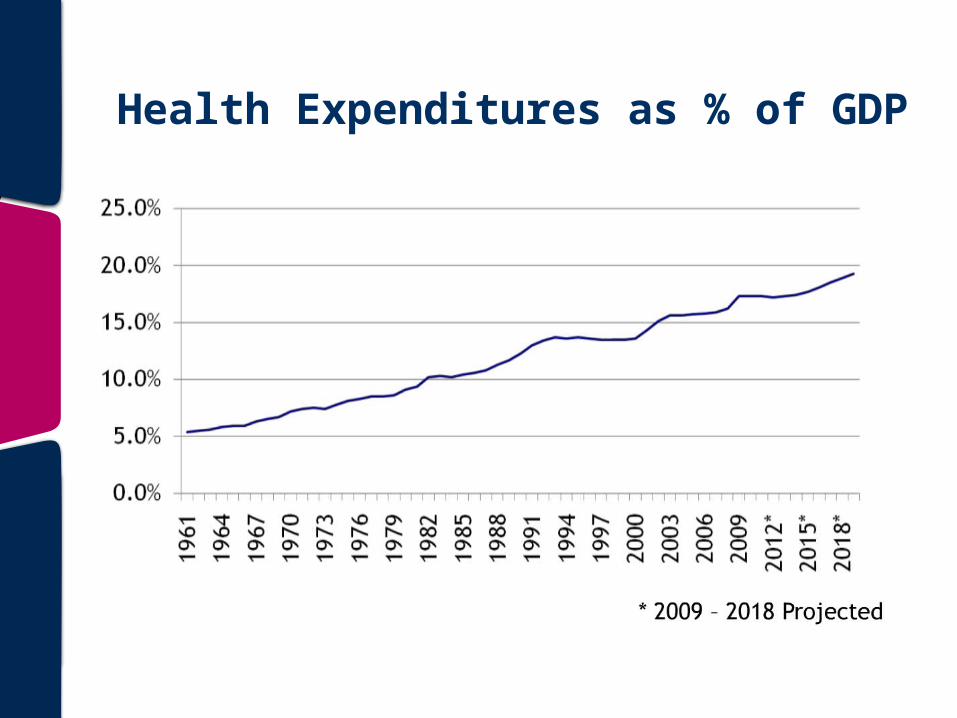
Health Expenditures as % of GDP
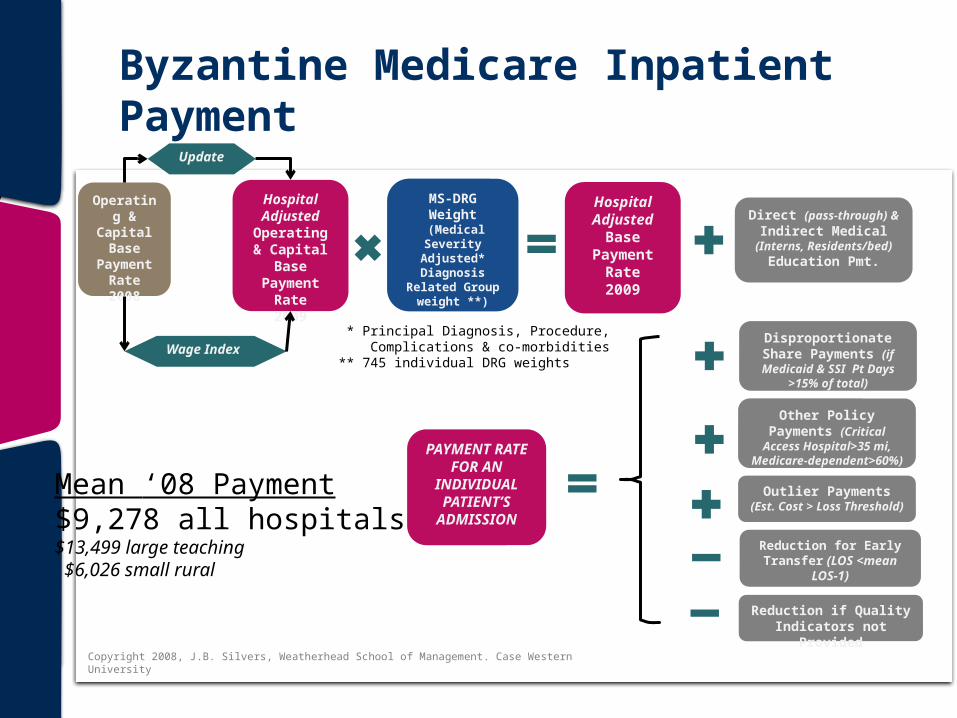
Byzantine Medicare Inpatient Payment
Hospital Adjusted
Operating & Capital Base
Payment Rate2009
Operating & Capital
Base Payment
Rate2008
Update
Wage Index
MS-DRG Weight
(Medical Severity
Adjusted* Diagnosis
Related Group weight **)
Hospital Adjusted
Base Payment
Rate2009
* Principal Diagnosis, Procedure, Complications & co-morbidities** 745 individual DRG weights
Direct (pass-through) & Indirect Medical
(Interns, Residents/bed) Education Pmt.
Disproportionate Share Payments (if Medicaid &
SSI Pt Days >15% of total)
Other Policy Payments (Critical Access
Hospital>35 mi, Medicare-dependent>60%)
Outlier Payments (Est. Cost > Loss Threshold)
Reduction for Early Transfer (LOS <mean
LOS-1)
Reduction if Quality Indicators not Provided
PAYMENT RATE FOR AN INDIVIDUALPATIENT’S
ADMISSION
Mean ‘08 Payment$9,278 all hospitals$13,499 large teaching $6,026 small rural
Copyright 2008, J.B. Silvers, Weatherhead School of Management. Case Western University

Complicated Medicare Physician Payment
Limitation
Adjusted for geographical cost factors
Conversion Factor2009
Conversion Factor2008
Update
Relative Value Units (RVU)* -work -practice expense -malpractice expense
Physician Payment Rates by
procedure2009
* Determined for 10,000 proceduresas defined by Healthcare Common Procedure Coding System (HCPCS)
UPDATE ADJUSTMENT FACTOR (UAF)
SUSTAINABLE GROWTH RATE (SGR)
Growth rate that reflects inflation, enrollment, real GDP per capita and policy changes
Change required to recoup (or pay extra) the cumulative difference between actual changesand max allowable under SGR (=< 7%)
Copyright 2008, J.B. Silvers, Weatherhead School of Management. Case Western University
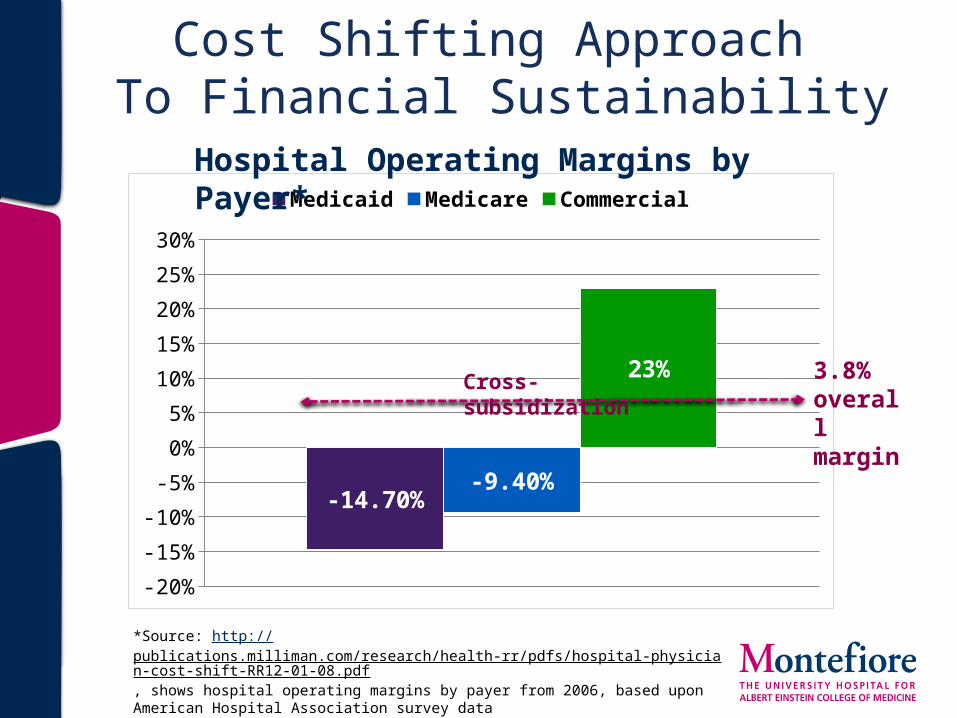
Cost Shifting Approach To Financial Sustainability
*Source: http://publications.milliman.com/research/health-rr/pdfs/hospital-physician-cost-shift-RR12-01-08.pdf, shows hospital operating margins by payer from 2006, based upon American Hospital Association survey data
-20%
-15%
-10%
-5%
0%
5%
10%
15%
20%
25%
30%
-14.70%-9.40%
23%
Medicaid Medicare CommercialHospital Operating Margins by Payer*
3.8% overall margin
Cross-subsidization

Alternative to Cost Shifting
-20%
-15%
-10%
-5%
0%
5%
10%
15%
20%
25%
-14.70%
-9.40%
23%
Medicaid Medicare Commercial
Focus on efficiency and rooting out waste to improve operating margins
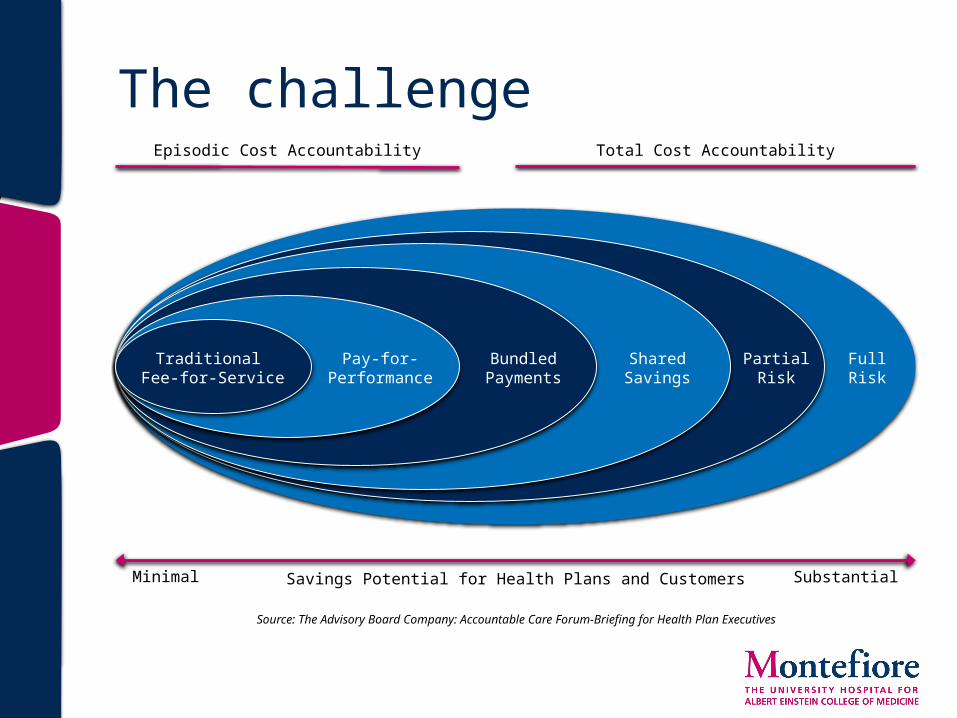
The challenge
Traditional Fee-for-Service
Pay-for-Performance
BundledPayments
SharedSavings
PartialRisk
FullRisk
Episodic Cost Accountability Total Cost Accountability
Minimal SubstantialSavings Potential for Health Plans and Customers
Source: The Advisory Board Company: Accountable Care Forum-Briefing for Health Plan Executives

Montefiore’s model is evolving…
From To
Fee-for-service Risk & shared savings
One market Multiple markets
Scale for volume Scale for covered lives
Centralized Networked
Owned entities Partnerships
More employed MDs More voluntary MDs
Evolving model…

This is payment and delivery
system reform
London Health and Care Leaders Forum 14th March 2014John WardellDeputy Chief OfficerTower Hamlets Clinical Commissioning Group
15
16
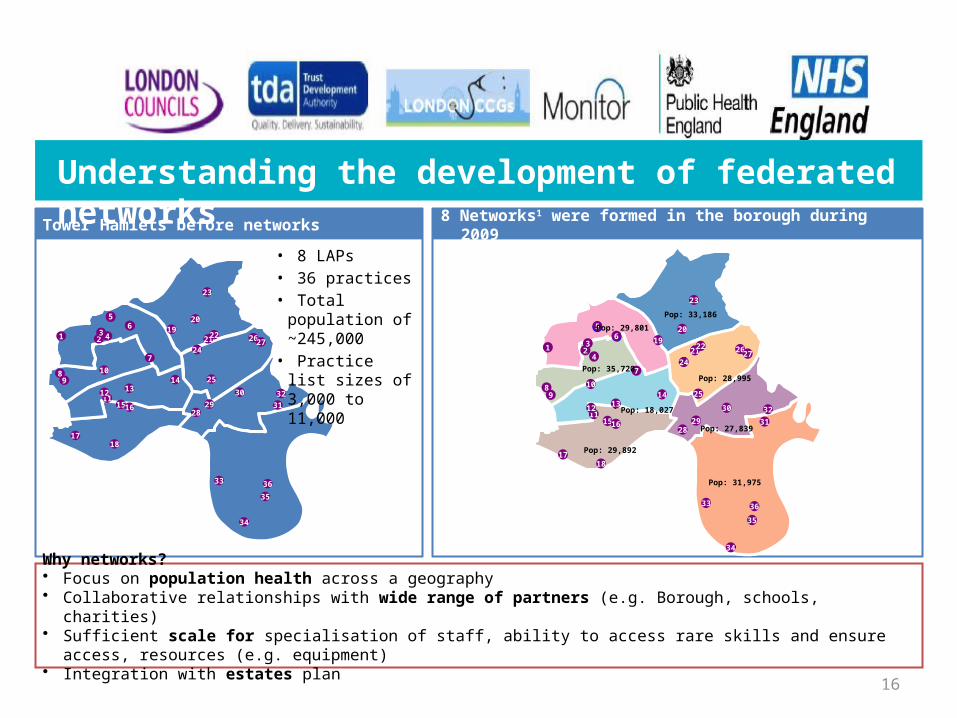
Tower Hamlets before networks 8 Networks1 were formed in the borough during 2009
Why networks?• Focus on population health across a geography• Collaborative relationships with wide range of partners (e.g. Borough, schools, charities)• Sufficient scale for specialisation of staff, ability to access rare skills and ensure access, resources (e.g. equipment)• Integration with estates plan
Understanding the development of federated networks
65
1 23 4
56
89
10
7
1112
15
13
16
14
1718
19
242122
20
23
25
2627
2829
30
3132
33
34
35
36
65
1 23
4
56
89
10
7
1112
15
13
16
14
1718
19
242122
20
23
25
2627
2829
30
31
32
Pop: 29,892
Pop: 18,027
Pop: 29,801
Pop: 35,720Pop: 28,995
Pop: 33,186
Pop: 27,839
Pop: 31,975
33
34
35
36
• 8 LAPs• 36 practices• Total population
of ~245,000• Practice list sizes
of 3,000 to 11,000
17
Case for change…• Wide variation in clinical practice and outcomes for diabetes
patients• Economies of scale • Poor uptake of diabetes education and retinal screening• Need to do things differently • The right people to do the right tasks at the right time• Specialist support • Transparency of data• Putting the patient at the centre of their care

18
How did it work…Care packages are: Networks:
• Focus on population health across a defined area
• Have collaborative relationships with a wide range of partners (e.g. Borough, Schools, Charities)
• Provide sufficient scale for:– Specialisation of staff– Ability to access rare skills– Resources (e.g. equipment)– Ability to ensure access
• Integrate with estates plan
Organisational development Information and technology
What supports it all?
Payment Model Contracted at network level 70% upfront and 30% on performance
• Reducing variability through the use of evidence based pathways
• Ensuring the right people to do the right tasks at the right time
• Enabling transparency of data at individual patient, clinician, practice, and network level
• Facilitating an integrated and coherent approach
• Costing of care packages
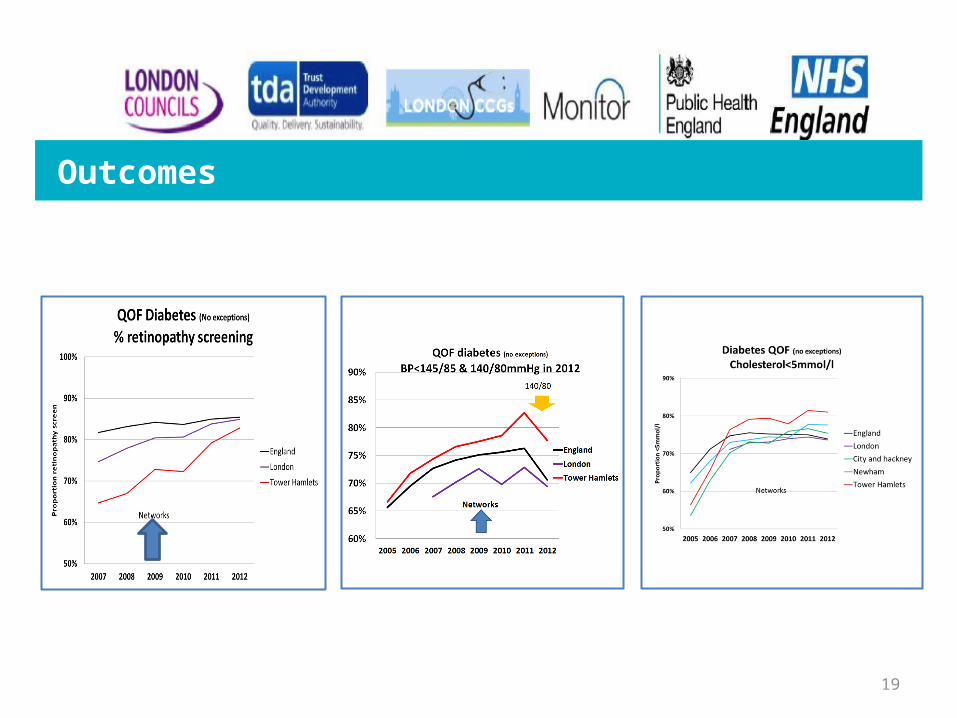
19
Outcomes

Improving MMR vaccination rates: herd immunity is a realistic goal. Cockman P, Dawson L, Mathur R, Hull S, BMJ2011;343doi: 10.1136/bmj.d5703
MMR Immunisation 2006-10
Maintaining MMR improvement
20
21
• Good clinical leadership and engagement of specialists• Emphasis on quality of care and outcomes for patients• Contracting and paying for outcomes• Organisational development • IT and information sharing• Presentation of the right data regularly• Geographical network boundaries (not based on historical
practice relationships with one another)
Critical success factors

Behaviour change
Guideline Education IncentivesComparative
Feedback
Practice networks
Belief Act Motivate
Organisation changeIT
Equity audit
IT Dash-board
IT Review & recall
IT Prompts & Decision support
22

23
Integration Going Forward

24
Forward Plan
2015/16 and 16/17 shadow capitation
2014/15 and 15/16 local provider consortia
Current state and14/15
2016/17fully capitated
Enablers for end state
Payor/provider configuration
Local CCGs provider consortia for all IC services
Local CCGs provider consortia for all IC services
Local CCGs provider consortia for all IC services
Local CCGs provider consortia for all IC services
Reimbursement model Capitated modelPay for performance modelPay for performance modelPay for performance model
Service configuration
Services contracted through consortia
Services contracted through consortia
Services contracted through consortia
Services contracted individually
Health and social care
Pooled social and health fundingJoint working agreedJoint working agreedSeparate social and health
funding
Outcome linked reward/risk
Provides control/sharefull risk for activity andoutcomes
Providers share more risk for activity and outcomes
Providers share more risk for activity and outcomes
Commissioners bear risk for activity and outcomes
Might need to break PbRfor target population
Indicative individual budgets with shadow capitation model
Indicative individual budgets
Agreement on reimbursement models to be implemented
25
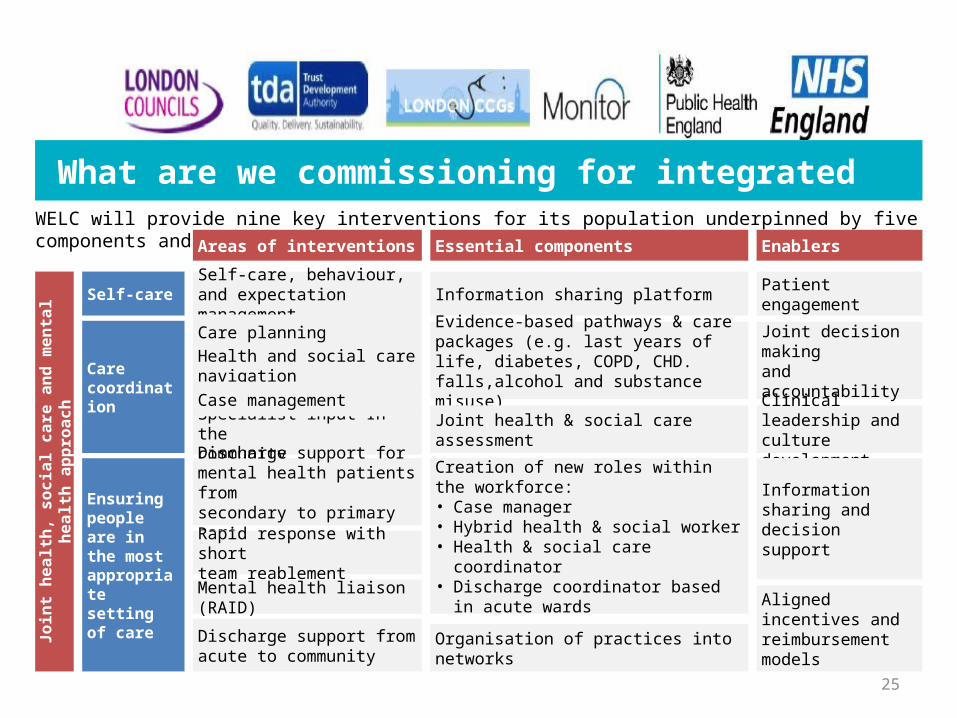
What are we commissioning for integrated care WELC will provide nine key interventions for its population underpinned by five components and enablers
Health and social carenavigation
Self-care, behaviour,and expectation management
Care planning
Specialist input In thecommunity
Discharge support from acute to community
Discharge support formental health patients fromsecondary to primary care
Rapid response with shortteam reablement
Mental health liaison (RAID)
Areas of interventions Essential components
Information sharing platform
Evidence-based pathways & care packages (e.g. last years of life, diabetes, COPD, CHD. falls,alcohol and substance misuse)
Joint health & social careassessment
Creation of new roles withinthe workforce:• Case manager• Hybrid health & social worker• Health & social care coordinator• Discharge coordinator based in acute
wards
Organisation of practices into networks
Enablers
Patient engagement
Joint decision makingand accountability
Clinical leadership andculture development
Information sharing anddecision support
Aligned incentives andreimbursement models
Care coordination
Ensuring people are in the most appropriate setting of care
Self-care
Join
t hea
lth, s
ocia
l car
e an
d m
enta
l hea
lth a
ppro
ach
Case management

26
Contracting approach – Standard NHS Contracts
CCG
Mental Health Liasion (RAID)
Discharge ManagementRapid response Social servicesCare Co-
ordination
Integration function delivered collectively by all providers in collaboration
Generic schedule
for all
Provider specific schedules Provider specific schedules
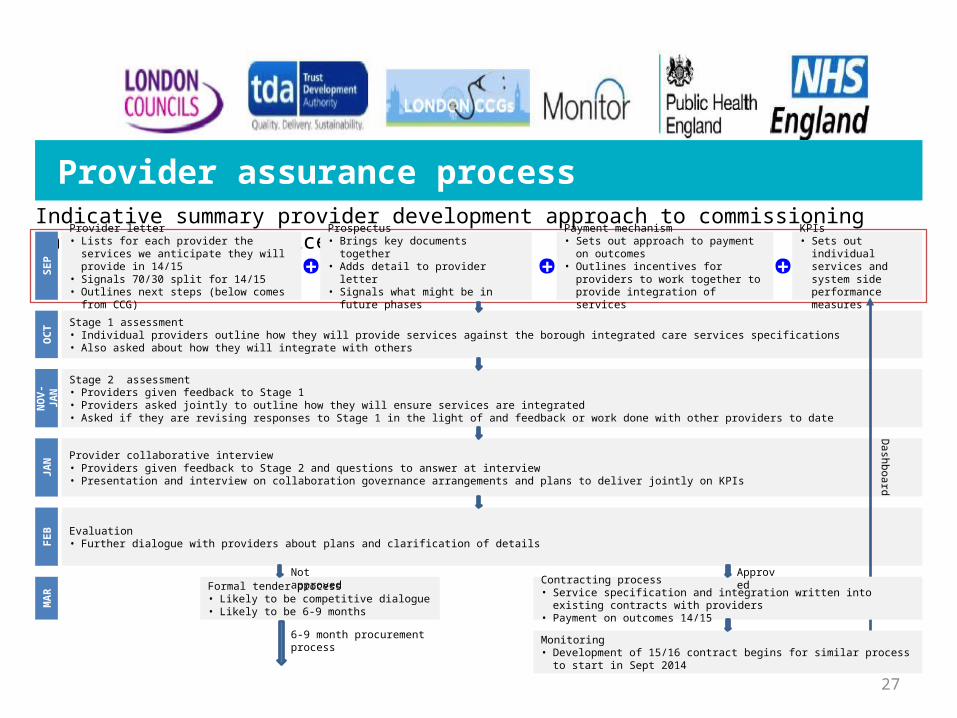
Provider assurance processIndicative summary provider development approach to commissioning integrated care services
Prospectus• Brings key documents together• Adds detail to provider letter• Signals what might be in future phases
Payment mechanism• Sets out approach to payment on outcomes• Outlines incentives for providers to work
together to provide integration of services
Provider letter• Lists for each provider the services we anticipate
they will provide in 14/15• Signals 70/30 split for 14/15 • Outlines next steps (below comes from CCG)
KPIs• Sets out individual
services and system side performance measures
SEP + + +
6-9 month procurement process
Stage 1 assessment• Individual providers outline how they will provide services against the borough integrated care services specifications• Also asked about how they will integrate with others
OCT
Stage 2 assessment• Providers given feedback to Stage 1• Providers asked jointly to outline how they will ensure services are integrated• Asked if they are revising responses to Stage 1 in the light of and feedback or work done with other providers to dateN
OV-
JAN
Provider collaborative interview• Providers given feedback to Stage 2 and questions to answer at interview• Presentation and interview on collaboration governance arrangements and plans to deliver jointly on KPIs
JAN
Evaluation• Further dialogue with providers about plans and clarification of detailsFE
B
Formal tender process• Likely to be competitive dialogue• Likely to be 6-9 monthsM
AR
Not approvedContracting process• Service specification and integration written into existing contracts with providers• Payment on outcomes 14/15
Approved
Dashboard
27
Monitoring• Development of 15/16 contract begins for similar process to start in Sept 2014

Questions?
28

London Health and Care Leaders Forum 14th March 2014Ric MarshallDirector of PricingMonitor
29
Contents
30
• The Health & Social Care Act 2012
• What next for 2014?
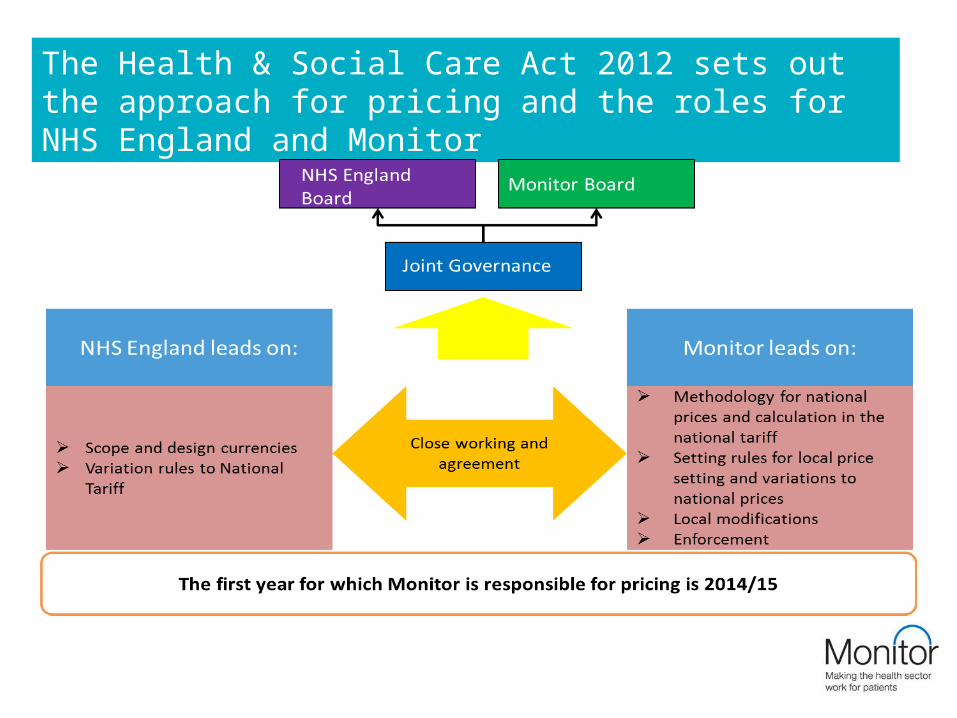
The Health & Social Care Act 2012 sets out the approach for pricing and the roles for NHS England and Monitor
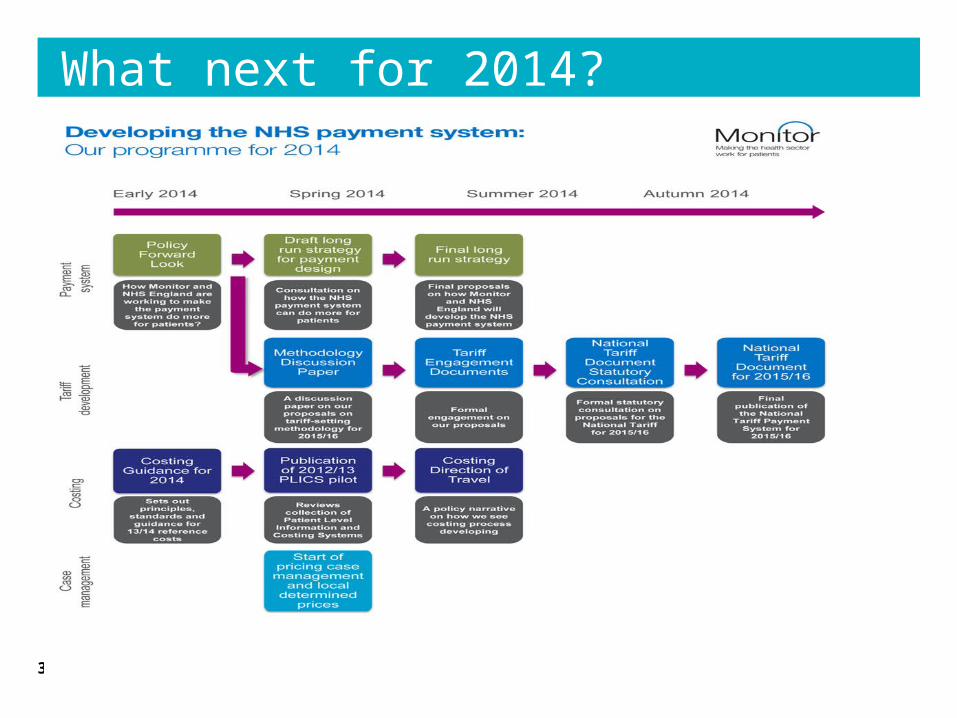
What next for 2014?
32

Thank you…..• Any questions please?
• Further information:
• http://www.monitor-nhsft.gov.uk/sites/default/files/publications/MakingThePaymentSystemDoMore%20-%2028Feb.pdf


![Investors' Report - doValue · Locat SV S.r.l. Investors' Report Series 2011 Interest Payment Date [] Issuer: Locat SV S.r.l. Issue Date: 11th February 2011 Arrangers: Unicredit Bank](https://static.fdocuments.us/doc/165x107/5fac7c0a7b8a0f1216047e47/investors-report-dovalue-locat-sv-srl-investors-report-series-2011-interest.jpg)