Logistics Systems Design: Transportation Models
60
Logistics Systems Design: Transportation Models 25-Mar-03 Copyright © 1994-2003, Marc Goetschalckx, All rights reserved. 4·1 25-Mar-03 Logistics Systems Design © Marc Goetschalckx 1. Introduction Logistics Systems Design: Transportation Models 3. Transportation Systems 4. Transportation Models 2. Forecasting 5. Inventory Systems 6. Supply Chain Systems 25-Mar-03 Logistics Systems Design © Marc Goetschalckx Vehicle Routing Problems Overview Single Origin-Destination Routing Multiple Origin-Destination Routing Single Vehicle Round-Trip Routing Vehicle Routing and Scheduling 25-Mar-03 Logistics Systems Design © Marc Goetschalckx Shortest Path Applications: Route Planning to ATL Airport 25-Mar-03 Logistics Systems Design © Marc Goetschalckx Shortest Path Applications: Point-To-Point Instructions Time Mile Instruction For Summary: 13.9 miles (23 minutes) 5:00 PM 0 Depart 765 Ferst Dr NW, Atlanta, GA 30318 on Ferst Dr NW (North) 0.3 mi 5:01 PM 0.3 Turn LEFT (North) onto Dalney St NW 0.2 mi 5:02 PM 0.5 Turn RIGHT (East) onto 10th St NW 0.5 mi 5:03 PM 0.9 Turn RIGHT (South) onto Ramp 0.1 mi 5:03 PM 1.1 Merge onto I-75 [I-85] (South) 6.8 mi 5:12 PM 7.8 Continue (South) on I-85 3.6 mi 5:16 PM 11.5 At I-85 Exit 72, turn off onto Ramp 0.4 mi 5:17 PM 11.9 Continue (West) on Airport Blvd [S Terminal Pkwy] 1.0 mi 5:20 PM 12.9 Continue (South-West) on Airport Circle 0.2 mi 5:21 PM 13.1 Bear RIGHT (East) onto N Terminal Pkwy 0.6 mi 5:22 PM 13.7 Turn RIGHT (East) onto Local road(s) 0.2 mi 5:23 PM 13.9 Arrive Hartsfield-Atlanta International Airport
Transcript of Logistics Systems Design: Transportation Models

Logistics Systems Design: Transportation Models 25-Mar-03
Copyright © 1994-2003, Marc Goetschalckx, All rights reserved. 4·1
25-Mar-03 Logistics Systems Design © Marc Goetschalckx
1. Introduction
Logistics Systems Design:Transportation Models
3. Transportation Systems4. Transportation Models
2. Forecasting
5. Inventory Systems6. Supply Chain Systems
25-Mar-03 Logistics Systems Design © Marc Goetschalckx
Vehicle Routing Problems Overview
Single Origin-Destination RoutingMultiple Origin-Destination RoutingSingle Vehicle Round-Trip RoutingVehicle Routing and Scheduling
25-Mar-03 Logistics Systems Design © Marc Goetschalckx
Shortest Path Applications:Route Planning to ATL Airport
25-Mar-03 Logistics Systems Design © Marc Goetschalckx
Shortest Path Applications:Point-To-Point Instructions
Time Mile Instruction ForSummary: 13.9 miles (23 minutes)
5:00 PM 0 Depart 765 Ferst Dr NW, Atlanta, GA 30318 on Ferst Dr NW (North) 0.3 mi5:01 PM 0.3 Turn LEFT (North) onto Dalney St NW 0.2 mi5:02 PM 0.5 Turn RIGHT (East) onto 10th St NW 0.5 mi5:03 PM 0.9 Turn RIGHT (South) onto Ramp 0.1 mi5:03 PM 1.1 Merge onto I-75 [I-85] (South) 6.8 mi5:12 PM 7.8 Continue (South) on I-85 3.6 mi5:16 PM 11.5 At I-85 Exit 72, turn off onto Ramp 0.4 mi5:17 PM 11.9 Continue (West) on Airport Blvd [S Terminal Pkwy] 1.0 mi5:20 PM 12.9 Continue (South-West) on Airport Circle 0.2 mi5:21 PM 13.1 Bear RIGHT (East) onto N Terminal Pkwy 0.6 mi5:22 PM 13.7 Turn RIGHT (East) onto Local road(s) 0.2 mi5:23 PM 13.9 Arrive Hartsfield-Atlanta International Airport

Logistics Systems Design: Transportation Models 25-Mar-03
Copyright © 1994-2003, Marc Goetschalckx, All rights reserved. 4·2
25-Mar-03 Logistics Systems Design © Marc Goetschalckx
Shortest Path Application: Excite Driving Instructions
25-Mar-03 Logistics Systems Design © Marc Goetschalckx
Single VehicleOrigin-Destination Routing
Shortest Path Problem (SPP)Network nodes = points to be visitedNetwork links = connecting the nodes
Dijkstra’s optimal algorithm (1959)100,000 nodes
25-Mar-03 Logistics Systems Design © Marc Goetschalckx
Shortest Path Problem (SPP) Variants
One Source to One Sink (s to t)One Source to All Sinks (s to all)All Pairsk Shortest Paths (Sensitivity)All Non-Negative Costs (Label Setting)General Costs (Label Correcting)Longest Path in Acyclic Graphs (PERT and CPM)
25-Mar-03 Logistics Systems Design © Marc Goetschalckx
Labeling Algorithms
Temporary Labels = Upper BoundPermanent Label = Exact Path LengthReduce Labels by Iterative ProcedureLabel Setting
One temporary label becomes permanent per iteration
Label CorrectingAll temporary labels become permanent at the last iteration

Logistics Systems Design: Transportation Models 25-Mar-03
Copyright © 1994-2003, Marc Goetschalckx, All rights reserved. 4·3
25-Mar-03 Logistics Systems Design © Marc Goetschalckx
Dijkstra’s Algorithm Illustration
s
1
2
4
3
t
3
5
7
6
5 3
6
0
∞
∞
∞
∞
∞
25-Mar-03 Logistics Systems Design © Marc Goetschalckx
Dijkstra’s Algorithm Solution
s
1
2
4
3
t
3
5
7
6
5 3
6
12,3
7,s
5,s
9,1
3,s
0
25-Mar-03 Logistics Systems Design © Marc Goetschalckx
Dijkstra’s Algorithm NotationN = Set of all nodesP = Set of permanently labeled nodesT = Set of nodes with temporary labels
(complement of P, N=P+T)L(k) = Label of node kcij = Arc length from node i to j
= all successor nodes of node k(forward star)pred (k) = predecessor node of node k on the shortest path to node k
( )kΓ
25-Mar-03 Logistics Systems Design © Marc Goetschalckx
Dijkstra’s SPP Algorithm Description
Set all node labels l(x) = ∞, set l(s) = 0,set all nodes to temporaryFind temporary node with minimum label, l(p)=min{l(x)}For all temporary x ε Γ(p) update labelsl(x) = min { l(x), l(p) + c(p,x)}Mark node p as permanentIf all destinations are permanent stop,else go to step 2

Logistics Systems Design: Transportation Models 25-Mar-03
Copyright © 1994-2003, Marc Goetschalckx, All rights reserved. 4·4
25-Mar-03 Logistics Systems Design © Marc Goetschalckx
Dijkstra’s SPP Formal Algorithm DescriptionP T N l s l i i Nwhile P n
k l k l j j TP P k T T kfor j k T
if l j l k c
l j l k c pred j k
endwhile
kj
kj
= ∅ = = = ∞ ∀ ∈<
← = ∈← ∪ ← −
∈ ∩> +
= + =
, , ( ) , ( ){
( ) min ( ):{ }, { }( )
( ) ( )
( ) ( ) , ( )
}
0
k p
Γ
25-Mar-03 Logistics Systems Design © Marc Goetschalckx
Dijkstra’s SPP Algorithm Characteristics
Forward dynamic programmingNonnegative arc “lengths” or “costs”O(n2) + O(m) orO(n2) for fully dense graphs Directed out-tree rooted at sNode selection computationally most expensive100,000 nodes
25-Mar-03 Logistics Systems Design © Marc Goetschalckx
SPP Example Network
10
2∞
9∞
8∞
5∞
6∞
3∞
4∞7
∞
37
24 14
4
106
513
12
2
9
15 10
18
25
5
23
16
20
25-Mar-03 Logistics Systems Design © Marc Goetschalckx
SPP Example Distances
From
To1 2 3 4 5 6 7 8 9
1 10 3 6 122 10 18 2 133 18 25 20 74 25 5 16 45 5 106 20 10 14 15 97 2 4 14 248 6 23 15 59 12 13 9 24 5

Logistics Systems Design: Transportation Models 25-Mar-03
Copyright © 1994-2003, Marc Goetschalckx, All rights reserved. 4·5
25-Mar-03 Logistics Systems Design © Marc Goetschalckx
SPP Example Solution
10
25,7
911,8
86,1
512,4
617,7
323,2
47,77
37
24 14
410
6
513
12
2
9
15 10
18
25
5
23
16
20
3,1
25-Mar-03 Logistics Systems Design © Marc Goetschalckx
Network Flow Formulation
. .
0
N N
ij iji j
N N
ij hi ij h
ij ij
Min c x
s t x x b i
x u ij
− = ∀
≤ ≤ ∀
∑∑
∑ ∑
Flow Balance: Out - In = External In
25-Mar-03 Logistics Systems Design © Marc Goetschalckx
Network Formulation Characteristics
One variable for each arc and commodity (flow)One conservation of flow constraint for each node and commodityFlows from the outside (sign convention: entering = positive)Individual and joint upper (and lower) bounds
25-Mar-03 Logistics Systems Design © Marc Goetschalckx
Network Example
s
1
2
4
3
t
3
5
7
6
5 3
6
0
∞
∞
∞
∞
∞

Logistics Systems Design: Transportation Models 25-Mar-03
Copyright © 1994-2003, Marc Goetschalckx, All rights reserved. 4·6
25-Mar-03 Logistics Systems Design © Marc Goetschalckx
Algebraic Network Formulation Example
1 2 4 13 23 3 4
1 2 4
1 13
2 23
13 23 3
4 4
3 4
min 3 5 7 6 5 3 6. . 1 0
00
00
1 0
s s s t t
s s s
s
s
t
s t
t t
x x x x x x xs t x x x
x xx xx x xx xx x
+ + + + + +− − − =
− =− =+ − =− =+ − =
25-Mar-03 Logistics Systems Design © Marc Goetschalckx
Shortest Path Example Network
10
2∞
9∞
8∞
5∞
6∞
3∞
4∞7
∞
37
24 14
4
106
513
12
2
9
15 10
1825
5
23
16
20
25-Mar-03 Logistics Systems Design © Marc Goetschalckx
Shortest Path ExampleExcel Arc Capacities
25-Mar-03 Logistics Systems Design © Marc Goetschalckx
Shortest Path ExampleExcel Arc Costs

Logistics Systems Design: Transportation Models 25-Mar-03
Copyright © 1994-2003, Marc Goetschalckx, All rights reserved. 4·7
25-Mar-03 Logistics Systems Design © Marc Goetschalckx
Shortest Path ExampleExcel Initial Zero Arc Flows
25-Mar-03 Logistics Systems Design © Marc Goetschalckx
Shortest Path Example: ExcelInitial Zero Objective Function
25-Mar-03 Logistics Systems Design © Marc Goetschalckx
Shortest Path Example: Excel Spreadsheet Solver Parameters
25-Mar-03 Logistics Systems Design © Marc Goetschalckx
Shortest Path Example: Excel Spreadsheet Solver Options

Logistics Systems Design: Transportation Models 25-Mar-03
Copyright © 1994-2003, Marc Goetschalckx, All rights reserved. 4·8
25-Mar-03 Logistics Systems Design © Marc Goetschalckx
Shortest Path ExampleExcel Solution Arc Flows
25-Mar-03 Logistics Systems Design © Marc Goetschalckx
Shortest Path Example: Excel Solution Objective Function
25-Mar-03 Logistics Systems Design © Marc Goetschalckx
Dijkstra’s AlgorithmSparse Graphs
Heap implementations (binary, Fibonacci, radix,...)Running times
O(m+n log n) for Fibonacci heapO(m log n) for binary heap
Intricate implementation
25-Mar-03 Logistics Systems Design © Marc Goetschalckx
Shortest Path Exercise
A B E I
C
F
H
JD
G
138
90
348
66
84
48
156
90
120
132
60
48150
126
132
84
126
Logistics Systems Design: Transportation Models 25-Mar-03
Copyright © 1994-2003, Marc Goetschalckx, All rights reserved. 4·9
25-Mar-03 Logistics Systems Design © Marc Goetschalckx
Shortest Path Exercise 2
1
2
5→,2←
5→,1←
6↓
5→,2←2→,3←
6→,2←0
∞
3∞
5∞
7∞
6∞
4∞
13→,2←
7→,2←4→,1←
4→,1←
6→,1←
8→,1←
25-Mar-03 Logistics Systems Design © Marc Goetschalckx
Directed Graph RepresentationAdjacency matrixSuccessor listSuccessor linked list
25-Mar-03 Logistics Systems Design © Marc Goetschalckx
Directed Graph Adjacency Matrix
A[i, j] present if arc from node i to node j
1
2
3
1 3
2
1 2
3
1
2
3
1
2
3
25-Mar-03 Logistics Systems Design © Marc Goetschalckx
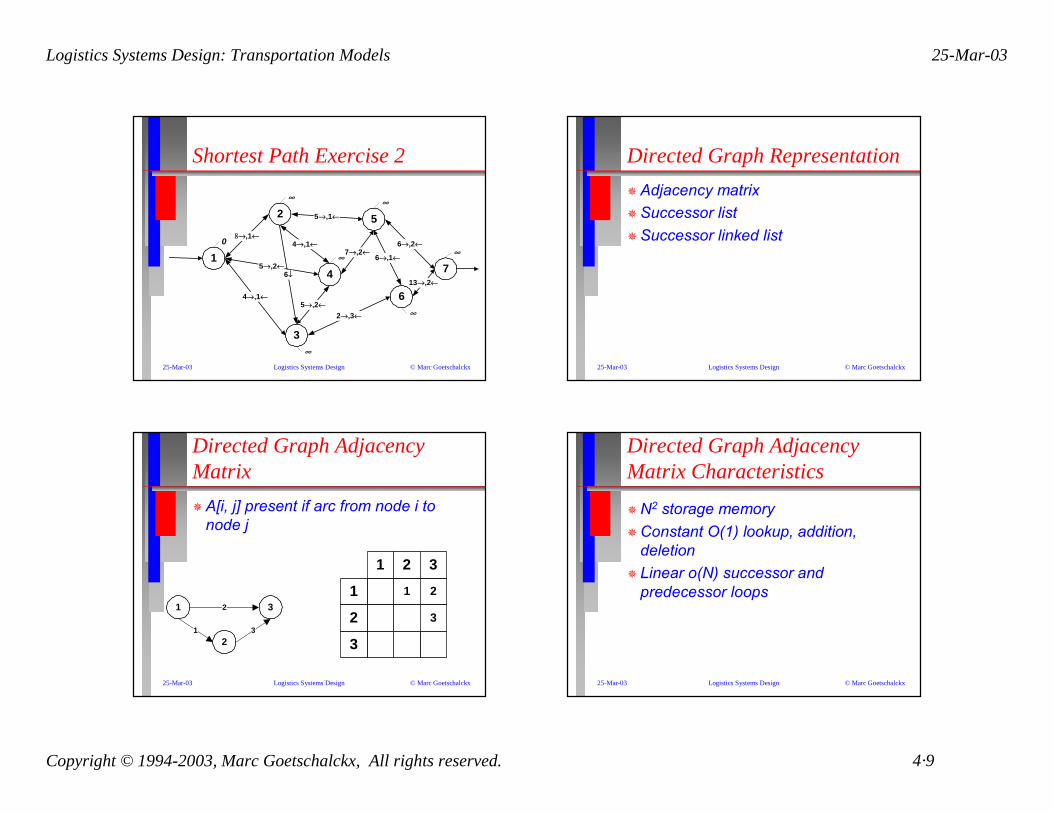
Directed Graph Adjacency Matrix Characteristics
N2 storage memoryConstant O(1) lookup, addition, deletionLinear o(N) successor and predecessor loops

Logistics Systems Design: Transportation Models 25-Mar-03
Copyright © 1994-2003, Marc Goetschalckx, All rights reserved. 4·10
25-Mar-03 Logistics Systems Design © Marc Goetschalckx
Directed Graph Successor Array
Head or first arc array [nodes+1]to-node array with every arc [arcs]
1
2
3
1 3
2
1
3
4
4
2
3
3
1
2
3
Head To Arc
25-Mar-03 Logistics Systems Design © Marc Goetschalckx
Directed Graph Successor Array Characteristics
N + 2M memory storageLinear o(N) lookup,linear o(N) insertion and deletion
Plus constant time to move the array elements for insertion and deletion
Linear o(N) successor loop,linear o(M) predecessor loop
25-Mar-03 Logistics Systems Design © Marc Goetschalckx
Directed Graph Successor Double Linked List
Head or first arc array [nodes]to-node double linked list with every arc [arcs]
1
2
3
1 3
21
3
-
Head
2
3
3
1
2
3
To Arc
2
3
-
Next
-
1
2
Prev
25-Mar-03 Logistics Systems Design © Marc Goetschalckx
Directed Graph Successor Dbl. Linked List Characteristics
N + 4M memory storageLinear O(N) Lookup,Constant O(1) Insertion,Linear O(N) DeletionLinear O(N) Successor Loop,Linear O(M) Predecessor Loop

Logistics Systems Design: Transportation Models 25-Mar-03
Copyright © 1994-2003, Marc Goetschalckx, All rights reserved. 4·11
25-Mar-03 Logistics Systems Design © Marc Goetschalckx
Double Linked List Deletion
k to be deleted elementIf Pred(k) then Succ(Pred(k)) = Succ(k)If Succ(k) then Pred(Succ(k)) = Pred(k)
21- 321 -32
31- -31
25-Mar-03 Logistics Systems Design © Marc Goetschalckx
Double Linked List Insertion21- -21
31- 231 -23
k to be inserted element after pSucc(k) = Succ(p), Pred(k)=p, Succ(p)=kIf Succ(k) then Pred(Succ(k))=k
k to be inserted element before sPred(k)=Pred(s), Succ(k)=s, Pred(s)=kif Pred(k) then Succ(Pred(k))=k
25-Mar-03 Logistics Systems Design © Marc Goetschalckx
Directed Graph Example
1
2
3
5
4
6
1
4
6
2
5 3
7
25-Mar-03 Logistics Systems Design © Marc Goetschalckx
Directed Graph ExampleAdjacency Matrix
41
2
3
1
2
31
4
5 64
5
6
2
5
6
3
7

Logistics Systems Design: Transportation Models 25-Mar-03
Copyright © 1994-2003, Marc Goetschalckx, All rights reserved. 4·12
25-Mar-03 Logistics Systems Design © Marc Goetschalckx
Directed Graph ExampleSuccessor Array
1
4
5
6Head
7
8
8
2
3
5
4
1
4
6
2 To Arc
4
6
6
5
3
725-Mar-03 Logistics Systems Design © Marc Goetschalckx
Directed Graph ExampleSuccessor Linked List
1
4
5
6Head
7
-
-
1
2
3
2
3
5
4
4
5
6
4
6
6
1
4
6
2
2
3
4
5
5
3
7
6
7
-
List
25-Mar-03 Logistics Systems Design © Marc Goetschalckx
Arc (3-4) Deletion:Adjacency Matrix
41
2
3
1
2
31
4
5 64
5
6
2
6
3
7
25-Mar-03 Logistics Systems Design © Marc Goetschalckx
Arc (3-4) Deletion:Successor Array
1
4
5
5Head
6
7
7
2
3
5
4
1
4
6
2 To Arc
6
6
3
7

Logistics Systems Design: Transportation Models 25-Mar-03
Copyright © 1994-2003, Marc Goetschalckx, All rights reserved. 4·13
25-Mar-03 Logistics Systems Design © Marc Goetschalckx
Arc (3-4) DeletionSuccessor Linked List
1
4
-
6Head
7
-
-
1
2
3
2
3
5
4
4
6
6
6
1
4
6
2
2
3
4
6
3
7
7
-
List
25-Mar-03 Logistics Systems Design © Marc Goetschalckx
Arc (3-6) Addition (Cost = 8) Adjacency Matrix
41
2
3
1
2
31
4
5 64
5
6
2
85
6
3
7
25-Mar-03 Logistics Systems Design © Marc Goetschalckx
Arc (3-6) Addition (Cost = 8) Successor Array
1
4
5
7Head
8
9
9
2
3
5
4
1
4
6
2To Arc
6
4
6
8
5
3
6 7
25-Mar-03 Logistics Systems Design © Marc Goetschalckx
Arc (3-6) Addition (Cost = 8) Successor Linked List
1
4
8
6
7
-
-
1
2
3
2
3
5
4
8
5
6
4
6
6
1
4
6
2
2
3
4
8
5
3
7
6
7
-
4 6 8 5

Logistics Systems Design: Transportation Models 25-Mar-03
Copyright © 1994-2003, Marc Goetschalckx, All rights reserved. 4·14
25-Mar-03 Logistics Systems Design © Marc Goetschalckx
SPP Exercise 2
1
2
5→,2←
5→,1←
6↓
5→,2←2→,3←
6→,2←0
∞
3∞
5∞
7∞
6∞
4∞
13→,2←
7→,2←4→,1←
4→,1←
6→,1←
8→,1←
25-Mar-03 Logistics Systems Design © Marc Goetschalckx
Predecessor Loop: Data Independent Pseudo Code
Perform action on all predecessor nodes of node k
p = find_first_predecessor (k)while (p <> null) {
perform_action (p)p = find_next_predecessor (k, p)} // end while
25-Mar-03 Logistics Systems Design © Marc Goetschalckx
Data Structures and Algorithms References
Horowitz, E., and S. Shani, (1984). Fundamentals of Computer Algorithms. Computer Science Press, Rockville, Maryland.Sedgewick, R. (1983). Algorithms. Addison-Wesley, Reading, Massachusetts.Aho, A., J. Hopcroft, and J. Ullman, (1983). Data Structures and Algorithms. Addison-Welsey, Reading, Massachusetts.
25-Mar-03 Logistics Systems Design © Marc Goetschalckx
Vehicle Routing Problems Overview
Single Origin-Destination RoutingMultiple Origin-Destination RoutingSingle Vehicle Round-Trip RoutingVehicle Routing and Scheduling

Logistics Systems Design: Transportation Models 25-Mar-03
Copyright © 1994-2003, Marc Goetschalckx, All rights reserved. 4·15
25-Mar-03 Logistics Systems Design © Marc Goetschalckx
Multiple Vehicle Origin-Destination Routing Overview
Problem Description & VariantsExamplesSuccessive Shortest Path AlgorithmFormulationsReferences
25-Mar-03 Logistics Systems Design © Marc Goetschalckx
Network Flow Illustration
DemandsInflows
Channels
25-Mar-03 Logistics Systems Design © Marc Goetschalckx
Network ComponentsNodes
Sources, sinks, intermediateNo capacities or costConservation of flow
Channels or ArcsDirected (non-negative flow variables)Costs and capacities
25-Mar-03 Logistics Systems Design © Marc Goetschalckx
Multiple Origin-Destination Routing
Max flow network flow problemCapacity models, public sector
Min cost network flow problemEconomic models, private industry
Network simplex algorithm is very efficient100,000 channels

Logistics Systems Design: Transportation Models 25-Mar-03
Copyright © 1994-2003, Marc Goetschalckx, All rights reserved. 4·16
25-Mar-03 Logistics Systems Design © Marc Goetschalckx
Network Variants
TransportationTransshipmentMin Cut - Max Flow NetworkMin Cost NetworkMulticommodity NetworkGeneralized Network
25-Mar-03 Logistics Systems Design © Marc Goetschalckx
Integrality PropertySolution is naturally integer if
Integer external flowsInteger capacity boundsBinary conservation of flow coefficientsSingle commodity
Desirable for unit load transportation movesDoes not hold for generalized network and multicommodity networks
25-Mar-03 Logistics Systems Design © Marc Goetschalckx
Tactical Production-Distribution Planning Problem
Products pCustomers j, demand demjp
Plants i, capacity capi
Marginal production cost aip and resource consumption reqip
generalized network req ≠ 1Transportation cost cijp andquantity xijp
25-Mar-03 Logistics Systems Design © Marc Goetschalckx
Tactical Production-Distribution Planning Network
i i'j(a, cap, x) (c,∞,x) dem
i i'j

Logistics Systems Design: Transportation Models 25-Mar-03
Copyright © 1994-2003, Marc Goetschalckx, All rights reserved. 4·17
25-Mar-03 Logistics Systems Design © Marc Goetschalckx
Tactical Production-Distribution Planning Model
( )1 1 1
1
1 1
. .
0
F C Pip ijp ijp
i j pF
ijp jpiC P
ip ijp ij p
ijp
Min a c x
s t x dem jp
req x cap i
x
= = =
=
= =
+
= ∀
≤ ∀
≥
∑ ∑ ∑
∑
∑ ∑
25-Mar-03 Logistics Systems Design © Marc Goetschalckx
Operator Scheduling Problem
Parameters and variablesTime periods with coverage requirements bi
Operator shifts with costs ci cover consecutive time periodsNumber of operators for each shift xi
25-Mar-03 Logistics Systems Design © Marc Goetschalckx
Operator Scheduling Linear Programming Formulation
Min cxs t Ax b
x. . ≥
≥ 00 1 0 1 11 1 0 0 11 1 0 0 11 1 0 0 01 1 1 0 0
5128
104
L
N
MMMMMM
O
Q
PPPPPP
≥
L
N
MMMMMM
O
Q
PPPPPP
x
25-Mar-03 Logistics Systems Design © Marc Goetschalckx
Operator Scheduling Transformation
Consecutive ones in each columnAdd negative identity matrix(row surplus variables s: Ax-s=b)Add “zero” row(node N+1 flow balance constraint)Linear row operation
For r = N Down To 1Row[r+1] = Row[r+1] - Row[r]

Logistics Systems Design: Transportation Models 25-Mar-03
Copyright © 1994-2003, Marc Goetschalckx, All rights reserved. 4·18
25-Mar-03 Logistics Systems Design © Marc Goetschalckx
Operator Scheduling Network Formulation (Initial)
0 1 0 1 1 1 0 0 0 01 1 0 0 1 0 1 0 0 01 1 0 0 1 0 0 1 0 01 1 0 0 0 0 0 0 1 01 1 1 0 0 0 0 0 0 10 0 0 0 0 0 0 0 0 0
5128
1040
−−
−−
−
L
N
MMMMMMM
O
Q
PPPPPPP
LNMOQP =
L
N
MMMMMMM
O
Q
PPPPPPP
xs
25-Mar-03 Logistics Systems Design © Marc Goetschalckx
Operator Scheduling Network Formulation (Final)
0 1 0 1 1 1 0 0 0 01 0 0 1 0 1 1 0 0 00 0 0 0 0 0 1 1 0 00 0 0 0 1 0 0 1 1 00 0 1 0 0 0 0 0 1 11 1 1 0 0 0 0 0 0 1
574
264
−− −
−− −
−− − −
L
N
MMMMMMM
O
Q
PPPPPPP
LNMOQP =
−
−−
L
N
MMMMMMM
O
Q
PPPPPPP
xs
25-Mar-03 Logistics Systems Design © Marc Goetschalckx
Operator Scheduling Network
1 2 3 4 5s1 s2 s3 s4 6s5
x4
x1
x2
x3
x5
5 7 4 2 6 4
25-Mar-03 Logistics Systems Design © Marc Goetschalckx
Successive Shortest Paths Illustration (1)
1
3
2
4
2,4
2,2
3,31,5
1,2
0
0
0
0
4 -4 1
3
2
4
2,4
2,2
3,31,5
1,2
0,2
0,3
0,2
0,0
4 -4

Logistics Systems Design: Transportation Models 25-Mar-03
Copyright © 1994-2003, Marc Goetschalckx, All rights reserved. 4·19
25-Mar-03 Logistics Systems Design © Marc Goetschalckx
Successive Shortest Paths Illustration (2)
1
3
2
4
2,4
2,2
3,31,5
1,2
0,2
0,3
0,2
0,0
4 -4 1
3
2
4
0,4
0,2
2,3
0,3
1,2
-2
-3
-2
0
2 -2
0,2
25-Mar-03 Logistics Systems Design © Marc Goetschalckx
Successive Shortest Paths Illustration (3)
1
3
2
4
0,4
0,2
2,3
0,3
1,2
-2
-3
-2
0
2 -2
0,2
1
3
2
4
0,4
0,2
2,3
0,3
1,2
-2,0
-3,1
-2,1
0
2 -2
0,2
25-Mar-03 Logistics Systems Design © Marc Goetschalckx
Successive Shortest Paths Illustration (4)
1
3
2
4
0,4
0,2
2,3
0,3
1,2
-2,0
-3,1
-2,1
0
2 -2
0,2
1
3
2
4
0,2
0,2
1,3
0,1
0,2
-2
-4
-3
0
0 0
0,4
0,2
25-Mar-03 Logistics Systems Design © Marc Goetschalckx
Successive Shortest Paths Algorithm (1)
Start all flows x = 0,all node potentials π = 0

Logistics Systems Design: Transportation Models 25-Mar-03
Copyright © 1994-2003, Marc Goetschalckx, All rights reserved. 4·20
25-Mar-03 Logistics Systems Design © Marc Goetschalckx
Successive Shortest Paths Algorithm (2)
Construct incremental/residual graphSame nodes as original graphIf xij > 0 then add artificial arc jiIf xij = uij then eliminate arc ij or dij = ∞If xij < uij then dij = cij - πi + πj
If xij > 0 then dji = -cij - πj + πi = - dij
Add super source (sink),arcs to (from) sources (sinks) with 0 cost,capacity = remaining supply (demand)
25-Mar-03 Logistics Systems Design © Marc Goetschalckx
Successive Shortest Paths Algorithm (3)
Find shortest path from source to sinkFind shortest path to any sink node kwith Dijkstra’s algorithmIf no such path, stop, network flow problem is infeasible
25-Mar-03 Logistics Systems Design © Marc Goetschalckx
Successive Shortest Paths Algorithm (4)
Compute maximum flow change on the shortest path
on backflow arcs, δij = xji
on regular arcs, δij = uij - xij
δ = min {δij}Augment flow on the shortest path
on backflow arcs, xji = xji - δon regular arcs, xij = xij + δupdate remaining supply and demand
25-Mar-03 Logistics Systems Design © Marc Goetschalckx
Successive Shortest Paths Algorithm (5)
If all remaining demands are zero, stop,network is optimalUpdate node potentials
k = shortest path sink nodeif node i is permanent, πi = πi - SPi
if node i is temporary, πi = πi - SPk
Goto step 2

Logistics Systems Design: Transportation Models 25-Mar-03
Copyright © 1994-2003, Marc Goetschalckx, All rights reserved. 4·21
25-Mar-03 Logistics Systems Design © Marc Goetschalckx
Successive Shortest Paths Example
cost, capacity, flow
1
2
13,11
10,16
25,17
6,12 5,22
12,16
0
∞
3∞
5∞
7∞
6∞
4∞
7,55,19
4,18
28,13 3,10
0,30 0,30
7,16
25-Mar-03 Logistics Systems Design © Marc Goetschalckx
Successive Shortest Paths Example (2)
1
2
13,11
10,16
25,17
6,12,12 5,22,12
12,16
0
7,1
317,4
517,2
722,3
616,4
411,2
7,55,19
4,18,12
28,13 3,10
0,30 0,30
7,16,12
25-Mar-03 Logistics Systems Design © Marc Goetschalckx
Successive Shortest Paths Example (3)
1
2
2,11
0,16
15,17
0,12
7,16
0
-7,0,1
3-17,15*,2
5-17,0,2
7-22,1,6
6-16,0,4
4-11,0,2
1,50,19
12,13 2,10
0,18 0,180,6 0,12
0,4
0,120,10
0,12
25-Mar-03 Logistics Systems Design © Marc Goetschalckx
Successive Shortest Paths Example (4)
1
2
2,11
0,16
14,17
1,12
6,16
0
-7,2,4
3-18,16*,2
5-17,2*,2
7-23,2,6
6-16,2,4
4-11,2,1
12,13 2,10
0,14 0,140,2 0,160,16
0,10
0,12
0,150,4
0,1
0,4

Logistics Systems Design: Transportation Models 25-Mar-03
Copyright © 1994-2003, Marc Goetschalckx, All rights reserved. 4·22
25-Mar-03 Logistics Systems Design © Marc Goetschalckx
Successive Shortest Paths Example (5)
1
2
0,16
14,17
1,12
6,16
0
-9,0,4
3-20,14*,2
5-19,0,2
7-25,6,5
6-18,0,4
4-13,0,1
10,13 2,10
0,13 0,130,2 0,162,16
0,10
0,12
0,140,5 0,5
0,10
0,1
25-Mar-03 Logistics Systems Design © Marc Goetschalckx
Successive Shortest Paths Example (6)
1
2 8,17
7,120
-9,10,4
3-26,18*,2
5-19,10,2
7-31,10,5
6-18,10,1
4-13,10,6
10,13 2,10
0,3 0,30,12 0,62,16
0,100,12
0,140,5 6,5
0,11
0,60,10
0,6
0,10
25-Mar-03 Logistics Systems Design © Marc Goetschalckx
Successive Shortest Paths Example (7)
1
2
13,11,11
25,17
5,22,12
12,16,13
0
-19
3-36
5-29
7-41
6-28
4-23
7,5,55,19,2
4,18,3
28,13,3 3,10
0,30,30 0,30,30
7,16,16 6,12,12
10,16,13
25-Mar-03 Logistics Systems Design © Marc Goetschalckx
Successive Shortest Paths Example
cost, capacity, flow
1
2
13,11
10,16
25,17
6,12 5,22
12,16
0
∞
3∞
5∞
7∞
6∞
4∞
7,55,19
4,18
28,13 3,10
0,30 0,30
7,16

Logistics Systems Design: Transportation Models 25-Mar-03
Copyright © 1994-2003, Marc Goetschalckx, All rights reserved. 4·23
25-Mar-03 Logistics Systems Design © Marc Goetschalckx
Min Cost Network ExampleExcel Arc Capacities
25-Mar-03 Logistics Systems Design © Marc Goetschalckx
Min Cost Network ExampleExcel Arc Costs
25-Mar-03 Logistics Systems Design © Marc Goetschalckx
Min Cost Network ExampleExcel Initial Zero Arcs Flows
25-Mar-03 Logistics Systems Design © Marc Goetschalckx
Min Cost Network Example: Excel Initial Zero Objective

Logistics Systems Design: Transportation Models 25-Mar-03
Copyright © 1994-2003, Marc Goetschalckx, All rights reserved. 4·24
25-Mar-03 Logistics Systems Design © Marc Goetschalckx
Min Cost Network ExampleExcel Solver Parameters
25-Mar-03 Logistics Systems Design © Marc Goetschalckx
Min Cost Network ExampleExcel Optimal Arc Flows
25-Mar-03 Logistics Systems Design © Marc Goetschalckx
Min Cost Network ExampleExcel Optimal Objective
25-Mar-03 Logistics Systems Design © Marc Goetschalckx
Min Cost Network Flow Formulation
. . [ ]
0 [ ]
N Nij ij
i jN N
hi ij i ih j
ij ij ij
Min c x
s t x x b i
x u ij
π
α
− + = ∀
≤ ≤ ∀
∑∑
∑ ∑
bi external node flow(supply >0, or demand <0)

Logistics Systems Design: Transportation Models 25-Mar-03
Copyright © 1994-2003, Marc Goetschalckx, All rights reserved. 4·25
25-Mar-03 Logistics Systems Design © Marc Goetschalckx
Residual Network
( , )0
( , )
( , )
ij ij
ij
origij ij j i ij ij ij
ji ij ji ij
arc i j with c and uif x then
arc i j c c r u x
arc j i c c r x
π
π π
π π
>
= + − = −
= − =
25-Mar-03 Logistics Systems Design © Marc Goetschalckx
Optimality Conditions
Shortest path reduced cost
Dual variable reduced cost
d d c i j
c c d d i j
j i ij
ijd
ij i j
≤ + ∀
= + − ≥ ∀
( , )
( , )0
c c i jij ij i jπ π π= − + ≥ ∀0 ( , )
25-Mar-03 Logistics Systems Design © Marc Goetschalckx
Min Cost Network FlowPrimal Formulation
Min c x
s t x x b i
x u ij
ij ijj
N
i
N
hih
Nij
j
Ni i
ij ij ij
∑∑
∑ ∑− + = ∀
− ≥ − ∀
. . [ ]
[ ]
π
α
25-Mar-03 Logistics Systems Design © Marc Goetschalckx
Min Cost Network FlowDual Formulation
max
. . ( , ) [ ]
b u
s t c i j x
unrestricted
i i ij ijj
N
i
N
i
N
i j ij ij ij
ij
i
π α
π π ααπ
−
− − ≤ ∀
≥
∑∑∑
0

Logistics Systems Design: Transportation Models 25-Mar-03
Copyright © 1994-2003, Marc Goetschalckx, All rights reserved. 4·26
25-Mar-03 Logistics Systems Design © Marc Goetschalckx
Transformed Dual Formulation
max
. . ( , ) [ ]
b u
s t c i j x
unrestricted
i i ij ijj
N
i
N
i
N
ij ij ij
ij
i
π α
ααπ
π
−
+ ≥ ∀
≥
∑∑∑
0
0
25-Mar-03 Logistics Systems Design © Marc Goetschalckx
Complementary Slackness Conditions
if c then c then x
if x u then then c
if c then then x u
ij ij ij ij
ij ij ij ij
ij ij ij ij
π π
π
π
α
α
α
> + > =
< < = =
< > =
0 0 0
0 0 0
0 0
* *
* *
* *
( )
( )
* *
* *
u x
c x
ij ij ij
ij ij ij
− =
+ =
α
α π
0
0
25-Mar-03 Logistics Systems Design © Marc Goetschalckx
Ballou Ch7-4 Network Exercise
CL
CH
325100
325
800
350
275
∞
SJ∞
LE∞
FC∞
FR∞
FH∞
400
300
350
150
375
400
100
275
0 150
150
FB 100
100
100
300
∞
∞
400
250
300
25-Mar-03 Logistics Systems Design © Marc Goetschalckx
Network Exercise 2
1
14,6
7,166,15
3
5 6
4
0,14
12,20
35,87 0,18
26,25
12,10
2,282
5,15
4,180,18
0,20

Logistics Systems Design: Transportation Models 25-Mar-03
Copyright © 1994-2003, Marc Goetschalckx, All rights reserved. 4·27
25-Mar-03 Logistics Systems Design © Marc Goetschalckx
Network Flow References
Ahuja, R., T. Magnanti, and J. Orlin. 1993. Network Flows. Prentice Hall, Englewood Cliffs, New Jersey. Christofides, N. 1975. Graph Theory: An Algorithmic Approach. Academic Press, New York.Evans, J. and E. Minieka. (2nd Ed.) 1992. Optimization Algorithms for Networks and Graphs. Marcel Dekker , New York, New York.Kennington, J. and R. Helgason. 1980. Algorithms for Network Programming. John Wiles & Sons, New York, New York.
25-Mar-03 Logistics Systems Design © Marc Goetschalckx
Vehicle Routing Problems Overview
Single Origin-Destination RoutingMultiple Origin-Destination RoutingSingle Vehicle Round-Trip RoutingVehicle Routing and Scheduling
25-Mar-03 Logistics Systems Design © Marc Goetschalckx
Single Round-Trip Vehicle Routing
Traveling Salesman Problem (TSP)Specialized branch and bound algorithms2000 nodes (million nodes)Many heuristic algorithms
25-Mar-03 Logistics Systems Design © Marc Goetschalckx
TSP Applications
Traveling salesmanShortest Hamiltonian cycleKnight’s tourPerson-aboard order pickingRunning domestic errandsSequencing jobs in a paint booth

Logistics Systems Design: Transportation Models 25-Mar-03
Copyright © 1994-2003, Marc Goetschalckx, All rights reserved. 4·28
25-Mar-03 Logistics Systems Design © Marc Goetschalckx
Person-Aboard Order Picking:Outside View
25-Mar-03 Logistics Systems Design © Marc Goetschalckx
Person-Aboard Order Picking:Inside View
25-Mar-03 Logistics Systems Design © Marc Goetschalckx
Random Sequence Tour
25-Mar-03 Logistics Systems Design © Marc Goetschalckx
Local Improvement (3 Opt)
Logistics Systems Design: Transportation Models 25-Mar-03
Copyright © 1994-2003, Marc Goetschalckx, All rights reserved. 4·29
25-Mar-03 Logistics Systems Design © Marc Goetschalckx
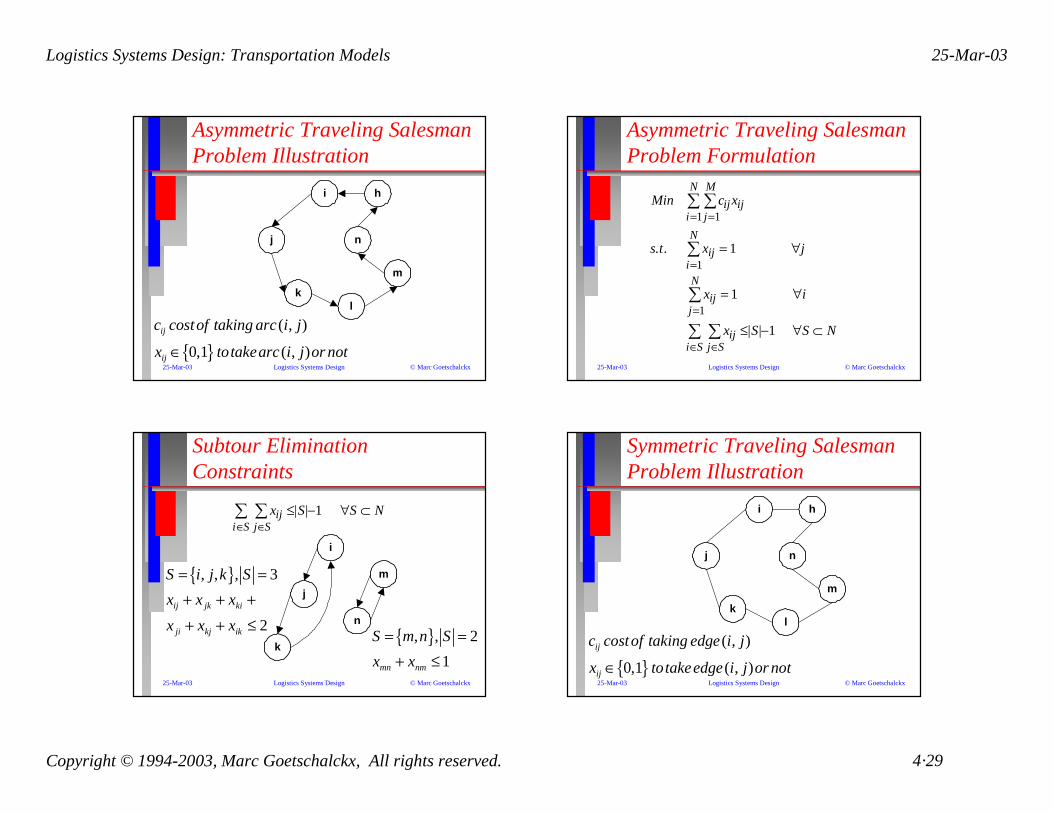
Asymmetric Traveling Salesman Problem Illustration
i
j
k
h
n
m
l
{ }( , )
0,1 ( , )ij
ij
c costof taking arc i j
x totakearc i j or not∈25-Mar-03 Logistics Systems Design © Marc Goetschalckx
Asymmetric Traveling Salesman Problem Formulation
Min c x
s t x j
x i
x S S N
ij ijj
M
i
N
iji
N
ijj
N
ijj Si S
==
=
=
∈∈
∑∑
∑
∑
∑∑
= ∀
= ∀
≤ − ∀ ⊂
11
1
1
1
1
1
. .
| |
25-Mar-03 Logistics Systems Design © Marc Goetschalckx
Subtour Elimination Constraints
x S S Nijj Si S
≤ − ∀ ⊂∈∈∑∑ | | 1
i
j
k
m
n{ }, , 2
1mn nm
S m n Sx x
= =+ ≤
{ }, , , 3
2ij jk ki
ji kj ik
S i j k Sx x x
x x x
= =+ + +
+ + ≤
25-Mar-03 Logistics Systems Design © Marc Goetschalckx
Symmetric Traveling Salesman Problem Illustration
i
j
k
h
n
m
l
{ }( , )
0,1 ( , )ij
ij
c costof taking edge i j
x totakeedge i j or not∈

Logistics Systems Design: Transportation Models 25-Mar-03
Copyright © 1994-2003, Marc Goetschalckx, All rights reserved. 4·30
25-Mar-03 Logistics Systems Design © Marc Goetschalckx
Symmetric Traveling Salesman Problem Formulation
Min c x
s t x x j
x S S N
ij ijj i
N
i
N
ij jkk j
N
i
j
ijj S j ii S
= +=
−
= +=
−
∈ >∈
∑∑
∑∑
∑∑
+ = ∀
≤ − ∀ ⊂
11
1
11
12
1
. .
| |,
25-Mar-03 Logistics Systems Design © Marc Goetschalckx
Simple TSP HeuristicsCreate an initial tour
convex hull, sweep, nearest neighborInsert remaining free points
nearest, cheapest, farthest insertionImprove existing tour
two, three, or Or (chain) exchanges
25-Mar-03 Logistics Systems Design © Marc Goetschalckx
TSP ExamplePoint Coordinates
# x y1 0 02 100 6003 400 4004 500 7005 900 4006 800 900
25-Mar-03 Logistics Systems Design © Marc Goetschalckx
TSP Example:Euclidean Distances
1 2 3 4 5 61 0 608 566 860 985 12042 608 0 361 412 825 7623 566 361 0 316 500 6404 860 412 316 0 500 3615 985 825 500 500 0 5106 1204 762 640 361 510 0
d x x y yijE
i j i j= − + −c h c h2 2

Logistics Systems Design: Transportation Models 25-Mar-03
Copyright © 1994-2003, Marc Goetschalckx, All rights reserved. 4·31
25-Mar-03 Logistics Systems Design © Marc Goetschalckx
TSP Example:Point Locations
Y-Ax
is
X-Axis1
2
3
4
6
5
25-Mar-03 Logistics Systems Design © Marc Goetschalckx
TSP Example:Nearest Neighbor
Y-Ax
is
X-Axis1
2
3
4
6
5
start point = 3length = 3186
25-Mar-03 Logistics Systems Design © Marc Goetschalckx
TSP Example:Nearest Neighbor Computations
Start point 3Min {566, 361, 316, 500, 640}=316 (4)Min {860, 412, 500, 361} = 361 (6)Min {1204, 762, 510} = 510 (5)Min {985, 825} = 825 (2)Min {608} = 608 (1)Total tour length = 3186
25-Mar-03 Logistics Systems Design © Marc Goetschalckx
TSP Example:Sweep
Find a centrally located rotation pointCenter or average coordinates
Rotate a ray and add points to the tour in the sequence they are traversed by the ray

Logistics Systems Design: Transportation Models 25-Mar-03
Copyright © 1994-2003, Marc Goetschalckx, All rights reserved. 4·32
25-Mar-03 Logistics Systems Design © Marc Goetschalckx
TSP Example: Sweep
Y-Ax
is
X-Axis1
2
3
4
6
5
Rotation point (450,450)Length = 3195
25-Mar-03 Logistics Systems Design © Marc Goetschalckx
TSP Example:Quad Initial Tour
Y-Ax
is
X-Axis1
2
3
4
6
5
length = 2699
25-Mar-03 Logistics Systems Design © Marc Goetschalckx
TSP Example:Quad Calculations
Leftmost 0 (1), bottom 0 (1), rightmost 900 (5), top 900 (6)In this case quadrilateral degenerates to triangle, tour {1-5-6-1}
25-Mar-03 Logistics Systems Design © Marc Goetschalckx
TSP Example:Convex Hull Tour Skeleton
Y-Ax
is
X-Axis1
2
3
4
6
5
length = 2865

Logistics Systems Design: Transportation Models 25-Mar-03
Copyright © 1994-2003, Marc Goetschalckx, All rights reserved. 4·33
25-Mar-03 Logistics Systems Design © Marc Goetschalckx
Insertion HeuristicsTwo decisions
Which free point to insertWhere to insert (which link to break)Which decision to make first
Many variantsNearest Addition, Nearest InsertionCheapest Insertion, Priciest Insertion Farthest Insertion, Min. Ratio,Max. Angle, Optimal Insertion...
25-Mar-03 Logistics Systems Design © Marc Goetschalckx
Cheapest InsertionInsert free point with smallest cost increase (insertion penalty)
i j
k
min min,k i j
ijk ik kj ijc c cδ = + −RSTUVWn s
25-Mar-03 Logistics Systems Design © Marc Goetschalckx
Priciest InsertionInsert free point with largest minimum cost increase
i j
k
max min,k i j
ijk ik kj ijc c cδ = + −RSTUVWn s
25-Mar-03 Logistics Systems Design © Marc Goetschalckx
Nearest Insertion
Find free point closest to a point on the tour
Insert on best link of the tour for point k
min( , )i j T
ijk ik kj ijc c c∈
= + −δn s
{ } { },min min minkj kjk T j T k T j T
c c∉ ∈ ∉ ∈
=

Logistics Systems Design: Transportation Models 25-Mar-03
Copyright © 1994-2003, Marc Goetschalckx, All rights reserved. 4·34
25-Mar-03 Logistics Systems Design © Marc Goetschalckx
Farthest InsertionFind free point with maximum distance to closest point on the tour
Insert on best link of the tour for point kmin
( , )i j Tijk ik kj ijc c c
∈= + −δn s
{ }max min kjj Tk Tc
∈∉
25-Mar-03 Logistics Systems Design © Marc Goetschalckx
Nearest AdditionFind free point closest to a point on the tour
Insert on best of two links out of point j for point k
min,δ
δijk ik kj ij
jkm jk km jm
c c c
c c c
= + −
= + −RST
UVW
min,k T j T
kjc∉ ∈n s
25-Mar-03 Logistics Systems Design © Marc Goetschalckx
TSP Example:Cheapest Insertion
Y-Ax
is
X-Axis1
2
3
4
6
5
insert 4, 3length = 2957
25-Mar-03 Logistics Systems Design © Marc Goetschalckx
TSP Example: Cheapest Insertion Computations
Point 3 & 4Min {566+500-985=81 (1-5), 500+640-510=630 (5-6), 640+361-762=239 (6-2), 361+566-608=319 (2-1)} = 81 (1-5)Min {860+500-985=375 (1-5), 500+361-510=351 (5-6), 361+412-762=11 (2-6), 412+860-608=644 (2-1)} = 11 (2-6)*
Point 3Min {81 (1-5), 595 (6-4), 265 (4-2)} =81 (1-5)

Logistics Systems Design: Transportation Models 25-Mar-03
Copyright © 1994-2003, Marc Goetschalckx, All rights reserved. 4·35
25-Mar-03 Logistics Systems Design © Marc Goetschalckx
TSP Example: Priciest Insertion Computations
Point 3 & 4Min {566+500-985=81 (1-5), 500+640-510=630 (5-6), 640+361-762=239 (6-2), 361+566-608=319 (2-1)} = 81 (1-5) *Min {860+500-985=375 (1-5), 500+361-510=351 (5-6), 361+412-762=11 (6-2), 412+860-608=644 (2-1)} = 11 (2-6)
Point 4Min { 610 (1-3), 316 (3-5), 11 (6-2)} =11 (6-2)
25-Mar-03 Logistics Systems Design © Marc Goetschalckx
TSP Example:Nearest Insertion
Points 3 & 4[3] Min {566 (3-1), 361 (3-2), 500 (3-5), 640 (3-6)} = 361 (3-2)* -- tie[4] Min {860 (4-1), 412 (4-2), 500 (4-5), 361 (4-6)} = 361 (4-6)[3] Min {566+500-985=81 (1-5), 500+640-510=630 (5-6), 640+361-762=239 (6-2), 361+566-608=319 (2-1)} = 81 (1-5)
25-Mar-03 Logistics Systems Design © Marc Goetschalckx
TSP Example:Nearest Insertion Continued
Point 4[4] Min {361 (4-6), 316 (4-3)} = 316 (4-3)[4] Min {860+316-566=610 (1-3), 316+500-500=316 (3-5), 500+361-510=351 (5-6), 361+412-762=11 (2-6), 412+860-608=644 (2-1)} = 11 (2-6)*
25-Mar-03 Logistics Systems Design © Marc Goetschalckx
TSP Example: Farthest Insertion Computations
Point 3 & 4[3] Min {566 (3-1), 361 (3-2), 500 (3-5), 640 (3-6)} = 361 (3-2)* -- tie[4] Min {860 (4-1), 412 (4-2), 500 (4-5), 361 (4-6)} = 361 (4-6)[3] Min {566+500-985=81 (1-5), 500+640-510=630 (5-6), 640+361-762=239 (6-2), 361+566-608=319 (2-1)} = 81 (1-5)

Logistics Systems Design: Transportation Models 25-Mar-03
Copyright © 1994-2003, Marc Goetschalckx, All rights reserved. 4·36
25-Mar-03 Logistics Systems Design © Marc Goetschalckx
TSP Example: Farthest Insertion Calculations Continued
Point 4[4] Min {361 (4-6), 316 (4-3)} = 316 (4-3)[4] Min {860+316-566=610 (1-3), 316+500-500=316 (3-5), 500+361-510=351 (5-6), 361+412-762=11 (2-6), 412+860-608=644 (2-1)} = 11 (2-6)*
25-Mar-03 Logistics Systems Design © Marc Goetschalckx
Two Exchange Improvement Illustration
i
j
k
n
l
m
i
j
k
n
l
m
25-Mar-03 Logistics Systems Design © Marc Goetschalckx
Three Exchange Improvement Illustration
i
j
k
o
m
n
h
l
i
j
k
o
m
n
h
l
25-Mar-03 Logistics Systems Design © Marc Goetschalckx
Or (2 Chain) Exchange Improvement Illustration
i
j
k
n
l
m
i
j
k
n
l
m

Logistics Systems Design: Transportation Models 25-Mar-03
Copyright © 1994-2003, Marc Goetschalckx, All rights reserved. 4·37
25-Mar-03 Logistics Systems Design © Marc Goetschalckx
Exchange Improvement Variants
First descent exchangeSteepest descent exchangeSimulated annealingTabu search
25-Mar-03 Logistics Systems Design © Marc Goetschalckx
Simulated Annealing
Evaluate random exchange ∆Execute exchange with probability
T search control parameter (temperature) systematically decreasing
if P Exch
if P Exch e T∆
∆ ∆< =
≥ = −0 1
0
[ ]
[ ]
25-Mar-03 Logistics Systems Design © Marc Goetschalckx
TSP Example:Two Exchange Improvement
Y-Ax
is
X-Axis1
2
3
4
6
5
length = 2957
25-Mar-03 Logistics Systems Design © Marc Goetschalckx
TSP Example:Two Exchange Computations
Original tour length = 3186Crossing edges (3-4) and (2-5) in geometric TSPExchange edges (3-4) and (2-5)with (2-4) and (3-5)Savings = 316 + 825 - 412 - 500 = 229Improved tour length = 2957

Logistics Systems Design: Transportation Models 25-Mar-03
Copyright © 1994-2003, Marc Goetschalckx, All rights reserved. 4·38
25-Mar-03 Logistics Systems Design © Marc Goetschalckx
Clarke and Wright Savings Illustration
hi
j
0
s c c cij i j ij= + −0 0
25-Mar-03 Logistics Systems Design © Marc Goetschalckx
Clarke and Wright SavingsSelect base point {0} (somewhere on perimeter or corner)Compute savings of combining tours
Construct tour primitive {0ij0} (max savings)Append point with largest savings to either end of tour
max{ }j
ij i j ijs c c c= + −0 0
25-Mar-03 Logistics Systems Design © Marc Goetschalckx
TSP Example: Clarke and Wright Savings Computations
Initial route primitive (base point 1):(1-2-3-1) [2,3] = 608+566-361=813(1-2-4-1) [2,4] = 608+860-412=1056(1-4-6-1) [4,6] = 860+1204-361=1703 *(1-5-6-1) [5,6] = 985+1204-510=1679
3 4 5 62 813 1056 768 10503 1110 1051 11304 1345 17035 1679
25-Mar-03 Logistics Systems Design © Marc Goetschalckx
TSP Example: Clarke and Wright Savings Computations
Tour primitive (1-6-4-1)Max {1050 (6-2-1), 1130 (6-3-1), 1679 (6-5-1), 1056 (4-2-1), 1110 (4-3-1), 1345 (4-5-1)} = 1679 (6-5-1)
Tour primitive (1-4-6-5-1)Max {1056 (1-2-4), 1110 (1-3-4), 768 (1-2-5), 1051 (1-3-5)} = 1110 (1-3-4)
Tour primitive (1-3-4-6-5-1)Max { 813 (1-2-3), 768 (1-2-5)} = 813 (1-2-3)

Logistics Systems Design: Transportation Models 25-Mar-03
Copyright © 1994-2003, Marc Goetschalckx, All rights reserved. 4·39
25-Mar-03 Logistics Systems Design © Marc Goetschalckx
TSP Example:Clarke & Wright Savings
Y-Ax
is
X-Axis1
2
3
4
6
5
base point = 1length = 3141
25-Mar-03 Logistics Systems Design © Marc Goetschalckx
Spacefilling Curve Examples
Serpentine Curve Hilbert Curve (19)
25-Mar-03 Logistics Systems Design © Marc Goetschalckx
TSP Example:Spacefilling Curve
Y-Ax
is
X-Axis1
2
3
4
6
5
length = 3195
25-Mar-03 Logistics Systems Design © Marc Goetschalckx
Christofides’ Heuristic
Construct minimum spanning treeConstruct minimum matching of odd degree nodesFind maximum savings shortcut for nodes with degree four or higher
Worst case performance ratio = 1.5
mink nd
ijk ik kj ijk
c c c>
= + −2
δn s

Logistics Systems Design: Transportation Models 25-Mar-03
Copyright © 1994-2003, Marc Goetschalckx, All rights reserved. 4·40
25-Mar-03 Logistics Systems Design © Marc Goetschalckx
Christofides: Minimum Spanning Tree
Y-Ax
is
X-Axis1
2
3
4
6
5
25-Mar-03 Logistics Systems Design © Marc Goetschalckx
Christofides: Minimum Matching and Max Shortcuts
Minimum matching on {1, 2, 5, 6}Min {(12)+(56)=1118, (15)+(26)=1747, (16)+(25)=2029} = 1118 (12)+(56)
Maximum shortcuts for node {3}Max {265 (2-3-4), 81 (1-3-5), 36 (2-3-5), 22 (1-3-4)} = 265 (24)
25-Mar-03 Logistics Systems Design © Marc Goetschalckx
Christofides: Minimum Spanning Tree and Matching
Y-Ax
is
X-Axis1
2
3
4
6
5
25-Mar-03 Logistics Systems Design © Marc Goetschalckx
Christofides: Max Savings Shortcut
Y-Ax
is
X-Axis1
2
3
4
6
5

Logistics Systems Design: Transportation Models 25-Mar-03
Copyright © 1994-2003, Marc Goetschalckx, All rights reserved. 4·41
25-Mar-03 Logistics Systems Design © Marc Goetschalckx
Symmetric Traveling Salesman Problem Formulation
Min c x
s t x x j
x S S N
ij ijj i
N
i
N
ij jkk j
N
i
jj
ijj S j ii S
= +=
−
= +=
−
∈ >∈
∑∑
∑∑
∑∑
+ = ∀
≤ − ∀ ⊂
11
1
11
12
1
. .
| |,
λ
25-Mar-03 Logistics Systems Design © Marc Goetschalckx
Lagrangean Relaxation of 1-Tree (Held & Karp)
Initialize node degree penalties λ to zeroCompute adjusted distances
Construct minimum spanning tree on {N} - base pointConnect base point with two cheapest edges to spanning tree
d dij ij i jλ λ λ= + +
25-Mar-03 Logistics Systems Design © Marc Goetschalckx
Lagrangean Relaxation of1-Tree cont.
If all node degrees = 2, stopelse update node degree penalties (subgradient method)
Go to step 2
if nd unchangedif nd decreasedif nd increased
i i
i i
i i
=<≥
222
λλλ
25-Mar-03 Logistics Systems Design © Marc Goetschalckx
1-Tree: First Minimum Spanning Tree (Base Point = 1)
Y-Ax
is
X-Axis1
2
3
4
6
5

Logistics Systems Design: Transportation Models 25-Mar-03
Copyright © 1994-2003, Marc Goetschalckx, All rights reserved. 4·42
25-Mar-03 Logistics Systems Design © Marc Goetschalckx
1-Tree: First 1-Tree (Base Point = 1)
Y-Ax
is
X-Axis1
2
3
4
6
5
25-Mar-03 Logistics Systems Design © Marc Goetschalckx
1-Tree: Second 1-Tree (Base Point = 1)
Y-Ax
is
X-Axis1
2
3
4
6
5
25-Mar-03 Logistics Systems Design © Marc Goetschalckx
TSP Example:Tours Illustration
25-Mar-03 Logistics Systems Design © Marc Goetschalckx
Tours Illustration: Test 125

Logistics Systems Design: Transportation Models 25-Mar-03
Copyright © 1994-2003, Marc Goetschalckx, All rights reserved. 4·43
25-Mar-03 Logistics Systems Design © Marc Goetschalckx
Tours Illustration: Test 1024
25-Mar-03 Logistics Systems Design © Marc Goetschalckx
Traveling Salesman Problem References
Lawler, E., J. Lenstra, A. Rinnooy Kan, and D. Shmoys. 1985. “The Traveling Salesman Problem.” John Wiley & Sons, New York, New York.
25-Mar-03 Logistics Systems Design © Marc Goetschalckx
Vehicle Routing Problems Overview
Single Origin-Destination RoutingMultiple Origin-Destination RoutingSingle Vehicle Round-Trip RoutingVehicle Routing and Scheduling
25-Mar-03 Logistics Systems Design © Marc Goetschalckx
Vehicle Routing and SchedulingOverview
Problem definitionVariantsConclusions

Logistics Systems Design: Transportation Models 25-Mar-03
Copyright © 1994-2003, Marc Goetschalckx, All rights reserved. 4·44
25-Mar-03 Logistics Systems Design © Marc Goetschalckx
Vehicle Routing Problem Definition
Goal is to efficiently use a fleet of vehiclesGiven a number of stops to pick up or deliver passenger or goodsUnder a variety of constraints
Vehicle capacityDelivery time restrictionsPrecedence constraints
25-Mar-03 Logistics Systems Design © Marc Goetschalckx
Vehicle Routing Decisions
Which customers served by which vehicle (allocation or clustering)Sequence of stops for each vehicle (sequencing)Number of vehicles (fleet planning)
25-Mar-03 Logistics Systems Design © Marc Goetschalckx
Vehicle Routing Variants
Traveling salesman problemPure vehicle routingLinehaul-backhaulVehicle routing with time windowsVehicle routing and schedulingMixed pickup and delivery
25-Mar-03 Logistics Systems Design © Marc Goetschalckx
Vehicle Routing Algorithms Classification
Route generating versus route selectingBasic methodology

Logistics Systems Design: Transportation Models 25-Mar-03
Copyright © 1994-2003, Marc Goetschalckx, All rights reserved. 4·45
25-Mar-03 Logistics Systems Design © Marc Goetschalckx
Vehicle Routing Algorithms Classification by Required Input
Route generatingLarge varietyTightly capacitated
Route selectingSet partitioning algorithm (SPP)Complex costs and constraints
25-Mar-03 Logistics Systems Design © Marc Goetschalckx
Vehicle Routing Algorithms Classification by Methodology
VRP problem basedSweep, savings, exchange, nearest neighbor
Optimization basedGAP, SPP, k-treesSimulated annealing, tabu search
Artificial intelligence basedGenetic search
25-Mar-03 Logistics Systems Design © Marc Goetschalckx
Pure Vehicle Routing – VRPOverview
Problem definitionMathematical formulationOptimal algorithmsHeuristic algorithmsConclusions
25-Mar-03 Logistics Systems Design © Marc Goetschalckx
VRP Problem Definition
Single depotN customers (xi, yi, demi)
Known location and demandK vehicles (capk)
Known and equal sizeMinimum travel cost objectiveTravel distance norm

Logistics Systems Design: Transportation Models 25-Mar-03
Copyright © 1994-2003, Marc Goetschalckx, All rights reserved. 4·46
25-Mar-03 Logistics Systems Design © Marc Goetschalckx
Vehicle Routing Example: Distance Data
2 1
4
53
D
3
2
2
1
2
4
2
3
5
2
Truck capacity = 1525-Mar-03 Logistics Systems Design © Marc Goetschalckx
Vehicle Routing Example:Demand Data
Customer Demand Distanceto Depot
1 3 42 6 53 4 24 7 25 6 1
Truck capacity = 15
25-Mar-03 Logistics Systems Design © Marc Goetschalckx
VRP Route Generating Algorithms
Route constructionClarke and Wright, nearest neighbor
Route improvementExchange improvements
Two phase algorithmsCluster first, route second– Sweep A, Fisher and Jaikumar (GAP)
Route first, cluster second– Sweep B, great tour
25-Mar-03 Logistics Systems Design © Marc Goetschalckx
Nearest Neighbor
Start a new route with the depotFind nearest unvisited customerIf customer demand is less than remaining vehicle capacity, append customer, otherwise go to 5If all customers are visited stopIf maximum number vehicles is used stop, else go to 1

Logistics Systems Design: Transportation Models 25-Mar-03
Copyright © 1994-2003, Marc Goetschalckx, All rights reserved. 4·47
25-Mar-03 Logistics Systems Design © Marc Goetschalckx
Sweep Algorithm Variants
Cluster first, route second sweep (variant A)
Ray determines clustersTSP construction routines to route each cluster
Route first sweep (variant B)Ray determines routesTSP improvement routines for each initial route
25-Mar-03 Logistics Systems Design © Marc Goetschalckx
Vehicle Routing Example: Distance Data
2 1
4
53
D
3
2
2
1
2
4
2
3
5
2
Truck capacity = 15
25-Mar-03 Logistics Systems Design © Marc Goetschalckx
Vehicle Routing Example:Demand Data
Customer Demand Distanceto Depot
1 3 42 6 53 4 24 7 25 6 1
Truck capacity = 15
25-Mar-03 Logistics Systems Design © Marc Goetschalckx
Number of RoutesMaximum number of routes usually parameter (for example max = 3)Minimum number of routes
1 26min # 1.73 215
N
ii
qroutes
Cap=
= = = =
∑
Logistics Systems Design: Transportation Models 25-Mar-03
Copyright © 1994-2003, Marc Goetschalckx, All rights reserved. 4·48
25-Mar-03 Logistics Systems Design © Marc Goetschalckx
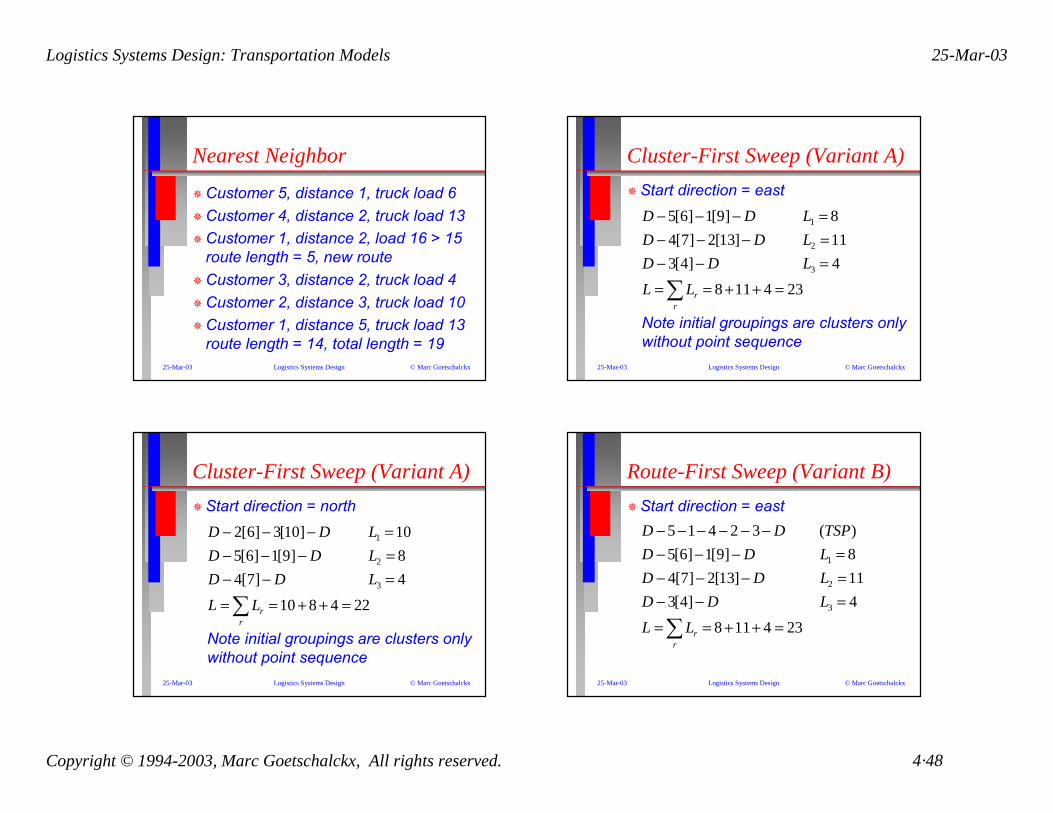
Nearest Neighbor
Customer 5, distance 1, truck load 6Customer 4, distance 2, truck load 13Customer 1, distance 2, load 16 > 15route length = 5, new routeCustomer 3, distance 2, truck load 4Customer 2, distance 3, truck load 10Customer 1, distance 5, truck load 13route length = 14, total length = 19
25-Mar-03 Logistics Systems Design © Marc Goetschalckx
Cluster-First Sweep (Variant A)Start direction = east
1
2
3
5[6] 1[9] 84[7] 2[13] 113[4] 4
8 11 4 23rr
D D LD D LD D L
L L
− − − =− − − =− − =
= = + + =∑Note initial groupings are clusters only without point sequence
25-Mar-03 Logistics Systems Design © Marc Goetschalckx
Cluster-First Sweep (Variant A)Start direction = north
1
2
3
2[6] 3[10] 105[6] 1[9] 84[7] 4
10 8 4 22rr
D D LD D LD D L
L L
− − − =− − − =− − =
= = + + =∑Note initial groupings are clusters only without point sequence
25-Mar-03 Logistics Systems Design © Marc Goetschalckx
Route-First Sweep (Variant B)Start direction = east
1
2
3
5 1 4 2 3 ( )5[6] 1[9] 84[7] 2[13] 113[4] 4
8 11 4 23rr
D D TSPD D LD D LD D L
L L
− − − − − −− − − =− − − =− − =
= = + + =∑

Logistics Systems Design: Transportation Models 25-Mar-03
Copyright © 1994-2003, Marc Goetschalckx, All rights reserved. 4·49
25-Mar-03 Logistics Systems Design © Marc Goetschalckx
Clarke and Wright Savings
Maximum number of routes = KSerial variant
One route at-a-timeSimpler implementation
Parallel variantNo more than K routes at-a-timeMore complex programming
25-Mar-03 Logistics Systems Design © Marc Goetschalckx
Clarke and Wright SavingsInitial Savings (Common)
Compute savings for every feasible pair of points
1 2
12 10 02 12
1 4
14 40 01 14
3 6 9 154 5 5 4
3 7 10 154 2 2 4
q qs d d d
q qs d d d
+ = + = ≤= + − = + − =
+ = + = ≤= + − = + − =
25-Mar-03 Logistics Systems Design © Marc Goetschalckx
Clarke and Wright SavingsInitial Savings Matrix
1 2 3 4 51 4 2 4 22 4 4 3 03 2 4 2 04 4 3 2 15 2 0 0 1
Selected pair (1-2) with ties broken by first encountered maximum savings
25-Mar-03 Logistics Systems Design © Marc Goetschalckx
Serial Clarke and Wright Savings: Second Iteration
Copy corresponding savings rows and columns, eliminating infeasible combinations(4-1-2),(1-2-4) = 3+6+7=16 > 15
(1-2) 3 4 5(1-2) 4 0
3 245 2

Logistics Systems Design: Transportation Models 25-Mar-03
Copyright © 1994-2003, Marc Goetschalckx, All rights reserved. 4·50
25-Mar-03 Logistics Systems Design © Marc Goetschalckx
Serial Clarke and Wright Savings: Third Iteration
Capacity infeasibilities eliminate all positive savingsNo feasible or profitable extension of the route, so start a new route
(1-2-3) 4 5(1-2-3)
45
25-Mar-03 Logistics Systems Design © Marc Goetschalckx
Serial Clarke and Wright Savings: Third Iteration
Eliminate all visited point rows and columns from the savings matrix and restart
4 54 15 1
(1 2 3) (4 5) 14 5 19L L L− − −= + = + =
25-Mar-03 Logistics Systems Design © Marc Goetschalckx
Parallel Clarke and Wright Savings: Second Iteration
Maximum two routesCopy corresponding rows and columns, eliminating infeasible combinations
(1-2) 3 4 5(1-2) 4 0
3 2 2 04 2 15 2 0 1
25-Mar-03 Logistics Systems Design © Marc Goetschalckx
Parallel Clarke and Wright Savings: Third Iteration
All partial routes remain “extendable”
(1 2 3) (4 5) 14 5 19L L L− − −= + = + =
(1-2-3) 4 5(1-2-3)
4 15 1

Logistics Systems Design: Transportation Models 25-Mar-03
Copyright © 1994-2003, Marc Goetschalckx, All rights reserved. 4·51
25-Mar-03 Logistics Systems Design © Marc Goetschalckx
Improvement Algorithms
Intra-route improvements (TSP)Always feasible2 exchange, chain exchange, 3 exchange
Inter-route improvementsTest and make only feasible exchangesMove (one point to another route)Swap (exchange two points between two routes)
25-Mar-03 Logistics Systems Design © Marc Goetschalckx
VRP GAP Formulation:Clustering
( )
{ }
1
0
min
. .
1 1..
0,1
k ikkN
i ik ki
kk
ikk
ik
f y
s t dem y cap k
y K
y i N
y
=
≤ ∀
=
= =
∈
∑
∑
∑
∑
25-Mar-03 Logistics Systems Design © Marc Goetschalckx
VRP GAP Formulation:Routing
f y c x
s t x y jk
x y ik
x S S N y
x
ik ij ijkji
ijki
jk
ijkj
ik
ijkj Si S
ik
ijk
a f
k p
=
= ∀
= ∀
≤ − ⊆
∈
∑∑
∑
∑
∑∑∈∈
min
. .
( )
,
1
0 125-Mar-03 Logistics Systems Design © Marc Goetschalckx
VRP GAP Formulation:Linearized Clustering
Heuristic approximationsk seed (customer) for route kMany variants for dik andseed selection
( )ik ik iki
f y d y=∑0 0k kik i is sd c c c= + −

Logistics Systems Design: Transportation Models 25-Mar-03
Copyright © 1994-2003, Marc Goetschalckx, All rights reserved. 4·52
25-Mar-03 Logistics Systems Design © Marc Goetschalckx
GAP CharacteristicsAlternative generating algorithmPredominant importance of capacity constraintsMathematical programming based algorithm (requires solver)Strongly capacitated or strongly combinatorial problems
25-Mar-03 Logistics Systems Design © Marc Goetschalckx
Set Partitioning Problem (SPP) Definition
Every column j = feasible alternative actionEvery row i = service requestMinimize overall cost while servicing all requests
25-Mar-03 Logistics Systems Design © Marc Goetschalckx
Set Partitioning Notation
aij = 1 if alternative server j satisfiescustomer request icj = cost of alternative jpi = cost estimate for servicing customer request ixj = 1 if server j is selected (enabled)
25-Mar-03 Logistics Systems Design © Marc Goetschalckx
Set Partitioning Formulation
min
. . ..
,
c x
s t a x i M
x
j jj
N
ij jj
N
j
=
=
∑
∑ = =
∈
1
11 1
0 1k p

Logistics Systems Design: Transportation Models 25-Mar-03
Copyright © 1994-2003, Marc Goetschalckx, All rights reserved. 4·53
25-Mar-03 Logistics Systems Design © Marc Goetschalckx
Set Partitioning Characteristics
Alternative selecting algorithmAccurate costs and feasibility constraintsOptimal solution for “small” problem sizes (IP solver)Efficient column generation and pricingComplex problems
25-Mar-03 Logistics Systems Design © Marc Goetschalckx
Set Partitioning AlgorithmStart with a feasible partition J+
Determine row prices by allocating column prices “equitable” such that
c a pj ij ii
M+
== ∑
1
VRP example: p dem ddem d
cii i
i ii J
j
i
= ⋅⋅
∈
+∑
00
25-Mar-03 Logistics Systems Design © Marc Goetschalckx
Set Partitioning Algorithm (2)
Generate and evaluate new column j, if
add column j to the partitioning problemIf enough new columns are added, solve the partitioning problemelse go to step 3
c a pj ij ii
M− ≤
=∑ 0
1
25-Mar-03 Logistics Systems Design © Marc Goetschalckx
Set Partitioning Algorithm (3)If all columns have been evaluated or solution is within tolerance, stopelse go to step 2

Logistics Systems Design: Transportation Models 25-Mar-03
Copyright © 1994-2003, Marc Goetschalckx, All rights reserved. 4·54
25-Mar-03 Logistics Systems Design © Marc Goetschalckx
Set Partitioning Example: Distance Data
2 1
4
53
D
3
2
2
1
2
4
2
3
5
2
Truck Capacity = 1525-Mar-03 Logistics Systems Design © Marc Goetschalckx
Set Partitioning Example:Demand Data
Customer Demand Distance Distance *to Depot Demand
1 3 4 122 6 5 303 4 2 84 7 2 145 6 1 6
Truck Capacity = 15
25-Mar-03 Logistics Systems Design © Marc Goetschalckx
Set Partition Example: One-Stop Routes Excel Data
25-Mar-03 Logistics Systems Design © Marc Goetschalckx
Set Partition Example: One-Stop Routes Excel Solver

Logistics Systems Design: Transportation Models 25-Mar-03
Copyright © 1994-2003, Marc Goetschalckx, All rights reserved. 4·55
25-Mar-03 Logistics Systems Design © Marc Goetschalckx
Set Partition Example: One-Stop Routes Excel Solver Options
25-Mar-03 Logistics Systems Design © Marc Goetschalckx
Set Partition Example: One-Stop Routes Excel Solution
25-Mar-03 Logistics Systems Design © Marc Goetschalckx
Set Partitioning Example:Two Customer Routes
Route Customer Customer Length SavingsOne Two
6 1 2 14 47 1 3 10 28 1 4 8 49 1 5 8 2
10 2 3 10 411 2 4 11 312 2 5 12 013 3 4 6 214 3 5 6 015 4 5 5 1
25-Mar-03 Logistics Systems Design © Marc Goetschalckx
Set Partition Example: Two Customer Routes Excel Data

Logistics Systems Design: Transportation Models 25-Mar-03
Copyright © 1994-2003, Marc Goetschalckx, All rights reserved. 4·56
25-Mar-03 Logistics Systems Design © Marc Goetschalckx
Set Partition Example: Two Customer Routes Excel Solver
25-Mar-03 Logistics Systems Design © Marc Goetschalckx
Set Partition Example: Two Customer Routes Excel Solution
25-Mar-03 Logistics Systems Design © Marc Goetschalckx
Set Partitioning Example:Two Customer Row Prices
j Ic p p
p
p
j
= == + =
= ⋅ = ⋅ =
= ⋅ = ⋅ =
8 1 48 8
1226
8 0 46 8 369
1426
8 0 54 8 4 31
8
1 4
1
4
{ , }
. .
. .
j Ic p p
p
p
j
= == + =
= ⋅ = ⋅ =
= ⋅ = ⋅ =
10 2 310 10
3038
10 0 79 10 7 89
838
10 0 21 10 211
10
2 3
2
3
{ , }
. .
. .
j I c p= = = =5 5 25 5 5{ }
25-Mar-03 Logistics Systems Design © Marc Goetschalckx
Set Partitioning Example:Three Customer Routes
Route Customer Customer Customer Route Route SavingsOne Two Three Demand Length
16 1 2 3 13 14 -0.3117 1 3 2 13 16 -2.3118 2 1 3 13 16 -2.3119 1 2 5 14 16 -2.4220 1 5 2 14 18 -4.4221 2 1 5 14 14 -0.4222 1 3 4 14 12 -1.8923 1 4 3 14 10 0.1124 3 1 4 14 10 0.1125 1 3 5 13 12 -4.2026 1 5 3 13 12 -4.2027 5 1 3 13 10 -2.20

Logistics Systems Design: Transportation Models 25-Mar-03
Copyright © 1994-2003, Marc Goetschalckx, All rights reserved. 4·57
25-Mar-03 Logistics Systems Design © Marc Goetschalckx
Set Partition Example: Three-Stop Routes Excel Data
25-Mar-03 Logistics Systems Design © Marc Goetschalckx
Set Partition Example: Three-Stop Routes Excel Solver
25-Mar-03 Logistics Systems Design © Marc Goetschalckx
Set Partition Example: Three-Stop Routes Excel Solution
25-Mar-03 Logistics Systems Design © Marc Goetschalckx
Set Partitioning ReferencesCullen F., Jarvis J. and Ratliff H., (1981). "Set Partitioning Based Heuristics for Interactive Routing." Networks, Vol. 11, No. 2, pp. 125-143.
Balas E. and Padberg M., (1976). "Set Partitioning: A Survey." SIAM Review, Vol. 18, No. 4, pp. 710-760.

Logistics Systems Design: Transportation Models 25-Mar-03
Copyright © 1994-2003, Marc Goetschalckx, All rights reserved. 4·58
25-Mar-03 Logistics Systems Design © Marc Goetschalckx
Linehaul-Backhaul Problem -VRPB
#1 savings technique in routingProblem definitionMathematical formulationHeuristics algorithmsSoftwareConclusions
25-Mar-03 Logistics Systems Design © Marc Goetschalckx
VRPB Problem Definition
Single depotNL customers (xi, yi, demi) andNB suppliers (xi, yi, supi)M equal size vehicles (capj)Rear loaded vehicles
all customers before any supplierMinimize total travel distanceTravel distance norm
25-Mar-03 Logistics Systems Design © Marc Goetschalckx
VRPB Route Illustration
25-Mar-03 Logistics Systems Design © Marc Goetschalckx
Lineback Illustration:100 x 100 x 10

Logistics Systems Design: Transportation Models 25-Mar-03
Copyright © 1994-2003, Marc Goetschalckx, All rights reserved. 4·59
25-Mar-03 Logistics Systems Design © Marc Goetschalckx
Lineback Illustration:1024 x 4 x 60
25-Mar-03 Logistics Systems Design © Marc Goetschalckx
VRPB Exercise: Case 51-66 Data
25-Mar-03 Logistics Systems Design © Marc Goetschalckx
Vehicle Routing with Time Windows VRPTW
Time window is a restriction on the time of visiting the customerTypes of time windows
Exclusion versus mandatorySingle versus multipleHard versus soft
25-Mar-03 Logistics Systems Design © Marc Goetschalckx
VRPTW CharacteristicsMuch more difficult problem than classical VRP
No simple algorithmsNo easy feasible testNo easy human intuitionNo intuitive route structure
Solution procedures use mathematical programming or stochastic search

Logistics Systems Design: Transportation Models 25-Mar-03
Copyright © 1994-2003, Marc Goetschalckx, All rights reserved. 4·60
25-Mar-03 Logistics Systems Design © Marc Goetschalckx
Vehicle Routing ReferencesGolden, B. and A. Assad, (Editors.), 1988. Vehicle Routing: Methods and Studies. North Holland, Amsterdam.Halse, K. 1992. “Modeling and Solving Complex Vehicle Routing Problems.” Ph.D. Dissertation, Technical University of Denmark.Ball, M., T. Magnanti, C. Monma, andG. Nemhauser (Editors), 1995. Network Routing. North-Holland, Amsterdam.