Transportation & Logistics
29
Transportation & Logistics Anthony P. Gallo, CFA (410) 625-6319 office, (410) 382-7084 mobile [email protected] Michael R. Busche (704) 715-6406 office, (910) 987-1363 mobile michael [email protected] Understanding CSA All estimates/forecasts are as of 12/03/2012 unless otherwise stated. Please see page 27 for rating definitions, important disclosures and required analyst certifications. Wells Fargo Securities, LLC does and seeks to do business with companies covered in its research reports. As a result, investors should be aware that the firm may have a conflict of interest that could affect the objectivity of the report and investors should consider this report as only a single factor in making their investment decision. December 2012
-
Upload
hilary-arnold -
Category
Documents
-
view
35 -
download
1
description
Anthony P. Gallo, CFA (410) 625-6319 office, (410) 382-7084 mobile [email protected] Michael R. Busche (704) 715-6406 office, (910) 987-1363 mobile michael [email protected] Understanding CSA. Transportation & Logistics. December 2012. - PowerPoint PPT Presentation
Transcript of Transportation & Logistics

Transportation & Logistics
Anthony P. Gallo, CFA (410) 625-6319 office, (410) 382-7084 mobile
Michael R. Busche (704) 715-6406 office, (910) 987-1363 mobile
Understanding CSA
All estimates/forecasts are as of 12/03/2012 unless otherwise stated.
Please see page 27 for rating definitions, important disclosures and required analyst certifications.
Wells Fargo Securities, LLC does and seeks to do business with companies covered in its research reports. As a result, investors should be aware that the firm may have a conflict of interest that could affect the objectivity of the report and investors should consider this report as only a single factor in making their investment decision.
December 2012

December 2012 Wells Fargo Securities, LLC2
Agenda
Understanding CSA
The State of the Trucking Industry
Q & A

December 2012 Wells Fargo Securities, LLC3
“Good Intentions, Unclear Outcomes”
FMCSA mission is to reduce crashes, injuries and fatalities involving large trucks and buses Identify unsafe motor carriers for intervention, Identify safety performance within broad areas at carriers, Monitor safety performance on a near-continuous basis
Compliance, Safety, Accountability (CSA) was developed in furtherance of this mission and to focus limited resources on the most problematic carriers
CSA assigns percentile rankings in seven “BASICs” (Behavior Analysis and Safety Improvement Categories) Unsafe Driving, Fatigued Driving, Driver Fitness, Controlled
Substances, Vehicle Maintenance, Cargo-Related and Crash Indicator
On May 16, 2012 FMCSA essentially placed due diligence responsibilities on brokers, shippers and insurers.

December 2012 Wells Fargo Securities, LLC4
Our findings
No meaningful statistical relationship (using simple regression analysis) between unfavorable BASIC scores and actual accident incidence,
A Federal program executed at the State level with unexplainable differences in State enforcement and inspection protocols,
Severity weights that did not appear to accurately capture driving behaviors that lead to accidents,
Disproportionate inspection rate for small carriers,
Potential negative “feedback loop”,
Problematic crash reporting.
Wells Fargo Securities; three studies, most recently across a universe of 4,600 carriers with at least 50 inspections.

December 2012 Wells Fargo Securities, LLC5
What others have found
UMTRI: high correlation between BASIC scores and crash rates
Wells Fargo Securities: no meaningful statistical relationships, only modestly higher accident rates for above threshold carriers, various problems with the program
“University of Maryland, Gimpel study”: highlights problems with selection bias
Transplace, Iyoob: refutes several UMTRI findings
ATRI: strong safety relationship for Unsafe Driving, Fatigued Driving, and Vehicle Maintenance, no positive relationship between Driver Fitness and Controlled Substance,/Alcohol BASIC.
No study has introduced control variables, such as time of day, traffic density or other factors that influence crashes and safety

December 2012 Wells Fargo Securities, LLC6
We think the scope of CSA is limited
Number of Carriers with I nspections and BASIC Scores for Nationwide Carrier Fleet, March 2012
Inspections Carriers # with Scores % with Scores No Scores1 79,713 96 0.1% 79,6172 46,254 84 0.2% 46,1703 32,190 815 2.5% 31,3754 23,651 1,392 5.9% 22,2595 18,254 2,734 15.0% 15,5206 14,488 3,560 24.6% 10,928
7 11,761 3,963 33.7% 7,7988 9,680 4,191 43.3% 5,4899 8,010 4,108 51.3% 3,90210 6,608 3,865 58.5% 2,74311 5,714 3,638 63.7% 2,07612 4,916 3,413 69.4% 1,50313 4,416 3,249 73.6% 1,16714 3,686 2,832 76.8% 85415 3,396 2,695 79.4% 70116 2,939 2,435 82.9% 50417 2,570 2,143 83.4% 427
18 2,426 2,102 86.6% 324
19 2,113 1,868 88.4% 24520+ 43,555 41,991 96.4% 1,564Totals 326,340 91,174 27.9% 235,166Source: FMCSA

December 2012 Wells Fargo Securities, LLC7
Accidents versus BASIC categories
Correl: .019
R2: .000
Source: FMCSA, Wells Fargo Securities, LLC
.0x
10.0x
20.0x
30.0x
40.0x
50.0x
0% 10% 20% 30% 40% 50% 60% 70% 80% 90% 100%
Acc
ide
nts
per
Mill
ion
Mile
s
Unsafe Driving BASIC
Top 4600 N.A. Trucking Companies
Correl: .031
R2: .001
Source: FMCSA, Wells Fargo Securities, LLC
.0x
10.0x
20.0x
30.0x
40.0x
50.0x
0% 10% 20% 30% 40% 50% 60% 70% 80% 90% 100%
Acc
ide
nts
per
Mill
ion
Mile
s
Fatigued Driving BASIC
Top 4600 N.A. Trucking Companies

December 2012 Wells Fargo Securities, LLC8
Snapshot of publicly traded trucking company CSA BASICs
Correl: .052
R2: .003
Source: FMCSA, Wells Fargo Securities, LLC
Top 20 N.A. Trucking Companies
.0x
.2x
.4x
.6x
.8x
1.0x
1.2x
1.4x
0.0% 10.0% 20.0% 30.0% 40.0% 50.0% 60.0% 70.0%
Fatiqued Driving BASIC
Acc
iden
ts p
er M
illoi
on
Mile
s
ABFS
CNW
ODFL
HTLD
J BHTHUBG
WERN
LSTR
SWFT
CNW KNX
KNX
LSTR
R
FDX
UP S

December 2012 Wells Fargo Securities, LLC9
Snapshot of publicly traded trucking company CSA BASICs
Correl: .148
R2: .022
Source: FMCSA, Wells Fargo Securities, LLC
Top 20 N.A. Trucking Companies
.2x
.4x
.6x
.8x
1.0x
1.2x
1.4x
0.0% 10.0% 20.0% 30.0% 40.0% 50.0% 60.0% 70.0%
Unsafe Driving BASI C
Acc
iden
ts p
er M
illio
n M
iles
ABFS
CNW
ODFL
HTLD
J BHT HUBG
WERN
LSTR
SWFTCNW
KNX
KNX
LSTR
R
FDX
UP S

December 2012 Wells Fargo Securities, LLC10
A simple regression analysis showed very low correlations
CSA Correlation ComparisonAccidents per Million
Miles
Accidents per 100 Power Units
I nspection per Power
Unit
Unsafe Driver BASIC Correlation 0.019 0.116 0.301
Unsafe Driver BASIC R2 0.000 0.013 0.091
Fatigued Driver BASIC Correlation 0.031 0.122 0.290
Fatigued Driver BASIC R2 0.001 0.015 0.084
Unsafe Driver BASIC Correlation 0.024 0.104 0.258
Unsafe Driver BASIC R2 0.001 0.011 0.067
Fatigued Driver BASIC Correlation 0.199 0.082 0.073
Fatigued Driver BASIC R2 0.040 0.007 0.005
Unsafe Driver BASIC Correlation 0.062 -0.007 0.221
Unsafe Driver BASIC R2 0.004 0.000 0.049
Fatigued Driver BASIC Correlation 0.202 0.061 0.124
Fatigued Driver BASIC R2 0.041 0.004 0.015
Note: Values are statistical median
Source: FMCSA, Wells Fargo Securities, LLC
To
tal
450
0
Ca
rrie
rsA
bove
Th
resh
old
Be
low
Th
resh
old

December 2012 Wells Fargo Securities, LLC11
Above Threshold carriers in certain BASICs did have higher accident rates
CSA Summary Statistics
Accidents per Million
MilesStandard Deviation
Accidents per 100 Power Units
Standard Deviation
Unsafe Driver BASIC Total .98x 1.21x 7.26x 5.77xUnsafe Driver BASIC Above Threshold 1.00x 1.24x 7.89x 6.87xUnsafe Driver BASIC Below Threshold .97x 1.21x 7.14x 5.44x
Fatigued Driver BASIC Total .98x 1.21x 7.26x 5.77xFatigued Driver BASIC Above Threshold 1.16x 1.25x 9.84x 6.08xFatigued Driver BASIC Below Threshold .87x 1.18x 6.00x 5.05x
Driver Fitness BASIC Total .98x 1.21x 7.26x 5.77xDriver Fitness BASIC Above Threshold .98x 1.22x 7.14x 5.91xDriver Fitness BASIC Below Threshold .98x 1.20x 7.53x 5.19x
Vehicle Maint BASIC Total .98x 1.21x 7.26x 5.77xVehicle Maint BASIC Above Threshold 1.21x 1.61x 8.89x 6.66xVehicle Maint BASIC Below Threshold .89x .93x 6.59x 5.04x
Note: Values are statistical median
Source: FMCSA, Wells Fargo Securities, LLC

December 2012 Wells Fargo Securities, LLC12
Inconsistent enforcement among states and jurisdictions
Source: Viggilo, LLC; Wells Fargo Securities, LLC Source: Viggilo, LLC; Wells Fargo Securities, LLC
Source: Viggilo, LLC; Wells Fargo Securities, LLC Source: Viggilo, LLC; Wells Fargo Securities, LLC
Speeding (1-5 miles per hour)
Remaining States, 64.5%
I ndiana, 35.5%
False Logbook
RemainingStates, 59.1% Oregon,
16.7%
Arizona, 24.1%
Percent of National Violations: UNSAFE DRIVING BASIC: 1 Point Percent of National Violations: FATIGUED DRIVING BASIC: 7 Points
Failure to Wear Seat Belt
Remaining Sates, 84.20%
Arizona, Texas,& California
8.19%
Maine, 7.60%
Percent of National Violations: UNSAFE DRIVING BASIC: 7 Points Percent of National Violations: FATIGUED DRIVING BASIC: 7 Points
Requiring or Permitting Driver to Drive more than 11 Hours
Remaining States, 70.3%
Arizona, Georgia,
& Missouri, 29.7%
Source: Vigillo, LLC and Wells Fargo Securities, LLC
Source: Vigillo, LLC and Wells Fargo Securities, LLC
Source: Vigillo, LLC and Wells Fargo Securities, LLC
Source: Vigillo, LLC and Wells Fargo Securities, LLC

December 2012 Wells Fargo Securities, LLC13
Fatigued Driving severity weights and violation description
Section
Violation Description Shown on Driver/Vehicle Examination Report Given to CMV Driver after Roadside Inspection Violation Group Description
Violation Severity
Weight[2]
Violation in the DSMS
(Y/N)392.2H State/Local Hours of Service (HOS) Hours 7 Y392.3 Operating a CMV while ill/fatigued Jumping OOS/Driving Fatigued 10 Y395.1(h)(1) 15, 20, 70/80 HOS violations (Alaska-Property) Hours 7 Y395.1(h)(2) 15, 20, 70/80 HOS violations (Alaska-Passenger) Hours 7 Y395.1(h)(3) Adverse driving conditions violations (Alaska) Hours 7 Y395.1(o) 16 hour rule violation (Property) Hours 7 Y
395.3(a)(1)Requiring or permitting driver to drive more than 11 hours Hours 7 Y
395.3A1R 11 hour rule violation (Property) Hours 7 Y
395.3(a)(2)Requiring or permitting driver to drive after 14 hours on duty Hours 7 Y
395.3A2R 14 hour rule violation (Property) Hours 7 Y395.3(b) 60/70- hour rule violation Hours 7 Y395.3BR 60/70 hour rule violation (Property) Hours 7 Y395.3(c) 34- hour restart violation (Property) Hours 7 Y395.5(a)(1) 10- hour rule violation (Passenger) Hours 7 Y395.5(a)(2) 15- hour rule violation (Passenger) Hours 7 Y395.5(b) 60/70- hour rule violation (Passenger) Hours 7 Y395.8 Log violation (general/form and manner) Other Log/Form & Manner 2 Y395.8(a) No drivers record of duty status Incomplete/Wrong Log 5 Y395.8(e) False report of drivers record of duty status False Log 7 Y395.8(f)(1) Drivers record of duty status not current Incomplete/Wrong Log 5 Y395.8(k)(2) Driver failing to retain previous 7 days’ logs Incomplete/Wrong Log 5 Y395.13(d) Driving after being declared out-of-service Jumping OOS/Driving Fatigued 10 Y
395.15(b)Onboard recording device information requirements not met EOBR Related 1 Y
395.15(c) Onboard recording device improper form and manner EOBR Related 1 Y
395.15(f)Onboard recording device failure and driver failure to reconstruct duty status EOBR Related 1 Y
395.15(g) On-board recording device information not available EOBR Related 1 Y
395.15(i)(5)Onboard recording device does not display required information. EOBR Related 1 N
398.6Violation of hours of service regulations—migrant workers Hours 7 Y
Source: FMCSA

December 2012 Wells Fargo Securities, LLC14
The strongest relationship we observed was inspections to scores
Correl: .290
R2: .084
Source: FMCSA, Wells Fargo Securities, LLC
.0x
1.0x
2.0x
3.0x
4.0x
5.0x
6.0x
7.0x
0% 10% 20% 30% 40% 50% 60% 70% 80% 90% 100%
Insp
ect
ion
per
Pow
er
Un
it
Fatigued Driving BASIC
Top 4600 N.A. Trucking Companies

December 2012 Wells Fargo Securities, LLC15
Small carriers appear to have disproportionate inspection rates
Source: FMCSA, Wells Fargo Securities, LLC
Carrier Comparison by Fleet Size
178 216
413
1,047
1,368 1,379
0
200
400
600
800
1,000
1,200
1,400
1,600
Above 1000 500 to 999 250 to 499 100 to 249 50 to 99 25 to 49
Number of Trucks in Fleet
Nu
mb
er
of
Ca
rrie
rs
Fleet Size Comparison Median
% of totalNumber of
CarriersNumber of
P ower UnitsInspection per mm
milesInspection per
P ower Unit
178 Above 1000 1.57x .96x
216 500 to 999 1.69x 1.15x
413 250 to 499 1.96x 1.28x
1,047 100 to 249 2.07x 1.45x
1,368 50 to 99 2.23x 1.62x
1,379 25 to 49 2.56x 2.00x
Total: 4,601 Median: 2.19x 1.59x
Source: FMCSA and Wells Fargo Securities, LLC
18
%8
2%

December 2012 Wells Fargo Securities, LLC16
Industry wide inspection statistics
Average: 3.05x
Source: FMCSA, Wells Fargo Securities, LLC
Top 4600 Carriers Inspections per Million Miles
.0x
10.0x
20.0x
30.0x
40.0x
50.0x
Average: 1.85x
Source: FMCSA, Wells Fargo Securities, LLC
Top 4600 Carriers Inspections per 100 Power Units
.0x
2.0x
4.0x
6.0x
8.0x
10.0x
12.0x
14.0x
16.0x
18.0x
20.0x

December 2012 Wells Fargo Securities, LLC
Potential negative feedback loop
17

December 2012 Wells Fargo Securities, LLC18
Lack of “responsibility” assigned to accidents is problematic in our view
Data for Calander year 2011 Crashes with Driver-Related Factors Recorded
For Large Truck For Passenger Vehicle
Crash TypeFatal
Crashes Number Percent Number PercentLarge Truck Rear-Ending Passenger Vehicle 73 36 49.3% 33 45.2%Passenger Vehicle Rear-Ending Large Truck 290 49 16.9% 224 77.2%Large Truck Crossing Center Median (Head-On) 50 29 58.0% 23 46.0%Passenger Vehicle Crossing Center Median (Head-On) 288 18 6.3% 276 95.8%Large Truck Striking Passenger Vehicle (Other) 504 123 24.4% 403 80.0%Passenger Vehicle Striking Large Truck (Other) 419 99 23.6% 345 82.3%Other Collision 85 22 25.9% 72 84.7%Total 1,709 376 22.0% 1,376 80.5%
Source: National Highway Traffic Safety Administration, Fatality Analysis Reporting System (FARS)

December 2012 Wells Fargo Securities, LLC19
FMCSA commentary demonstrates program limitations

December 2012 Wells Fargo Securities, LLC20
Might shippers, brokers and insurers be confused?
FMCSA properly uses BASICs for safety interventions and prioritization, but makes BASIC scores available to the public, All motor carriers are lumped together despite vast differences in
operations (LTL, long-haul TL, dedicated fleets, parcel, etc.)
FMCSA explains that “BASIC assessments are not safety ratings” …but “believes [BASICs] provide users…informed, current and
comprehensive picture of a motor carrier’s safety and compliance…”
Only 19% of active carriers have at least one BASIC score
Nearly 58% of active carriers have insufficient data to have a BASIC score
54% of carriers with a BASIC score have had fewer than 20 inspections
Nearly 57% of crashes are from carriers with NO scores above threshold

December 2012 Wells Fargo Securities, LLC21
Agenda
Understanding CSA
The State of the Trucking Industry
Q & A

December 2012 Wells Fargo Securities, LLC22
A very fragmented industry
United States Truckload Industry 2011E $239 Billion
Source: Wells Fargo Securities, LLC estimates
Remaining TL Market, 90%
Top 25 Share, 10%

December 2012 Wells Fargo Securities, LLC23
Driver turnover remains an industry headwind
Source: ATA, Wells Fargo Securities, LLC
Truckload Annualized Driver Turnover Rates
0%
20%
40%
60%
80%
100%
120%
Q210 Q310 Q410 Q111 Q211 Q311 Q411 Q112 Q212
Pe
rce
nta
ge
%
Large TL Small TL

December 2012 Wells Fargo Securities, LLC24
Industry fleet age is at all time highs…
Source: ACT Research Co. and Wells Fargo Securities, LLC
Average Fleet Age: U.S. Class 8 Active Population
5.3
5.5
5.7
6.1
6.36.3
6.36.4
6.4
6.16.0
6.1
6.3 6.3
6.0
5.6
5.4 5.45.5 5.5
5.3 5.3
5.6
5.8
5.95.9
5.85.7
6.0
6.2
6.5
6.7 6.7
6.6
6.4
6.16.0
6.1
5.00
5.25
5.50
5.75
6.00
6.25
6.50
6.75
7.00
1979 1981 1983 1985 1987 1989 1991 1993 1995 1997 1999 2001 2003 2005 2007 2009 2011 2013E 2015E
Ag
e i
n Y
ea
rs
December 2012 Wells Fargo Securities, LLC25
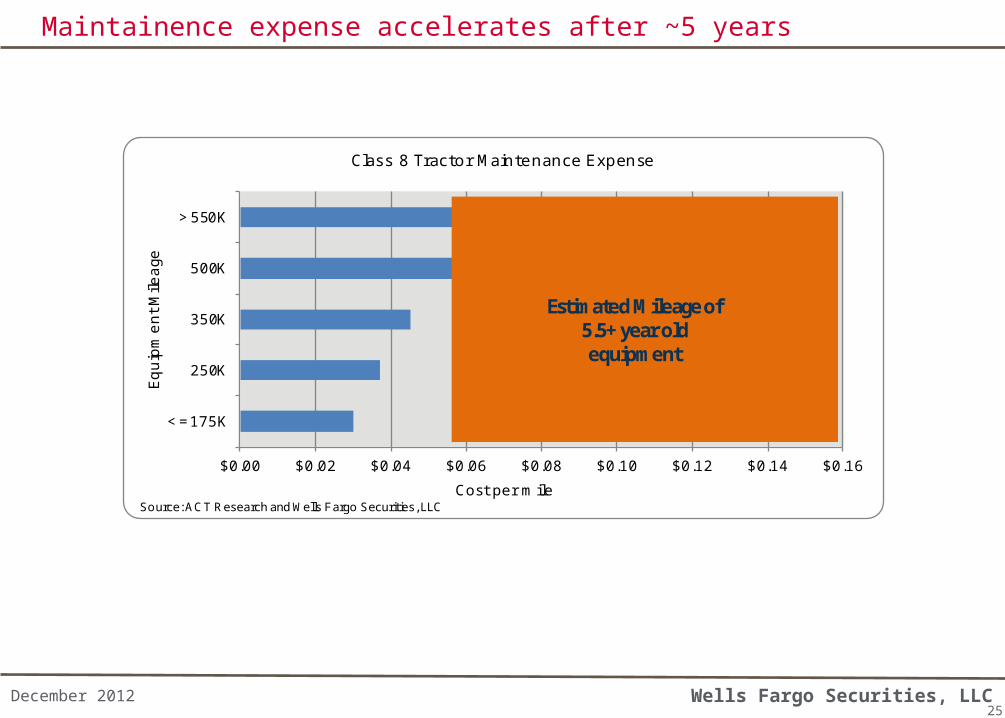
Maintainence expense accelerates after ~5 years
Source: ACT Research and Wells Fargo Securities, LLC
$0.00 $0.02 $0.04 $0.06 $0.08 $0.10 $0.12 $0.14 $0.16
<=175K
250K
350K
500K
>550K
Cost per mile
Eq
uip
me
nt
Mile
age
Class 8 Tractor Maintenance Expense
Estimated Mileage of 5.5+ year old equipment

December 2012 Wells Fargo Securities, LLC26
Equipment prices have grown consistently over the past 5 years
Source: ATA and Wells Fargo Securities, LLC
$45$75
$105
$50
$50$20
$0
$25
$50
$75
$100
$125
$150
2006 2011 2011
Eq
uip
me
nt
Co
st in
00
0's
Equipment Finance Differential
Financing Tractor Trade
New Tractor $95K
New Tractor $125K
7-yr old tractor trade $20K

December 2012 Wells Fargo Securities, LLC27
Agenda
Understanding CSA
The State of the Trucking Industry
Q & A

December 2012 Wells Fargo Securities, LLC28
Disclosures
Additional Information Available Upon Request I certify that: 1) All views expressed in this research report accurately reflect my personal views about any and all of the subject securities or issuers discussed; and 2) No part of my compensation was, is, or will be, directly or indirectly, related to the specific recommendations or views expressed by me in this research report. Wells Fargo Securities, LLC does not compensate its research analysts based on specific investment banking transactions. Wells Fargo Securities, LLC’s research analysts receive compensation that is based upon and impacted by the overall profitability and revenue of the firm, which includes, but is not limited to investment banking revenue. STOCK RATING 1=Outperform: The stock appears attractively valued, and we believe the stock's total return will exceed that of the market over the next 12 months. BUY 2=Market Perform: The stock appears appropriately valued, and we believe the stock's total return will be in line with the market over the next 12 months. HOLD 3=Underperform: The stock appears overvalued, and we believe the stock's total return will be below the market over the next 12 months. SELL
SECTOR RATING O=Overweight: Industry expected to outperform the relevant broad market benchmark over the next 12 months. M=Market Weight: Industry expected to perform in-line with the relevant broad market benchmark over the next 12 months. U=Underweight: Industry expected to underperform the relevant broad market benchmark over the next 12 months.
VOLATILITY RATING V = A stock is defined as volatile if the stock price has fluctuated by +/ -20% or greater in at least 8 of the past 24 months or if the analyst expects significant volatility. All IPO stocks are automatically rated volatile within the first 24 months of trading.
As of: 11/30/2012
49% of companies covered by Wells Fargo Securities, LLC Equity Research are rated Outperform.
Wells Fargo Securities, LLC has provided investment banking services for 44% of its Equity Research Outperform-rated companies.
49% of companies covered by Wells Fargo Securities, LLC Equity Research are rated Market Perform.
Wells Fargo Securities, LLC has provided investment banking services for 35% of its Equity Research Market Perform-rated companies.
2% of companies covered by Wells Fargo Securities, LLC Equity Research are rated Underperform.
Wells Fargo Securities, LLC has provided investment banking services for 21% of its Equity Research Underperform-rated companies.

December 2012 Wells Fargo Securities, LLC29
DisclosuresImportant Information for Non-U.S. Recipients
EEA – The securities and related financial instruments described herein may not be eligible for sale in all jurisdictions or to certain categories of investors. For recipients in the EEA, this report is distributed by Wells Fargo Securities International Limited (“WFSIL”). WFSIL is a U.K. incorporated investment firm authorized and regulated by the Financial Services Authority. For the purposes of Section 21 of the UK Financial Services and Markets Act 2000 (“the Act”), the content of this report has been approved by WFSIL a regulated person under the Act. WFSIL does not deal with retail clients as defined in the Markets in Financial Instruments Directive 2007. The FSA rules made under the Financial Services and Markets Act 2000 for the protection of retail clients will therefore not apply, nor will the Financial Services Compensation Scheme be available. This report is not intended for, and should not be relied upon by, retail clients.
Australia – Wells Fargo Securities, LLC is exempt from the requirements to hold an Australian financial services license in respect of the financial services it provides to wholesale clients in Australia. Wells Fargo Securities, LLC is regulated under U.S. laws which differ from Australian laws. Any offer or documentation provided to Australian recipients by Wells Fargo Securities, LLC in the course of providing the financial services will be prepared in accordance with the laws of the United States and not Australian laws.
Hong Kong – This report is issued and distributed in Hong Kong by Wells Fargo Securities Asia Limited (“WFSAL”), a Hong Kong incorporated investment firm licensed and regulated by the Securities and Futures Commission to carry on types 1, 4, 6 and 9 regulated activities (as defined in the Securities and Futures Ordinance, “the SFO”). This report is not intended for, and should not be relied on by, any person other than professional investors (as defined in the SFO). Any securities and related financial instruments described herein are not intended for sale, nor will be sold, to any person other than professional investors (as defined in the SFO).
Japan – This report is distributed in Japan by Wells Fargo Securities (Japan) Co., Ltd, registered with the Kanto Local Finance Bureau to conduct broking and dealing of type 1 and type 2 financial instruments and agency or intermediary service for entry into investment advisory or discretionary investment contracts. This report is intended for distribution only to professional investors (Tokutei Toushika) and is not intended for, and should not be relied upon by, ordinary customers (Ippan Toushika).
The ratings stated on the document are not provided by rating agencies registered with the Financial Services Agency of Japan (JFSA) but by group companies of JFSA-registered rating agencies. These group companies may include Moody’s Investors Services Inc, Standard & Poor’s Rating Services and/or Fitch Ratings. Any decisions to invest in securities or transactions should be made after reviewing policies and methodologies used for assigning credit ratings and assumptions, significance and limitations of the credit ratings stated on the respective rating agencies’ websites.
About Wells Fargo Securities, LLC Wells Fargo Securities, LLC is a U.S. broker-dealer registered with the U.S. Securities and Exchange Commission and a member of the New York Stock Exchange, the Financial Industry Regulatory Authority and the Securities Investor Protection Corp.
This report is for your information only and is not an offer to sell, or a solicitation of an offer to buy, the securities or instruments named or described in this report. Interested parties are advised to contact the entity with which they deal, or the entity that provided this report to them, if they desire further information. The information in this report has been obtained or derived from sources believed by Wells Fargo Securities, LLC, to be reliable, but Wells Fargo Securities, LLC, does not represent that this information is accurate or complete. Any opinions or estimates contained in this report represent the judgment of Wells Fargo Securities, LLC, at this time, and are subject to change without notice. For the purposes of the U.K. Financial Services Authority's rules, this report constitutes impartial investment research. Each of Wells Fargo Securities, LLC, and Wells Fargo Securities International Limited is a separate legal entity and distinct from affiliated banks. Copyright © 2012 Wells Fargo Securities, LLC.
SECURITIES: NOT FDIC-INSURED/NOT BANK-GUARANTEED/MAY LOSE VALUE