FOOD LOGISTICS & TRANSPORTATION
48
FOOD LOGISTICS & TRANSPORTATION: A SUSTAINABLE, REGIONAL APPROACH LINDSEY DAY FARNSWORTH UW-Madison Community & Regional Food Systems Project MICHELLE MILLER UW-Madison Center for Integrated Agricultural Systems JANICE SORIANO Center for Freight & Infrastructure Research & Education
Transcript of FOOD LOGISTICS & TRANSPORTATION

FOOD LOGISTICS & TRANSPORTATION: A SUSTAINABLE, REGIONAL APPROACH
LINDSEY DAY FARNSWORTH
UW-Madison Community & Regional Food Systems Project
MICHELLE MILLER
UW-Madison Center for Integrated Agricultural Systems
JANICE SORIANO
Center for Freight & Infrastructure Research & Education
Research Partners UW-Madison Community & Regional Food Systems Project
A 5-year USDA-funded research project working to identify the characteristics and functions of a healthy community and regional food system and how they contribute to increased community food security Center for Integrated Agricultural Systems (CIAS)
Conducts applied participatory research how integrated agri-food systems can contribute to environmental, economic, social, and intergenerational sustainability.
Center for Freight Infrastructure Research & Education (CFIRE)
Conducts research, education, and outreach to advance technology and expertise in the planning, design, construction & operation of sustainable freight transport systems.

Presentation overview
Planning context
• Regional food systems development as an integrated strategy:
Economic development, Sustainability, Healthy food access
Regional food distribution system development
• An Upper Midwest Case Study
Preliminary findings from CFIRE & WI DOT Study
• Map commodity flow across highway segments
• Identify factors contributing to successful regional cold chains

Planning for the food supply
1900 - World War I:
Supplying increasingly dense urban markets
1923 - World War II: Regionalization & technological advancements in food transport
World War II - early 1980s:
Nationalization of the food supply
1980s - early 2000s:
Globalization of food
Present: Demand for local food and public health concerns now driving urban agriculture planning and a return to regionalization

The Demand for Local Food
Local food sales were estimated to be $4.8 billion in 2008 and were
projected to climb to $7 billion in 2011
Source: http://www.ers.usda.gov/media/138320/err128_reportsummary_1_.pdf
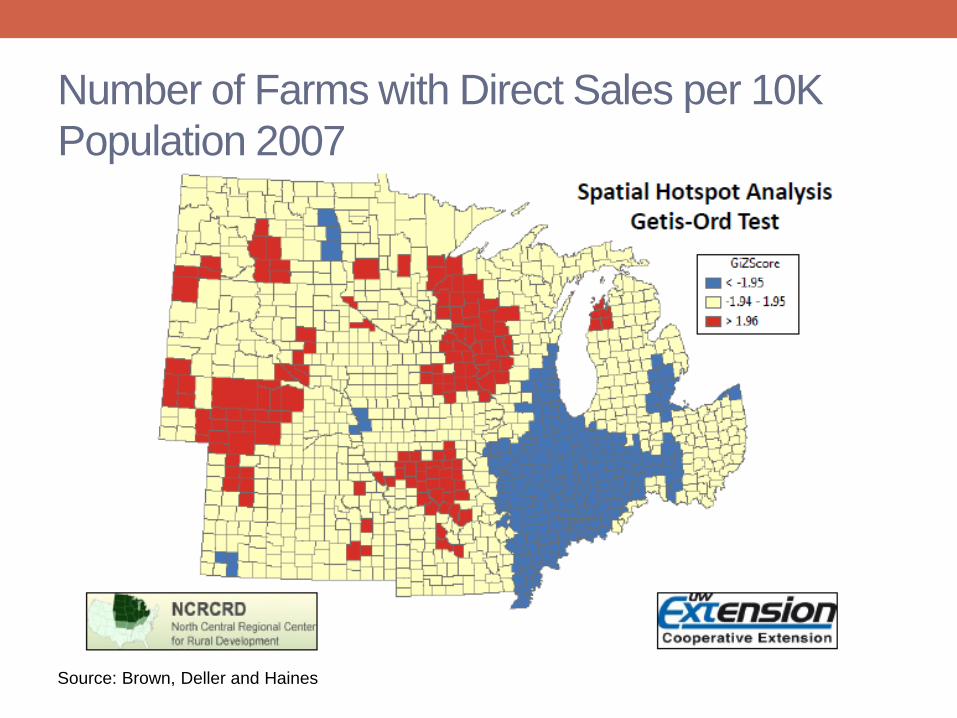
Number of Farms with Direct Sales per 10K
Population 2007
Source: Brown, Deller and Haines

The Potential of Regional Food Systems
The development of more robust regional food systems
has the potential to contribute to:
• Sustainability
• Economic development
• Improved access to healthy food
• Rural
• Urban
Sustainability More than food miles
• Local supply generally higher per unit costs
• Longer movements offer higher profit/mile due to lower average costs
“When food miles are small, product aggregation to achieve large load sizes and
logistical efficiencies can yield highly fuel-efficient distribution systems.”
Other factors
• Production practices (IPM, organic)
• Labor standards
• Packaging
Because local food isn’t necessarily more sustainable, it pays to know the
agricultural profile of your region:
• WI has the 2nd largest number of organic farms in the U.S.
• WI ranks 1st in the US for its number of organic dairy and beef farms, 3rd for
organic vegetable farms.
Source: King et al., CIAS
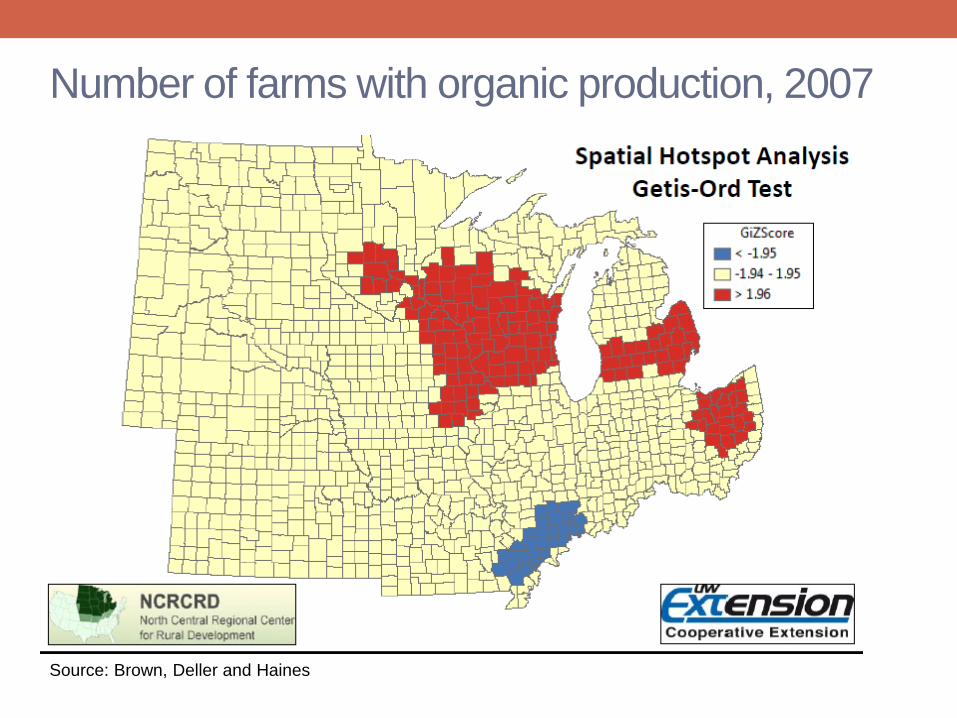
Number of farms with organic production, 2007
Source: Brown, Deller and Haines
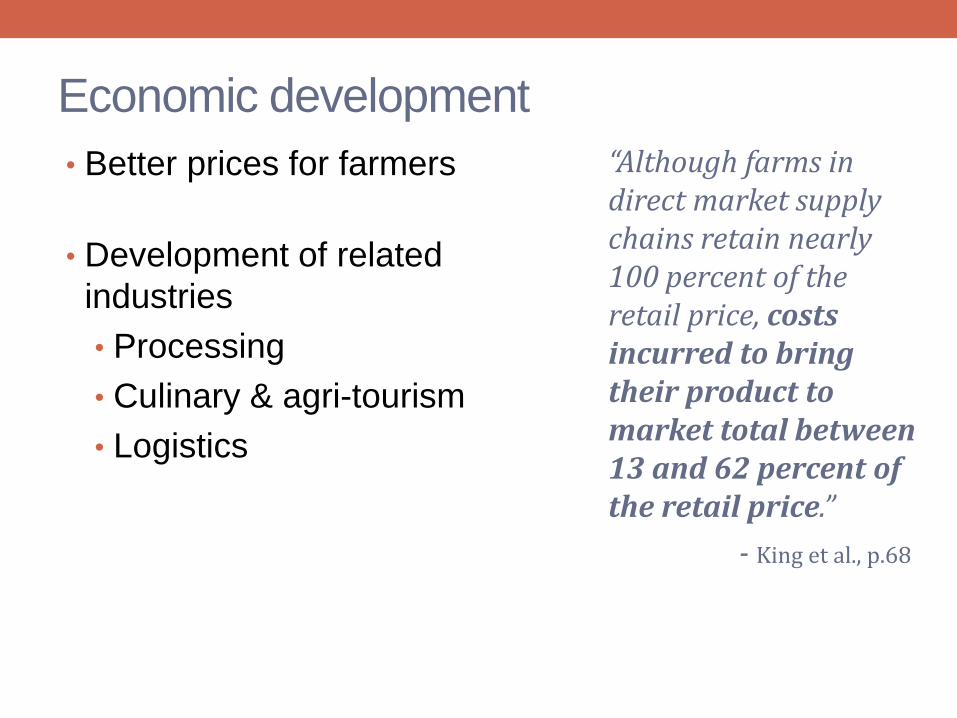
Economic development
• Better prices for farmers
• Development of related
industries
• Processing
• Culinary & agri-tourism
• Logistics
“Although farms in direct market supply chains retain nearly 100 percent of the retail price, costs incurred to bring their product to market total between 13 and 62 percent of the retail price.”
- King et al., p.68
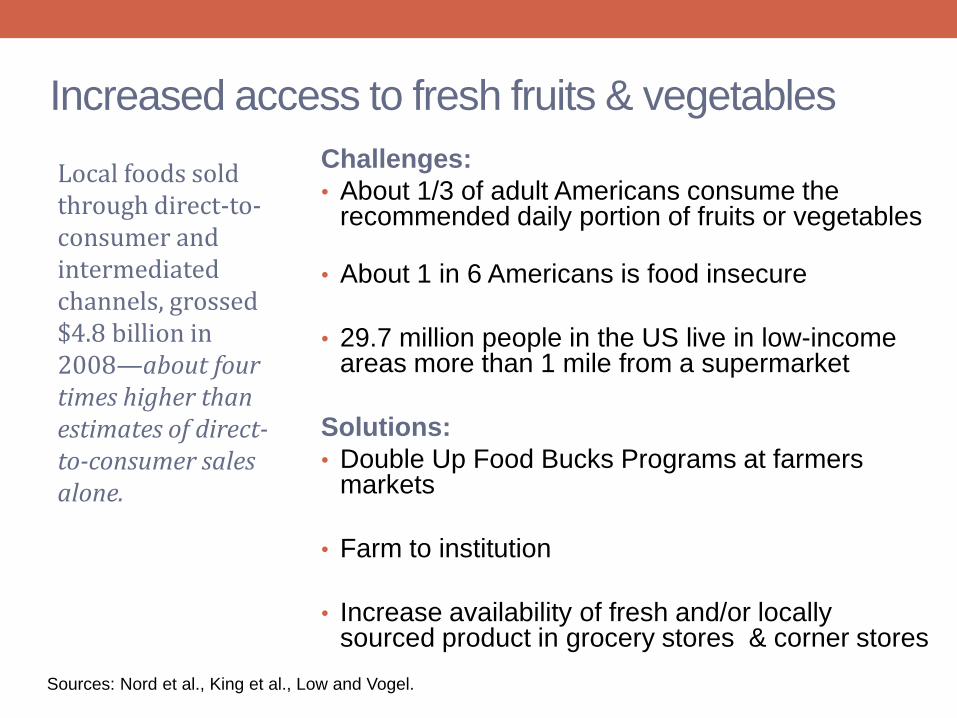
Increased access to fresh fruits & vegetables
Challenges:
• About 1/3 of adult Americans consume the recommended daily portion of fruits or vegetables
• About 1 in 6 Americans is food insecure
• 29.7 million people in the US live in low-income areas more than 1 mile from a supermarket
Solutions:
• Double Up Food Bucks Programs at farmers markets
• Farm to institution
• Increase availability of fresh and/or locally sourced product in grocery stores & corner stores
Local foods sold through direct-to-consumer and intermediated channels, grossed $4.8 billion in 2008—about four times higher than estimates of direct-to-consumer sales alone.
Sources: Nord et al., King et al., Low and Vogel.

Regional Food Distribution: Challenges & Opportunities
Aggregation
• Sourcing from small-mid size farms requires new aggregation strategies to:
• Supply high-volume regional markets
• Diversify product lines
Transportation & logistics
• Inefficiencies associated with the “first and last mile”
• Transaction cost of product changing hands multiple times
• Variability of load size due to seasonality, production volume
• Strategic location decisions for food hubs and distribution centers
Transparency across the food supply chain
• Food safety
• Marketing value
• Consumers want to know where there food comes from
• Source-identified foods can capture premiums for farmers
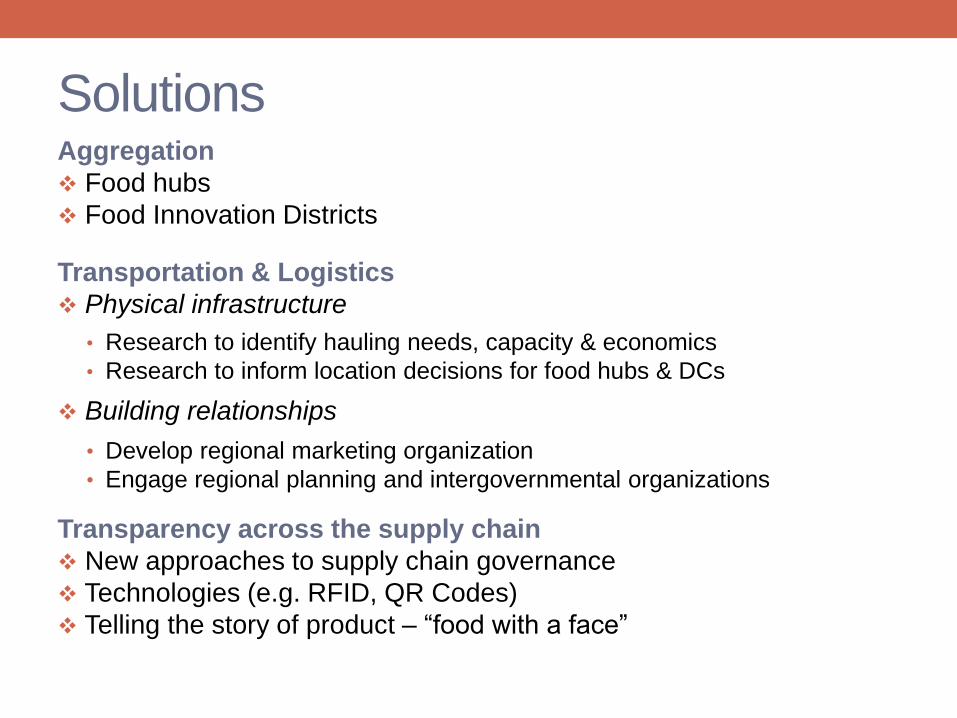
Solutions Aggregation
Food hubs
Food Innovation Districts
Transportation & Logistics
Physical infrastructure
• Research to identify hauling needs, capacity & economics
• Research to inform location decisions for food hubs & DCs
Building relationships
• Develop regional marketing organization
• Engage regional planning and intergovernmental organizations
Transparency across the supply chain
New approaches to supply chain governance
Technologies (e.g. RFID, QR Codes)
Telling the story of product – “food with a face”
Networking Across the Supply Chain
February 20-21, 2013
La Crosse, Wisconsin
Transportation Services Division
Agricultural Marketing Service
U.S. Department of Agriculture
This Project is supported by Cooperative Agreement No. 12-25-
A-5639 between the Agricultural Marketing Service/USDA and
the Center for Integrated Agriculture at the University of
Wisconsin-Madison.

varietal selection,
harvest approach
production
assistance for IPM,
organic
21 chains in
midwest, carry
more private label
direct consumer
feedback
85% self-
distributed
varietal selection,
harvest approach
vegetable
production
freshwholesale
processed
canned
direct sales
(farmers
market,CSA,
farm stand)
frozen
technical
assistance
distributor
warehouse
packing
house/
storage
dried
(chipped,
powdered)
distributor
warehouse
restaurants
independent
retails (1-10
stores)
institutions-
schools,
hospitals,
hotels,
restaurant
chains
self-
distributed
retailers
retails
regional
retails (11-
100 stores)
chains
(100+
stores)
midwest
consumer
spends an
average of
$85/wk on
retail food
purchases
breeding,
production
research
on-farm
processed
retails
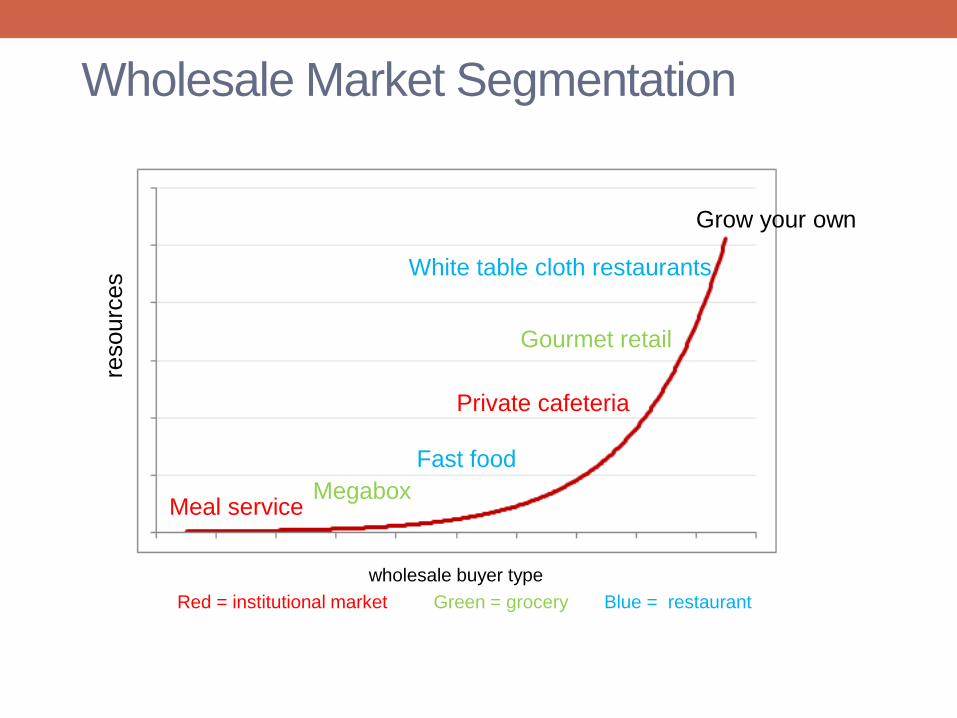
Wholesale Market Segmentation
wholesale buyer type
Red = institutional market Green = grocery Blue = restaurant
Meal service Megabox
Fast food
Private cafeteria
Gourmet retail
White table cloth restaurants
Grow your own
resourc
es
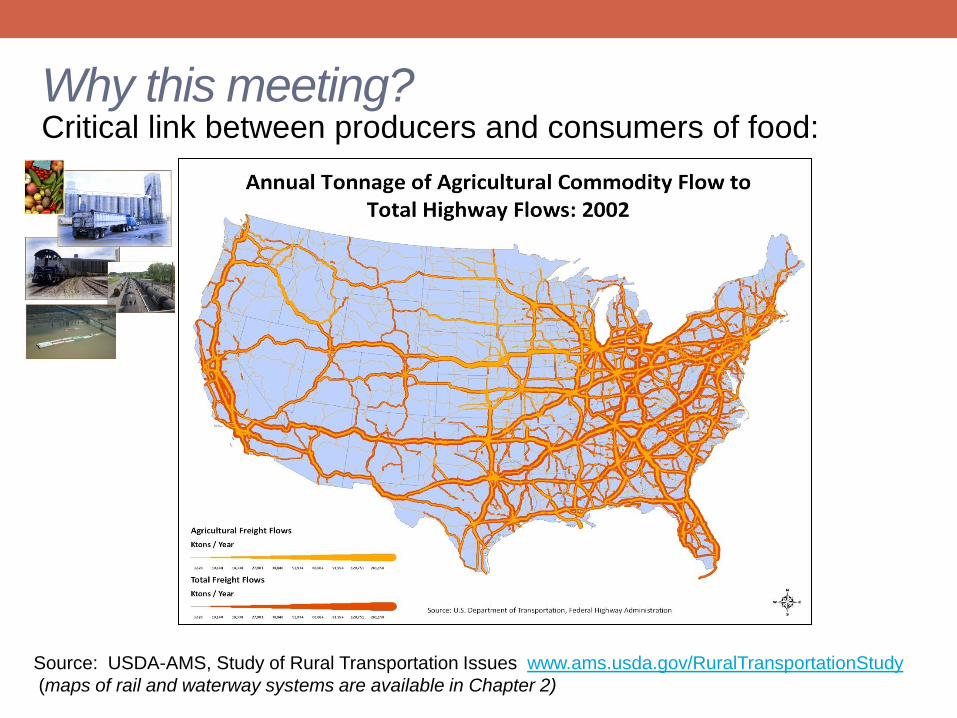
Critical link between producers and consumers of food:
Source: USDA-AMS, Study of Rural Transportation Issues www.ams.usda.gov/RuralTransportationStudy
(maps of rail and waterway systems are available in Chapter 2)
Why this meeting?
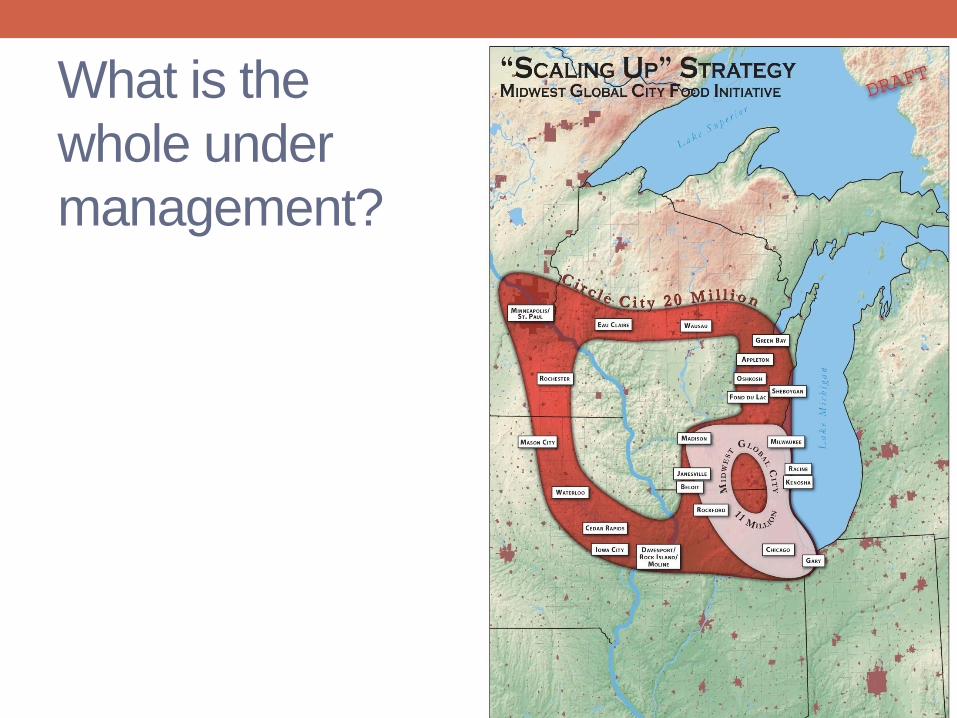
What is the
whole under
management?


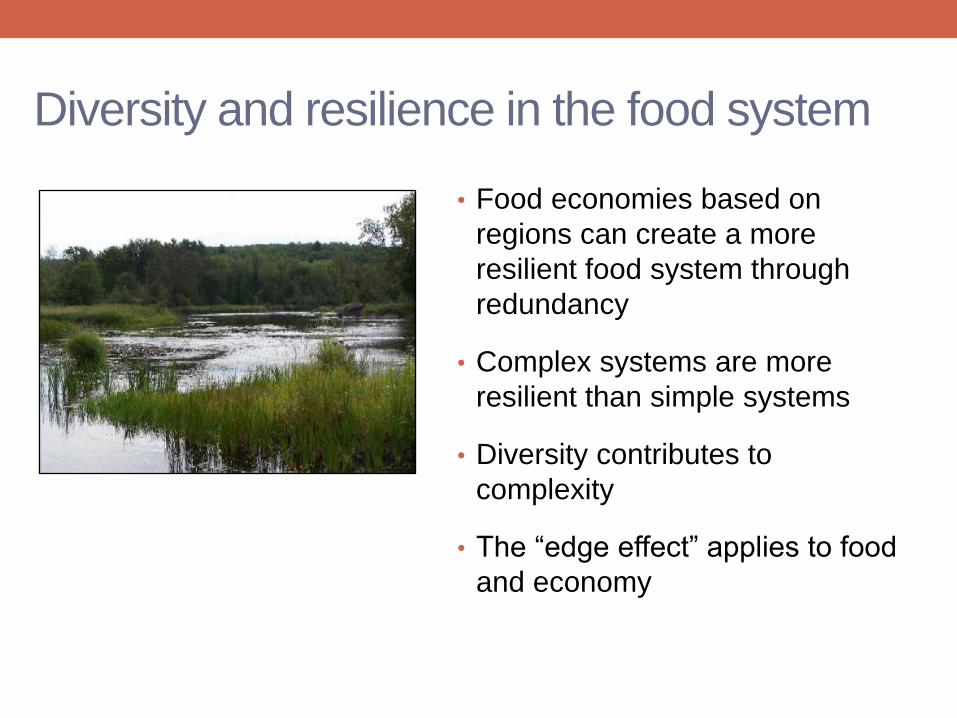
Diversity and resilience in the food system
• Food economies based on
regions can create a more
resilient food system through
redundancy
• Complex systems are more
resilient than simple systems
• Diversity contributes to
complexity
• The “edge effect” applies to food
and economy

innovative+authentic+sustainable
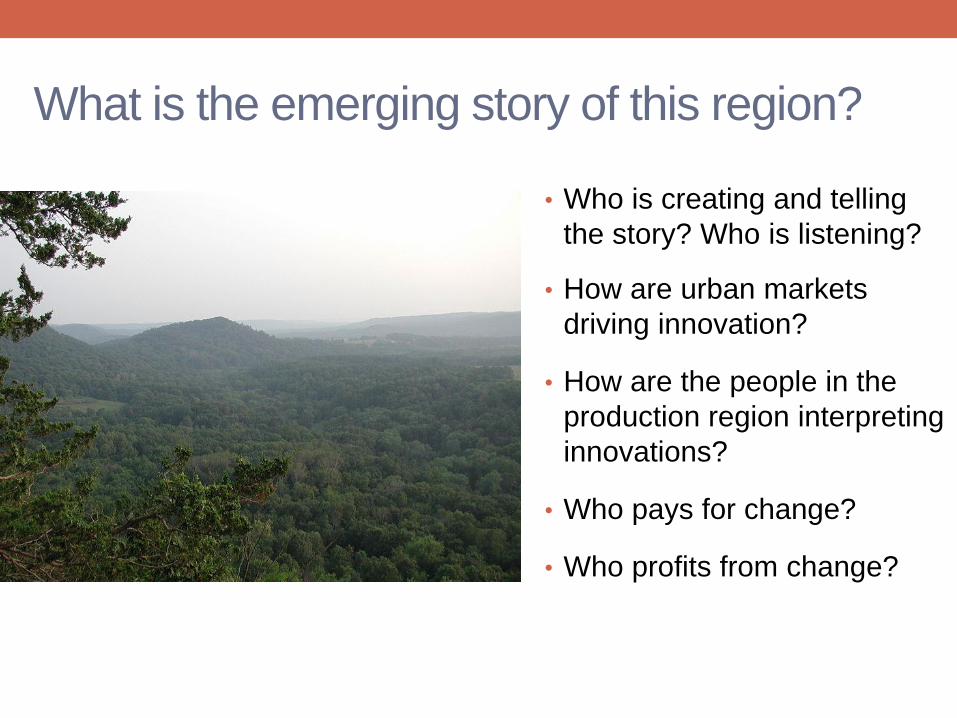
What is the emerging story of this region?
• Who is creating and telling
the story? Who is listening?
• How are urban markets
driving innovation?
• How are the people in the
production region interpreting
innovations?
• Who pays for change?
• Who profits from change?

Standard civic engagement approach
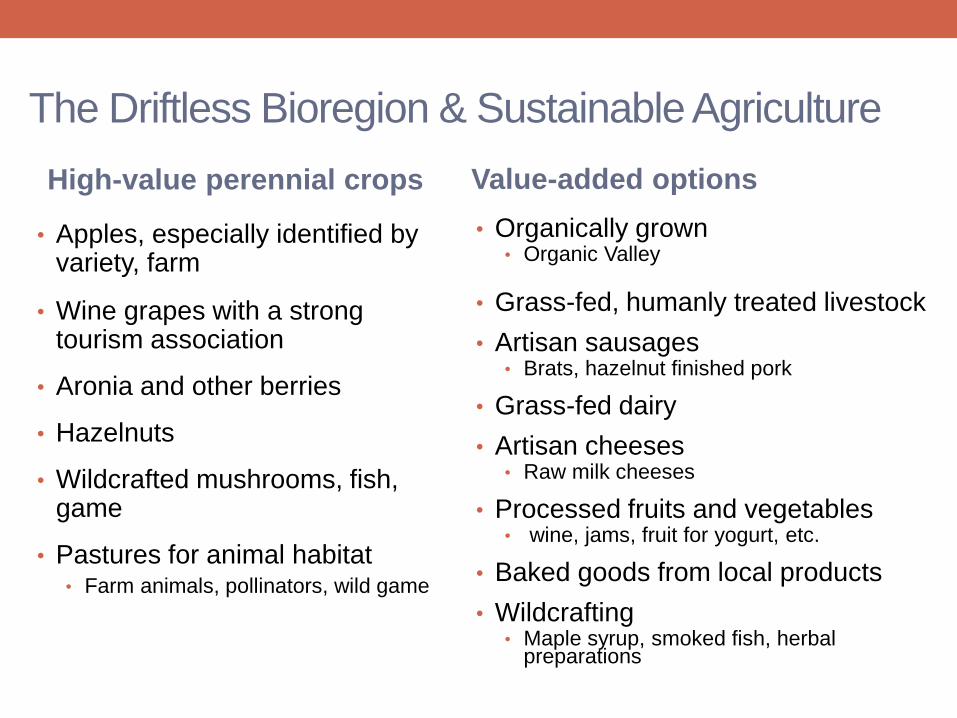
The Driftless Bioregion & Sustainable Agriculture
High-value perennial crops
• Apples, especially identified by
variety, farm
• Wine grapes with a strong tourism association
• Aronia and other berries
• Hazelnuts
• Wildcrafted mushrooms, fish, game
• Pastures for animal habitat • Farm animals, pollinators, wild game
Value-added options
• Organically grown • Organic Valley
• Grass-fed, humanly treated livestock
• Artisan sausages • Brats, hazelnut finished pork
• Grass-fed dairy
• Artisan cheeses • Raw milk cheeses
• Processed fruits and vegetables • wine, jams, fruit for yogurt, etc.
• Baked goods from local products
• Wildcrafting • Maple syrup, smoked fish, herbal
preparations

Rural Economic Development Potential of
Food Supply Chain
• Farmers markets
• Low economic impact
• High educational / authenticity potential
• Critical market scale for beginning farmers
• Regional markets
• Aggregate or be aggregated
• Warehousing, processing, marketing
• Calling card for tourism, Farm-to-School
• Artisan markets
• High-value crafted food for up-scale urban consumer
• Agro- and culinary tourism
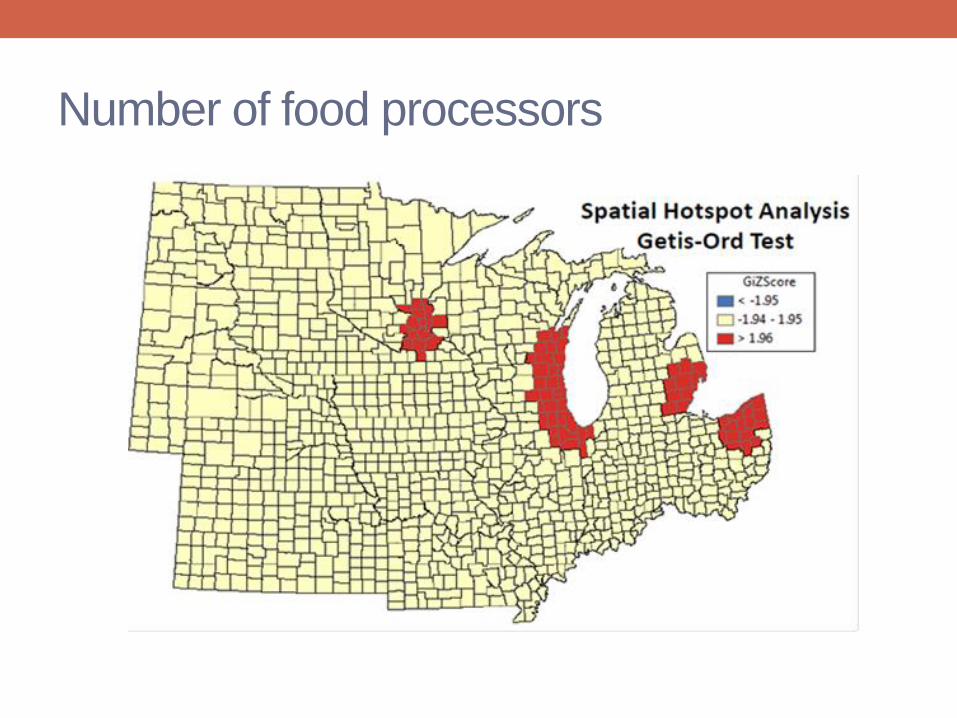
Number of food processors

Power dynamic
• City dwellers are the market.
• Rural landscapes and communities produce food.
• Is the relationship equitable?
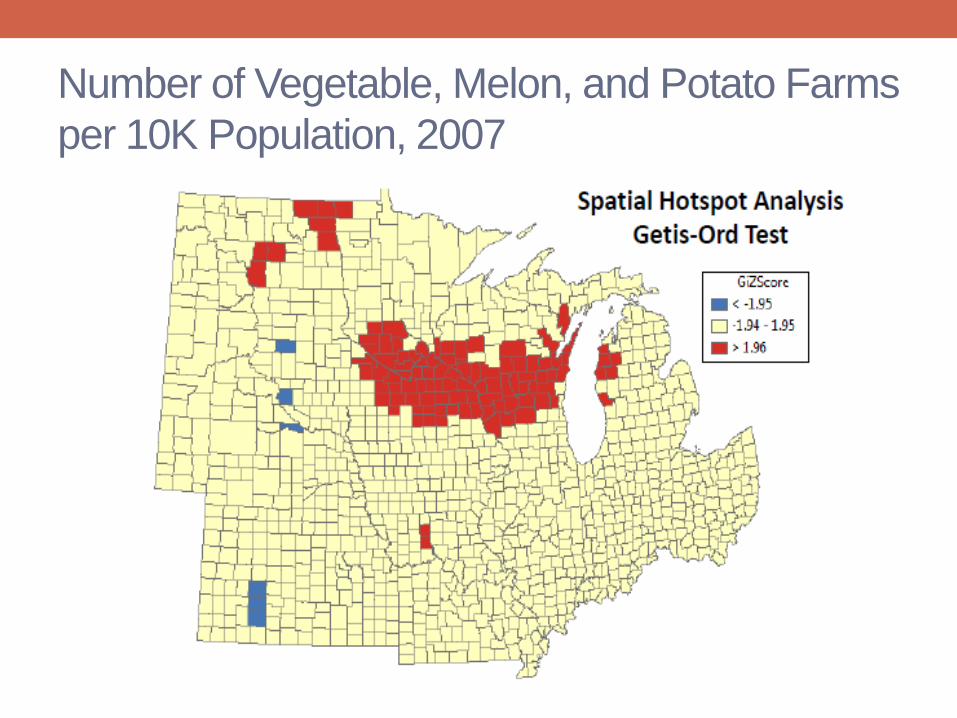
Number of Vegetable, Melon, and Potato Farms
per 10K Population, 2007
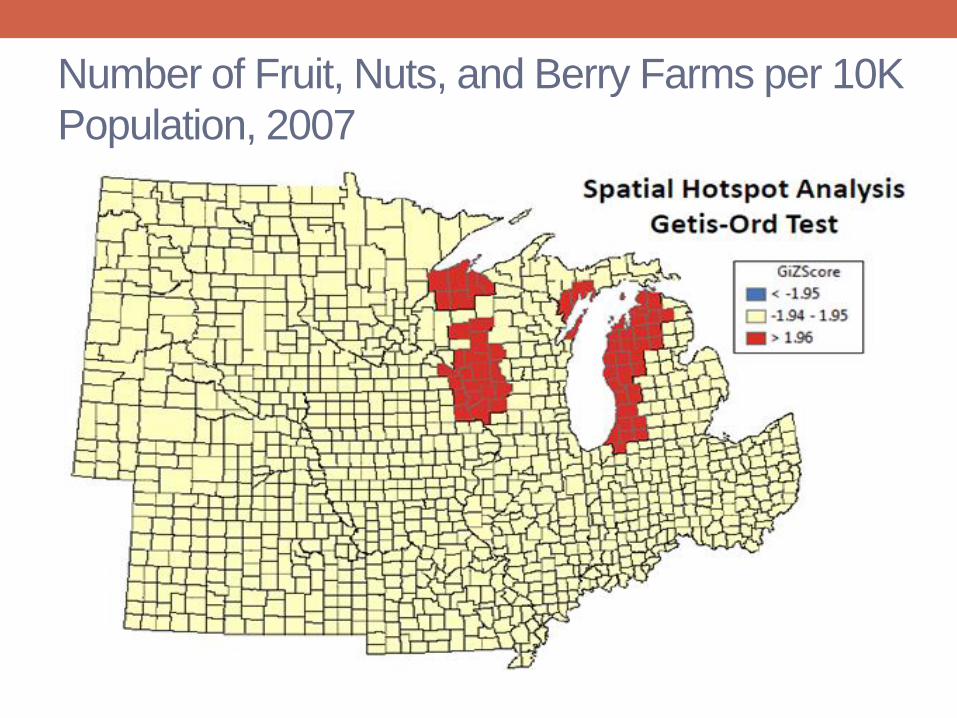
Number of Fruit, Nuts, and Berry Farms per 10K
Population, 2007
Emerging ideas from LaCrosse
• What is local?
• Consumers and their wholesale buyers looking for
authenticity and story.
• Sustainability is at the heart of “local” – distance to market
is not necessarily the best measure.
• Why is Chicago market nascent and Twin Cities market
thriving?
• Logistics drives infrastructure development – now is the
time to incorporate changing logistics into mid-range
planning work.
• Relationships drive logistics – need for opportunities to
develop regional relationships.

Emerging ideas from LaCrosse
• Competing goals – reduce transactional costs AND
increase transaction quality and quantity.
• Food pantry leadership reassessing their approach to
address the fundamental obstacles to food access –
distribution key.
• Diversity of wholesale buyers each with their own needs
and contributions – white tablecloth restaurants to
institutional buyers.
• Regional food distribution requires more attention to the
First/Last Mile transportation issues.
Regional Cold Chain Analysis:
Research Questions
• Is the Circle City becoming self-sufficient in its food
system?
• How much product does the Driftless Area contribute to
this system?
• What can be done to ensure transportation & logistics
sustainability on a regional level?

Driftless Area is at the heart of the Circle City
Source: Phil Lewis, “Tomorrow: By Regional Design”

Methods of Study
• Analyze cold chain commodities transported from
Wisconsin Driftless-Origins to MSA-Destinations
using TRANSEARCH
• Map commodity flow across highway segments
• Identify factors that contribute to successful regional cold
chain transportation across the supply chain
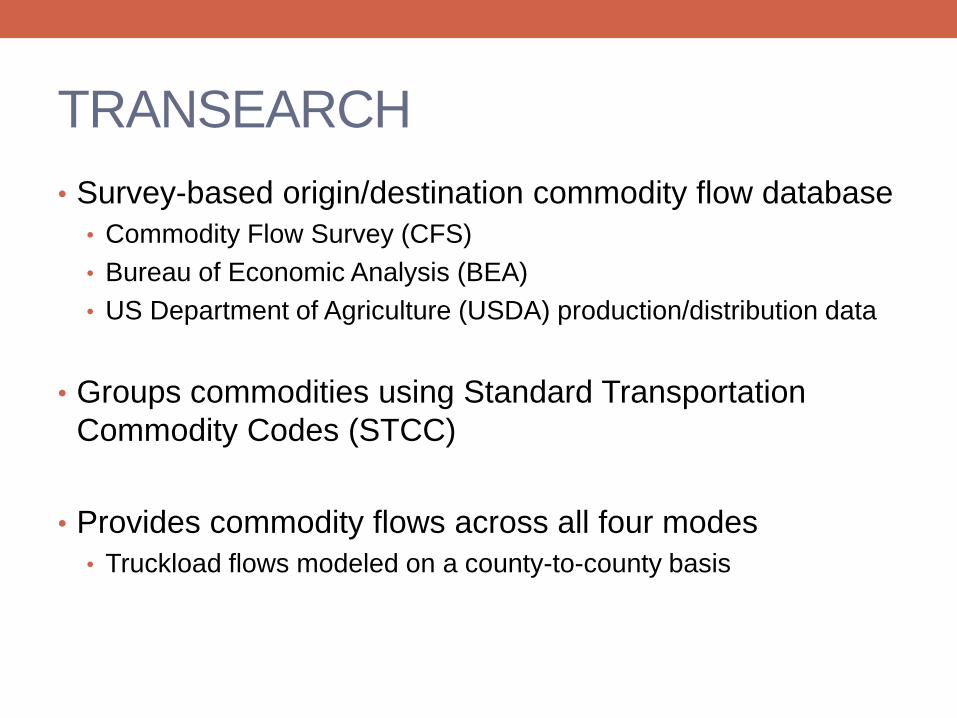
TRANSEARCH
• Survey-based origin/destination commodity flow database
• Commodity Flow Survey (CFS)
• Bureau of Economic Analysis (BEA)
• US Department of Agriculture (USDA) production/distribution data
• Groups commodities using Standard Transportation
Commodity Codes (STCC)
• Provides commodity flows across all four modes
• Truckload flows modeled on a county-to-county basis
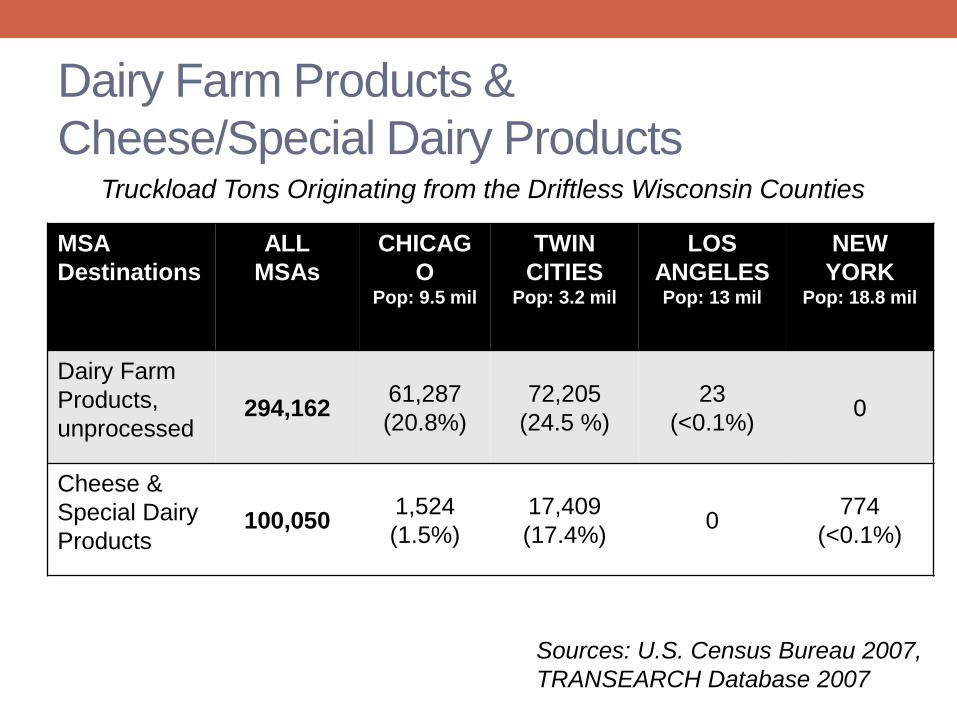
Dairy Farm Products &
Cheese/Special Dairy Products
Sources: U.S. Census Bureau 2007,
TRANSEARCH Database 2007
Truckload Tons Originating from the Driftless Wisconsin Counties
MSA
Destinations
ALL
MSAs
CHICAG
O Pop: 9.5 mil
TWIN
CITIES Pop: 3.2 mil
LOS
ANGELES Pop: 13 mil
NEW
YORK Pop: 18.8 mil
Dairy Farm
Products,
unprocessed 294,162
61,287
(20.8%)
72,205
(24.5 %)
23
(<0.1%) 0
Cheese &
Special Dairy
Products 100,050
1,524
(1.5%)
17,409
(17.4%) 0
774
(<0.1%)

Dairy Farm Products &
Cheese/Special Dairy Products Share of Driftless Commodities Consumed by MSAs
(% Truckload Tons)
20.8%
24.5% 54.6%
Driftless Dairy Farm Products
Chicago
Twin Cities
Los Angeles
New York
Other MSAs
1.5%
17.4%
81.0%
Driftless Cheese/Special Dairy Products
Chicago
Twin Cities
Los Angeles
New York
Other MSAs

Originating from Driftless WI Counties
Dairy Farm Products
Originating Truckload Tons
from Driftless WI0
Less than 10,000
10,000 to 50,000
More than 50,000
Driftless WI County
Originating from Driftless WI Counties
Dairy Farm Products
Originating Truckload Tons
from Driftless WI0
Less than 10,000
10,000 to 50,000
More than 50,000
Driftless WI CountySource: TRANSEARCH Database 2007
Originating from Driftless WI Counties
Originating Truckload Tonsfrom Driftless WI
Driftless WI County
Cheese or Special Dairy Products
0
Less than 50,000
50,000 to 100,000
More than 100,000
Originating from Driftless WI Counties
Originating Truckload Tonsfrom Driftless WI
Driftless WI County
Cheese or Special Dairy Products
0
Less than 50,000
50,000 to 100,000
More than 100,000
Commodity Flow of Driftless Products Dairy Farm Products Cheese & Special Dairy
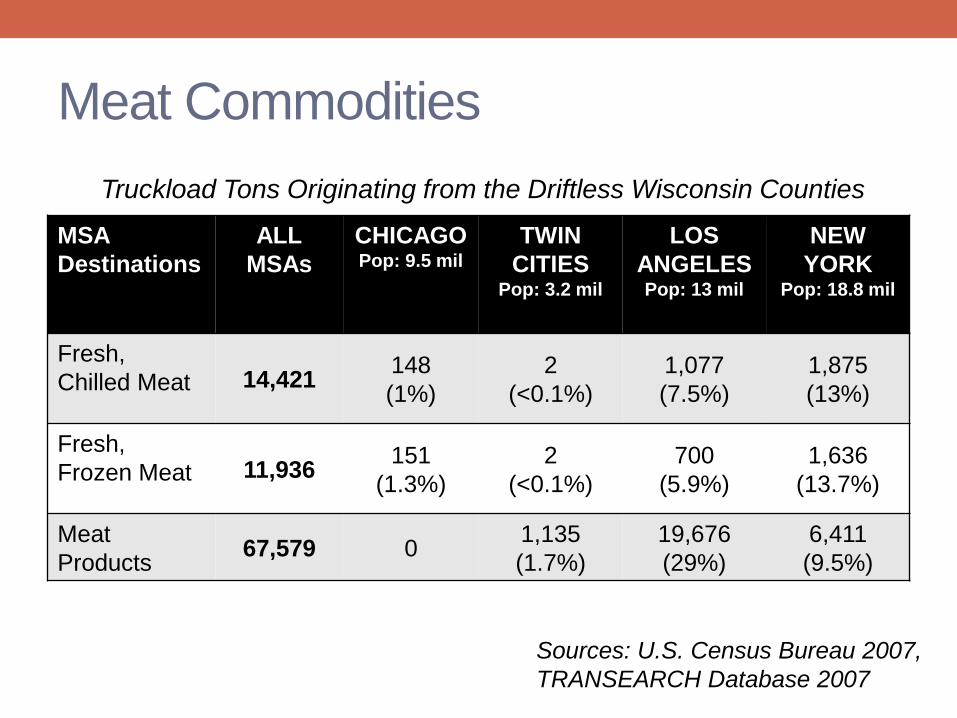
Meat Commodities
MSA
Destinations
ALL
MSAs
CHICAGO Pop: 9.5 mil
TWIN
CITIES Pop: 3.2 mil
LOS
ANGELES Pop: 13 mil
NEW
YORK Pop: 18.8 mil
Fresh,
Chilled Meat 14,421 148
(1%)
2
(<0.1%)
1,077
(7.5%)
1,875
(13%)
Fresh,
Frozen Meat 11,936 151
(1.3%)
2
(<0.1%)
700
(5.9%)
1,636
(13.7%)
Meat
Products 67,579 0
1,135
(1.7%)
19,676
(29%)
6,411
(9.5%)
Truckload Tons Originating from the Driftless Wisconsin Counties
Sources: U.S. Census Bureau 2007,
TRANSEARCH Database 2007
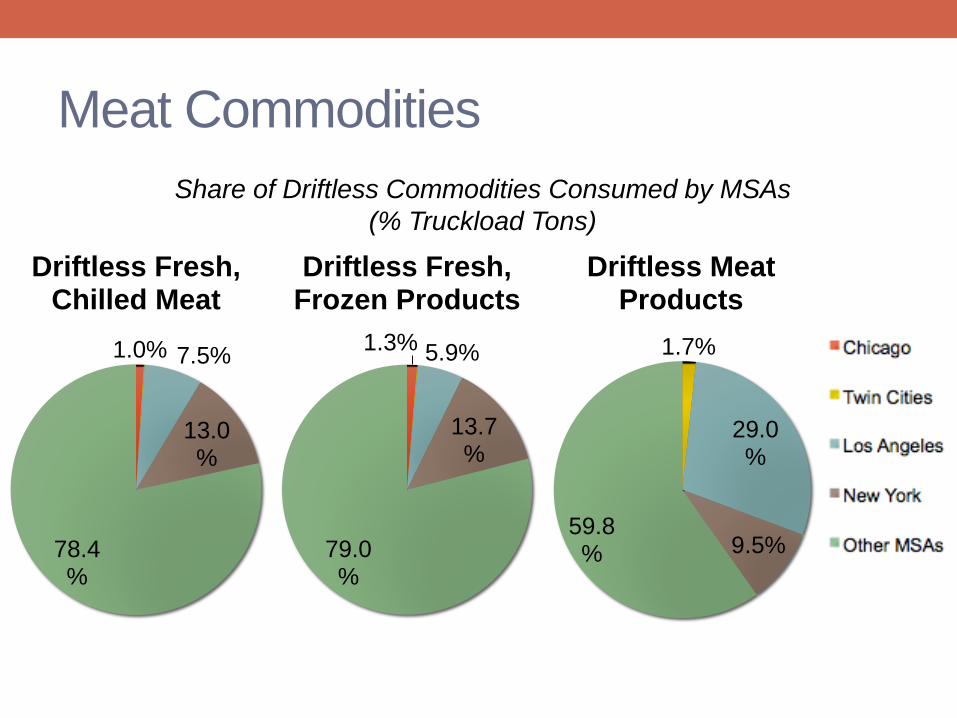
Meat Commodities
1.0% 7.5%
13.0%
78.4%
Driftless Fresh, Chilled Meat
1.3% 5.9%
13.7%
79.0%
Driftless Fresh, Frozen Products
Share of Driftless Commodities Consumed by MSAs
(% Truckload Tons)
1.7%
29.0%
9.5% 59.8%
Driftless Meat Products
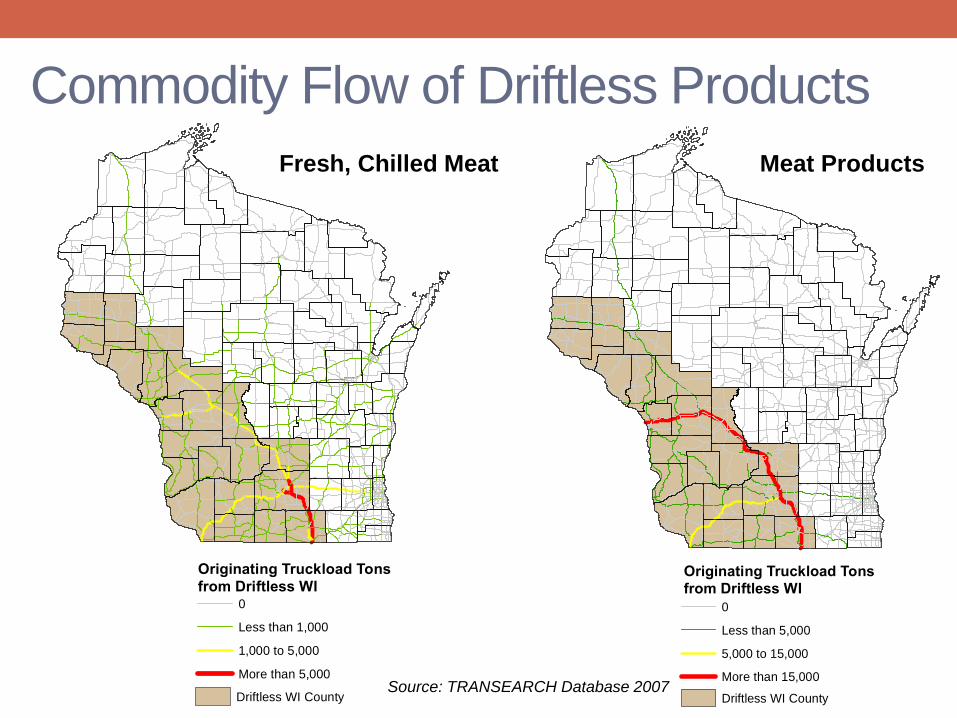
Commodity Flow of Driftless Products
Originating from Driftless WI Counties
Originating Truckload Tonsfrom Driftless WI
Driftless WI County
Meat Products
0
Less than 5,000
5,000 to 15,000
More than 15,000
Originating from Driftless WI Counties
Originating Truckload Tonsfrom Driftless WI
Driftless WI County
Meat Products
0
Less than 5,000
5,000 to 15,000
More than 15,000
Originating from Driftless WI Counties
Meat - Fresh or Chilled
Originating Truckload Tons
from Driftless WI0
Less than 1,000
1,000 to 5,000
More than 5,000
Driftless WI County
Originating from Driftless WI Counties
Meat - Fresh or Chilled
Originating Truckload Tons
from Driftless WI0
Less than 1,000
1,000 to 5,000
More than 5,000
Driftless WI CountySource: TRANSEARCH Database 2007
Fresh, Chilled Meat Meat Products

Factors to Improve Transport Logistics • Mixed Load Compatibilities • Packing Methods &
Refrigeration Standards
55-65oF
No pineapple w/avocado
No ice contact
Rel. Humidity
N/A
85-95%
Avocadoes Olives
Bananas Papayas
Eggplant Limes
Grapefruit Guava
Pineapples Mangoes
Tomatoes Watermelons
Muskmelons
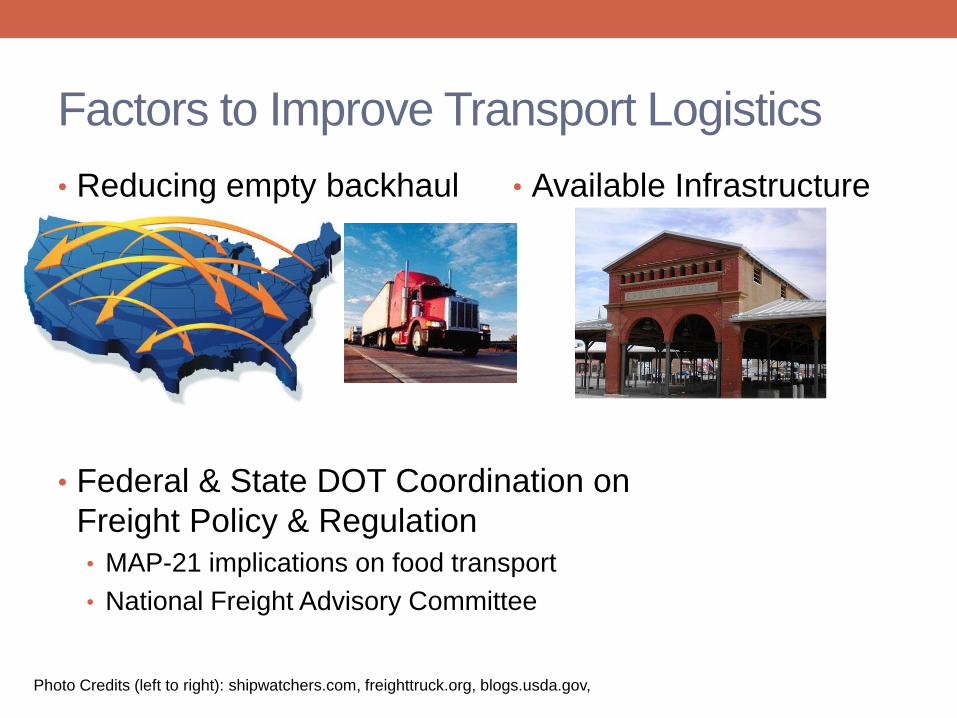
Factors to Improve Transport Logistics
• Reducing empty backhaul
• Available Infrastructure
• Federal & State DOT Coordination on
Freight Policy & Regulation
• MAP-21 implications on food transport
• National Freight Advisory Committee
Photo Credits (left to right): shipwatchers.com, freighttruck.org, blogs.usda.gov,
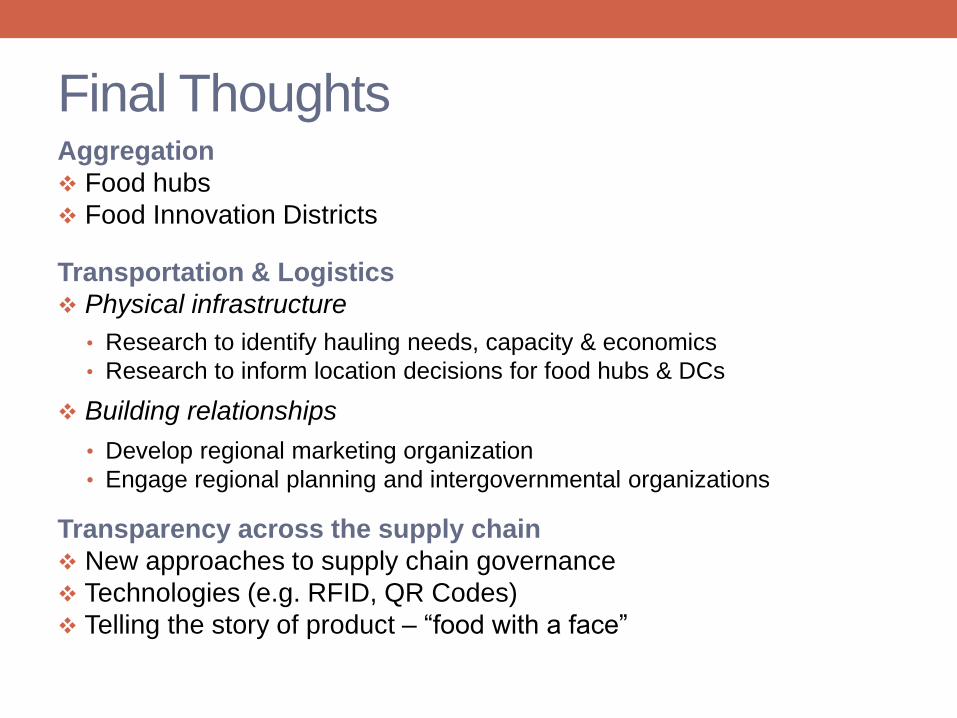
Final Thoughts Aggregation
Food hubs
Food Innovation Districts
Transportation & Logistics
Physical infrastructure
• Research to identify hauling needs, capacity & economics
• Research to inform location decisions for food hubs & DCs
Building relationships
• Develop regional marketing organization
• Engage regional planning and intergovernmental organizations
Transparency across the supply chain
New approaches to supply chain governance
Technologies (e.g. RFID, QR Codes)
Telling the story of product – “food with a face”
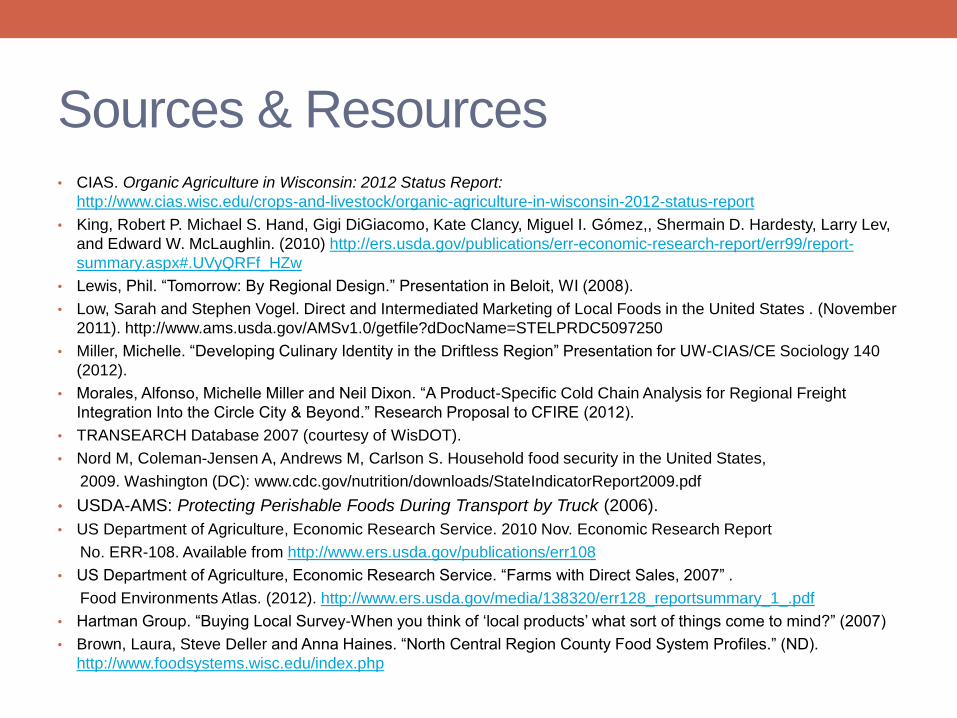
Sources & Resources • CIAS. Organic Agriculture in Wisconsin: 2012 Status Report:
http://www.cias.wisc.edu/crops-and-livestock/organic-agriculture-in-wisconsin-2012-status-report
• King, Robert P. Michael S. Hand, Gigi DiGiacomo, Kate Clancy, Miguel I. Gómez,, Shermain D. Hardesty, Larry Lev,
and Edward W. McLaughlin. (2010) http://ers.usda.gov/publications/err-economic-research-report/err99/report-
summary.aspx#.UVyQRFf_HZw
• Lewis, Phil. “Tomorrow: By Regional Design.” Presentation in Beloit, WI (2008).
• Low, Sarah and Stephen Vogel. Direct and Intermediated Marketing of Local Foods in the United States . (November
2011). http://www.ams.usda.gov/AMSv1.0/getfile?dDocName=STELPRDC5097250
• Miller, Michelle. “Developing Culinary Identity in the Driftless Region” Presentation for UW-CIAS/CE Sociology 140
(2012).
• Morales, Alfonso, Michelle Miller and Neil Dixon. “A Product-Specific Cold Chain Analysis for Regional Freight
Integration Into the Circle City & Beyond.” Research Proposal to CFIRE (2012).
• TRANSEARCH Database 2007 (courtesy of WisDOT).
• Nord M, Coleman-Jensen A, Andrews M, Carlson S. Household food security in the United States,
2009. Washington (DC): www.cdc.gov/nutrition/downloads/StateIndicatorReport2009.pdf
• USDA-AMS: Protecting Perishable Foods During Transport by Truck (2006).
• US Department of Agriculture, Economic Research Service. 2010 Nov. Economic Research Report
No. ERR-108. Available from http://www.ers.usda.gov/publications/err108
• US Department of Agriculture, Economic Research Service. “Farms with Direct Sales, 2007” .
Food Environments Atlas. (2012). http://www.ers.usda.gov/media/138320/err128_reportsummary_1_.pdf
• Hartman Group. “Buying Local Survey-When you think of ‘local products’ what sort of things come to mind?” (2007)
• Brown, Laura, Steve Deller and Anna Haines. “North Central Region County Food System Profiles.” (ND).
http://www.foodsystems.wisc.edu/index.php
Questions?
Lindsey Day Farnsworth UW – Madison Community and Regional Food Systems Project [email protected]
Michelle Miller UW – Madison Center for Integrated Agricultural Systems [email protected]
Janice Soriano
Center for Freight & Infrastructure Research & Education [email protected]