Liquid absorbance standards
14
JOURNAL OF RESEARCH of the National Bureau of Standards- A. Physi cs and Chemistry Val. 76A, No. 5, September-October 1972 Liquid Absorbance Standards R. W. Burke, E. R. Deardorff, and O. Menis Institute for Materials Research, National Bureau of Standards, Washington, D.C. 20234 (June 14, 1972) Errors in the measurement of the absorbances of liquid filters result from instrumental and c he m- ical un ce rtainties. This paper presents a sys tematic study of these variables on the absorbances of se lected filt ers. Thr ee types of liquid filters are di scussed. These are (1) individual solutions of hi gh purity compounds, (2) composite mixtures and (3) aqueous solutions of organic dyes. Th e accuracy of th e absorptivity dat a is established us in g NBS-calibrated glass filt ers. The magnitude of the erro rs arising from spec tral bandpass, beam geometry, stray light, internal multiple refl ec tion s, and refrac- tive index are delineated. Finally, as a practical outgrowth of this study, th e developme nt and issuan ce of NBS Standard Reference Material 931, Liquid Absorbance Standards for Ultraviolet and Visible Spectrophotometry, is described. Key words: Absorptivity data ; accuracy; liquid absorbance st andards; Standard Reference Materials. I. Introduction In the use of filters for checking the accuracy of the photometric scale of spectrophotometers, one needs materials which exhibit ab solute spectral neu- trality. Such ideal filters are not available at present. The use of the materials which have been suggested is limited by instrumental and sample variable s_ For this reason, one must carefully specify conditions which define the other sources of errors. The first part of this paper reviews several of the more important instrumental parameters and dis- cusses their effects on absorbance measurements. Examples from the literature are given to illustrate the magnitude of the errors arising from spectral . bandpass, stray light, nonparallel radiation, and multiple reflections. The second part presents some experimental studies of several materials which may serve as calibration "filters" or standards. II. Instrumental Parameters A. Wavelength Accuracy The absorbances of most samples are sufficiently wavelength dependent that even in the most favorabl e regions of maxima and minima a wavelength error of 1-2 nm can produce absorbance errors of a few tenths of a percent. When performing measurements on the slopes of absorption peaks, the wavelength setting is obviously much more critical and errors are typically several percent per nanometer. Wave- length accuracy, therefore, becomes especially important when making absorbance measurements at, for example, an isosbestic point. A line source provides the most definitive means for establishing th e accuracy of the wave length scale. The best single source is a me rcury lamp which may be used throughout the range of 200-1000 nm. For calibration in th e visible r egion, helium lines are also useful. Gibson [1)1 has discussed the use of me rcury and helium sources and has listed those lines bes t suited for wavelength calibration. Other sources which have been used include neon, cadmium, cesium, and sodium. The M.I.T. Wavelength Tables [2] summarizes the most prominent emission lin es of these elements. Not all wavelengths are given and care must be taken in using any of thes e lines in order not to confuse closely adjacent lines with the one being checked. For those spectrophotometers having a hydrogen or deuterium source, the emission lines at 486.13 and 656.28 nm (H) or 485.99 and 656.10 nm (0) may provide con- venient checks at these wavelengths . Calibrated holmium oxide and didymium glasses may be useful secondary standards, particularly for check- ing recording spectrophotometers in which a dynamic check of the instrument is often desirable. The apparent absorption maxima of these filters, however, may vary with spectral bandpass . Therefore, for the highest accuracy, they should be calibrated for the spectral bandpass at which they are to be used. In general, prism instruments require more frequent calibration than the grating type because their dis- persion is temperature dependent. Corrections in the visible region are of the order of 0.1 nm per degree Celsius. Hysteresis effects must also be considered I Figures in brackets indicate the literature references at the end of this paper. 469
-
Upload
nguyendieu -
Category
Documents
-
view
263 -
download
0
Transcript of Liquid absorbance standards

JOURNAL OF RESEARCH of the National Bureau of Standards- A. Physics and Chemistry Val. 76A, No. 5, September-October 1972
Liquid Absorbance Standards
R. W. Burke, E. R. Deardorff, and O. Menis
Institute for Materials Research, National Bureau of Standards, Washington, D.C. 20234
(June 14, 1972)
Errors in the meas urement of the absorbances of liquid filters result from instrumental and c hemical uncertainties. This paper presents a systematic study of these variables on the absorbances of selected filters. Three types of liquid filters are discussed. These are (1) individual solutions of high purity compounds, (2) composi te mixtures and (3) aqueous solutions of organic dyes . The accuracy of the absorptivity data is established using NBS-calibrated glass filters. The magnitude of the errors ari sing from spectral bandpass, beam geometry, stray light , internal multiple reflections, and refractive index are delineated. Finally, as a practical outgrowth of this study, the development and issuance of NBS Standard Reference Material 931, Liquid Absorbance Standards for Ultraviolet and Visible Spectrophotometry, is described.
Key words: Absorptivity data; accuracy; liquid absorbance standards; Standard Refe rence Mate rials.
I. Introduction
In the use of filters for checking the accuracy of the photometric scale of spectrophotometers, one needs materials which exhibit absolute spectral neutrality. Such ideal filters are not available at present. The use of the materials which have been suggested is limited by instrumental and sample variables_ For this reason, one must carefully specify conditions which define the other sources of errors.
The first part of this paper reviews several of the more important instrumental parameters and discusses their effects on absorbance measurements. Examples from the literature are given to illustrate the magnitude of the errors arising from spectral
. bandpass, stray light, nonparallel radiation, and multiple reflections. The second part presents some experimental studies of several materials which may serve as calibration "filters" or standards.
II. Instrumental Parameters
A. Wavelength Accuracy
The absorbances of most samples are sufficiently wavelength dependent that even in the most favorable regions of maxima and minima a wavelength error of 1-2 nm can produce absorbance errors of a few tenths of a percent. When performing measurements on the slopes of absorption peaks, the wavelength setting is obviously much more critical and errors are typically several percent per nanometer. Wavelength accuracy, therefore, becomes especially important when making absorbance measurements at, for example, an isosbestic point.
A line source provides the most definitive means for establishing the accuracy of the wavelength scale. The best single source is a me rcury lamp which may be used throughout the range of 200-1000 nm. For calibration in the visible region, helium lines are also useful.
Gibson [1)1 has discussed the use of mercury and helium sources and has listed those lines bes t suited for wavelength calibration. Other sources which have been used include neon, cadmium, cesium, and sodium. The M.I.T. Wavelength Tables [2] summarizes the most prominent emission lines of these elements. Not all wavelengths are given and care must be taken in using any of these lines in order not to confuse closely adjacent lines with the one being checked. For those spectrophotometers having a hydrogen or deuterium source, the emission lines at 486.13 and 656.28 nm (H) or 485.99 and 656.10 nm (0) may provide convenient checks at these wavelengths.
Calibrated holmium oxide and didymium glasses may be useful secondary standards, particularly for checking recording spectrophotometers in which a dynamic check of the instrument is often desirable. The apparent absorption maxima of these filters, however, may vary with spectral bandpass. Therefore, for the highest accuracy, they should be calibrated for the spectral bandpass at which they are to be used.
In general, prism instruments require more frequent calibration than the grating type because their dispersion is temperature dependent. Corrections in the visible region are of the order of 0.1 nm per degree Celsius. Hysteresis effects must also be considered
I Figures in brackets indicate the literature references at the end of this paper.
469

and the wavelength settings should always be approached from the same direction.
B. Finite Bandwidth
Spectral bandpass differences undoubtedly account for a significant portion of the discrepancies in molar absorptivity values reported in the literature. Some have resulted from the e mployment of inadequate instrumentation; others have resulted from improper use of these instruments or complications arising from solution equilibria.
Increasing the spectral bandpass at an absorption maximum has two effects on apparent peak heights: (1) the observed values are always less than the true values and (2) the differences between the two are proportionally greater at higher absorbances. Thus, for a finite bandpass , a plot of absorbance versus concentration or path length will always have a smaller slope than it does in monochromatic radiation and, in addition , will be concave to the concentration axis. Figure 1 illustrates these e ffects. The reverse behavior will be observed for measurements at an absorption minimum. Meehan [3] has given a simple example which verifies these two effects mathematically.
w u z « CD cr o Vl CD «
CONCENTRATION (PATH LENGTH)
o
b
FIGURE 1. Effect of spectral bandpass on absorbance: (a) Mono· chromatic radiation (b) Finite bandwidth.
Consider that an absorbing system is illuminated by two monochromatic radiations of wavelengths 1\1 and 1..2 and that the Lambert-Beer law is obeyed at each wavelength with absorptivities al and a2. If the effective intensities of the two wavelengths are II and 12 , respectively, the transmittance , T, IS
(1)
where b = path length and e = concentration. If Al is the wavelength of maximum absorption so that al > a2,then
(2)
where r = 12/11' The absorbance, A, defined as - log Tis
which may be differentiated with respect to be to give
At low absorbances
(5)
whereas when be becomes large, lOalbc ~ 10a2bc and the limiting slope is
(6)
Thus, the limiting absorptivity at low absorbances is is a weighted average of al and a2 while, at higher absorbances, it is equal to a2, the smaller of the individual absorptivities.
The theory for the correction of spectral bandpass errors has been developed by Hardy and Young [4], Eberhardt [5], and Broderson [6]. Rigorous calculation requires integration of the relation
(7)
where h is the incident intensity and SA is the spectral sensitivity of the detector. Equation (7) emphasizes the fact that the observed absorbance depends not only on the shape of the absorption curve, but also on the wavelength distribution of the source and the detector response. If hSA is constant over the wavelength interval used, approximate corrections for spectral bandpass may be calculated by assuming a Gaussian shape for the absorption peak and a triangular slit function for the instrument. Some calculations are given in table 1 based on these assumptions. The tabulated values of AObJA agree closely with those observed experimentally for A up to 1. As shown by Broderson [6] however, for values of RBW larger than 0.5, AObJA also depends on A and the above treatment is no longer applicable.
C. Stray Light
Stray light is defined as any light outside the spectral region isolated by the monochromator that reaches the detector. It is produced by scatter from the optics and
470

I TABLE l. Dependence of AObS on spectral bandpass at an absorption maximum under idealized conditions (see text)
RBW " AObJA RBW " AObJA
0.0100 0.99995 0.0800 0.9970 .0200 .9998 .0900 .9962 .0300 .9995 .1000 .9954 .0400 .9992 .2000 .9819 .0500 .9988 .3000 .9604 .0600 .9983 .4000 .9321 .0700 .9977 .5000 .8987
a Relative bandwidth: Ratio of spectral band· width to half bandwidth of fully resolved peak.
wall s of the monochromator and is present in varying amounts in all spectrophotometers.
Stray light can lead to varied problems in spectrophotometry. Spurious absorption bands may arise in some cases. More frequently, however, deviations
I from the Lambert-Beer law are produced. These deviations are positive if the stray light is absorbed and negati ve if it is not.
Exte nsive literature exists on the detection, ;fl easurement and mimization of stray light. Several of the more useful papers are those by Hogness, Zscheile and Sidwell [7], Perry [8], Slavin [9], and Poulson [10] In which additional references may be found.
The amount of stray light present is proportionally large in those wavelength regions where the transmission of the monochromator, the source intensity or th e detector sensitivity are relatively low. These regions, which should first be checked , are 200-230 nm and 600-700 nm. If a tungsten lamp must be used in the range 350--400 nm, a visible c utoff filter should always be e mployed.
The quantitative assessment of stray light requires the use of. extremely sharp c utoff filt ers. Slavin [9] and Poulson [10] have described a number of liquid and solid filters that may be used. Aqueous solutions of th e alkali halides, for example, are extremely useful in the ultraviolet. Care must be taken, however, that light leaks in the c uvet compartment are not contributing to the observed results. The apparent stray light will not vary appreciably with slitwidth if only instrumental stray light is present. In a quick test for light leaks, the apparent stray light will decrease rapidly as the slits are opened.
The stray light error encountered most frequently in spectrophotometry produces a decrease in an absorption peak and leads to negative deviations from the Lambert-Beer law. If it is assumed that none of the stray light is absorbed by the sample, the measured absorbance is related to the true tra nsmittance by the expression [9]
AObs= log [(l-T) S+ T] - I (8)
where S is the instrumental stray light expressed as a fraction. The effects of several levels of unabsorbed stray light on absorbance are given in table 2. Most
samples absorb sufficiently in other regions of the spectrum to filt er out a proportion of the stray light. Thus, indirect estimates of instrumental stray light based on deviations from linearity are generally low.
TABLE 2. Effect of unabsorbed s tray 'light :on absorbance
A A ObS
5 = 0.0001 5 = 0.001 5 = 0.01
0.1 0.1000 0.0999 0.0989 .5 .4999 .4990 .4907
1.0 .9996 .9961 .9626 1.5 1.499 1.487 1.384 2.0 1.996 1.959 1.701
D. Nonparallel Incident Radiation
A perfectly parallel beam of radiation must come from a point source and can carry only an infinitesimal amount of energy. The light beam in a spectrophotometer always has some finite angular size. As a result, the average light path is greater than the perpendic ular distance between the c uvet faces. Meehan [3] has considered the case in which the incident radiation is convergent or divergent in one dimension such as corresponds, respectively, to radiation focused by a cylindrical lens or leaving a narrow slit. If e and R are the angles of incidence and refraction, respectively, the path length of the extreme ray (fig. 2) is b/cos R and the absorbance of this ray is A/cos R. Other rays enter at smaller angles and the observed absorbance is given by
--\.'8 - -.
~ -
-b
FIGURE 2. Nonparallel incident radiation [3]. Reprinted by permis' sion of John Wiley & Sons. Incorporated.
JR max AObs=A/Rmax 0 l/cos RdR. (9)
For this relation to hold, the incident beam must be uniform over its cross section. Evaluation of this integral for Rmax of 2- 10° (emax = 2.7°-13.4°) gives the following percent errors in A (table 3). Thus, for angles of incidence up to 5 degrees , the absorbance error is less than 0.1 percent.
E. Multiple Reflections
On passage of light through a cuvet contammg solvent or sample solution, some radiation is reflected
471
470-063 OL - 72 - 7

TABLE 3. Dependence of absorbance error on nonparallelism of incident radiation
Rmax> degrees 8 max> degrees Percent error in A
2 2.7 0.020
4 5.3 .081
6 8.0 .18
8 10.7 .33
10 13.4 .51
at each of the two air-glass and the two glass-liquid surfaces. For perpendicular incidence, the. fraction / reflected on passing from a medium of refractive index nl to a second having refractive index n2 is given by the Fresnel expression
(10)
For an air-glass surface, /=0.04 and for a glass· liquid surface,/= 0.0035. When more than one surface is involved, the effects of multiple reflections must be considered. The essential question when dealing with liquid filters is whether the solvent completely compensates for such reflections. According to Goldring et al. [11], it does not. They consider the case where the reflections from all surfaces perpendicular to the 'light beam on the two ~ides of the sample are grouped together to form two effective reflection coefficients, Tl
and T2, as shown in figure 3. Considering only first and second order reAections, the observed absorbance is
T= I T<I
SOLVENT SAMPLE
FIGURE 3. Inte rnal multiple reflections [11]. Reprinted by permis' sion of the American Chemical Society.
which, after transformation and series expansion, can be reduced to the following expression:
Considering only the reflections from the two cuvet faces and that Tl=T2=0.05, the variation of AObS with A is
A 0.1 0.2 0.5 1.0 2.0
AobS 0.1004 0.2007 0.5010 1.0011 2.0011
Thus, because of internal multiple reflections, the measured absorbance should always be larger than the true absorbance with the percentage difference being greatest at low absorbances. Verification of these deviations is difficult experimentally. Goldring et al. [11], however, have suggested ways of minimizing reflection effects. These include positioning the cuvet at a small angle to the beam and stopping down the detector surface, immersing the cuvet in a fluid con· tained in a larger rectangular cuvet turned at an angle to the beam, or by using a cuvet with prismatic windows. In each case, the effective path length must be determined separately. Other alternatives consist
,of using cuvets constructed of absorbing materials or immersion of a glass filter into the sample. For a limited wavelength range, reflection errors can also be reduced by coating the external window surfaces with anti·reflection layers.
In addition to reflections from the cuvets, reflections from other surfaces must also be considered. Gibson [1] has pointed out that reflections may occur from the surfaces of the slit and detector and has suggested a means for checking this source of error. A thin glass plate is placed in its normal position at right angles to the beam and then at a small angle from this position. In the second position the reflected energy is directed out of the beam while scarcely affecting the true absorbance.
F. Cuvets
The majority of absorbance measurements are performed on solutions and, in such instances, the cuvet becomes an integral part of the measurement system. Presently, the uncertainty in the length of the light path can be a limiting factor in the determination of molar absorptivity. Nonparallelism of the end windows can be of even greater consequence. How· ever, the effect can be minimized by using the same cuvet orientation for all measurements. The uncertainty in path length is nevertheless greater.
Cuvets are available in a variety of shapes and sizes and may be made of glass or silica. Construction remains largely an art and cuvets may vary considerably in their quality. Two methods of assembly are commonly used. These are: (1) fusion using only heat and (2) the use of intermediate, low-melting glasses. At present, each has its disadvantage. The first technique is the more desirable, but our experience, primarily with rectangular cuvets, indicates that the edges are not always completely fused. These surfaces exhibit capillarity and may become serious sources of contamination. Under such condi· tions, the cleaning of these cuvets is difficult, if not impossible. The use of low-melting fluxes on the other hand can produce strains because of differences in coefficients of expansion and cuvets so constructed are generally more fragile.
Cuvets are frequently offered in matched sets. ThIS lDay be considered more of a convenience than a necessity since this terminology is normally used only to describe the transmission of the window material.
472

Path length and parallelism of end plates are of more fundamental importance. Unfortunately, no generally 'accepted tolerances have been established in this country for the construction of cuvets. The British Standards Institution, however, has published a set of specifications [12] which merit our consideration and possible adoption. They recommend that the path length be specified to ± 0.02 mm and the end windows :be flat over a defined beam area to four Newton fringes per centimeter in mercury green light. It should be feasible for greater accuracy, especially for the 10 mm cuvets, to calibrate a limited number by appropriate metrology techniques to ± 0.01 mm.
III. Evaluation of Selected Liquid Filters
This section is a report of our efforts to develop well characterized liquid absorbance standards. Three general types of liquid filters are discussed. These are (1) individual solutions of high purity materials, (2) em· pirical mixtures and (3) aqueous solutions of organic dyes. Much of the emphasis has been placed on deter· mining the optimum cond~tions for preparation of these filters and, once established, what the absorbing species or ionic compositions of these systems are. By combining this information with the instrumental considerations developed in the first part of this paper, it is hoped that the resulting data represent a step toward obtaining more meaningful absorptivity measurements.
A. Instrumentation
Absorbance measurements at a fixed wavelength were performed manually on a high precision double· beam spectrophotometer provided with a double monochromator. The accuracy of the photometric scale of this instrument was established with the NBS high· accuracy spectrophotometer described by Mavrodineanu [13]. The wavelength scale was checked with a mercury lamp. Potassium halide solutions [9, 10] were used to assess stray light in the ultraviolet.
Room temperature was maintained between 24 to 26°C. The cuvet compartment and jacketed holders were thermostated by a circulating water bath. Copper· constantan thermocouples were used to measure temerature differences between the bath and the sample solution.
An electronic feeler gauge [13] was used to measure the path length of the 10 mm rectangular cuvets normally used. Solutions, assumed to obey Beer's law, were used for calibrating the I mm cuvets.
The accuracy of the microbalance was established with NBS·calibrated weights. Class A, I·liter volu· metric flasks were checked gravimetically. All dilutions were subsequently made by volume. To minimize errors from cell positioning, borosilicate, Pasteur· type pipets were used to transfer solutions to and from the cuvets.
B. Individual Solutions of High Purity Compounds
1. Potassium Dichromate. Numerous attempts have been made to use chormium (VI) solutions as ultraviolet absorbance standards. In the early studies [7, 14, IS, 16, 17] alkaline solutions of potassium chromate were preferred. More recently, potassium dichromate in slightly acidic media has been described [18, 19, 20]. The absorption spectra of these two sys· tems are quite different with the latter giving the more desirable arrangement of maxima and minima (fig. 4).
The approximate composition of chromium (VI) solutions may be derived from the following equilibria:
1.0.-------,----------.------,-----------,
0,8
w ~ 0.6 <! aJ <r o (/)
aJ 0.4 <!
0.2
I. 10-4 M K2Cr20,10 ,05N KOH
Jr. 10-4 M K2Cr20,/10-3N HCL04
.J '--__ "'--____ ....!-____ -"-____ ---'
220 250 300 350 400 WAVELENGTH. nm
FIGURE 4. Absorption spectra of 10- ' M Cr (VI) in 0.05 N KOH and 10- 3N HCIO •.
(13)
(14)
(15)
Some values reported for the equilibrium constants K1, K2 , and K3 at 25°C are as follows:
KI =0.16 [21]
K2 = 3.2 X 10- 7 [22] and 3.0 X 10- 7 [23]
K3=43.7 [21], 35.5 [24] and 33.0 [25].
Thus, at a pH greater than 10, chromium (VI) exists almost entirely as CrOf ions while, in weakly acidic solutions, the predominant species is HCrO.! which partially dimerizes to Cr207'. The amount of dimer will increase with increasing chromium concentra· tion. The formation of H2Cr04 or CrOf can be es· sentially eliminated by maintaining the acidity near pH 3.
473
-------- ------ ---------- -------

Much of the uncertainty that has arisen from the use of acidic potassium dichromate solutions as potential absorbance standards can be attributed to the dimerization reaction (eq (15))_ It is primarily this equilibrium which leads to the observed deviations from Beer's law_ Because of the range of values reported for Ka, one of the first objectives of the present study was to redetermine this constant- The spectrophotometric method was chosen and is described in some detail below.
a. Spectrophotometric Determination of the Dimerization Constant for: 2 HCr04= = Cr2 Of + H 20. If HCrOI and Cr20f are the only Cr(yl) species present with molar absorptivities EI and E2, respectively, the apparent molar absorptivity, Em, will be given by
Em = (1 - a)EI + 1/2· aE2 (16)
where a is the fraction of total chromium in the dichromate form. From eq (15) the thermodynamic equilibrium constant of the dimerization reaction is
(17)
or, in terms of a
(18)
where 'YI and 'Y2 are the activity coefficients of HCrOf and Cr20f, respectively, and CrT is the total chromium concentration. Because the ionic strength never exceeded 0.01, the activity coefficients may be treated by the Debye-Hiickel expression [25]
AZ?/1/2 -log y .- '
'-1 +/1 /2 (19)
where Z is the ionic charge, / is the ionic strength and A has a value of 0.509 I/mol at 25°C. Equations (16) and (18) can be rewritten to give, respectively,
Em = a(1/2 E2 - EI) + EI (20)
and
a 2AJI/2 log Ka = log (21)
2(1 - a)2CrT 1 + JI /2
Assuming a value of K3 , one can calculate from eq (21) the a values at various total chromium concentrations. If the choice of K3 is correct, the measured values of Em should lie on a straight line of slope (1/2 E2 ,- EI) and intercept EJ, as seen from eq (20). The best value of Ka is then determined by the method of least squares.
1. Experimental Procedure
The chromium (VI) solutions used in the subsequent studies were prepared from NBS SRM-136c, potassium dichromate, which had been dried at no °C for two hours. The distilled water was shown to be free of reducing impurities by titration with a dilute potassium permanganate solution. Perchloric acid was used to maintain the pH at 3.0 ± 0.1.
The optimum wayelengths for the determination of K3 were chosen as follows: Two solutions were prepared, one containing 391 mg K2Cr207/1 and the other, 40.0 mg K2Cr207/1. The former was transferred to a 1.023 mm cuvet and the latter to a 10.00 mm cuvet. A differential scan was then made on a recording spectrophotometer equipped with a 0-0.1 absorbance (full scale) slidewire, using the less concentrated solution as the reference. The resulting spectrum is shown in figure 5. Relatively large differences in absorbance are seen in the wavelength regions near 275 and 385 nm even though the total number of chromium atoms in each light path is the same. Thus, it is in these two regions that the largest deviations from Beer's law should be observed. Three wavelengths were subsequently selected in each region for the determination of Ka-390, 385 and 380 and 280, 275 and 270 nm, respectively.
0.06
0.05
0.04
6A
0.02
0. 0 1
o ~------------------~----~~--------~
-0.01
220 250 300 WAVELENGTH,nm
350 400
FIGURE 5. Difference spectrum of 391 mg K2Cr207/1 in 1.023 mm cuvet versus 40.0 mg K2Cr207/1 in 10.00 mm cuvet; pH = 3.
2. Results
The apparent molar absorptivities calculated from absorbance measurements on the four chromium concentrations used for the determination of K3 are given in table 4. Using the method of least squares, these Em values were plotted against the a fractions calculated from eq (21) for various assumed values of Ka. The molar absorptivities were weighted according to the reproducibility of the absorbance measurements. A computer was used for all calculations.
474

A typical graph of the residual standard deviation of the experimental Em values from the best straight line fit is shown in figure 6 for K3 values of 28 through
36. The mInImum in this curve is the best estimate of K3 and, for the case shown, is 32.6. The K3 values at the six wavelengths are summarized in table 5.
TABLE 4. Apparent molar absorptivities, Em, of K2Cr207 solutions at 25°C; pH = 2.9 (HCI04)
z 2 .... .. :; \oJ 0
0 a: .. 0 z .. .... V)
...J .. ::> 0 u; \oJ a:
K2Cr207 Cone. mg/J
390 nm 385 nm
100.06 589.2 748.7 400.48 714.1 878.6 699.86 806.2 973.8
1000.27 875.9 1045.6
2 .0 ...--.,..---,----,--r--,.----,---,-----,
1.6
1.2
0.8
0.4
O L__~ _ _L_~ __ L__~ _ _L_~_~
28 30 32 34 36
K3
FIGURE 6. Least squares determination of K 3•
I TABLE 5. Ka values at 25°C as determined at several wavelengths
A,nm
390 385 380
280 275 270
Ka
32.4 33.3 33.8
33.5 32.6 31.6
Ayg. 32.9 Std. Dey. 0.8
ReI. Std. Dey. 2.5%
€'" I/mol - ! cm- !
380 nm 280 11m 275 nm 270 11m
865.1 1579.3 1718.6 1881.0 997.8 1758.2 1914.4 2069.8
1094.0 1890.0 2053 .5 2208.0 ll66.5 1988.2 2161.5 2313.6
b. Absorption Spectra of HCrO; and Cr20'1. The absorbances of three solutions containing nominally 20, 40, and 60 mg K2 Cr2 07/l (pH = 3.0 ± 0.1) were measured in a 10.00 mm cuvet at 5 nm incre~ ments over the wavelength range of 220-400 nm. A. close approximation of E(HCr04") was obtained by extrapolating the apparent molar absorptivities to zero chromium concentration. This extrapolation is simplified since the variation of a is nearly linear over this concentration range. Similar absorbance measurements were performed on three solutions containing 1000 mg K2Cr207/1 using a 1.023 mm cuvet and the corresponding a value was calculated from eq (21), with K3 = 32.9. The first approximations of 1/2· .f( Cr20n values were obtained by substituting the extrapolated E(HCr04" ) results and the above a value into eq (20). The E(HCrO,j) and 1/2' E(Cr20 7) values were then refined by successive approximations. The calculated absorption spectra of these two ions are shown in figure 7. .
IE 4000 u ., ., ° E ..., ,.: .... > >= a.. 2000 a: 0 Vl CD <t a: <t ....J 0 ::;;
o~ __ ~ ____ ~ ____ ~ ___ ~ 250 300 350 400
WAVELENGTH. nm
FI GU RE 7. Absorption spectra of HCrO, and Cr20,.
c. Molar Absorptivities of HCr04- and Cr20f at 350,313,257, and 235 nm. As shown previously in figure 4, the absorption spectrum of weakly acidic solutions of K2Cr2 07 exhibit maxima at 350 and 257 nm
475

and nlllllma at 313 and 235 nm. These maxima and minima do not shift significantly over the concentration range of 20-100 mg K2Cr207/1. This is considered a practical range for most applications since it yields absorbances of about 0.1-1.5 for a 10 mm cuvet.
The molar absorptivities of H CrOi and Cr207 at 350, 313, 257, and 235 nm were determined by the procedure described above and are given in table 6. The e(HCrOi) values are estimated to be accurate to ± 0.5 percent. Because of the imprecision of the K3 determination, the uncertainty of the dichromate molar absorptivity values may be as large as ± 5 percent.
TABLE 6. Molar absorptivities, E, of HCrO" and Cr20; at 25°C
HCrO.
1/2 ' Cr20~
E, I mol- I em- I
350 nm 313 nIIi 257 nm 235 nm
1576
1788
711
823
2100
3156
1804
2688
Table 7 shows the agreement between the experimental and calculated apparent molar absorptivities for five concentrations of potassium dichromate in dilute perchloric acid (pH = 2.92 ± 0.02). The experimental values are the averages obtained on five individual samples measured at each concentration. The 95 percent confidence limits for any given set of measurements was 0.1 percent. The a values used are also given. These are seen to vary nearly linearly over the range of chromium concentrations employed.
d. Optimum pH and Choice of Acid. The chromium (VI) solutions used in this study were prepared in dilute perchloric acid media having a pH of about 3. This acidity was selected because the existing equilibria data indicated this pH limited the formation of either H2Cr04 or CrO'4 to less than 0.1 percent of the total Cr (VI) concentration. Perchloric acid was chosen instead of sulfuric to prevent the formation of chromate-sulfate complexes. Tong and King [24] and Davies and Prue [25] noted slight differences in the absorbances of dilute perchloric and sulfuric acid solutions after correcting for differences in ionic strength. They attributed these differences to mixed complex formation. More recently, Haight et al. [26] have shown that the conversion of HCr04 to CrS07' is quantitative in 1 M HS04 solutions and that absorption spectrum of this complex is significantly different from the HCrOi spectrum.
Because most of the previous work reported in literature has been done in sulfuric acid, it was considered of interest to intercom pare these two systems. The results are shown in each acid between pH 2 and 3. At 350 nm the results obtained in perchloric acid are consistently 0.1-0.2 percent higher than in sulfuric; at 235 nm, they are lower. The relatively large increase in absorpti~ity at 235 nm at pH 1.90, together with the above considerations, suggest the formation of additional chromium (VI) species in systems employing dilute sulfuric acid s olutions. (See table 8.)
e. Effect of Temperature. The absorbances of a solution containing 60 mg K2Cr207/1 in dilute perchloric acid (pH = 3) were measured over the temperature range of 17 to 37°C. The percentage change in absorbance for wavelengths of 350, 313, 257, and 235 nm is shown in figure 8. The results are uncorrected for
TABLE 7. Experimental and calculated values (E, C) of the apparent molar absorptivity of K2Cr207 at 25°C; pH=2.9(HCI04)
Em , I mol -I em- I K2 Cr207 (one.
mg/I a 350 nm 313 nm 257 nm 235 nm
20.22 0.0090 E 1577.6 713.5 2113.6 1814.7 ( 1577. 9 711.9 2108.7 1812.1
Diff. - 0.3 +1.6 + 4.9 + 2.6
40.09 0.0178 E 1579.9 71 3.3 2120.8 1820.2 ( 1579.8 713.0 2118.8 1819.7
Diff. + 0.1 + 0.3 +2.0 + 0.5
60.12 0.0262 E 1581.4 713.8 2127.2 1827.1 ( 1581.5 713.8 2126.7 1827.2
Diff. - 0.1 0.0 + 0.5 -0.1
80.17 0.0344 E 1584.0 715.0 21 37.6 1835.8 C 1583.3 714.8 21 35.3 1834.4
Diff. + 0.7 + 0. 2 + 2.3 + 1.4
99.92 0.0423 E 1585.5 715.6 2144.0 1841.5 ( 1584.0 715.0 2143. 7 1841.4
Diff. + 1.5 + 0.6 + 0. 3 + 0.1
476

TABLE 8. Apparent absorptivities, a, of sulfuric and perchloric acid solutions of K2Cr207 at 25°C; K2Cr207 conc. =0.050 gJI
pH
1.90 1.98 2.20 3. 00
HClO. 1.99 3.08
0 .6
~ 0.4
W '" 0.2 z <t I
0 U
W U Z -0.2 <t (Il
~ -0.4 (J) (Il
<t -0 .6
-0.8 15 20
a. I g- ' cm-'
350 nm 313 nm
10.710 4.83, 10.71, 4.83. 10.722 4.83. 10.733 4.844
10.72, 4.84. 10.740 4.845
25 30 TEMPERATURE.oC
257 nm 235 nm
14.44. 12.43, 14.440 12.41. 14.42. 12.40, 14.42, 12.38,
14.44. 12.396
14.434 12.383
............ 3508257nm
', .... 235~m
35 40
FIGURE 8. Change in absorbance with te mperature for acidic solutions ofK2Cr20,; pH = 3 (He I04).
thermal expansion of the solvent. The absorption minimum at 313 nm exhibits the smallest temperature dependence (- 0.02 percent per 0c) while the maxima at 350 and 257 nm and the minimum at 235 nm have temperature coefficients of - 0.05 percent per °C over the range 20 to 30°C.
f. K 2Cr207 in 0.5 M Na2HP04 and 0.05 M KOH. To overcome some of the difficulties in handling strongly alkaline chromate solutions, Johnson [27] has recommended dissolving K2 Cr2 07 in 0.05 M Na2HP04
at pH 9. The apparent molar absorptivities obtained in this medium and in 0.05 M KOH are given in table 9. As seen from the data, both systems appear to exhibit deviations from Beer's law of about three parts per thousand over the concentration range studied. Although this deviation is the same magnitude and direction predicted from uncompensated internal multiple reflections discussed previously, we have not been able to demonstrate experimentally that such reflections are responsible for the observed results. Studies in which the covet windows are coated with various antireflection layers are continuing however.
TABLE 9. Apparent molar absorptivity of potassium chromate in 0.05 M Na2 HP04 and 0.05 M
KOH at 25°C
0.05 M Na2HP04
Em. I mol- ' cm- ' K2 Cr04 Cone .•
M X 10" pH 373 nm 274 nm
7 9.2 482, 3703
14 9.1 4820 369, 21 9.1 481, 3692
0.05M KOH
7 ..... .. ... ... .. 4830 3705
14 ........... .... 482. 369. 21 ..... .. ... .... . 481. 369,
From a consideration of the equilibrium data, the absorbances in the two systems should be nearly identical. The ionic strength of the 0.05 M Na2HP04
is 0.15 and, from Neuss and Rieman's work [22], the ionization constant for the reaction HCrO"4 = H+ + CrO'4 is approximately 9 X 10- 7 mol/liter. Thus, at pH 9.1, only about 1 in 1000 chromium atoms is present as HCr04. Since this species is less absorbing than Cr04' at 373 and 274 nm, the apparent molar absorptivities in 0.05 M Na2HP04 should agree with those obtained in 0.05 M KOH to within 0.1 percent.
The absorbance of alkaline chromate solutions decreases with increasing temperature at both absorption peaks. Between 17 and 37°C, the temperature coefficient at 373 nm is - 0.09 percent per °C; at 274 nm, it is - 0.06 per 0C.
2. Potassium Nitrate. Aqueous solutions of potassium nitrate exhibit a nearly symmetrical absorption peak with Amax at 302 nm. This system has been studied extensively by Vandenbelt [14] and by the British Photoelectric Spectrometry Group in two collaborative tests [28, 29]. Molar absorptivities reported vary from 7.06 to 7.20 liter mol- 1 cm- I • This range of values undoubtedly results in part from the fact that KN03 solutions deviate significantly from Beer's law.
Careful reexamination of this system has yielded the following apparent molar absorptivities (table 10). These are seen to decrease rather markedly with increasing potassium nitrate concentration. Several factors conceivably contribute to this behavior. In addition to possible multiple reflection effects already discussed some ionic interactions are undoubtedly possible in this system because of the relatively high concentrations of solute required coupled with the fact that the N - 0 bond in the nitrate ion has some polar character.
The potassium nitrate used in the above study was analyzed for commonly encountered impurities. Mter drying at 110°C, the water content was less than 0.02 percent. Flame emission analyses [31] indicated the following levels of alkali and alkaline earth impurities
477

(in parts-per-million): Li « 0_2); Rb (13); Mg (0_2); Ca (1); Sr(4) and Ba « 2)_
At 302 nm, the absorbance of KN03 solutions decreases with increasing temperature. Over the range 17 to 37°C, the temperature coefficient is - 0.14 percent per 0c.
Solutions stored for up to six months showed no measurable change (~0.1 percent) in absorbance. Edisbury [29] has cautioned, however, that some solutions may develop bacterial whiskers on standing. Sterilization may be effected by prior boiling of the distilled water.
TABLE 10. Apparent molar absorptivity, Em, of aqueous solutions of potassium nitrate at 25°C
€"" 1 mol- I em- I
KN03 Cone., M 302 nm a
0.028 7.16 • . 056 7.142 .084 7.127 .112 7.106
.140 7.09,
a Spectral bandpass = 1.0 nm
3. Potassimn Hydrogen Phthalate. High purity potassium hydrogen phthalate (KHP) is readily available. It is presently issued by the National Bureau of Standards as a primary acidimetric standard. Its use in the preparation of buffer solutions of known pH is well established. It has also been used as a spectral standard in the comparative evaluation of spectrophotometers [11, 32].
The absorbance of KHP solutions is dependent on acidity, as shown in figure 9. In the present study, dilute perchloric acid solutions were employed to minimize changes in ionic composition as a function of pH. Acid concentrations much above 0.1 N could not be used because of the precipitation of potassium perchlorate. Subsequently, all solutions were prepared to contain 10 ml of perchloric acid per liter with a pH of 1.3.
Ringbom [21] has given the first ionization constant of phthalic acid as 1.6 X 10- 3 at 25 °C at an ionic strength of 0.1. At the pH used, the absorbing system consisted of 97 percent phthalic acid and 3 percent hydrogen phthalate ions. Table 11 summarizes the absorptivity values obtained on these solutions.
Absorbance decreases at the 275.5 nm maximum and increases at the 262 nm minimum with increasing temperature. Over the range 17 to 37°C the temperature coefficients are - 0.05 percent and + 0.05 percent per °C, respectively.
Perchloric acid solutions of KHP (NBS-SRM 84g) were examined for possible fluorescence, using a high sensitivity spectrofluorometer. With 280 nm excitation, a faint fluorescence was detected with Amax at approximately 350 nm. The possible effects of this fluorescence on the absorbance data remain to be established.
O.8~~---'--'---'--'---'---r--~--r--'
Iw > => u E E g 0.4 w u Z <! CD a:: o en CD <!
250
POTASSIUM HYDROGEN PHTHALATE
NBS - SRM B4<;l
I. 122 mg / liter 0.1 t-! HCL04
2. 103 mg / I iter Dist. H20
3.141 mg / liter It-! KOH
300 WAVELENGTH, nm
350
FIGURE 9. Absorption spectra of KHP solutions at different acidities.
TABLE 11. Apparent absorptivity, a, of potassium hydrogen phthalate in dilute perchloric acid
at 25°C; 10 ml HCI0 4/liter
NBS SRM 84g Cone., gil 275.5 nm
0.034 6.332
.142 6.319
262 nm
4.49, 4.489
4. Cobalt and Nickel Sulfates and Perchlorates. Aquo cobalt (II) and nickel (II) ions have relative broad absorption peaks with Amax at 512 and 394 nm, respectively (fig. 10). Solutions of either may serve as useful absorbance standards_ Most of the attention to date, however, has been directed at cobalt sulfate which was first recommended by Gibson [1].
In this study, the apparent molar absorptivities of Co(H20)t2 and Ni(H20)t2 were examined in sulfate and perchlorate media. All solutions were prepared from the high purity metals by dissolution in H2SOC HN03
or HCI04- HN03 acids. Nitrate was removed by repeated fuming until the acidity was reduced so that on dilution to volume, a pH of 1 could be obtained. The results obtained in the two acid media are given ~n table 12. The values in sulfate solution are significantly higher than in perchlorate media for both cobalt and nickel, suggesting that some complexation of these ions by SO'4 or HS04 has occurred. A differ-
478
w u Z <! <D a: o (/)
<D <!
0.6 .-------.----,.----.------.-------.
0.4
0.2
400 500 WAVELENGTH, nm
600
FIGURE 10. Absorption spectra of Ni(H20);2 and Co(H20);2.
TABLE 12. Apparent molar absorptivities , EIII of acidic solutions of cobalt and nickel ions
at 25°C; pH = 1.0
Co Cone. gil
2.4 12.0
Ni Cone. gil
2.3 1l .5
f'", (512 nm) I mol- I e m- I
Sulfate Perchlorate
4.88, 4.869
4.803
4.79,
f'm (394 nm) I mol- ' cm- I
Sulfate P erchlorate
5.16, 5.090
5.154 5.07,
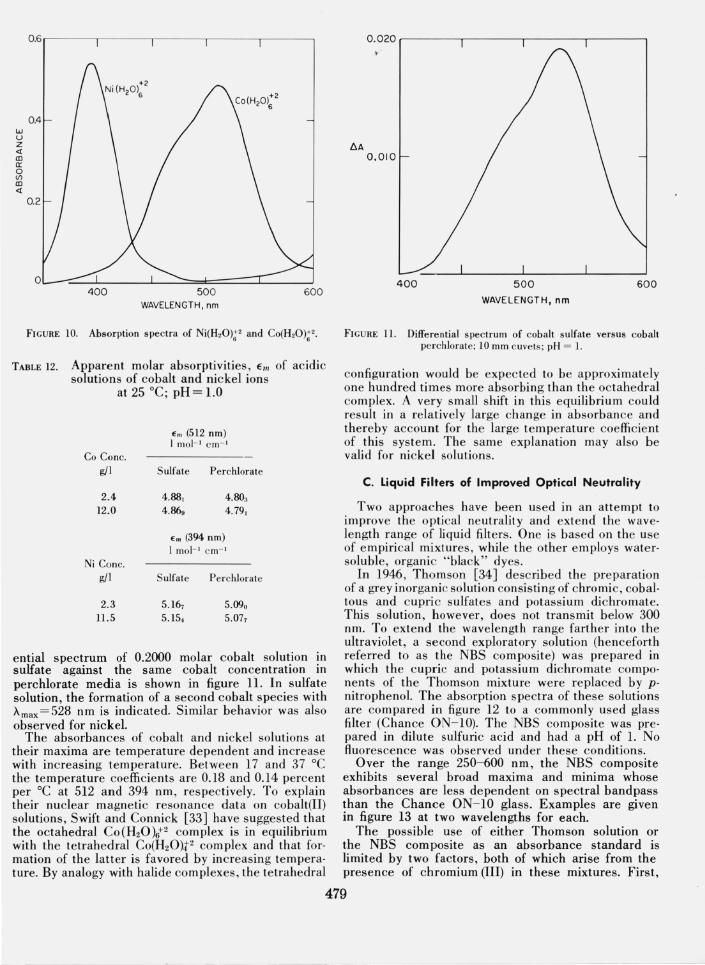
ential spectrum of 0.2000 molar cobalt solution in sulfate against the same cobalt concentration in perchlorate media is shown in figure ll. In sulfate solution, the formation of a second cobalt species with Amax =528 nm is indicated. Similar behavior was also observed for nickel.
The absorbances of cobalt and nickel solutions at their maxima are temperature dependent and increase with increasing temperature. Between 17 and 37°C the temperature coefficients are 0.18 and 0.14 percent per °C at 512 and 394 nm, respectively. To explain their nuclear magnetic resonance data on cobalt(II) solutions, Swift and Connick [33] have suggested that the octahedral Co (H20 )l2 complex is in' equilibrium with the tetrahedral Co(H20)t 2 complex and that for· mation of the latter is favored by increasing tempera· ture. By analogy with halide complexes, the tetrahedral
0 . 020r----~---~----~---~ ..
t:.A 0,010
400 500
WAVELENGTH, nm 600
FIGU RE 11. Differential spectrum of cobalt sulfate versus cobalt perchlorate; 10 mm cuve ts; pH = 1.
configuration would be expec ted to be approximately one hundred times more absorbing than the octahedral complex. A very small shift in this equilibrium could result in a relatively large change in absorbance and thereby account for the large temperature coeffi cient of this system. The same explanation may also be valid for nickel solutions.
C. Liquid Filters of Improved Optical Neutrality
Two approaches have been used in an attempt to improve the optical ne utrality and extend the wave· length range of liquid filters. One is based on the use of e mpirical mixtures, while the other e mploys water· soluble, organic "black" dyes.
In 1946, Thomson [34] described the preparation of a grey inorganic solution consisting of chromic, cobal· tous and cupric sulfates and potassium dichromate. This solution, however, does not transmit below 300 nm. To extend the wavelength range farther into the ultraviolet, a second exploratory solution (henceforth referred to as the NBS composite) was pre pared in which the cupric and potassium dichromate compo· nents of the Thomson mixture were replaced by pnitrophenol. The absorption spectra of these solutions are compared in figure 12 to a commonly used glass filter (Chance ON- I0). The NBS composite was prepared in dilute sulfuric acid and had a pH of 1. No fluorescence was observed under these conditions.
Over the range 250- 600 nm, the NBS composite exhibits several broad maxima and minima whose absorbances are less dependent on spectral bandpass than the Chance ON-I0 glass. Examples are given in figure 13 at two wavelengths for each.
The possible use of either Thomson solution or the NBS composite as an absorbance standard is limited by two factors, both of which arise from the presence of chromium (III) in these mixtures. First,
479

w u z <[
~ 0.5 o C/J CD <[
300
----- CHANCE ON - 10 - - - THOM SON SOLU T ION - - NBS COM POSITE
400 WAVELENGTH, nm
500
... ."
600
FIGURE 12. Absorptioo spectra of Thomas solution, an NBS composite and a Chance ON- lO glass.
0 .340 ,---~--,----'----r---'--'---"------'
w 0.320 u z <[ CD n:: o (f) (]) <[
0 .310
0 .300
0.290
ON-tO (445 nm)
NBS(4t5nm)
0. 280t=~==~==~~~--}_--L_.-L--.J to 20 30 60 70 80
SPECTRAL BANDPASS. nm
FIGURE 13. Variation of absorbance with spectral bandpass for NBS composite and Chance ON- 10 glass.
an initial "aging" of 6-8 weeks period is needed in order to achieve adequate spectral stability at room temperature. Secondly, and even more critical for our purpose, is that the absorbances of the aged solutions exhibit a nonreversible temperature dependence. They must therefore always be stored at the temperature at which they were aged.
Hall and Eyring [35] have studied the constitution of chromic salts in aqueous solution and have suggested that during the aging process Cr(H20)6'3 ions polymerize to 'yield species of the type
and
in which the observed increase in acidity is explained by the formation of -DH bridges. Recent studies [36] have shown that temperature, initial pH and the type of anio~. present significantly affect the equilibrium CO";1posltIOn. Although refluxing can reduce the aging penod from several months to several hours this is of no prClctical advantage since the high tem~erature pr.oducts, on cooling, are no longer stable.
In addition to the investigation of empirical mixtures, several water-soluble organic dyes have also been ~tudied. Some typical absorption spectra are shown In figure 14. All of these dyes have high absorptivities and the concentrations used were of the order of 50 milligrams per liter.
1.0 IT~'-------r-----'-----~----
w u Z <[ CD :s 0.5 (f)
CD <[
200
/\ - - ---- NEOLAN BLACK
-- -- CIBALAN BLACK • / \ -- ALIZARIN LIGHT GREY ./- ........
... \ - - - LUXOL FAST BLACK L /
\ '""'_~'" \ - - NIGROSINE .,/
\,'" ~;'~~~_'-;;Z;::~.~~ ~.-::-:~::::::=J -------------
300 400 500 600 WAVE LENGTH , nm
FIGURE 14. Absorption spectra of aqueous solutions of selected dyes.
Cibalan Black [37], Neolan Black [37] and Alizarin Light Grey [38] were selected for further evaluation. Aqueous solutions of these dyes were found insensitive to pH over the range 2-9, not affected by heat and relatively light fast. Solutions continuously exposed to fluorescent light exhibited an absorbance change of about 1 percent over a period of two months. These initial results appeared sufficiently promising to warrant purification and more extensive testing. Members of the Organic Chemistry Section have assisted in this effort. The purification of these dyes has proven extremely difficult, however, and yields of only a few hundred milligrams of each have been obtained. Much larger quantities are needed if these dyes are to be used as Standard Reference Materials. More efficient purification procedures are presently being sought.
D. Standard Reference Material (SRM) 931
The first liquid absorbance standard to be issued by the National Bureau of Standards is SRM 931. The preparation and certification of this Standard Reference Material are described below.
The filters were prepared by dissolving high purity cobalt and nickel in a mixture of nitric and perchloric acids. The weights of cobalt and nickel were chosen so that the absorbances of their aquo complexes were approximately equal at their absorption maxima. The absorbance of nitrate was adjusted to a comparable level by evaporation and subsequent addition
480

395 ,
678
400 500 WAVELENGTH, nm
600 700
FIGURE 15, Typical absorption spectrum of SRM 931.
of small amounts of nitric acid. The final pH of these mixtures was about 1.
An absorption spectrum of a typical filter is shown in figure 15. The peaks at 302 and 512 nm are due to absorption by NOs and Co(HzO)tZ , respectively. The peak at 395 nm and the plateau at 650-700 nm are due to Ni(HzO)t 2 •
The filters are supplied in 10 ml ampoules which
have been prescored for easy opening. An SRM unit consists of three sets of filters, each set containing a "Blank" (O.lN perchloric acid) and three absorbance levels of the filter. Each set is packaged in an individual tray for added convenience.
The filters were calibrated by randomly selecting ampoules from each lot. The certified absorbances are as follows:
TABLE 13. Certification of NBS SRM 931
Net absorbance"
Wavelength and (Bandpass), nm
Filter 302(1.0) 395(1.7) 512(2.0) 678(6.5)
"A" - 'Blank' 0.307 ± 0,003 0,304 ± 0.003 0,303± 0,003 0,115 ± 0.002
"B" - 'Blank' 0,608 ± 0,00S 0,60S ± 0,00S 0,606 ± 0.00S 0, 229 ± 0.003
"c" - 'Blank' 0.906 ± 0.007 0,907 ± 0,007 0,9]) ± 0,007 0.34S ± 0,003
• Net absorbances "A" - 'Blank,' "B" - 'Blank,' and "C" - 'Blank' were determined using 10.00 mm cuvets at 25.0 0c.
The uncertainties are given at the 95 percent confidence level and include a possible systematic error of ± 0.5 percent.
Absorbances are certified at 25.0 0c. Absorbances at other temperatures in the range 17 to 37°C may be calculated using the formula:
At = A25[1 + CA(t - 25)]
where: At =Absorbance at temperature t (vC) A25 = Absorbance certified at 25.0 °C CA = Fractional change in absorbance per °C
The values of CA at the four wavelengths are given below.
A, nm CA
302 -0.0014 395 + 0.0014 512 +0.0018 678 +0.0014
The absorbances of these filters will also depend on the spectral bandpass used. To insure that the measured absorbances do not differ by more than ± 0.1 percent from the true values, the effective 'spectral bandpass should not exceed 1.5,2.0,3.3, and 8.5 nm at 302,395,512, and 678 nm, respectively.
IV. Conclusion
The availability of well characterized materials from which the analyst prepares his own solutions is preferable to the issuance of ampouled iiquids. Although the former are not as convenient to use, they offer potentially greater accuracy because of their better stability.
The potassium dichromate and potassium hydrogen phthalate used in this study are issued by NBS as primary oxidimetric and acidimetric standards (SRM 136c and 84g, respectively). The potassium nitrate is presently issued as a thermal analysis standard (SRM 756). A product of comparable purity may be
481

obtainell by repeated recrystallization of reagent-grade materi~ from distilled water. The cobalt and nickel solutiori~ are best prepared from the high purity metals which '(u'e commercially available.
To certify absorptivities for these materials, one must resolve the question as to how well these systems obey Beer's law. For acidic potassium dichromate, the increased dimerization of HCr04 to Cr2 0 7' with increasi'ng chromium concentration primarily accounts for tl1e relatively large deviations observed. With potassi:iJm nitrate, one can only speculate that ionic interactions are ennanced at the higher concentrations. In neither instance are these deviations &ufficientlylarge to limit the usefulness of these materials as liqulq absorbance standards. Such deviations do requi~ that the absorptivity data be used with proper preca·utions.
Additional studies are needed to explain the 0.2-0.3 percent deviations from Beer's law obtained for the various concentrations of alkaline chromate, potassium hydrogen phthalate, cobalt perchlorate and sulfate., apd nickel perchlorate and sulfate. Although internai multiple reflection effects appear to be of the proper magnitude to account for these differences, initial attempts to measure such effects with magnesium fluoride-coated cuvets have not been successful. While extremely durable, magnesium fluoride reduces reflections by about 50 percent and more efficient coatings will probably be needed to resolve this problem. If internal reflections are responsible for the observed deviations, the absorptivity data given should not be corrected when using liquid absorban'ce standards for checking the accuracy of the photometric scale since these reflections are inclucted in every measurement. However, in the determination of molar absorptivity, which is considered a fundamental property of the material, appropriate corrections should be applied. Until this question can be resolved, it is recommended that these materials be used at concentrations which yield an absorbance of at least 0.5 when measured in a 10 mm cuvet. With this restriction, it is believed that the uncertainty of the absorptivity data does not exceed ± 0_5 percent at the 95 percent confidence level.
The authors wish to express their appreciation to Radu Mavrodineanu for providing the calibrated Schott filters and to David S. Bright for performing the computer calculations on the HCr04/Cr20 f equilibrium.
V. References
[1] Gibson, K. S. , Nat. Bur. Stand. Circular 484 (1949). [2] Harrison, G. R., M.I.T. Wavelength Tables (John Wiley & Sons,
Inc., New York, N.Y. , 1969). [3] Meehan, E. J ., 'Treatise on Analytical Chemistry' , Kolthoff,
I. M., and Elving, P. J., Editors, Part 1, Volume 5, Chapter 54 (John Wiley & Sons, Inc., New York, N.Y. , 1964).
(4) Hardy, A. c., and Young, F . M., J. Opt. Soc. Am. 39, 365 (1949).
(5) Eberhardt, W. H., ]. Opt. Soc. Am. 40, 172 (1950). [6] Broderson, S., J . Opt. Soc. Am. 44 , 22 (1954). [71 Hogness, T. R. , Zscheile, F. P ., and Sidwell , A. E., J. Phys.
Chern. 41,379 (1937). (8) Perry, J. W. , Photoelectric Spectrometry Group Bull. 3, 40
(1950). [9] Slavin, W. , Anal. Chern. 35 , 561 (1963).
[10] Poulson, R. E., Appl. Opt. 3,99 (1964). [11] Goldring, L. S. , Hawes, R. c., Hare, G. H., Beckman , A. 0. ,
and Stickney, M. E. , Anal. Chern. 25, 869 (1953). (12) British Standard 3875, British Standards Institution (1965). (13) Mavrodineanu, R. , Nat. Bur. Stand. (U.S .), Tech. Note 584,
178 pages (1971) , O. Menis and J. 1. Schultz, Eds. (14) Vandenbelt, J. M., Forsyth, J. , and Garrett, A. , Anal. Chern. 17 ,
.235 (1945). [15) Haupt , G. W., J. Opt. Soc. Am . 42, 441 (1952). (16) Haupt , G. W. , J. Res. Nat. Bur. Stand. 48,414 (1952). [17] Vandenbelt , J. M., and Spurlock , C. H. , ]. Opt. Soc. Am. 45 ,
967 (1955). [18) Gridgeman, N. T., Photoelec tric Spectrometry Group Bull. 4 ,
67 (1951 ). [19) Ketelaar, J. A. A., Fahrenfort , ]., Haas, c., Brinkman, G. A. ,
Photoelectric Spectrometry Group Bull. 8, 176 (1955). [201 Va.ldenbelt, J. M., J. Opt. Soc. Am. 50,24 (1960). [21) Ringbom, A., Complexation in Analytical Chemistry, (John
Wiley & Sons, Inc. , New York , N.Y., 1963), p. 294. [22) Neuss, J. D., and Rieman, W. , J. Am. Chern. Soc. 56, 2238
(1934). [23) Howard , J. R., Nair, V. S. K. , and Nancollas, G. H. , Trans.
Faraday Soc. 54, 1034 (1958). [24) Tong, J. , and King, E. L. , J. Am. Chern. Soc. 75 , 6180 (1953). [25) Davies, W. G., and Prue, ]' E. , Trans. Faraday Soc. 51 , 1045
(1955). [26) Haight , G. P. , Richardson, D. c. , and Coburn, N. H. , J. Inorg.
Chern. 3, 1777 (1964). [27] Johnson, E. A. , Photoelectri c Spectrometry Group Bull. 17 ,
505 (1967). [28) Edisbury, J. R., Photoelectric Spectrometry Group Bull. 1 ,
10 (1949). [29] Edisbury, J. R. , Photoelectric Spectrometry Group Bull. 16,
441 (1965). [30J Malitson , 1., private communication. [31) Rains, T. c., private communi cation. [32) Ewing, G. W., and Parsons, T. , Anal. Chern. 20,423 (1948). [33J Swift , T.]. , and Connick, R. E.. J. Chern. Phys. 37 .307 (1962). [34] Thomson, L. c., Trans. Faraday Soc. 42,663 (1946). [35] Hall , H. T ., and Eyring, H., J. Am. Chern. Soc. 72 , 782 (1950). [36] Burke, R. W., and Deardorff, E. R., Nat. Bur. Stand. (U.S.),
Tech. Note 544, 153 pages (1970) , O. Menis and J. I. Schultz, Eds.
[37] Ciba Chemical and Dye Company, Fair Lawn, New Jersey. [38] Industrial Chemicals Division, Allied Chemical Corporation,
Buffalo, New York.
(Paper 76A5-733)
482