Quantitative absorbance spectroscopy with unpolarized...
14
American Mineralogist, Volume 93, pages 765–778, 2008 0003-004X/08/0506–765$05.00/DOI: 10.2138/am.2008.2656 765 Quantitative absorbance spectroscopy with unpolarized light: Part II. Experimental evaluation and development of a protocol for quantitative analysis of mineral IR spectra ISTVÁN KOVÁCS, 1, * JÖRG HERMANN, 1 HUGH ST.C. O’NEILL, 1 JOHN FITZ GERALD, 1 MALCOLM SAMBRIDGE, 1 AND GÁBOR HORVÁTH 2,3 1 Research School of Earth Sciences, The Australian National University, Building 61, Mills Road, 0200, Canberra, ACT, Australia 2 Centre for Computer Science and Informatics Research, University of Hertfordshire, College Lane, Hatfield, Hertfordshire, AL10 9AB, U.K. 3 Department of Algebra and Number Theory, Eötvös Loránd University, Budapest, Pázmány Péter sétány 1/C, 1118, Hungary ABSTRACT The predictions of the theory of light propagation in weakly absorbing anisotropic minerals are tested against systematic measurements of the infrared absorbance spectra of calcite, olivine, and topaz oriented in both principal and random sections, using both polarized and unpolarized light. We show that if the linear polarized maximum absorbance is smaller than ~0.3, or if the ratio of maximum and minimum absorbance is close to unity, then (1) the polarized maximum and minimum absorbances as well as the unpolarized absorbance are, to a good approximation, linearly proportional to thickness, regardless of the direction of the incident light; (2) the angular variation of polarized light absorption is indistinguishable from the theoretical predictions within the uncertainty of the measurements; (3) for any section the unpolarized absorbance is the mean of the polarized maximum and minimum absor- bance; and (4) the average unpolarized absorbance of randomly oriented grains is one third of the Total Absorbance (defined as the sum of the three principal absorbances). Therefore, calibrations relating Total Absorbance to absorber concentration in minerals that have been developed from measurements with polarized light parallel to the principal axes may be applied to measurements with unpolarized light on a population of randomly oriented sections. We show that 10 such measurements are sufficient to achieve a petrologically useful accuracy. The method enables water concentrations in nominally anhydrous minerals to be determined from samples where the preparation of oriented specimens is not feasible, such as high-pressure experimental runs and fine-grained mantle xenoliths. The method may also be used for obtaining quantitative measurements on low-symmetry minerals. Keywords: Infrared spectroscopy, absorbance spectroscopy, unpolarized light, olivine, calcite, topaz, nominally anhydrous minerals INTRODUCTION Both the amounts of hydroxyl species (OH, or colloquially “water”) in the nominally anhydrous minerals or NAMs of the Earth’s mantle, and the substitution mechanisms by which OH is incorporated, are important for understanding a range of physical and chemical properties of the mantle, including partial melting, rheology, diffusion, electrical conductivity, and seismic wave speeds and attenuation (Michael 1988; Bell and Rossman 1992; Karato and Wu 1993; Hirth and Kohlstedt 1996; Hier-Majumder et al. 2005). Infrared (IR) spectroscopy is a particularly useful technique for determining the OH content of NAMs because it has the advantage of providing quantitative information that can be linked directly to the substitution mechanism (Berry et al. 2005; Lemaire et al. 2004; Matveev et al. 2001, 2005). With infrared spectroscopy, the concentration of OH is determined quantitatively using the Beer-Lambert law, which states that for a section of the mineral of given thickness, the absorbance is proportional to the concentration of the absorbing species, where the absorbance is defined as the negative logarithm of the transmittance. The transmittance is the ratio of the radiant energy passing through the sample to the radiant energy incident on the sample, i.e., I m /I o , and is a function of the wavelength of the radiation. The issue is how best to collect the absorption (or transmission) spectra for this quantification. In principle, the absorbance spectrum of a mineral might be collected using either polarized or unpolarized radiation; these data might then be treated either as transmission or absorption measurements; and the feature used for quantification either the peak height (called here, linear transmittance or absorbance) or the area under a peak, or set of peaks (called here, integrated transmittance or absorbance). There are therefore potentially six ways to obtain and quantify spectra, each with its advantages and disadvantages. Generally for nominally anhydrous miner- als, the concentration of OH has been related to the sum of the three principal polarized absorbances (called Total Absorbance), which may be obtained by measuring the principal absorbances in oriented samples, or from three randomly oriented but or- * E-mail: [email protected]
Transcript of Quantitative absorbance spectroscopy with unpolarized...
American Mineralogist, Volume 93, pages 765–778, 2008
0003-004X/08/0506–765$05.00/DOI: 10.2138/am.2008.2656 765
Quantitative absorbance spectroscopy with unpolarized light: Part II. Experimental evaluation and development of a protocol for quantitative analysis of mineral IR spectra
István Kovács,1,* Jörg Hermann,1 HugH st.c. o’neIll,1 JoHn FItz gerald,1 malcolm sambrIdge,1 and gábor HorvátH2,3
1Research School of Earth Sciences, The Australian National University, Building 61, Mills Road, 0200, Canberra, ACT, Australia2Centre for Computer Science and Informatics Research, University of Hertfordshire, College Lane, Hatfield, Hertfordshire, AL10 9AB, U.K.
3Department of Algebra and Number Theory, Eötvös Loránd University, Budapest, Pázmány Péter sétány 1/C, 1118, Hungary
abstract
The predictions of the theory of light propagation in weakly absorbing anisotropic minerals are tested against systematic measurements of the infrared absorbance spectra of calcite, olivine, and topaz oriented in both principal and random sections, using both polarized and unpolarized light. We show that if the linear polarized maximum absorbance is smaller than ~0.3, or if the ratio of maximum and minimum absorbance is close to unity, then (1) the polarized maximum and minimum absorbances as well as the unpolarized absorbance are, to a good approximation, linearly proportional to thickness, regardless of the direction of the incident light; (2) the angular variation of polarized light absorption is indistinguishable from the theoretical predictions within the uncertainty of the measurements; (3) for any section the unpolarized absorbance is the mean of the polarized maximum and minimum absor-bance; and (4) the average unpolarized absorbance of randomly oriented grains is one third of the Total Absorbance (defined as the sum of the three principal absorbances). Therefore, calibrations relating Total Absorbance to absorber concentration in minerals that have been developed from measurements with polarized light parallel to the principal axes may be applied to measurements with unpolarized light on a population of randomly oriented sections. We show that 10 such measurements are sufficient to achieve a petrologically useful accuracy. The method enables water concentrations in nominally anhydrous minerals to be determined from samples where the preparation of oriented specimens is not feasible, such as high-pressure experimental runs and fine-grained mantle xenoliths. The method may also be used for obtaining quantitative measurements on low-symmetry minerals.
Keywords: Infrared spectroscopy, absorbance spectroscopy, unpolarized light, olivine, calcite, topaz, nominally anhydrous minerals
IntroductIon
Both the amounts of hydroxyl species (OH, or colloquially “water”) in the nominally anhydrous minerals or NAMs of the Earth’s mantle, and the substitution mechanisms by which OH is incorporated, are important for understanding a range of physical and chemical properties of the mantle, including partial melting, rheology, diffusion, electrical conductivity, and seismic wave speeds and attenuation (Michael 1988; Bell and Rossman 1992; Karato and Wu 1993; Hirth and Kohlstedt 1996; Hier-Majumder et al. 2005). Infrared (IR) spectroscopy is a particularly useful technique for determining the OH content of NAMs because it has the advantage of providing quantitative information that can be linked directly to the substitution mechanism (Berry et al. 2005; Lemaire et al. 2004; Matveev et al. 2001, 2005). With infrared spectroscopy, the concentration of OH is determined quantitatively using the Beer-Lambert law, which states that for a section of the mineral of given thickness, the absorbance
is proportional to the concentration of the absorbing species, where the absorbance is defined as the negative logarithm of the transmittance. The transmittance is the ratio of the radiant energy passing through the sample to the radiant energy incident on the sample, i.e., Im/Io, and is a function of the wavelength of the radiation. The issue is how best to collect the absorption (or transmission) spectra for this quantification.
In principle, the absorbance spectrum of a mineral might be collected using either polarized or unpolarized radiation; these data might then be treated either as transmission or absorption measurements; and the feature used for quantification either the peak height (called here, linear transmittance or absorbance) or the area under a peak, or set of peaks (called here, integrated transmittance or absorbance). There are therefore potentially six ways to obtain and quantify spectra, each with its advantages and disadvantages. Generally for nominally anhydrous miner-als, the concentration of OH has been related to the sum of the three principal polarized absorbances (called Total Absorbance), which may be obtained by measuring the principal absorbances in oriented samples, or from three randomly oriented but or-* E-mail: [email protected]
KováCS et AL.: IR IndICAtRIx tHeoRy, PARt II766
thogonal sections (e.g., Libowitzky and Rossman 1996; Asimow et al. 2006). However, the preparation of oriented samples is time consuming and not always possible in many petrologi-cally interesting situations. For example, the paucity of suitable grains in high-pressure experimental run products and some mantle xenoliths has prevented quantification of OH by these conventional infrared techniques. In an attempt to overcome these problems, Asimow et al. (2006) recently published a method using polarized IR-spectroscopy on randomly oriented crystals, but information on the orientation of the analyzed grains is still needed. Furthermore, the quality of the polarizer also affects the measured polarized absorbances, which may introduce systematic errors if a different instrument is used from that on which the calibration was obtained (Libowitkzy and Rossman 1996). Clearly, the most general and straightforward approach to determine OH contents in minerals would be to use unpolar-ized IR spectroscopy on randomly oriented grains. Such an approach has been dismissed in the past because it was argued that unpolarized absorbance is not linearly proportional to the thickness (Libowitzky and Rossman 1996). Moreover, no self-consistent absorbance theory was available to relate unpolarized measurements to calibrations obtained from polarized spectra, nor to describe quantitatively the dependence of unpolarized absorbance on orientation.
In a companion paper (Sambridge et al. 2008; hereafter referred to as paper I), these issues have been resolved theoreti-cally by a consideration of absorbance based on the fundamental theory of electromagnetic radiation through Maxwell’s equations (Maxwell 1873). A full theory has been developed that permits a description of the dependence on orientation of either transmit-tance or absorbance, with respect to the principal axes of the absorbance indicatrix. Here we aim to test the predictions of the theory developed in paper I with systematic IR measurements of absorbance spectra in calcite, olivine, and topaz using both polarized and unpolarized light. Approximations made in the theoretical treatment are tested and special emphasis is placed on the validity of an approximate theory that will enable quan-titative absorption measurements on randomly oriented grains using unpolarized light to be made. We then develop a protocol for obtaining such quantitative analyses of OH in olivine with unpolarized radiation, using the calibrations made with polarized radiation that are available in the literature (i.e., Bell et al. 2003, 2004). Other possible applications are also discussed.
tHeoretIcal bacKground
In paper I, we demonstrated that angular variation of linear polarized transmittance in any sections of weakly absorbing anisotropic minerals can be described by the relationship:
T(θ) = Tmaxcos2θ + Tminsin2θ (1)
Although we shall henceforth treat this equation as being exact, its derivation employs several approximations, as pointed out in paper I. The first is that the mineral is not “strongly absorb-ing,” which means that the square of the extinction coefficient is much smaller than unity; in practice this means any mineral that is transparent in thin section, i.e., not metals, sulfides, or oxides. The second approximation concerns the direction of light
propagation with respect to the optic axes of the crystal. The fundamental theory shows that Equation 1 will be accurate when light propagates exactly along an optic axis, and an excellent approximation when the light direction is sufficiently inclined to the optic axes, but deteriorates somewhat in accuracy when the light direction lies in a small region immediately surrounding the optic axes. Ramachandran and Ramaseshan (1961) discuss this very complex issue in detail and argue that even for the most general biaxial crystals the approximation will be valid for most random directions of light.
The relationship between transmittance (T) and absorbance (A) is by definition:
A = –log10 T = –log10(Im/I0) (2)
where I0 is the light intensity incident on the crystal and Im is the measured light intensity after passing through the crystal. It follows that the angular variation of linear polarized absorbance obtained by combining Equations 1 and 2, which we shall refer to as the “T theory” for short, is
A(θ) = –log(Tmaxcos2θ + Tminsin2θ) (3a)
= –log(10–Amincos2θ + 10–Amaxsin2θ). (3b)
The unpolarized absorbance is the integration of Equation 3 over all angles in a given section. This integral does not have an analytical solution, so numerical integration is necessary.
Equation 3 can be applied to the linear polarized absorbance (i.e., peak height) of a measured IR peak. However, in many practical situations (such as for OH spectra in olivine), the part of the spectrum of interest comprises several overlapping peaks, making it difficult to determine the linear absorbance accurately. this becomes a problem particularly if the peaks are subject to broadening, because any difference in peak shape between unknown and the standards used for calibration will introduce error. Peak profiles (that is, height vs. width, and maybe other features such as peak asymmetry) may potentially be affected by many factors including major element composition, order-disorder phenomena, and defect concentrations. It is therefore a widely held view that integrated absorbance (i.e., the area under a defined series of peaks in a spectrum of absorbance as a function of wavelength) is the most useful entity to relate to concentration (Libowitzky and Rossman 1997; Bell et al. 2003). This introduces a severe practical problem. The argument of a transcendental function (like a logarithm) cannot have dimen-sions. The absorbance is defined as a simple ratio of intensities (Eq. 2), which has no dimension, but an integrated absorbance, as obtained by finding the area under a spectrum of absorbance over an interval of reciprocal wavelength, has the units of the reciprocal wavelength (i.e., cm–1). Hence it is not possible to define a logarithm of integrated absorbance, and an equation analogous to Equation 3b but for integrated absorbance cannot be obtained. While it is always possible to convert linear absorbance into linear transmittance, the conversion of integrated absorbance to integrated transmittance is not straightforward (see Eq. 2). For example, dividing the integrated absorbance by the interval of reciprocal wavelength over which the integration was taken
KováCS et AL.: IR IndICAtRIx tHeoRy, PARt II 767
produces a result that depends on where the limits of integration were chosen. Nevertheless, we show here, first theoretically and then empirically, that it is possible to use integrated absorbance measurements with unpolarized light to obtain quantitative data, if samples are prepared to thicknesses that possess suitable absorbance characteristics. In paper I, it is shown that Equation 3 may be approximated to good accuracy if, in a given section, the linear polarized maximum absorbance (Ama
poxl) is relatively
small, or the ratio of the linear polarized minimum and maximum absorbances (Ama
poxl, Ami
ponl) is close to unity, by
A(θ) = Amapo
xlcos2θ + Ami
ponl sin2θ (4)
where now θ is the angle with respect to direction of maximum absorbance. This formula holds for linear polarized absorbance of a single peak as well as for integrated polarized absorbance of overlapping peaks, as is demonstrated in the Appendix. We shall call this approximate theory the “A theory.” In contrast to Equation 3, Equation 4 can be easily integrated over all angles resulting in a simple relationship between unpolarized (either linear or integrated) absorbance and polarized maximum and minimum absorbance in any given section:
Aunpol = 1/2 (Amapo
xl + Ami
ponl ). (5)
It follows that the unpolarized absorbance of an arbitrary section through a crystal is defined by the major polarized ab-sorbances (either linear or integrated), specified in the absorption indicatrix (Aa = Amin, Ab = Aint, and Ac = Amax). Consequently, only the two angles (ϕ, ψ) that define the orientation of the incident light with respect to the absorption indicatrix (see Fig. 1b in paper I) are necessary to determine the unpolarized absorbance. As shown in paper I, the formula for the unpolarized absorbance for an arbitrary angle of incident light becomes
Aunpol(ϕ, ψ) = 1/2 [Aa(cos2ϕcos2ψ + sin2ψ) + Ab(cos2ϕsin2ψ + cos2ψ) + Acsin2ψ]. (6)
This formula describes the unpolarized absorbance in terms of the three principal polarized absorbances (Aa, Ab, and Ac). Equation 6 can be simplified further by constructing an unpo-larized indicatrix from a simple transformation of the polarized indicatrix. The respective principal unpolarized absorbances are the average of the two principal polarized absorbances on the perpendicular principal section plane [i.e., Aa
upol = 1/2(Ab + Ac)]. For this indicatrix, the unpolarized absorbance in an arbitrary section is defined by
Aunpol(ϕ, ψ) = 1/2(Ab + Ac)sin2ϕcos2ψ + 1/2(Aa + Ac)sin2ϕsin2ψ + 1/2(Ab + Aa)cos2ϕ. (7)
In paper I, it is shown that the integration of either Equations 6 or 7 over the sphere containing all angles of ψ and ϕ leads to a simple relationship between Total Absorbance (Atot) and the average unpolarized absorbance:
A A A A Aunpolavg
a b ctot= + + =
13
13
( ) . (8)
It is important to evaluate the error that using the approximate “A theory” introduces. For a given section, this error depends on two variables: first, the absolute value of Ama
poxl, and second, the
difference between Amapo
xl and Ami
ponl . In a section perpendicular to
the optic axis, where Amapo
xl = Ami
ponl , Equations 4 and 5 are exact and
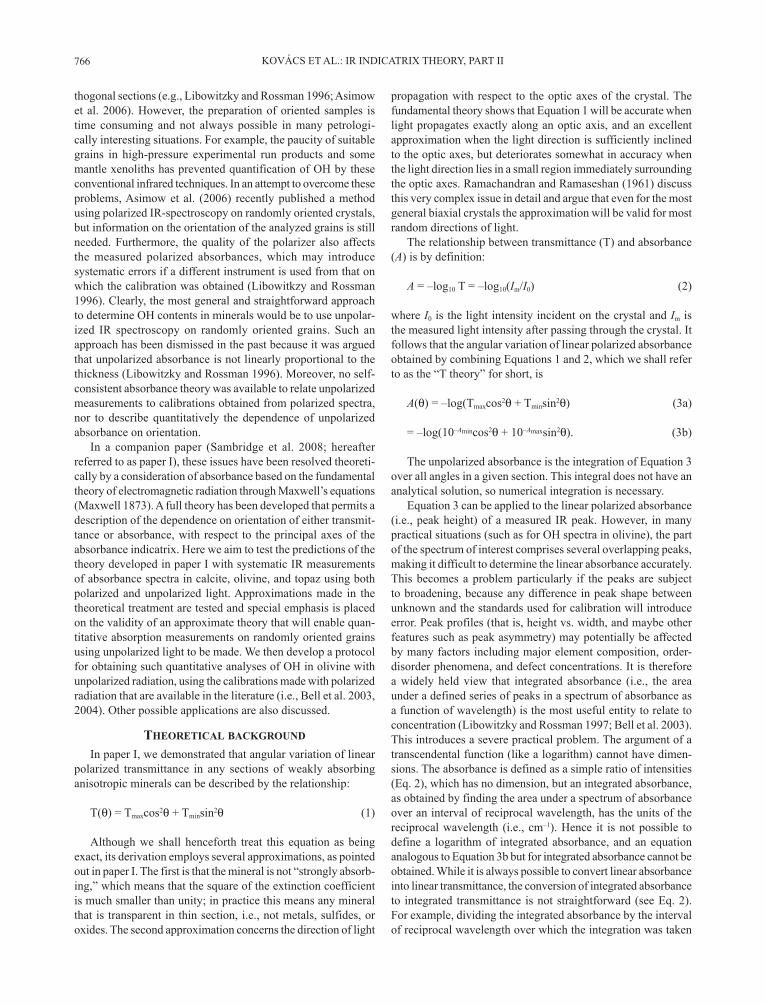
there is no error; conversely, errors will be largest for a section containing Aa and Ac where the anisotropy is the most profound. Figure 1 shows how the error depends on Ama
poxl and Ami
ponl in any
section (for details see the Appendix of paper I). We propose that an error of 10% for the worst-case section (i.e., the Aa-Ac section) can be taken as being acceptable. Therefore, in a population of random sections, the errors for each section will vary from zero (sections perpendicular to the optic axes) to 10% for the worst case (the Aa-Ac section), so that the net error for the population will be considerably less than 10%, and therefore within the typi-cal experimental uncertainty of polarized measurements. Figure 1 shows that the limit of <10% worst-case error is achieved for crystals with Ama
poxl <0.3. Note that the error in the “A theory” is
such as to overestimate the measured unpolarized absorbance. In principle it may be possible to correct results from the “A theory” using numerical integration of Equation 3 and estimates of the principal absorptions, but in practice it is much simpler to work
0.2 0.4 0.6 0.8 1.0 1.2 1.4 1.6 1.8 2.0
linear polarized absorbance (Amax)
0.2
0.4
0.6
0.8
1.0
1.2
1.4
1.6
1.8
2.0
10%
20%
Fig. 1. Kovács et al.
60%
li
near
pol
ariz
ed a
bsor
banc
e (A
min)
FIgure 1. The error from using the approximate “A theory” (Eq. 5) compared to the nearly exact “T theory” (from numerical integration of Eq. 3), as a function of linear polarized absorptions Ama
poxl and Ami
ponl .
the error is defined as [A(Eq.5) – A(Eq.3)]/A(Eq.5). Actual values of Amapo
xl and
Amipo
nl for samples used in this study are plotted as follows: circle = topaz,
1.66 mm thick basal section (001) for the absorbance peak at 2320 cm–1; diamonds = San Carlos olivine, sections parallel to (001) and (010), 6.448 and 6.336 mm thick, respectively, for the peak at 3572 cm–1; filled stars = seven calcite sections cut parallel to the cleavage (1011) of thickness 198 to 1958 µm, connected by the dashed line, for the peak at 3943 cm–1; open star = 4.63 mm thick calcite section parallel to the c-axis [001], for the peak at 4272 cm–1, which was investigated by Libowitzky and Rossman (1996); squares = principal sections of the “Pakistani” olivine for the absorbance peak at 3592 cm–1 (see Table 1 for the thicknesses). the rectangle marks the field covered by random sections of San Carlos olivine of 6 mm thickness.
KováCS et AL.: IR IndICAtRIx tHeoRy, PARt II768
with smaller absorbances by reducing sample thickness. It is not possible to make the correction for measurements of integrated absorption under a group of peaks, because of the lack of an equation analogous to Equation 3 for integrated absorbance, but preparing samples to have a thickness such that the linear value of Ac for the most intense peak is kept to <0.3 ensures that the contribution to the net error from the other, smaller peaks in the group will be even closer to zero. Requiring the maximum absorbance to be less than 0.3 is not inconsistent with other experimental considerations; for example, an absorbance of ~0.3 has been shown to give optimal precision in absorption measurements (Hughes 1963; Mark and Griffiths 2001).
We now test both the nearly exact “T theory” and the approxi-mate “A theory” against systematic polarized and unpolarized measurements of minerals, by analyzing mineral sections with a variety of principal linear absorbance values (Fig. 1). First, we present data from sections of minerals that have sufficiently strong net absorbance characteristics that there is predicted to be a clear difference between the “A theory” and the “T theory,” as demarked in Figure 1. We confirm that in these cases the “T theory” fits the data well, but the “A theory” does not. We then present measurements from samples with absorbance characteris-tics such that the “A theory” should be a good approximation, and demonstrate empirically that it can be used to recover quantitative absorbances from randomly oriented mineral grains.
metHods
Sample preparationOne calcite, two olivine, and one topaz crystal were investigated in this study.
For the calcite, a series of double-polished thin sections cut parallel to the cleavage (1011) with different thickness were made to investigate the relationship between absorbance and thickness.
The olivine crystals are from Pakistan and San Carlos, Arizona. The former olivine was obtained commercially; its exact provenance is unknown apart from its country of origin. This “Pakistani” olivine was an idiomorphic crystal with the green color typical of mantle olivine from spinel lherzolite xenoliths; it is highly transparent with no macroscopic inclusions or impurities. A slightly distorted nearly equidimensional cube (called here “cuboid” for short) was prepared with faces oriented perpendicular to the principal axes as identified from the morphol-ogy of the original crystal. the measured dimensions of the cuboid were 1.920 mm parallel to [100], 1.944 mm parallel to [010], and 1.865 mm parallel to [001]. The degree of misorientation for each pair of faces was estimated by observing the extinction positions with a petrologic microscope, which revealed that the sections (001) and (100) are nearly perfectly aligned with the crystallographic axes, whereas the section nominally (010) is 9° out of alignment. each side of this cuboid was polished successively with 12, 5, and 3 µm Al2O3 powder to avoid light scattering effects. A double polished epoxy mount holding eleven randomly oriented frag-ments of “Pakistani” olivine with a thickness of 400 ± 20 µm was also prepared. The orientation of 8 out of 11 grains was successfully determined by electron backscattered diffraction (EBSD). Another double-polished epoxy mount with 41 randomly oriented grains and 210 ± 15 µm thickness was also made from the same mineral to mimic the distribution of unpolarized absorbances that would be obtained by sampling of a high-pressure/temperature experiment or similar col-lection of randomly oriented grains. These large, thin epoxy mounts, containing multiple grains, suffer from some buckling and inhomogeneity in thickness, which introduces a small experimental uncertainty.
The San Carlos olivine was kindly loaned by Ian Jackson. It is crystal no. 1 from the study of Webb (1989). It is a cuboid with dimensions of 7.890, 6.448, and 6.336 mm parallel to the [100], [010], and [001] axes, respectively. Webb (1989) reports that the presence of low-angle tilt and twist subgrain boundaries within the crystal results in net misorientations of less than 3°.
The topaz is a fragment from an original large gem-quality crystal. Other fragments from the same crystal are used as EMPA standards at RSES. The section
studied (001) is parallel to the basal cleavage. The section is perfectly transparent, and due to the perfect cleavage no polishing was necessary during preparation. The section thicknesses were measured using a Mitutoyo analog micrometer, which is nominally accurate to 3 µm.
Analytical protocolsChemical analysis. Major element analysis of the “Pakistani” olivine was
carried out by a Cameca SX-100 microprobe at the RSES, ANU using an ac-celerating voltage of 15 kv, a beam current of 20 nA, and ZAF correction. the composition of this olivine is near the forsterite end-member (Mg no. = 90.5) with 9.04 wt% Feo, 0.36 wt% nio, and 0.15 wt% Mno. the Cao and Al2O3 contents were found to be particularly low (<0.013 wt%, the detection limit), indicating a low-temperature origin. To check this aspect of the olivine’s provenance further, we undertook laser-ablation ICP-MS analysis. The analytical method is described in Witt-Eickschen and O’Neill (2005), where representative values of trace elements in normal mantle olivine may be found for comparison. We obtained accurate values of CaO of 0.005 ± 0.0005 wt% and for Al, an astonishingly low 0.1 ppm. The low CaO is similar to that in olivine from the pallasite meteorite Brenham obtained on the same instrument, but the Al is over two orders of magnitude lower than in Brenham and far lower than any other known olivine of terrestrial mantle compo-sition. Because minor or trace elements, particularly Ti, can influence the mode of substitution of OH in olivine (Berry et al. 2005), it is desirable to characterize olivines used for IR investigation as far as possible. Other trace elements were found to show some variability but representative values of detectable elements are ~2700 ppm Ni, 140 ppm Co, 50 to 120 ppm Cr, 1200 ppm Mn, and ~2 ppm Ti and v. Lithium is notably high and variable (6 to 25 ppm), but na is unusually low (below detection, which is about 10 ppm due to this element’s high background). Scandium is high (8 to 26 ppm) and P is very low (2 to 5 ppm). Thus while the olivine has major-element chemistry and ni, Co, Mn, and Cr concentrations that are typical of mantle olivine, other features of its trace-element chemistry are highly unusual. A major-element analysis of the San Carlos olivine is reported in Webb (1989): it has Mg no. 90.5. the topaz, which is used as a microprobe standard for fluorine, has 11.47 wt% F, 29.61 wt% Al, and 15.41 wt% Si, with 0.5 wt% H and 43.02 wt% O estimated by stoichiometry.
Infrared spectroscopy. A Bruker IFS-28 infrared spectrometer mounted with an A590 Bruker infrared microscope supplied with a nitrogen-cooled MCt detector was used for IR analysis (see Berry et al. 2005 for further details). A KBr beam splitter and a KRS-5 polarizer were utilized for analysis. Spectra were recorded in the range of 600 to 5000 cm–1. The spectra have a resolution of 2 cm–1. Analyses were made with a circular aperture of 70 µm diameter while the microscope stage was continuously flushed with nitrogen. Spectra were processed using the OPUS 2.2 software (Bruker, Inc.). The background was drawn manually beneath stretch-ing vibration peaks using the spline correction of the Opus 2.2 software. Although this may be subjective to some extent, it provides consistent results (see Bell et al. 2003; Peslier and Luhr 2006). The “Integration” and “Peak pick” tool of the Opus 2.2 software was then used to measure the areas and height of peaks.
A ubiquitous problem with IR absorbance spectroscopy using nominally unpolarized light is that some polarization occurs when the light interacts with the beam splitter and other reflecting optical components. The extent of polarization can be estimated by observing the variation in the unpolarized absorbances as the stage is rotated about the incident light direction (i.e., incident light is the pole of rotation), and was found to be ~15% for our instrument in the most anisotropic sections. As shown both by the theory in paper I and the empirical observations presented in this paper comparing polarized with nominally unpolarized spectra, this instrumental effect may easily be corrected for by taking the average of two measurements from perpendicular positions in the section.
EBSD analysis. The EBSD system used for this study is located at the Electron Microscopy Unit of the Australian National University and consists of hardware supplied by Nordif mounted on a JEOL 6400 SEM with conventional tungsten filament, and the software package Channel+ from HKL software. the best pat-terns were recorded at 20 kv accelerating voltage and a nominal beam current of 2 nA. A carbon coat (approximately 10 nm thick) was necessary to avoid charging of the sample. The quality of the EBSD pattern varied from grain to grain, but in most cases automated detection of five to six bands was possible. The error in the determination of orientation is typically less than 2°. Grain orientations are stored as Euler angles as a convenient way to relate the orientation of individual grains to a reference coordinate system. See Faul and Fitz Gerald (1999) for further details.
Uncertainties. All uncertainties in this paper are reported as ±1 standard deviation. The experimental uncertainties in determining the average unpolarized absorbance are assessed as follows: (1) replicate measurements of the thickness of
KováCS et AL.: IR IndICAtRIx tHeoRy, PARt II 769
mineral sections yield a standard deviation of 2%; however, where only the mount and not the individual grains were measured for thickness, thickness fluctuations due to buckling and other imperfections of sample preparation may amplify this error considerably; (2) background subtraction was done by fitting a spline func-tion manually. Different choices of where to anchor the spline function, as tested on a series of spectra, revealed that the uncertainty introduced by this procedure was usually <1%, but in detail the uncertainty depends on the complexity of the background (cf. Peslier and Luhr 2006) and strongly on the quality of the spectrum; it may be significantly higher if the spectrum is noisy. Fluctuations in moisture content during analysis, which affects the background, can also introduce non-systematic errors. It is assumed therefore that uncertainty is approximately 5% for each unpolarized analysis. The errors can be significantly larger for polarized analyses because both the quality of the polarizer and the determination of the orientation of the section introduce additional uncertainties.
Data were fitted to Equations 3 or 4 by weighted non-linear least-squares re-gression. The χ2 values are calculated assuming uncertainties in individual analysis specified in the respective figure captions. Least-squares fitting implicitly assumes that the model describes the data reasonably well (e.g., Bevington and Robinson 2002), which is obviously not the case when we try to fit data to the “A theory” outside the latter’s range of applicability. In this situation the resulting “fit” can vary dramatically according to how the data are weighted, and the regressed parameters are more-or-less devoid of physical meaning. Hence such fits are shown only as a means of quantifying how poor they are.
results
Testing the “T theory”Using Figure 1 as a guide, we selected materials that have a
big difference in linear polarized minimum and maximum ab-sorbances (Ama
poxl and Ami
ponl ), and prepared samples with thicknesses
that have high values of the maximum absorbance, so that the difference between the “A theory” and the “T theory” should be much larger than the analytical uncertainty.
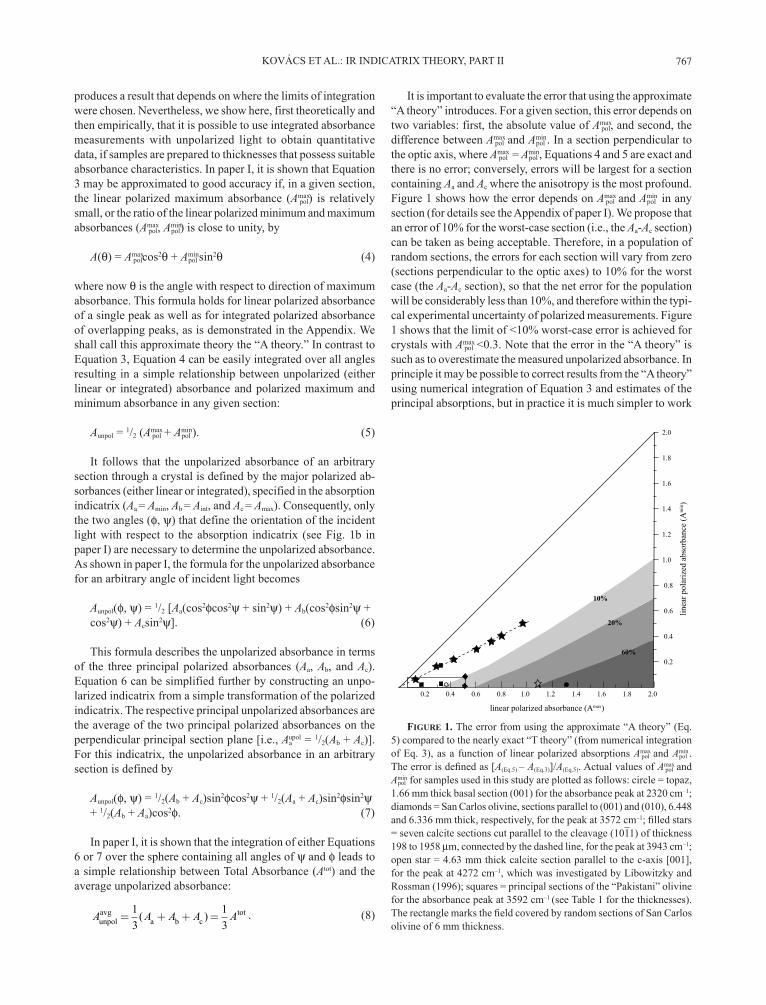
Topaz. The variation of polarized absorbance in a basal sec-tion of topaz of 1.66 mm thickness is shown in Figure 2a. The single peak at 2320 cm–1 has all the desired features to test the validity of the two theories. The value of linear Ama
poxl is high (1.29),
and there is a large difference between Amapo
xl and Ami
ponl (Table 1).
Figure 2b displays the angular distribution of the linear polarized absorbance. The data can be fitted very well with Equation 3 but not Equation 4; the shape of the angular distribution predicted by Equation 4 is entirely wrong, and an attempt at least-squares fitting of the data (shown in Fig. 2b) cannot account for the higher values. The measured linear unpolarized absorbance is only half of what Equation 5 predicts (Table 1), which is in good agreement with the theoretically determined error of approximately 100%, as estimated for this sample from Figure 1.
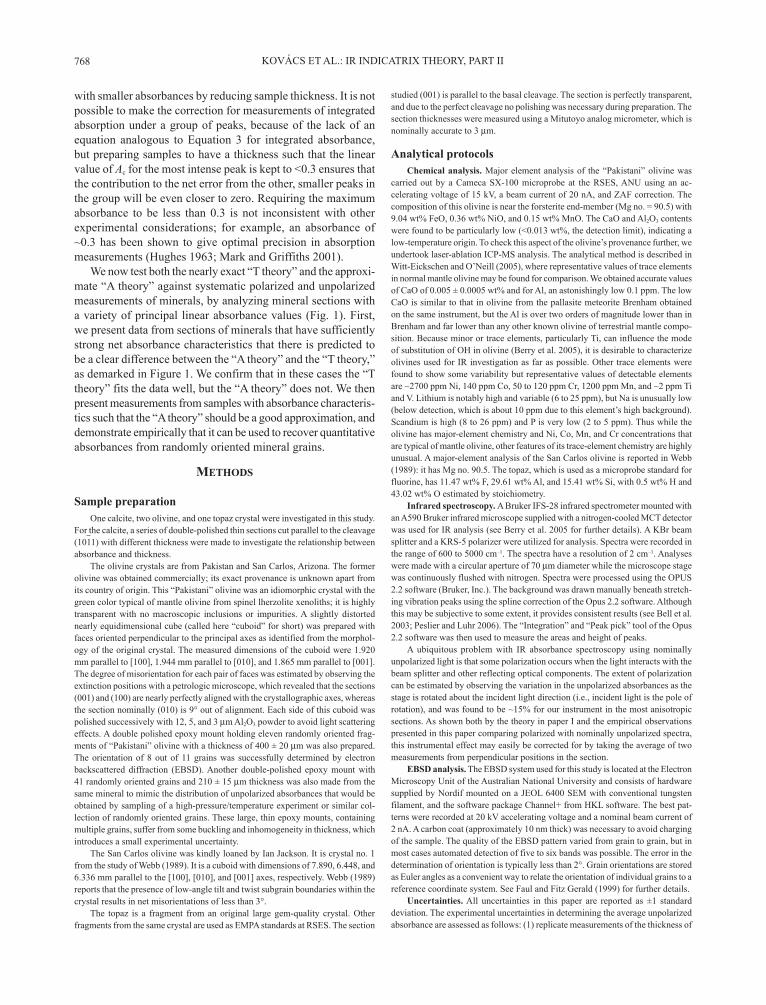
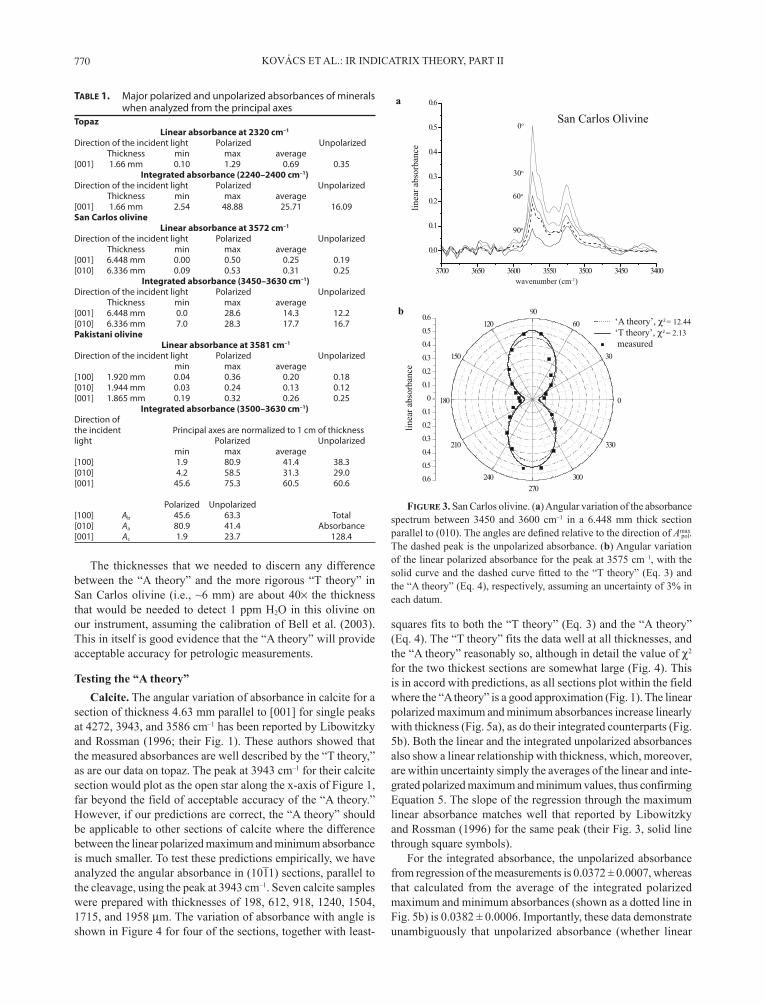
San Carlos olivine. San Carlos olivine displays a strongly anisotropic absorbance for OH-related peaks, with strong ab-sorbance parallel to [100] and weaker absorbances parallel to [010] and [001] (Walker et al. 2007). This material is especially suitable for investigating the common case of severely overlap-ping peaks, but to see a difference between the two theories, an exceptionally thick sample is needed. We have analyzed absorbance in (001) and (010) sections of a San Carlos olivine cube with thickness of 6.336 and 6.448 mm, respectively (Table 1). Figure 3a displays polarized spectra taken at different angles in the (010) section. two major peaks appear at 3575 and 3525 cm–1, and a series of minor peaks are present. The intensity of peaks changes considerably with angle; however, their shape remains more or less the same (Fig. 3a). If the linear absorbance measured at the maximum of the main peak at 3575 cm–1 is
plotted against rotation angle, the data can be fitted better with the “T theory” than the “A theory,” although the difference is, as expected, not as stark as for the topaz (Fig. 3b), because the absorption characteristics are closer to those needed for the “A theory” to have acceptable accuracy (solid diamonds in Fig. 1). The scatter in the measurements is almost certainly due to the difficulties in extracting the peak height of one peak from a group of overlapping peaks, which is of course one reason why it would be preferable in practice to use integrated absorbance instead. An easy way to check if there is a difference between the “A theory” and the “T theory” in a given section is to compare the integrated values of the unpolarized absorbance to the average of the integrated polarized maximum and minimum absorbances, which tests the validity of Equation 5. For the (001) section the average overestimates the measured value by 17%, whereas for the (010) section the error is only 6%, and thus within our target uncertainty of 10% (Table 1). These errors are in good agreement with the theoretical errors as displayed in Figure 1. To assess the error of using the “A theory” for this particular crystal, we used Equation 7 to generate randomly 104 pairs of values of Ama
poxl and
Amipo
nl using the measured values of Aa, Ab, and Ac. The results cover
a rectangular area in Figure 1, with the error for the population average (open hexagon) being 10%, with the worst-case Aa-Ac section having an error of 17%.
0
5.0
0.1
5.1
30
6090
120
501
801
210
240702
300
330
5.0
0.1
5.1
linea
r abs
orba
nce
2400238023602340232023002280226022400.0
5.0
0.1
5.1a
b
0
Fig. 2. Kovács et al.
‘A theory’, = 7.72 ‘T theory’ , = 1.94 measured
linea
r abs
orba
nce
wavenumber (cm-1)
0o
30o
60o
90o
Topaz
FIgure 2. Topaz. (a) The linear absorbance at 2320 cm–1 in a 1.66 mm thick basal section (001). the angles are defined relative to the direction of Ama
poxl. The dashed peak is the unpolarized absorbance. (b)
Angular variation of the linear polarized absorbance for the same peak, with the solid curve and the dashed curve fitted to the “t theory” (eq. 3) and the “A theory” (Eq. 4), respectively, assuming an uncertainty of 3% in each datum. As expected for this highly absorbing section, the fit of the data to the “T theory” is excellent, to the “A theory” very poor.
KováCS et AL.: IR IndICAtRIx tHeoRy, PARt II770
The thicknesses that we needed to discern any difference between the “A theory” and the more rigorous “T theory” in San Carlos olivine (i.e., ~6 mm) are about 40× the thickness that would be needed to detect 1 ppm H2O in this olivine on our instrument, assuming the calibration of Bell et al. (2003). This in itself is good evidence that the “A theory” will provide acceptable accuracy for petrologic measurements.
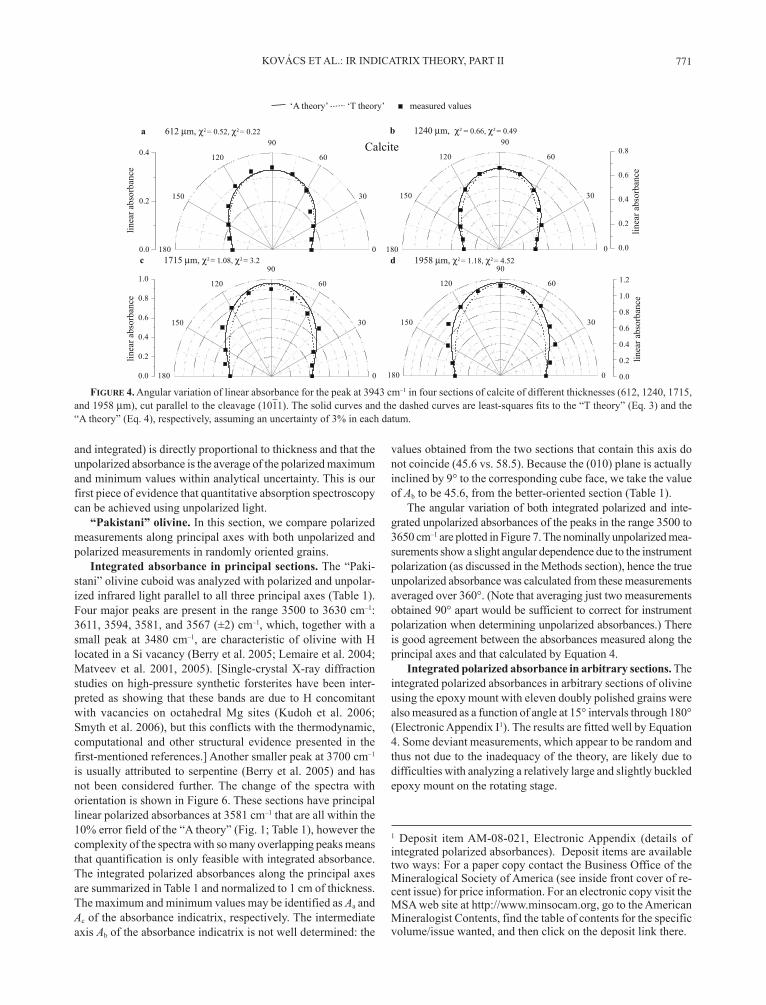
Testing the “A theory”Calcite. The angular variation of absorbance in calcite for a
section of thickness 4.63 mm parallel to [001] for single peaks at 4272, 3943, and 3586 cm–1 has been reported by Libowitzky and Rossman (1996; their Fig. 1). these authors showed that the measured absorbances are well described by the “T theory,” as are our data on topaz. the peak at 3943 cm–1 for their calcite section would plot as the open star along the x-axis of Figure 1, far beyond the field of acceptable accuracy of the “A theory.” However, if our predictions are correct, the “A theory” should be applicable to other sections of calcite where the difference between the linear polarized maximum and minimum absorbance is much smaller. To test these predictions empirically, we have analyzed the angular absorbance in (1011) sections, parallel to the cleavage, using the peak at 3943 cm–1. Seven calcite samples were prepared with thicknesses of 198, 612, 918, 1240, 1504, 1715, and 1958 µm. The variation of absorbance with angle is shown in Figure 4 for four of the sections, together with least-
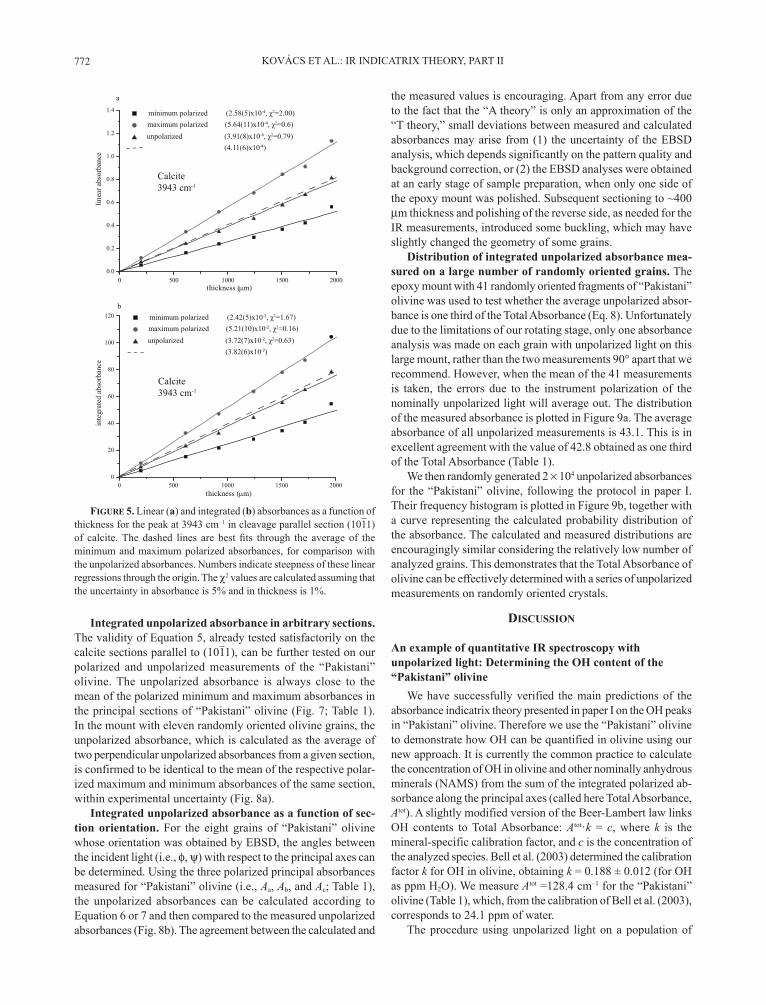
squares fits to both the “T theory” (Eq. 3) and the “A theory” (Eq. 4). The “T theory” fits the data well at all thicknesses, and the “A theory” reasonably so, although in detail the value of χ2 for the two thickest sections are somewhat large (Fig. 4). This is in accord with predictions, as all sections plot within the field where the “A theory” is a good approximation (Fig. 1). The linear polarized maximum and minimum absorbances increase linearly with thickness (Fig. 5a), as do their integrated counterparts (Fig. 5b). Both the linear and the integrated unpolarized absorbances also show a linear relationship with thickness, which, moreover, are within uncertainty simply the averages of the linear and inte-grated polarized maximum and minimum values, thus confirming Equation 5. The slope of the regression through the maximum linear absorbance matches well that reported by Libowitzky and Rossman (1996) for the same peak (their Fig. 3, solid line through square symbols).
For the integrated absorbance, the unpolarized absorbance from regression of the measurements is 0.0372 ± 0.0007, whereas that calculated from the average of the integrated polarized maximum and minimum absorbances (shown as a dotted line in Fig. 5b) is 0.0382 ± 0.0006. Importantly, these data demonstrate unambiguously that unpolarized absorbance (whether linear
Table 1. Major polarized and unpolarized absorbances of minerals when analyzed from the principal axes
Topaz Linear absorbance at 2320 cm–1 Direction of the incident light Polarized Unpolarized Thickness min max average [001] 1.66 mm 0.10 1.29 0.69 0.35
Integrated absorbance (2240–2400 cm–1)Direction of the incident light Polarized Unpolarized Thickness min max average [001] 1.66 mm 2.54 48.88 25.71 16.09San Carlos olivine Linear absorbance at 3572 cm–1 Direction of the incident light Polarized Unpolarized Thickness min max average [001] 6.448 mm 0.00 0.50 0.25 0.19[010] 6.336 mm 0.09 0.53 0.31 0.25
Integrated absorbance (3450–3630 cm–1)Direction of the incident light Polarized Unpolarized Thickness min max average [001] 6.448 mm 0.0 28.6 14.3 12.2[010] 6.336 mm 7.0 28.3 17.7 16.7Pakistani olivine
Linear absorbance at 3581 cm–1
Direction of the incident light Polarized Unpolarized min max average [100] 1.920 mm 0.04 0.36 0.20 0.18[010] 1.944 mm 0.03 0.24 0.13 0.12[001] 1.865 mm 0.19 0.32 0.26 0.25 Integrated absorbance (3500–3630 cm–1)Direction of the incident Principal axes are normalized to 1 cm of thickness light Polarized Unpolarized min max average [100] 1.9 80.9 41.4 38.3[010] 4.2 58.5 31.3 29.0[001] 45.6 75.3 60.5 60.6 Polarized Unpolarized [100] Ab 45.6 63.3 Total[010] Aa 80.9 41.4 Absorbance[001] Ac 1.9 23.7 128.4
Fig. 3. Kovács et al.
0043054300530553006305630073
0.0
1.0
2.0
3.0
4.0
5.0
6.0
linea
r abs
orba
nce
0
1.0
2.0
3.0
4.0
5.0
6.0
1.0
2.0
3.0
4.0
5.0
6.0
linea
r abs
orba
nce
a
b‘A theory’, = 12.44‘T theory’, = 2.13 measured
wavenumber (cm-1)
0o
30o
60o
90o
0
03
0609
021
051
081
012
042072
003
033
San Carlos Olivine
FIgure 3. San Carlos olivine. (a) Angular variation of the absorbance spectrum between 3450 and 3600 cm–1 in a 6.448 mm thick section parallel to (010). the angles are defined relative to the direction of Ama
poxl.
The dashed peak is the unpolarized absorbance. (b) Angular variation of the linear polarized absorbance for the peak at 3575 cm–1, with the solid curve and the dashed curve fitted to the “t theory” (eq. 3) and the “A theory” (Eq. 4), respectively, assuming an uncertainty of 3% in each datum.
KováCS et AL.: IR IndICAtRIx tHeoRy, PARt II 771
and integrated) is directly proportional to thickness and that the unpolarized absorbance is the average of the polarized maximum and minimum values within analytical uncertainty. This is our first piece of evidence that quantitative absorption spectroscopy can be achieved using unpolarized light.
“Pakistani” olivine. In this section, we compare polarized measurements along principal axes with both unpolarized and polarized measurements in randomly oriented grains.
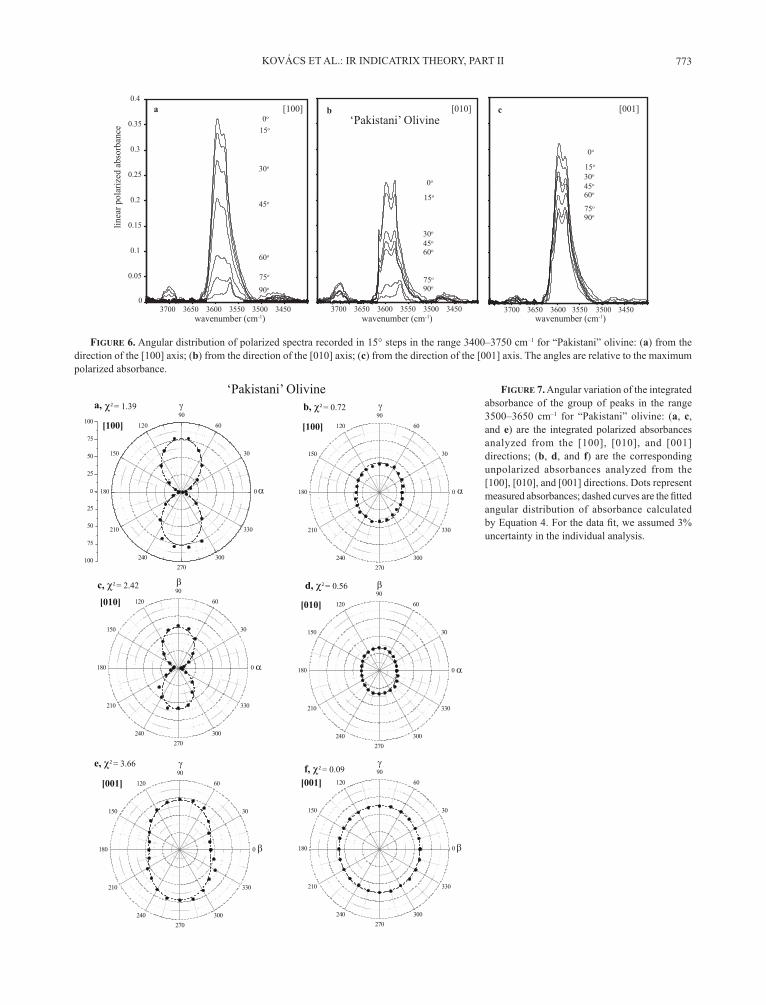
Integrated absorbance in principal sections. The “Paki-stani” olivine cuboid was analyzed with polarized and unpolar-ized infrared light parallel to all three principal axes (Table 1). Four major peaks are present in the range 3500 to 3630 cm–1: 3611, 3594, 3581, and 3567 (±2) cm–1, which, together with a small peak at 3480 cm–1, are characteristic of olivine with H located in a Si vacancy (Berry et al. 2005; Lemaire et al. 2004; Matveev et al. 2001, 2005). [Single-crystal X-ray diffraction studies on high-pressure synthetic forsterites have been inter-preted as showing that these bands are due to H concomitant with vacancies on octahedral Mg sites (Kudoh et al. 2006; Smyth et al. 2006), but this conflicts with the thermodynamic, computational and other structural evidence presented in the first-mentioned references.] Another smaller peak at 3700 cm–1 is usually attributed to serpentine (Berry et al. 2005) and has not been considered further. The change of the spectra with orientation is shown in Figure 6. These sections have principal linear polarized absorbances at 3581 cm–1 that are all within the 10% error field of the “A theory” (Fig. 1; Table 1), however the complexity of the spectra with so many overlapping peaks means that quantification is only feasible with integrated absorbance. The integrated polarized absorbances along the principal axes are summarized in Table 1 and normalized to 1 cm of thickness. The maximum and minimum values may be identified as Aa and Ac of the absorbance indicatrix, respectively. The intermediate axis Ab of the absorbance indicatrix is not well determined: the
‘A theory’ ‘T theory’ measured values
0.0
2.0
4.0
0
03
06
09
021
051
081 0.0
2.0
4.0
6.0
8.0
0
03
06
09
021
051
0.0
2.0
4.0
6.0
8.0
0.1
0
03
06
09
021
051
081 0.0
2.0
4.0
6.0
8.0
0.1
2.1
0
03
06
09
021
051
081
081
a 612 m, = 0.52, = 0.22 b 1240 m, = 0.66, = 0.49
c 1715 m, = 1.08, = 3.2 d 1958 m, = 1.18, = 4.52
linea
r abs
orba
nce
linea
r abs
orba
nce
linea
r abs
orba
nce
linea
r abs
orba
nce
Fig. 4. Kovács et al.
Calcite
FIgure 4. Angular variation of linear absorbance for the peak at 3943 cm–1 in four sections of calcite of different thicknesses (612, 1240, 1715, and 1958 µm), cut parallel to the cleavage (1011). the solid curves and the dashed curves are least-squares fits to the “t theory” (eq. 3) and the “A theory” (Eq. 4), respectively, assuming an uncertainty of 3% in each datum.
values obtained from the two sections that contain this axis do not coincide (45.6 vs. 58.5). Because the (010) plane is actually inclined by 9° to the corresponding cube face, we take the value of Ab to be 45.6, from the better-oriented section (Table 1).
The angular variation of both integrated polarized and inte-grated unpolarized absorbances of the peaks in the range 3500 to 3650 cm–1 are plotted in Figure 7. The nominally unpolarized mea-surements show a slight angular dependence due to the instrument polarization (as discussed in the Methods section), hence the true unpolarized absorbance was calculated from these measurements averaged over 360°. (note that averaging just two measurements obtained 90° apart would be sufficient to correct for instrument polarization when determining unpolarized absorbances.) There is good agreement between the absorbances measured along the principal axes and that calculated by Equation 4.
Integrated polarized absorbance in arbitrary sections. The integrated polarized absorbances in arbitrary sections of olivine using the epoxy mount with eleven doubly polished grains were also measured as a function of angle at 15° intervals through 180° (Electronic Appendix I1). The results are fitted well by Equation 4. Some deviant measurements, which appear to be random and thus not due to the inadequacy of the theory, are likely due to difficulties with analyzing a relatively large and slightly buckled epoxy mount on the rotating stage.
1 Deposit item AM-08-021, Electronic Appendix (details of integrated polarized absorbances). Deposit items are available two ways: For a paper copy contact the Business Office of the Mineralogical Society of America (see inside front cover of re-cent issue) for price information. For an electronic copy visit the MSA web site at http://www.minsocam.org, go to the American Mineralogist Contents, find the table of contents for the specific volume/issue wanted, and then click on the deposit link there.
KováCS et AL.: IR IndICAtRIx tHeoRy, PARt II772
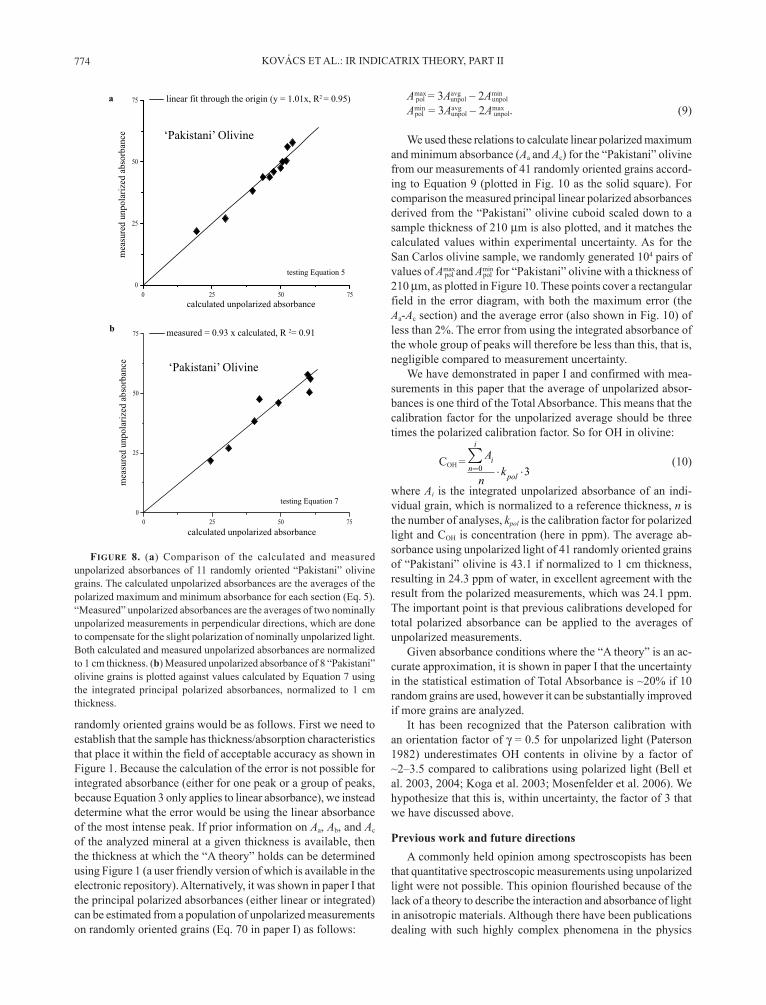
Integrated unpolarized absorbance in arbitrary sections. The validity of Equation 5, already tested satisfactorily on the calcite sections parallel to (1011), can be further tested on our polarized and unpolarized measurements of the “Pakistani” olivine. The unpolarized absorbance is always close to the mean of the polarized minimum and maximum absorbances in the principal sections of “Pakistani” olivine (Fig. 7; Table 1). In the mount with eleven randomly oriented olivine grains, the unpolarized absorbance, which is calculated as the average of two perpendicular unpolarized absorbances from a given section, is confirmed to be identical to the mean of the respective polar-ized maximum and minimum absorbances of the same section, within experimental uncertainty (Fig. 8a).
Integrated unpolarized absorbance as a function of sec-tion orientation. For the eight grains of “Pakistani” olivine whose orientation was obtained by EBSD, the angles between the incident light (i.e., ϕ, ψ) with respect to the principal axes can be determined. Using the three polarized principal absorbances measured for “Pakistani” olivine (i.e., Aa, Ab, and Ac; Table 1), the unpolarized absorbances can be calculated according to Equation 6 or 7 and then compared to the measured unpolarized absorbances (Fig. 8b). The agreement between the calculated and
the measured values is encouraging. Apart from any error due to the fact that the “A theory” is only an approximation of the “T theory,” small deviations between measured and calculated absorbances may arise from (1) the uncertainty of the EBSD analysis, which depends significantly on the pattern quality and background correction, or (2) the EBSD analyses were obtained at an early stage of sample preparation, when only one side of the epoxy mount was polished. Subsequent sectioning to ~400 µm thickness and polishing of the reverse side, as needed for the IR measurements, introduced some buckling, which may have slightly changed the geometry of some grains.
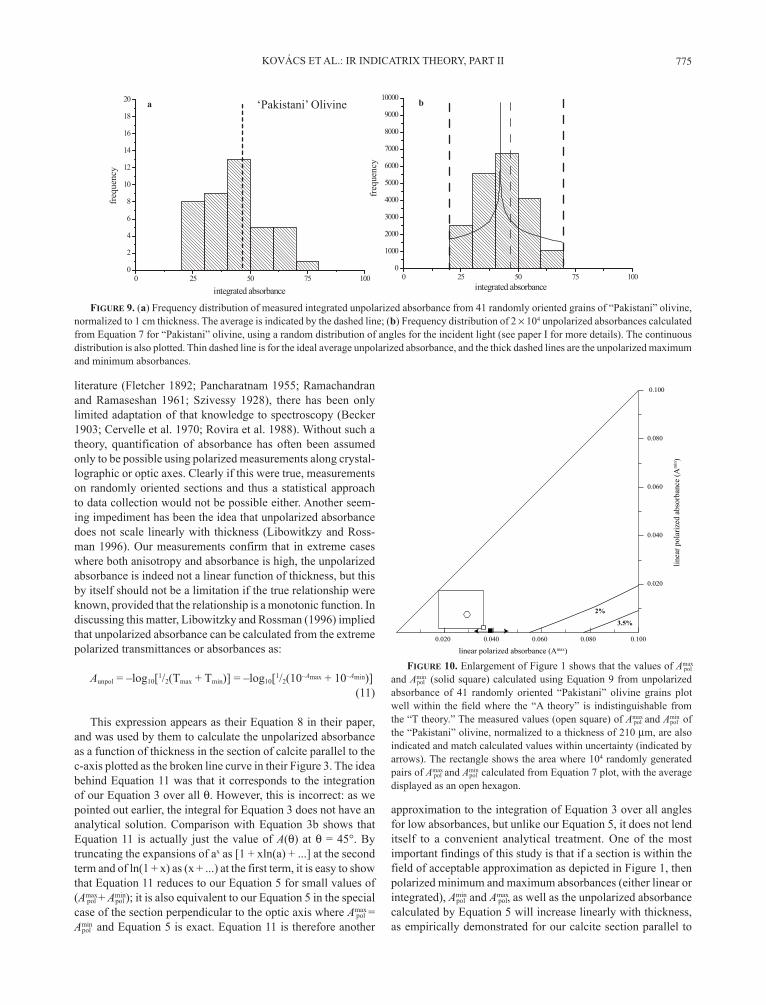
Distribution of integrated unpolarized absorbance mea-sured on a large number of randomly oriented grains. The epoxy mount with 41 randomly oriented fragments of “Pakistani” olivine was used to test whether the average unpolarized absor-bance is one third of the Total Absorbance (Eq. 8). Unfortunately due to the limitations of our rotating stage, only one absorbance analysis was made on each grain with unpolarized light on this large mount, rather than the two measurements 90° apart that we recommend. However, when the mean of the 41 measurements is taken, the errors due to the instrument polarization of the nominally unpolarized light will average out. The distribution of the measured absorbance is plotted in Figure 9a. the average absorbance of all unpolarized measurements is 43.1. This is in excellent agreement with the value of 42.8 obtained as one third of the Total Absorbance (Table 1).
We then randomly generated 2 × 10⁴ unpolarized absorbances for the “Pakistani” olivine, following the protocol in paper I. their frequency histogram is plotted in Figure 9b, together with a curve representing the calculated probability distribution of the absorbance. The calculated and measured distributions are encouragingly similar considering the relatively low number of analyzed grains. This demonstrates that the Total Absorbance of olivine can be effectively determined with a series of unpolarized measurements on randomly oriented crystals.
dIscussIon
An example of quantitative IR spectroscopy with unpolarized light: Determining the OH content of the “Pakistani” olivine
We have successfully verified the main predictions of the absorbance indicatrix theory presented in paper I on the OH peaks in “Pakistani” olivine. Therefore we use the “Pakistani” olivine to demonstrate how OH can be quantified in olivine using our new approach. It is currently the common practice to calculate the concentration of OH in olivine and other nominally anhydrous minerals (NAMS) from the sum of the integrated polarized ab-sorbance along the principal axes (called here Total Absorbance, Atot). A slightly modified version of the Beer-Lambert law links OH contents to Total Absorbance: Atot·k = c, where k is the mineral-specific calibration factor, and c is the concentration of the analyzed species. Bell et al. (2003) determined the calibration factor k for OH in olivine, obtaining k = 0.188 ± 0.012 (for OH as ppm H2O). We measure Atot =128.4 cm–1 for the “Pakistani” olivine (Table 1), which, from the calibration of Bell et al. (2003), corresponds to 24.1 ppm of water.
The procedure using unpolarized light on a population of
00020051000100500.0
2.0
4.0
6.0
8.0
0.1
2.1
4.1
alin
ear a
bsor
banc
e
( ssenkciht )m
00020051000100500
02
04
06
08
001
021b
inte
grat
ed a
bsor
banc
e
( ssenkciht )m
minimum polarized (2.58(5)x10 , χ2=2.00) maximum polarized (5.64(11)x10 , χ2=0.6) unpolarized (3.91(8)x10 , χ2=0.79) (4.11(6)x10 )
minimum polarized (2.42(5)x10 , χ2=1.67) maximum polarized (5.21(10)x10 , χ2=0.16) unpolarized (3.72(7)x10 , χ2=0.63) (3.82(6)x10 )
Fig. 5. Kovács et al.
Calcite3943 cm-1
Calcite3943 cm-1
FIgure 5. Linear (a) and integrated (b) absorbances as a function of thickness for the peak at 3943 cm–1 in cleavage parallel section (1011) of calcite. the dashed lines are best fits through the average of the minimum and maximum polarized absorbances, for comparison with the unpolarized absorbances. Numbers indicate steepness of these linear regressions through the origin. The χ2 values are calculated assuming that the uncertainty in absorbance is 5% and in thickness is 1%.
KováCS et AL.: IR IndICAtRIx tHeoRy, PARt II 773
a b c
0
0.05
0.1
0.15
0.2
0.25
0.3
0.35
0.4
345035003550360036503700 345035003550360036503700wavenumber (cm-1)
345035003550360036503700
Fig. 6. Kovács et al.
[100] [010] [001]lin
ear p
olar
ized
abs
orba
nce
wavenumber (cm-1) wavenumber (cm-1)
0o
15o
30o
45o
60o
90o
75o
0o
15o
30o
45o
60o
90o75o
0o
15o
30o
45o
60o
90o75o
‘Pakistani’ Olivine
FIgure 6. Angular distribution of polarized spectra recorded in 15° steps in the range 3400–3750 cm–1 for “Pakistani” olivine: (a) from the direction of the [100] axis; (b) from the direction of the [010] axis; (c) from the direction of the [001] axis. The angles are relative to the maximum polarized absorbance.
a,
c, = 2.42
e, = 3.66
d, = 0.56
f, = 0.09
b, = 0.72
0
03
0609
021
051
081
012
042072
003
033
0
03
0609
021
051
081
012
042072
003
033
0
03
0609
021
051
081
012
042072
003
033
0
03
0609
021
051
081
012
042072
003
033
0
03
0609
021
051
081
012
042072
003
033
[100]
[100]
[010]
[010]
[001]
[001]
0
52
05
57
001
52
05
57
001
0
03
0609
120
051
081
012
042072
003
033
Fig. 7. Kovács et al.
= 1.39
‘Pakistani’ Olivine FIgure 7. Angular variation of the integrated absorbance of the group of peaks in the range 3500–3650 cm–1 for “Pakistani” olivine: (a, c, and e) are the integrated polarized absorbances analyzed from the [100], [010], and [001] directions; (b, d, and f) are the corresponding unpolarized absorbances analyzed from the [100], [010], and [001] directions. Dots represent measured absorbances; dashed curves are the fitted angular distribution of absorbance calculated by equation 4. For the data fit, we assumed 3% uncertainty in the individual analysis.
KováCS et AL.: IR IndICAtRIx tHeoRy, PARt II774
randomly oriented grains would be as follows. First we need to establish that the sample has thickness/absorption characteristics that place it within the field of acceptable accuracy as shown in Figure 1. Because the calculation of the error is not possible for integrated absorbance (either for one peak or a group of peaks, because Equation 3 only applies to linear absorbance), we instead determine what the error would be using the linear absorbance of the most intense peak. If prior information on Aa, Ab, and Ac of the analyzed mineral at a given thickness is available, then the thickness at which the “A theory” holds can be determined using Figure 1 (a user friendly version of which is available in the electronic repository). Alternatively, it was shown in paper I that the principal polarized absorbances (either linear or integrated) can be estimated from a population of unpolarized measurements on randomly oriented grains (Eq. 70 in paper I) as follows:
Amapo
xl = 3Aav
ungpol – 2Ami
unnpol
Amipo
nl = 3Aav
ungpol – 2Ama
unxpol. (9)
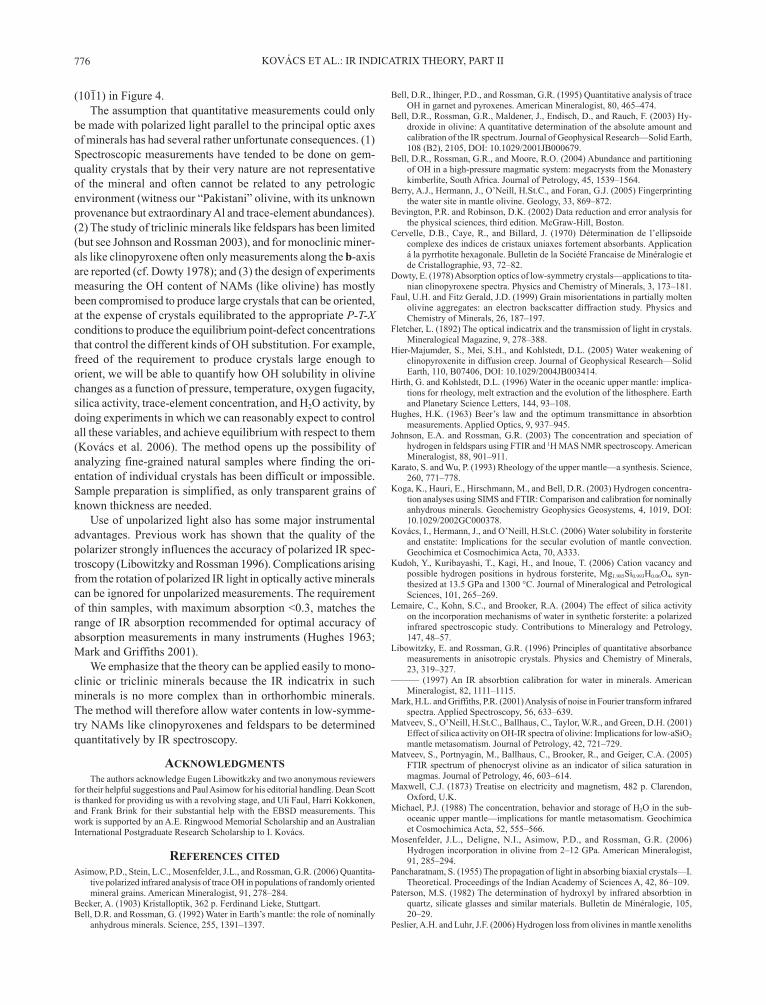
We used these relations to calculate linear polarized maximum and minimum absorbance (Aa and Ac) for the “Pakistani” olivine from our measurements of 41 randomly oriented grains accord-ing to equation 9 (plotted in Fig. 10 as the solid square). For comparison the measured principal linear polarized absorbances derived from the “Pakistani” olivine cuboid scaled down to a sample thickness of 210 µm is also plotted, and it matches the calculated values within experimental uncertainty. As for the San Carlos olivine sample, we randomly generated 104 pairs of values of Ama
poxl and Ami
ponl for “Pakistani” olivine with a thickness of
210 µm, as plotted in Figure 10. These points cover a rectangular field in the error diagram, with both the maximum error (the Aa-Ac section) and the average error (also shown in Fig. 10) of less than 2%. The error from using the integrated absorbance of the whole group of peaks will therefore be less than this, that is, negligible compared to measurement uncertainty.
We have demonstrated in paper I and confirmed with mea-surements in this paper that the average of unpolarized absor-bances is one third of the Total Absorbance. This means that the calibration factor for the unpolarized average should be three times the polarized calibration factor. So for OH in olivine:
COH = A
nk
in
i
pol=∑
⋅ ⋅0 3 (10)
where Ai is the integrated unpolarized absorbance of an indi-vidual grain, which is normalized to a reference thickness, n is the number of analyses, kpol is the calibration factor for polarized light and COH is concentration (here in ppm). The average ab-sorbance using unpolarized light of 41 randomly oriented grains of “Pakistani” olivine is 43.1 if normalized to 1 cm thickness, resulting in 24.3 ppm of water, in excellent agreement with the result from the polarized measurements, which was 24.1 ppm. The important point is that previous calibrations developed for total polarized absorbance can be applied to the averages of unpolarized measurements.
Given absorbance conditions where the “A theory” is an ac-curate approximation, it is shown in paper I that the uncertainty in the statistical estimation of Total Absorbance is ~20% if 10 random grains are used, however it can be substantially improved if more grains are analyzed.
It has been recognized that the Paterson calibration with an orientation factor of γ = 0.5 for unpolarized light (Paterson 1982) underestimates oH contents in olivine by a factor of ~2–3.5 compared to calibrations using polarized light (Bell et al. 2003, 2004; Koga et al. 2003; Mosenfelder et al. 2006). We hypothesize that this is, within uncertainty, the factor of 3 that we have discussed above.
Previous work and future directionsA commonly held opinion among spectroscopists has been
that quantitative spectroscopic measurements using unpolarized light were not possible. This opinion flourished because of the lack of a theory to describe the interaction and absorbance of light in anisotropic materials. Although there have been publications dealing with such highly complex phenomena in the physics
mea
sure
d un
pola
rized
abs
orba
nce
linear fit through the origin (y = 1.01x, R2 = 0.95)
calculated unpolarized absorbance
Fig. 8. Kovács et al.
mea
sure
d un
pola
rized
abs
orba
nce
measured = 0.93 x calculated, R 2= 0.91
calculated unpolarized absorbance
a
b
57055200
52
05
57
57055200
52
05
57
testing Equation 5
testing Equation 7
‘Pakistani’ Olivine
‘Pakistani’ Olivine
FIgure 8. (a) Comparison of the calculated and measured unpolarized absorbances of 11 randomly oriented “Pakistani” olivine grains. The calculated unpolarized absorbances are the averages of the polarized maximum and minimum absorbance for each section (Eq. 5). “Measured” unpolarized absorbances are the averages of two nominally unpolarized measurements in perpendicular directions, which are done to compensate for the slight polarization of nominally unpolarized light. Both calculated and measured unpolarized absorbances are normalized to 1 cm thickness. (b) Measured unpolarized absorbance of 8 “Pakistani” olivine grains is plotted against values calculated by Equation 7 using the integrated principal polarized absorbances, normalized to 1 cm thickness.
KováCS et AL.: IR IndICAtRIx tHeoRy, PARt II 775
literature (Fletcher 1892; Pancharatnam 1955; Ramachandran and Ramaseshan 1961; Szivessy 1928), there has been only limited adaptation of that knowledge to spectroscopy (Becker 1903; Cervelle et al. 1970; Rovira et al. 1988). Without such a theory, quantification of absorbance has often been assumed only to be possible using polarized measurements along crystal-lographic or optic axes. Clearly if this were true, measurements on randomly oriented sections and thus a statistical approach to data collection would not be possible either. Another seem-ing impediment has been the idea that unpolarized absorbance does not scale linearly with thickness (Libowitkzy and Ross-man 1996). our measurements confirm that in extreme cases where both anisotropy and absorbance is high, the unpolarized absorbance is indeed not a linear function of thickness, but this by itself should not be a limitation if the true relationship were known, provided that the relationship is a monotonic function. In discussing this matter, Libowitzky and Rossman (1996) implied that unpolarized absorbance can be calculated from the extreme polarized transmittances or absorbances as:
Aunpol = –log10[1/2(Tmax + Tmin)] = –log10[1/2(10–Amax + 10–Amin)] (11)
This expression appears as their Equation 8 in their paper, and was used by them to calculate the unpolarized absorbance as a function of thickness in the section of calcite parallel to the c-axis plotted as the broken line curve in their Figure 3. The idea behind Equation 11 was that it corresponds to the integration of our Equation 3 over all θ. However, this is incorrect: as we pointed out earlier, the integral for Equation 3 does not have an analytical solution. Comparison with Equation 3b shows that equation 11 is actually just the value of A(θ) at θ = 45°. By truncating the expansions of ax as [1 + xln(a) + ...] at the second term and of ln(1 + x) as (x + ...) at the first term, it is easy to show that Equation 11 reduces to our Equation 5 for small values of (Ama
poxl + Ami
ponl ); it is also equivalent to our Equation 5 in the special
case of the section perpendicular to the optic axis where Amapo
xl =
Amipo
nl and Equation 5 is exact. Equation 11 is therefore another
approximation to the integration of Equation 3 over all angles for low absorbances, but unlike our Equation 5, it does not lend itself to a convenient analytical treatment. One of the most important findings of this study is that if a section is within the field of acceptable approximation as depicted in Figure 1, then polarized minimum and maximum absorbances (either linear or integrated), Ami
ponl and Ama
poxl, as well as the unpolarized absorbance
calculated by Equation 5 will increase linearly with thickness, as empirically demonstrated for our calcite section parallel to
00157055200
2
4
6
8
01
21
41
61
81
02
freq
uenc
y
ecnabrosba detargetni0015705520
0
0001
0002
0003
0004
0005
0006
0007
0008
0009
00001
freq
uenc
y
a b
Fig. 9. Kovács et al.
ecnabrosba detargetni
‘Pakistani’ Olivine
FIgure 9. (a) Frequency distribution of measured integrated unpolarized absorbance from 41 randomly oriented grains of “Pakistani” olivine, normalized to 1 cm thickness. The average is indicated by the dashed line; (b) Frequency distribution of 2 × 10⁴ unpolarized absorbances calculated from Equation 7 for “Pakistani” olivine, using a random distribution of angles for the incident light (see paper I for more details). The continuous distribution is also plotted. Thin dashed line is for the ideal average unpolarized absorbance, and the thick dashed lines are the unpolarized maximum and minimum absorbances.
0.020 0.040 0.060 0.080 0.100
0.020
0.040
0.060
0.080
0.100
linear polarized absorbance (Amax)
2%
3.5%
Fig. 10. Kovács et al.
line
ar p
olar
ized
abs
orba
nce
(Am
in)
FIgure 10. Enlargement of Figure 1 shows that the values of Ama
poxl
and Amipo
nl (solid square) calculated using equation 9 from unpolarized
absorbance of 41 randomly oriented “Pakistani” olivine grains plot well within the field where the “A theory” is indistinguishable from the “T theory.” The measured values (open square) of Ama
poxl and Ami
ponl of
the “Pakistani” olivine, normalized to a thickness of 210 µm, are also indicated and match calculated values within uncertainty (indicated by arrows). The rectangle shows the area where 104 randomly generated pairs of Ama
poxl and Ami
ponl calculated from Equation 7 plot, with the average
displayed as an open hexagon.
KováCS et AL.: IR IndICAtRIx tHeoRy, PARt II776
(1011) in Figure 4.The assumption that quantitative measurements could only
be made with polarized light parallel to the principal optic axes of minerals has had several rather unfortunate consequences. (1) Spectroscopic measurements have tended to be done on gem-quality crystals that by their very nature are not representative of the mineral and often cannot be related to any petrologic environment (witness our “Pakistani” olivine, with its unknown provenance but extraordinary Al and trace-element abundances). (2) The study of triclinic minerals like feldspars has been limited (but see Johnson and Rossman 2003), and for monoclinic miner-als like clinopyroxene often only measurements along the b-axis are reported (cf. dowty 1978); and (3) the design of experiments measuring the OH content of NAMs (like olivine) has mostly been compromised to produce large crystals that can be oriented, at the expense of crystals equilibrated to the appropriate P-T-X conditions to produce the equilibrium point-defect concentrations that control the different kinds of OH substitution. For example, freed of the requirement to produce crystals large enough to orient, we will be able to quantify how OH solubility in olivine changes as a function of pressure, temperature, oxygen fugacity, silica activity, trace-element concentration, and H2O activity, by doing experiments in which we can reasonably expect to control all these variables, and achieve equilibrium with respect to them (Kovács et al. 2006). the method opens up the possibility of analyzing fine-grained natural samples where finding the ori-entation of individual crystals has been difficult or impossible. Sample preparation is simplified, as only transparent grains of known thickness are needed.
Use of unpolarized light also has some major instrumental advantages. Previous work has shown that the quality of the polarizer strongly influences the accuracy of polarized IR spec-troscopy (Libowitzky and Rossman 1996). Complications arising from the rotation of polarized IR light in optically active minerals can be ignored for unpolarized measurements. The requirement of thin samples, with maximum absorption <0.3, matches the range of IR absorption recommended for optimal accuracy of absorption measurements in many instruments (Hughes 1963; Mark and Griffiths 2001).
We emphasize that the theory can be applied easily to mono-clinic or triclinic minerals because the IR indicatrix in such minerals is no more complex than in orthorhombic minerals. The method will therefore allow water contents in low-symme-try NAMs like clinopyroxenes and feldspars to be determined quantitatively by IR spectroscopy.
acKnowledgmentsThe authors acknowledge Eugen Libowitkzky and two anonymous reviewers
for their helpful suggestions and Paul Asimow for his editorial handling. Dean Scott is thanked for providing us with a revolving stage, and Uli Faul, Harri Kokkonen, and Frank Brink for their substantial help with the EBSD measurements. This work is supported by an A.E. Ringwood Memorial Scholarship and an Australian International Postgraduate Research Scholarship to I. Kovács.
reFerences cItedAsimow, P.D., Stein, L.C., Mosenfelder, J.L., and Rossman, G.R. (2006) Quantita-
tive polarized infrared analysis of trace OH in populations of randomly oriented mineral grains. American Mineralogist, 91, 278–284.
Becker, A. (1903) Kristalloptik, 362 p. Ferdinand Lieke, Stuttgart.Bell, d.R. and Rossman, G. (1992) Water in earth’s mantle: the role of nominally
anhydrous minerals. Science, 255, 1391–1397.
Bell, d.R., Ihinger, P.d., and Rossman, G.R. (1995) Quantitative analysis of trace OH in garnet and pyroxenes. American Mineralogist, 80, 465–474.
Bell, D.R., Rossman, G.R., Maldener, J., Endisch, D., and Rauch, F. (2003) Hy-droxide in olivine: A quantitative determination of the absolute amount and calibration of the IR spectrum. Journal of Geophysical Research—Solid Earth, 108 (B2), 2105, doI: 10.1029/2001JB000679.
Bell, D.R., Rossman, G.R., and Moore, R.O. (2004) Abundance and partitioning of OH in a high-pressure magmatic system: megacrysts from the Monastery kimberlite, South Africa. Journal of Petrology, 45, 1539–1564.
Berry, A.J., Hermann, J., O’Neill, H.St.C., and Foran, G.J. (2005) Fingerprinting the water site in mantle olivine. Geology, 33, 869–872.
Bevington, P.R. and Robinson, d.K. (2002) data reduction and error analysis for the physical sciences, third edition. McGraw-Hill, Boston.
Cervelle, d.B., Caye, R., and Billard, J. (1970) détermination de l’ellipsoide complexe des indices de cristaux uniaxes fortement absorbants. Application á la pyrrhotite hexagonale. Bulletin de la Société Francaise de Minéralogie et de Cristallographie, 93, 72–82.
dowty, e. (1978) Absorption optics of low-symmetry crystals—applications to tita-nian clinopyroxene spectra. Physics and Chemistry of Minerals, 3, 173–181.
Faul, U.H. and Fitz Gerald, J.d. (1999) Grain misorientations in partially molten olivine aggregates: an electron backscatter diffraction study. Physics and Chemistry of Minerals, 26, 187–197.
Fletcher, L. (1892) the optical indicatrix and the transmission of light in crystals. Mineralogical Magazine, 9, 278–388.
Hier-Majumder, S., Mei, S.H., and Kohlstedt, d.L. (2005) Water weakening of clinopyroxenite in diffusion creep. Journal of Geophysical Research—Solid earth, 110, B07406, doI: 10.1029/2004JB003414.
Hirth, G. and Kohlstedt, d.L. (1996) Water in the oceanic upper mantle: implica-tions for rheology, melt extraction and the evolution of the lithosphere. Earth and Planetary Science Letters, 144, 93–108.
Hughes, H.K. (1963) Beer’s law and the optimum transmittance in absorbtion measurements. Applied optics, 9, 937–945.
Johnson, E.A. and Rossman, G.R. (2003) The concentration and speciation of hydrogen in feldspars using FTIR and 1H MAS NMR spectroscopy. American Mineralogist, 88, 901–911.
Karato, S. and Wu, P. (1993) Rheology of the upper mantle—a synthesis. Science, 260, 771–778.
Koga, K., Hauri, e., Hirschmann, M., and Bell, d.R. (2003) Hydrogen concentra-tion analyses using SIMS and FTIR: Comparison and calibration for nominally anhydrous minerals. Geochemistry Geophysics Geosystems, 4, 1019, doI: 10.1029/2002GC000378.
Kovács, I., Hermann, J., and o’neill, H.St.C. (2006) Water solubility in forsterite and enstatite: Implications for the secular evolution of mantle convection. Geochimica et Cosmochimica Acta, 70, A333.
Kudoh, y., Kuribayashi, t., Kagi, H., and Inoue, t. (2006) Cation vacancy and possible hydrogen positions in hydrous forsterite, Mg1.985Si0.993H0.06O4, syn-thesized at 13.5 GPa and 1300 °C. Journal of Mineralogical and Petrological Sciences, 101, 265–269.
Lemaire, C., Kohn, S.C., and Brooker, R.A. (2004) the effect of silica activity on the incorporation mechanisms of water in synthetic forsterite: a polarized infrared spectroscopic study. Contributions to Mineralogy and Petrology, 147, 48–57.
Libowitzky, e. and Rossman, G.R. (1996) Principles of quantitative absorbance measurements in anisotropic crystals. Physics and Chemistry of Minerals, 23, 319–327.
——— (1997) An IR absorbtion calibration for water in minerals. American Mineralogist, 82, 1111–1115.
Mark, H.L. and Griffiths, P.R. (2001) Analysis of noise in Fourier transform infrared spectra. Applied Spectroscopy, 56, 633–639.
Matveev, S., O’Neill, H.St.C., Ballhaus, C., Taylor, W.R., and Green, D.H. (2001) Effect of silica activity on OH-IR spectra of olivine: Implications for low-aSiO2 mantle metasomatism. Journal of Petrology, 42, 721–729.
Matveev, S., Portnyagin, M., Ballhaus, C., Brooker, R., and Geiger, C.A. (2005) FTIR spectrum of phenocryst olivine as an indicator of silica saturation in magmas. Journal of Petrology, 46, 603–614.
Maxwell, C.J. (1873) Treatise on electricity and magnetism, 482 p. Clarendon, oxford, U.K.
Michael, P.J. (1988) the concentration, behavior and storage of H2O in the sub-oceanic upper mantle—implications for mantle metasomatism. Geochimica et Cosmochimica Acta, 52, 555–566.
Mosenfelder, J.L., Deligne, N.I., Asimow, P.D., and Rossman, G.R. (2006) Hydrogen incorporation in olivine from 2–12 GPa. American Mineralogist, 91, 285–294.
Pancharatnam, S. (1955) the propagation of light in absorbing biaxial crystals—I. theoretical. Proceedings of the Indian Academy of Sciences A, 42, 86–109.
Paterson, M.S. (1982) the determination of hydroxyl by infrared absorbtion in quartz, silicate glasses and similar materials. Bulletin de Minéralogie, 105, 20–29.
Peslier, A.H. and Luhr, J.F. (2006) Hydrogen loss from olivines in mantle xenoliths
KováCS et AL.: IR IndICAtRIx tHeoRy, PARt II 777
from Simcoe (U.S.A.) and Mexico: Mafic alkalic magma ascent rates and water budget of the sub-continental lithosphere. Earth and Planetary Science Letters, 242, 302–319.
Ramachandran, G.n. and Ramaseshan, S. (1961) Crystal optics. In Handbuch der Physics, 25, 21 p. Springer, Berlin.
Rovira, v.J.M., Abrego, S.A., Rodríguez, v.H., and Pascual, C.M. (1988) Refractive indices and absorbtion coefficients associated with any propagation direction of a wave in absorbing biaxial materials. Journal of optics, 19, 187–192.
Sambridge, M., Fitz Gerald, J.d., Kovács, I., o’neill, H.St.C., and Hermann, J. (2008) Quantitative absorbance spectroscopy with unpolarized light, Part I: Physical and Mathematical development. American Mineralogist, 93, 751–764 (this issue).
Smyth, J.R., Frost, D.J., Nestola, F., Holl, C.M., and Bromiley, G. (2006) Olivine hydration in the deep upper mante: effects of temperature and silica activity. Geophysical Research Letters, 33, L15301, doI: 10.1029/2006GL026194.
Szivessy, G. (1928) Kristalloptik. In Handbuck der Physik, 20, 635 p. Springer verlag, Berlin.
Walker, M.A., Hermann, J., Berry, A.J., and O’Neill, H.St.C. (2007) Three water sites in upper mantle olivine and the role of titanium in the water weaken-ing mechanism. Journal of Geophysical Research, 112, B05211, DOI: 10.1029/2006JB004620.
Webb, S.L. (1989) the elasticity of upper mantle orthosilicates olivine and garnet to 3 GPa. Physics and Chemistry of Minerals, 16, 684–692.
Witt-Eickschen, G. and O’Neill, H.St.C. (2005) The effect of temperature on the equilibrium distribution of trace elements between clinopyroxene, orthopy-roxene, olivine and spinel in upper mantle peridotite. Chemical Geology, 221, 65–101.
Manuscript received March 27, 2007Manuscript accepted deceMber 26, 2007Manuscript handled by paul asiMow
appendIx
Angular variation of “integrated” absorbanceIn paper I, we derived the approximate Equation 4 (the “A
theory”) for the case of linear absorbance (i.e., peak height), but, as discussed in the text, for many applications it is necessary to use the integrated absorbance of a group of peaks. This raises the question of how the angular variation of integrated absorbance relates to the angular variation of linear absorbance. To answer this question we first establish the relationship for a single absorbance peak, and then extend the derivation to multiple overlapping peaks.
If the single peak has a Gaussian shape then absorbance as a function of θ and wavelength, λ is given by
A A e( , ) ( )θ λ θλ λ
=− −( )1
2 0
2
. (A1)
Where λ0 is the wavelength of the peak height of the curve, and A(θ) is the peak absorbance. Integrating A(θ,λ) between any two wavelengths, λ1 and λ2 we have
A A e dI ( , , ) ( )θ λ λ θ λλ λ
λ
λ
1 2
12 0
2
1
2
=− −( )∫ . (A2)
Because the term in the integral is just a constant, the integrat-ed absorbance A1(θ) is linearly proportional to the peak height, A(θ). Hence the angular dependence of integrated absorbance is the same as the linear absorbance (peak height). Extending this result to overlapping peaks is complicated because the principal axes for neighboring peaks may not have the same orientation. As an example, a hypothetical situation is illustrated in Figure A1 for two peaks in which the principal axes, and therefore the orienta-tions of the maximum and minimum absorbances, are inclined to each other. The sum of the two absorbance peaks at any polarization angle, θ with respect to the reference direction is given by
Asum(θ) = A1max·cos2(θ – θ1) + A1
min·sin2(θ – θ1) + A2
max·cos2(θ – θ2) + A2min·sin2(θ – θ2) (A3)
where θ1 and θ2 are the angles of the two major principal axes with respect to the x-axis (see Fig. A1). Using the identities,
cos2X + sin2X = 1,cos(X – Y) = cosX cosY + sinX sinY,cos2X = ½(1 + cos2X), (A4)
we have
Asum(θ) = (A1min + A2
min) + (A1max – A1
min)cos2(θ – θ1) + (A2
max – A2min)cos2(θ – θ2), (A5)
A A A A Asum ( ) ( ) ( )
(
min max max minθ = + + +
+
12
12
12
1 1 2 2
AA A
A A
1 1 1
2 2
2
12
2
max min
max min
)cos ( )
( )cos
− −
+ −
θ θ
(( )θ θ− 2
(A6)
A A A A Asum ( ) ( ) ( )
(
min max max minθ = + + +
+
12
12
12
1 1 2 2
AA A1 1 1 12 2 2 2max min ) cos cos sin sin− +
+
θ θ θ θ
112
2 2 2 22 2 2 2( ) cos cos sin sinmax minA A− +
θ θ θ θ
(A7)
A p q rsum( ) cos sinθ θ θ= + +12
12
2 12
2 (A8)
where p A A A A A Ai i
i
n= + = + + +=∑( ) ( ) (max min max min max
11 1 2 22
11 12
min
max min max m
)
( )cos (q A A A Ai ii
n
i= − = −=∑ θ iin max min
max mi
)cos ( )cos
(
2 21 2 2 2θ θ+ −
= −
A A
r A Ai inn max min max)sin ( )sin (
i
n
i A A A A=∑ = − + −
11 1 1 22 2θ θ 22 22min )sin θ
. (A9)
Since p, q, and r are independent constants then we can re-write them in a convenient form, where n is the number of peaks considered, which is two in our analysis. We may write any values of q and r in terms of their polar coordinates:
q = (A – a) cos2ϕ, r = (A – a) sin2ϕ (A10)
where A and a are the maximum and minimum absorbances of the sum of the two individual peaks, with A > a, and ϕ is the angle of the major axis of the combined function to the refer-ence direction (see Fig. A1). However, because the polar radius is described by two independent variables we can remove one degree of freedom by writing
p = A + a. (A11)
Hence for any values of p, q, and r, we have a unique map-ping onto the variables A, a, and ϕ. Using the new variables and substituting into (Eq. A8) we have
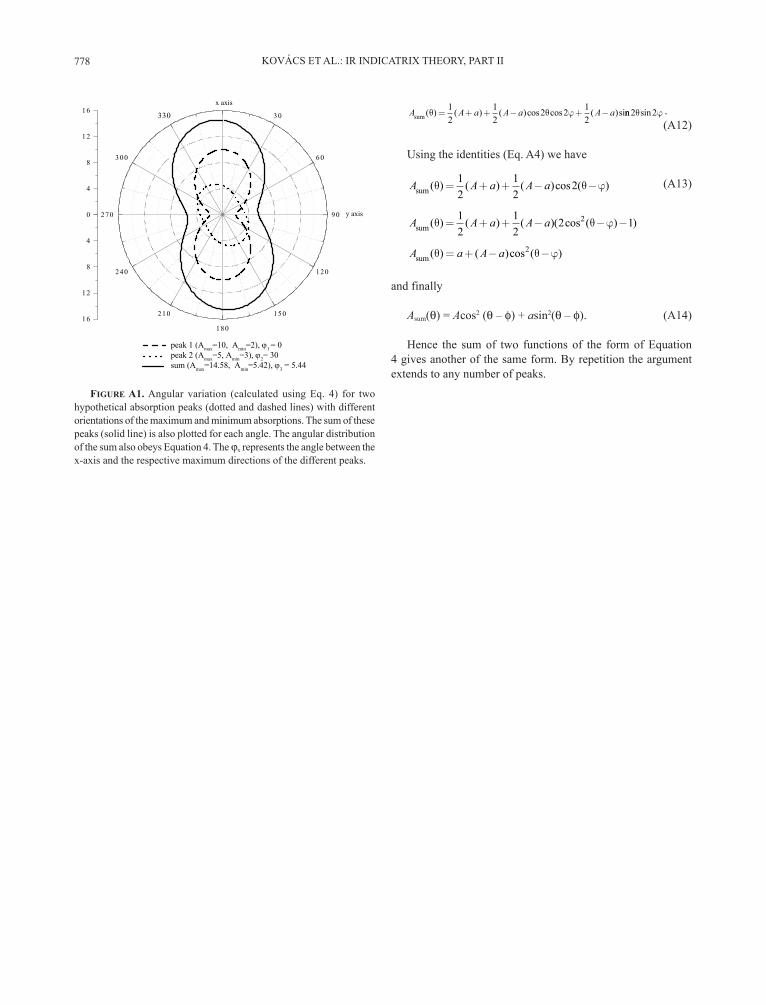
KováCS et AL.: IR IndICAtRIx tHeoRy, PARt II778
A A a A a A asum ( ) ( ) ( )cos cos ( )siθ θ ϕ= + + − + −12
12
2 2 12
nn sin2 2θ ϕ . (A12)
Using the identities (Eq. A4) we have
A A a A asum ( ) ( ) ( )cos ( )θ θ ϕ= + + − −12
12
2 (A13)
A A a A asum ( ) ( ) ( )( cos ( ) )θ θ ϕ= + + − − −12
12
2 12
A a A asum ( ) ( )cos ( )θ θ ϕ= + − −2
and finally
Asum(θ) = Acos2 (θ – ϕ) + asin2(θ – ϕ). (A14)
Hence the sum of two functions of the form of Equation 4 gives another of the same form. By repetition the argument extends to any number of peaks.
0
4
8
21
6103
06
09
021
051
081
012
042
072
003
033
4
8
21
61
peak 1 (Amax=10, Amin=2), 1 = 0peak 2 (Amax=5, Amin=3), 2= 30sum (Amax=14.58, Amin=5.42), 3 = 5.44
Fig. A1 Kovács et al.
x axis
y axis
FIgure a1. Angular variation (calculated using Eq. 4) for two hypothetical absorption peaks (dotted and dashed lines) with different orientations of the maximum and minimum absorptions. The sum of these peaks (solid line) is also plotted for each angle. The angular distribution of the sum also obeys Equation 4. The φx represents the angle between the x-axis and the respective maximum directions of the different peaks.