Library of Congress Cataloguing in Publication Data · 5.1 The Golden Age growth episode 73 5.2 The...
306
Transcript of Library of Congress Cataloguing in Publication Data · 5.1 The Golden Age growth episode 73 5.2 The...


© Mark Setterfield, 2002
All rights reserved. No part of this publication may be reproduced, stored in a retrieval system or transmitted in any form or by any means, electronic, mechanical or photocopying, recording, or otherwise without the prior permission of the publisher.
Published byEdward Elgar Publishing LimitedGlensanda HouseMontpellier ParadeCheltenhamGlos GL50 1UAUK
Edward Elgar Publishing, Inc.136 West StreetSuite 202NorthamptonMassachusetts 01060USA
A catalogue record for this bookis available from the British Library
Library of Congress Cataloguing in Publication Data
The economics of demand-led growth: challenging the supply-side vision of the longrun/edited by Mark Setterfield.
p.cm.Includes bibliographical references and index.
1. Demand (Economic theory) 2. Supply-side economics. 3. Economics. 4. Economicpolicy. 5. Economic development. 6. United States Ð Economic policy. 7. UnitedStates Ð Economic conditions Ð 1945Ð I. Setterfield, Mark, 1967Ð
HB801.E28 2002338.973 Ð dc21 2001051134
ISBN 1 84064 177 0
Typeset by Cambrian Typesetters, Frimley, SurreyPrinted and bound in Great Britain by Biddles Ltd, www.biddles.co.uk
01Downloaded from Elgar Online by not authorized at 07/12/2013 03:06:26AM

Contents
List of figures viiList of tables ixList of contributors xi
1 Introduction: a dissenterÕs view of the development of growth theory and the importance of demand-led growth 1Mark Setterfield
PART ONE FUNDAMENTAL ISSUES IN THE THEORY OF DEMAND-LED GROWTH
2 Keynesian macroeconomics and the theory of economic growth: putting aggregate demand back in the picture 19Thomas I. Palley
3 The exogeneity of investment: from systemic laws of accumulation and growth to effective demand conditions 41Joseph Halevi and R�duane Taouil
4 Growth and fluctuations in the USA: a demand-oriented explanation 55H. Sonmez Atesoglu
PART TWO KALDORIAN MODELS OF DEMAND-LED GROWTH
5 A neo-Kaldorian perspective on the rise and decline of theGolden Age 67Mark Setterfield and John Cornwall
6 The role of the balance of payments in economic growth 87J.S.L. McCombie and Mark Roberts
7 Pitfalls in the theory of growth: an application to the balance-of-payments-constrained growth model 115Thomas I. Palley
PART THREE KALECKIAN MODELS OF DEMAND-LED GROWTH
8 Distribution, demand and growth in neo-Kaleckian macro-models 129Robert A. Blecker
v
Downloaded from Elgar Online by not authorized at 07/12/2013 03:09:33AM

9 Longer-run aspects of Kaleckian macroeconomics 153Tracy Mott
10 The Kaleckian growth model with target return pricing and conflict inflation 172Marc Lavoie
11 Conflict, inflation, distribution and terms of trade in theKaleckian model 189Mario Cassetti
PART FOUR TRAVERSE ANALYSIS AND DEMAND-LED GROWTH
12 A model of Kaldorian traverse: cumulative causation, structural change and evolutionary hysteresis 215Mark Setterfield
PART FIVE STRUCTURAL CHANGE AND DEMAND-LED GROWTH
13 Endogenous demand in the theory of transformational growth 237George Argyrous
14 Notes on the transformational growth of demand 251Edward J. Nell
15 Is a biased technological change fuelling dualism? 273Pascal Petit and Luc Soete
Index 303
vi Contents
Downloaded from Elgar Online by not authorized at 07/12/2013 03:09:33AM

List of figures
2.1 The evolution of potential output, and the effect of an increase in the capitalÐlabour ratio in the Solow growth model 20
2.2 The effect on the evolution of potential output of an exogenous change in the rate of labour augmenting technical progress 21
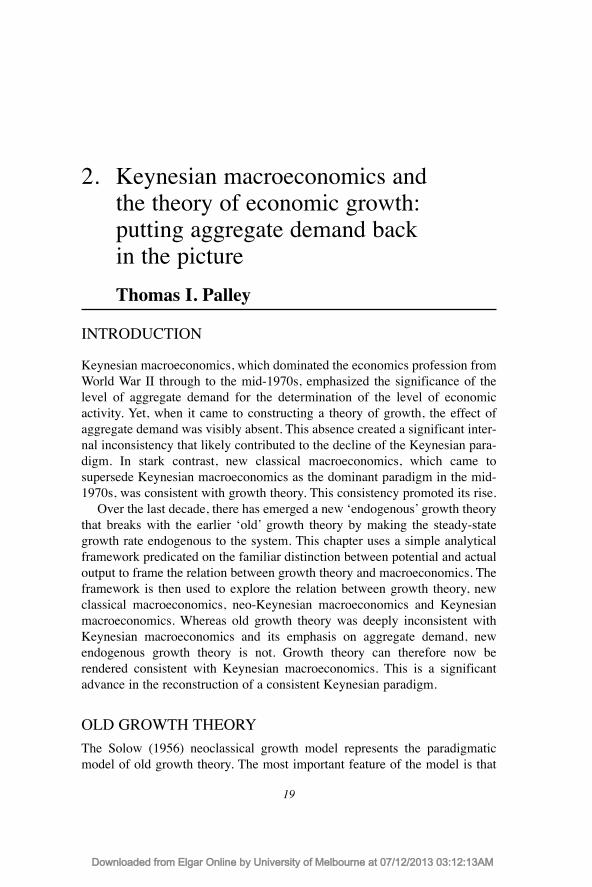
2.3 The relationship between potential and actual output 232.4 Alternative paths of potential output in an endogenous
growth model 272.5 The link between demand conditions and output growth in a
fundamentalist Keynesian model with endogenous growth 312.6 Determination of the equilibrium rate of growth in a
fundamentalist Keynesian growth model in which the growth of demand affects investment spending and technical progress 33
2.7 The effect of an increase in the level of demand on the equilibrium rate of growth in a fundamentalist Keynesian endogenous growth model 35
4.1 Real GDP and real investment 564.2 Real GDP and real government spending 574.3 Real GDP and real exports 574.4 Real GDP and real M2 money supply 585.1 The Golden Age growth episode 735.2 The Golden Age and Age of Decline growth episodes compared 765.3 The 1990s boom Ð the start of a neoliberal growth episode? 796.1 The balance-of-payments equilibrium growth rate when e/p
changes endogenously 1027.1 Equilibrium growth with a strictly concave supply growth
function 1177.2 Equilibrium growth with a quasi-concave supply growth
function 1187.3 The Cornwall (1972) model, with a region of correspondence
between supply and demand growth 1197.4 The inconsistency between the BOP-constrained growth rate
and the capacity balance growth rate 12210.1 Reconciliation of the target rate of return assessed by firms
and the actual rate of profit 182
vii
Downloaded from Elgar Online by not authorized at 07/12/2013 03:09:46AM

10.2 Adjustment to long-run equilibrium following a change indemand conditions 183
10.3 Adjustment to long-run equilibrium following a change incost conditions 185
11.1 Conflicting-claims profit shares and inflation 19411.2 Equilibrium positions in the FS/GFS and GWS cases 200 A.11.3 The stagnationist case: one stable excess capacity equilibrium 208A.11.4 The stagnationist case: multiple equilibria 20914.1 The Cambridge growth model 25414.2 The changing composition of employment in the US,
1840Ð1995 25914.3 The determination of equilibrium growth and real wages 26214.4 The impact of increasing real wages and labour-saving
technical change 26414.5 Economic development and its impact on the ratio of
government spending to income 26815.1 Dualism 280
viii List of figures
Downloaded from Elgar Online by not authorized at 07/12/2013 03:09:46AM

List of tables
4.1 Tests of stationarity 594.2 Results from estimation of vector error correction model 605.1 Average annual rates of growth of real non-residential
investment in the USA, selected periods, 1960Ð99 785.2 Average annual rates of growth of non-farm real output,
labour productivity and employment in the USA, selectedperiods, 1960Ð98 80
6.1 The relationship between the growth of income, the maximum net debt to income ratio and the maximum current account to income ratio 94
6.2 Balance-of-payments equilibrium growth rates in selected southeast Asian economies 104
8.1 Alternative concepts of distributional effects on aggregate demand, the profit rate and the growth rate 134
9.A1 Selected US macroeconomic data, 1948Ð99 16611.1 Types of excess capacity equilibria 19811.2 Types of full capacity equilibria 19815.1 Employment growth by skill level in manufacturing and
services (annual percentage growth rates) 28215.2 Productivity growth by sector for the USA, Canada, Japan,
Germany and France, 1960Ð73 (Period (1)) and 1984Ð93 (Period (2)) 302
ix
Downloaded from Elgar Online by not authorized at 07/12/2013 03:09:58AM

Downloaded from Elgar Online by not authorized at 07/12/2013 03:09:58AM

List of contributors
George Argyrous School of Social Science and Policy, University ofNew South Wales, Sydney, Australia
H. Sonmez Atesoglu School of Business, Clarkson University, Potsdam,NY, USA
Robert A. Blecker Department of Economics, American University,Washington, DC, USA
Mario Cassetti Dipartimento di Scienze Economiche, Universit�Degli Studi di Brescia, Brescia, Italy
John Cornwall Department of Economics, Dalhousie University,Halifax, NS, Canada
Joseph Halevi Department of Economics, Universit� Pierre Mend�sFrance, Grenoble, France and Political Economy,University of Sydney, Sydney, Australia
Marc Lavoie Department of Economics, University of Ottawa,Ottawa, Canada
J.S.L. McCombie Downing College, Cambridge University, Cambridge,England
Tracy Mott Department of Economics, University of Denver,Denver, CO, USA
Edward J. Nell Department of Economics, New School University,New York, NY, USA
Thomas I. Palley Assistant Director of Public Policy, AFL/CIO,Washington, DC, USA
Pascal Petit CEPREMAP, CNRS, Paris, France
Mark Roberts New Hall College, Cambridge University, Cambridge,England
xi
Downloaded from Elgar Online by not authorized at 07/12/2013 03:10:20AM

Mark Setterfield Department of Economics, Trinity College, Hartford,CT, USA
Luc Soete MERIT, University of Maastricht, Maastricht, TheNetherlands
R�duane Taouil CEPSE, Universit� Pierre Mend�s France, Grenoble,France
xii List of contributors
Downloaded from Elgar Online by not authorized at 07/12/2013 03:10:20AM

1. Introduction: a dissenterÕs view of the development of growth theory and the importance of demand-ledgrowth
Mark Setterfield
Growth theory has enjoyed a somewhat chequered history in the developmentof economic thought, despite having been a defining feature of economicanalysis during the century that followed the publication of SmithÕs Wealth ofNations. The works of Ricardo, Malthus, Mill and Marx Ð and even, asNicholas Kaldor often pointed out, the early chapters of the Wealth of Nationsitself Ð all attached central importance to issues of accumulation and growth.But in the wake of the late nineteenth-century marginalist revolution, with itsemphasis on exchange, resource allocation and price determination, growthbecame a topic of secondary importance. The work of Harrod and Keynes inthe 1930s revitalized interest in growth, and this interest remained central tothe development of both neoclassical and Keynesian economic theorythroughout the 1950s and 1960s. But growth theory is commonly believed tohave lost its momentum once again thereafter. Indeed, it is now commonplaceto refer to there recently having been a revival in growth theory, marked by thecontributions of Romer (1986) and Lucas (1988) and the subsequent develop-ment, during the 1990s, of neoclassical endogenous growth (NEG) theory.
The alleged hiatus in growth theory during the 1970s and 1980s is,however, more apparent than real. The popularity of this idea is more repre-sentative of the overwhelming attention that has been paid to supply-sideanalyses of macroeconomic processes since the beginning of the classicalcounter-revolution, than of any genuine suspension of the development ofgrowth theory after the late 1960s. In fact, the 1970s and 1980s witnessedsome key contributions to the theory of demand-led growth Ð contributions onwhich many of the chapters in this volume seek to build. For example,Cornwall (1972) identified the reconciliation of the growth of demand withthat of supply as one of the central issues in growth theory. In so doing, herejected the neoclassical claim that demand adjusts passively to accommodatesupply Ð so that the study of the supply side and the growth of potential output
1
Downloaded from Elgar Online by not authorized at 07/12/2013 03:10:36AM

is all that is essential to growth theorists Ð in favour of a vision based on theKeynesian principle of effective demand.1 For Cornwall, a central organizingprinciple of growth theory is ÔSayÕs law in reverseÕ, according to which theexpansion of supply (and hence potential output) responds to the expansion ofdemand (and hence actual output). A central question then becomes the elas-ticity of this supply response with respect to the expansion of demand, uponthe answer to which turns the prospects for stable growth without either ever-expanding excess capacity or excess demand.2
Meanwhile, KaldorÕs (1970, 1972, 1981, 1985) championing of theVeblenÐMyrdal notion of cumulative causation as the basis for a non-equilib-rium growth theory resulted in his developing a theory of demand-determinedgrowth in which the rate of growth of exports is the proximate determinant ofincome growth. The subsequent development of KaldorÕs thinking (see, forexample, Dixon and Thirlwall, 1975) inspired balance-of-payments-constraintgrowth (BPCG) theory (Thirlwall, 1979) from which ThirlwallÕs law Ð anempirically robust association between income growth, the income elasticityof demand for imports and the rate of growth of exports Ð emerges.3
The relationship between distribution and growth Ð central to the Kalecki-inspired Cambridge growth theory associated with, for example, Robinson(1956) Ð became an important constituent of the neo-Kaleckian growth modelsfirst developed during the 1970s and 1980s (see, for example, Harris, 1974,Asimakopulous, 1975, Rowthorn, 1982 and the various other contributionssurveyed in Chapter 8). At the core of this literature is the question as towhether a redistribution of income away from wages and towards profits iscapable of boosting growth, given the negative impact of a rising profit shareof income on consumption spending, coupled with its positive impact oninvestment expenditures. Neo-Kaleckian models have explored the conditionsnecessary for growth to be either wage-led or profit-led, extending this analy-sis to incorporate open economy effects on growth, and to link growth dynam-ics with those of conflict-based inflation.4
During the 1970s and 1980s, demand-led growth theorists also developeda concern with the importance of the composition rather than simply theamount of demand as an influence on growth. Cornwall (1977) describedgrowth as a process of movement through a commodity hierarchy, in whichdemand for the outputs of various sectors of the economy Ð agriculture, manu-facturing and services Ð is characterized by a series of Engel curves whichtogether form a Ôhierarchy of commoditiesÕ.5 The resulting transformation ofthe composition or structure of demand in the course of growth is shown toimpact the rate of growth itself. The emergence of Transformational Growththeory (see, for example, Nell, 1992) helped to consolidate and extend theseinsights into the links between growth and structural change. Part of thepurpose of Transformational Growth theory has been to provide a thorough
2 Introduction
Downloaded from Elgar Online by not authorized at 07/12/2013 03:10:36AM

account of the growth and development of demand itself in the course of capi-talist history, from the earliest beginnings of the factory system through to theemergence of mass markets and the development of the modern state.6
It is thus possible to write a history of contemporary growth theory inwhich the 1970s and 1980s appear as part of a more-or-less continuous devel-opment of ideas first introduced in the 1930s by Harrod and Keynes. As inti-mated earlier, however, this is not how most contemporary histories of growththeory are, in fact, written. Moreover, having been overlooked in accounts ofthe recent development of growth theory, it is not surprising to find that contri-butions to demand-led growth theory have also been neglected in the periodsince the emergence of NEG theory. This is because NEG theory, like itsneoclassical forebear the Solow model (Solow, 1956), provides a relentlesslysupply-oriented account of the growth process, in which demand adjustspassively to accommodate the expansion of potential output. The most impor-tant difference between NEG theory and the Solow model is that, in theformer, the marginal productivities of accumulable factors of production (suchas physical capital, human capital, and new Ôknow-howÕ or technology) arebounded from below above zero. In other words, continual accumulation ofthese factors does not exhaust their contribution to production at the margin,so that it is possible to sustain growth through a steady process of accumula-tion. This is impossible in the Solow model, in which the marginal productiv-ity of capital eventually diminishes to zero. This, in turn, rules out thepossibility of sustaining growth through the continual accumulation of capital,something that is codified in one of the most famous results of the model,which suggests that changes in the propensity to save (and hence to accumu-late, since saving is identical to investment in Solow) cannot affect the long-run growth rate. In NEG theory, however, anything that affects the savings ratewill affect the long-run rate of growth, given the conventional neoclassicalhypothesis that saving causes investment.
The essential difference between these first and second generation neoclas-sical growth theories, then, is the assumptions that they make about the tech-nical properties of (accumulable) inputs into the production process. They areessentially similar, however, in their technocratic treatment of production,which pays no heed to MarxÕs argument that social as well as technical rela-tions of production should always be at the forefront of any analysis of theconditions of supply. And more importantly for the purposes of this volume,the Solow model and NEG theories are similar in their treatment of growth asan essentially supply-side process. Since savings creates investment, effectivedemand failures are impossible, and autonomous changes in aggregatedemand can only impact the utilization of resources in the short run as long asexpectational errors or nominal rigidities Ð both of which are held to be tran-sitory phenomena Ð interrupt the otherwise neutral (in terms of their impact on
Introduction 3
Downloaded from Elgar Online by not authorized at 07/12/2013 03:10:36AM

real variables) adjustment of prices. Meanwhile, the supply-determined poten-tial output path of the economy Ð towards which the actual output path of theeconomy is attracted in the long run Ð is conventionally assumed to be inde-pendent of variations in demand and the transitory differences between actualand potential output to which these give rise. Demand is thus denied even anindirect influence on growth.7
The chapters in this volume rest on challenges to both of these propositionsÐ that demand has only a transitory impact on the utilization of resources, andthat the development of these resources (and hence of potential output) overtime is independent of demand. In the first place, the role of demand in influ-encing the utilization of productive resources is understood to be chronic:there is no supply-determined equilibrium acting as a centre of gravity towardswhich the level of economic activity is inevitably and inexorably drawn.Instead, at any point in time, the utilization of existing productive resources isfundamentally demand-determined. What this, in turn, implies is that theactual output path of the economy, which describes its growth trajectory, isdemand-determined. In other words, the sequence of short-run outcomes asso-ciated with the demand-determined utilization of productive resources tracesout the economyÕs long-run growth trajectory, in a manner that is relativelyautonomous of the conditions of supply defining the potential output path ofthe economy, which does not act as a strong attractor as in neoclassical growththeory.8 This draws attention to an important methodological feature ofdemand-led growth theory, according to which the long run is understood tobe an ongoing process (the result of which is the historical sequence of short-run outcomes alluded to above) rather than a predefined position towardswhich the economy inevitably ÔtendsÕ. This conception of the long run as aprocess is discussed further in Chapter 12, the focus of which is the principleof the traverse. However, it is equally obvious in the numerous chapters thatmake explicit use of equilibrium as an organizing concept in their discussionsof long-run growth, and which either implicitly or explicitly acknowledge thatwhat they are describing are positions of conditional or provisional equilib-rium.9 These are positions that do not possess the mechanical stability proper-ties of conventional equilibria, and/or which may not be indefinitelyreproduced over time as Ôstates of restÕ, even if the economy is able to ÔgetintoÕ such a position initially (Setterfield, 1997a; Chick and Caserta, 1997).
Second, the very development of productive resources over time is influ-enced by demand. Supply conditions do not define the potential output path ofthe economy independently of the demand-determined actual output path. Forexample, the availability of labour is influenced by the realized level ofeconomic activity, which can impact labour force participation rates, patternsof migration and the sectoral structure of employment (Cornwall, 1977).Capital accumulation is similarly influenced by realized output and hence
4 Introduction
Downloaded from Elgar Online by not authorized at 07/12/2013 03:10:36AM

demand, via accelerator effects.10 And finally, technological change isdemand-determined (and hence endogenous to the growth process), as wasfirst recognized by Kaldor in his development of the technological progressfunction (Kaldor, 1957) and subsequent championing of the Verdoorn law.11
Technical progress is induced by demand-led growth in part because of thefact that different vintages of capital embody different states of technology.Hence investment always contributes to aggregate demand, the available stockof capital and average productivity. Moreover, expansions of demand, bystimulating the amount of economic activity, can stimulate the amount oflearning-by-doing in an economy, while the process of innovation is also influ-enced by demand (Schmookler, 1966; Brouwer and Kleinknecht, 1999).12
In sum, the natural rate of growth is ultimately endogenous to the demand-determined actual rate of growth. As discussed earlier, the natural rate is notan attractor in demand-led growth models Ð it does not constitute a centre ofgravity towards which the economy automatically tends. Instead, by deter-mining the potential output of the economy, the natural rate defines a ceilingto the level of economic activity at any given point in time. What we are nowsaying, however, is that this ceiling is not exogenously determined by supply-side forces. Rather, it is sensitive to the demand-determined actual rate ofgrowth. The potential output path of the economy, which defines the maxi-mum level of activity achievable at any point in time, cannot be exceeded bythe actual output path. But the potential output path is elastic with respect tothe actual output path, so that it is ultimately possible to speak of the formeras well as the latter as being demand-led.
Note that this interaction between the actual and potential rates of growthalso draws explicit attention to a second methodological feature of demand-ledgrowth analysis, which is closely related to the first Ð the importance attachedto the principle of path dependence. Just as any of the conditional or provi-sional growth equilibria described earlier may be influenced by the rate ofgrowth actually achieved by the economy (see Chapter 12), so, too, may thepotential rate of growth be influenced in the same way. From this point ofview, the essence of macrodynamic analysis is to begin with the short run, andto understand the long run as a historical (path-dependent) sequence of theseshort-run outcomes. Whether viewed in terms of the actual rate of growthachieved or the maximum rate of growth achievable, the point is that Ôthelong-run trend is . . . a slowly changing component of a chain of short-periodsituationsÕ (Kalecki, 1971, p. 165) rather than a preordained trajectory.
The remainder of this volume is organized into five sections. The resultingdivision of chapters is somewhat false, not least because the issues that areconfronted in each section Ð such as the impact of distribution on growth, thereconciliation of the growth of demand and supply in the long run, the impor-tance of international factors and so on Ð frequently overlap. Nevertheless, the
Introduction 5
Downloaded from Elgar Online by not authorized at 07/12/2013 03:10:36AM

division is retained because it does serve a useful organizational purpose, bygrouping together chapters that are concerned with a particular facet of orapproach to analysing demand-led growth.
The first section addresses Fundamental Issues in the Theory of Demand-led Growth and, in particular, the contrast between demand- and supply-ledvisions of the growth process, the importance of the separation of investmentand saving and the empirical significance of demand-led growth. ThomasPalley examines the compatibility of short-period Keynesian analysis withlong-run growth theory, arguing that central to this compatibility is the idea ofan endogenous natural rate of growth that is sensitive to the evolution ofaggregate demand. Palley begins by describing the Solow model, which hetakes to be paradigmatic of ÔoldÕ growth theory. It is shown that this model isconsistent with both new classical macroeconomics and neoclassical-synthe-sis Keynesianism. Each of these theories postulates that the economyprogresses along a supply-determined, full employment, steady-state growthpath in the absence of shocks, the occurrence of which causes transitory depar-tures from (but has no effect on the intrinsic nature of) the trend rate ofadvance. However, the Solow model is not compatible with ÔfundamentalistÕKeynesianism, according to which the economy advances along a realizedoutput path characterized by a sequence of demand-constrained equilibria,displaying no automatic tendency to gravitate towards a supply-determined,steady-state growth trajectory consistent with full employment.
Palley then introduces the notion of endogenous growth, according towhich the long-run rate of growth is influenced by the process of accumula-tion. It is shown that both new classical macroeconomics and neoclassical-synthesis Keynesianism can be reconciled with endogenous growth theory.More importantly for Palley, so, too, can fundamentalist Keynesianism. Thisis perhaps not surprising, as KaldorÕs (1957) technical progress function isidentified as the progenitor of endogenous growth theory, and KaldorÕs cumu-lative causation models (based on the recursive and self-reinforcing interac-tion of demand and productivity growth) anticipate NEG theory by twodecades. To demonstrate his point, Palley develops a model of endogenousgrowth in which both the level and the rate of growth of demand enter into thedetermination of the long-run equilibrium growth rate. The chapter ends witha critical examination of two other models that seek to integrate demand intothe analysis of long-run growth Ð the model of unbalanced growth developedby Cornwall and Cornwall (1994) and the BPCG model due originally toThirwall (1979).
Joseph Halevi and R�duane Taouil identify the principle of effective demandas developed by Keynes and Kalecki as the major conceptual distinctionbetween Keynesian economics on one hand, and both neoclassical and classi-cal economics on the other. Both Keynes and Kalecki conceive capitalism as an
6 Introduction
Downloaded from Elgar Online by not authorized at 07/12/2013 03:10:36AM

open system, in which the level of economic activity Ð and its growth and fluc-tuations over time Ð are essentially indeterminate. The leading element in theanalyses of both Keynes and Kalecki is investment spending, the relativeautonomy of which is the proximate source of openness in their models ofeconomic activity.
Halevi and Taouil first describe a Marxian model of accumulation, demon-strating how its results are radically altered by the introduction of effectivedemand considerations. The latter arise from the separation of investment andsavings decisions, and the inability of increases in saving to automaticallygenerate more investment spending. In other words, investment spending isestablished as an independent variable, rather than a dependent variable(dependent, specifically, upon savings) as in the Marxian model. They thendiscuss the treatment of investment as the determinant of the level and distri-bution of income in Kalecki, and as the determinant of the level of income inKeynes. In both cases, it is shown that the level of investment spending isessentially indeterminate Ð so that while it can be stated that there exists acausal relationship between changes in investment and changes in income, thiscausal relationship is not reducible to a mechanical Ôlaw of motionÕ fromwhich the evolution of income can be deduced and predicted. More specifi-cally, fluctuations in investment cannot be reduced to foreclosed explanationin terms of supply-side variables, which would permit deterministic explana-tion of variations in demand and total income in terms of changes emanatingfrom the supply side. Instead, the long run is conceived as an inter-temporalsequence of short runs, in each of which autonomous, demand-side forces arethe essential determinants of the level of economic activity. Capitalism asviewed through the lens of the principle of effective demand is, therefore, anopen system, in which fluctuations in and the growth of output over time areindeterminate, historical processes.
Motivated by neoclassical claims that the long-run growth of output isdriven by real factors on the supply side of the economy, Sonmez Atesogluinvestigates the roles of money and autonomous expenditures (includinginvestment, government spending and exports) in determining the path of realoutput. Using quarterly data for the US economy from 1960Ð97, he first estab-lishes that real gross domestic product (GDP), investment, government spend-ing, exports and the M2 money supply are all integrated of order one. Atesogluthen shows that real output is cointegrated with investment, governmentspending, exports and the money supply, that there is bidirectional causalityamong real output, investment and the money supply and that there is unidi-rectional causality from government spending and exports to real output. Inother words, there exist long-run relationships between real output andprecisely the monetary and demand-side variables that are routinely over-looked in neoclassical growth theory. Moreover, there are feedback effects
Introduction 7
Downloaded from Elgar Online by not authorized at 07/12/2013 03:10:36AM

from real output to both investment and the money supply. These are preciselythe relationships that post-Keynesian macroeconomic analysis, with itsemphasis on the non-neutrality of money and the importance of aggregatedemand (even in the long run), would predict. Atesoglu concludes by remark-ing upon the policy implication of his results, which is that demand-manage-ment can have potent effects on real output in both the short and long run.
The second section contains chapters on various Kaldorian Models ofDemand-led Growth. KaldorÕs development of the VeblenÐMyrdal concept ofcumulative causation has inspired a subsequent generation of growth theoriststo consider the two-way or joint interaction between the growth of demandand supply, while his focus within the same analysis on the importance ofinterregional trade ultimately gave rise to contemporary BPCG theory. Thechapters in this second section reflect these different facets of contemporaryKaldorian growth analysis. Mark Setterfield and John Cornwall develop a neo-Kaldorian model of growth, which is used to explain changes in the rates ofgrowth of output and productivity in the advanced capitalist economies sincethe Second World War. The basic theoretical insight is that the parameters ofa standard Kaldorian model of cumulative causation can be treated as beinginstitutionally determined. Different parameter values, corresponding todifferent, relatively enduring Ôinstitutional regimesÕ in capitalist history, canthen be used to characterize different episodes of capitalist growth perfor-mance. Three such episodes are identified: the Golden Age (1945Ð73), the Ageof Decline (1973Ð89) and a new growth episode in the USA during the 1990s.In each case, historically specific institutions are shown to give rise to differ-ent demand and productivity regimes, whose cumulative interaction explainsdifferences in the growth performance of capitalist economies between differ-ent growth episodes.
The focus of the chapter by John McCombie and Mark Roberts is theimportance that attaches to the growth of exports in the determination ofeconomic growth, not just because of the direct contribution of increasingexport demand to demand-led growth, but because export growth provides abasis for faster expansion of domestic demand (and hence more ÔhomespunÕgrowth) without the latter resulting in balance-of-payments difficulties.13 Thisresult is, of course, encapsulated in ThirlwallÕs law, which equates the long-run rate of growth with the product of export growth and a dynamical versionof the foreign trade multiplier.
McCombie and Roberts demonstrate that financial flows Ð which havebecome an increasingly significant feature of the international environment inrecent decades Ð cannot significantly relax the BPCG rate. The claim thatBPCG theory is flawed owing to a fallacy of composition is rebutted, and thecriticism that ThirlwallÕs law is a traditional equilibrium theory of growth thatdoes not accord with KaldorÕs vision of growth as a historical process is
8 Introduction
Downloaded from Elgar Online by not authorized at 07/12/2013 03:10:36AM

addressed. As regards the latter, it is shown that by endogenizing the incomeelasticities of demand for exports and imports, the dynamics of the BPCGmodel can be made chaotic. This renders its growth outcomes path dependentin the sense of being highly sensitive to initial conditions. Finally, McCombieand Roberts survey recent empirical investigations of ThirlwallÕs law, with aparticular emphasis on the ability of this law to explain the rapid rates ofgrowth experienced in East Asia since the mid-1960s.
In a chapter that picks up from the contributions of Cornwall (1972)discussed earlier, Thomas Palley argues that an important agenda for demand-led growth theory is to model not just the rate of growth of demand, but alsothe rate of growth of supply and (crucially) the interaction between the two.14
This helps render explicit the ÔSayÕs law in reverseÕ property of demand-ledgrowth models, and also draws attention to the need for the rates of growth ofsupply and demand to be reconciled if a growth path is to be sustainable in thelong run. Palley demonstrates the importance of this latter point in the contextof a BPCG model. This model is shown to be overdetermined, giving rise totwo rates of growth (a rate of growth of demand and a rate of growth ofsupply) whose equivalence is a special case. Palley then proposes variousresolutions to this problem, based on demand- or supply-side adjustments tochanges in the rate of capacity utilization. For example, it is postulated that theincome elasticity of demand for imports may be a negative function of excesscapacity. This is because as excess capacity falls, bottlenecks in domesticindustry become more prevalent, and these supply constraints increase theproportion of incremental income that is spent on imports. As a result, the rateof growth of demand that is consistent with a given rate of growth of worldincome (as determined by ThirlwallÕs law) adjusts towards the rate of growthof demand consistent with supply growth (as determined by the rate of growthof the labour force and VerdoornÕs law).
The third section of the book, entitled Kaleckian Models of Demand-ledGrowth, builds on the KaleckiÐRobinson tradition in Cambridge growth theory,according to which the rates of accumulation and profit are determined by atwo-sided relationship between investment and profits. On one hand, invest-ment determines profits through a Keynesian income-generating mechanism.On the other, profits determine investment, both by fuelling expectations of thefuture profitability of investment, and by influencing firmsÕ access to finance.An important theme in this literature is the impact of changes in the distribu-tion of income on the rates of capacity utilization and growth, a comprehensiveaccount of which is found in the chapter by Robert Blecker. Blecker begins bydeveloping a traditional Kaleckian growth model, which is stagnationist andexhibits wage-led growth. In other words, an increase in the profit share ofincome reduces capacity utilization and the rate of growth. The remainder ofthe chapter then shows how various extensions to and modifications of this
Introduction 9
Downloaded from Elgar Online by not authorized at 07/12/2013 03:10:36AM

basic model can render other results more likely. For example, Blecker showsthat the possibilities of exhilarationism (an increase in the profit share raisesthe rate of capacity utilization) and profit-led growth (an increase in the profitshare raises the rate of growth) are enhanced by modifications to the invest-ment function which place greater emphasis on the importance of the profitshare in the determination of investment plans; allowance for savings out ofwages and the effects of taxation (both of which reduce the Ôconsumption divi-dendÕ associated with a rise in the wage share of income); and open economyeffects, which render either trade flows sensitive to changes in relative prices,or capital flows sensitive to profit rate differentials across national borders.BleckerÕs conclusion is that while capitalist economies can be either stagna-tionist or exhilarationist and exhibit either wage-led or profit-led growth inprinciple, recent changes in fiscal policy, workersÕ saving behaviour and theglobalization of trade and capital flows may have made exhilarationist and/orprofit-led growth outcomes more likely in contemporary capitalism. One wayof thinking about this result is in terms of the importance of the institutionalstructure of capitalism (including its policy norms) in determining the influ-ence of distribution on growth.
A common misconception in macroeconomics is that Keynesian econom-ics is centred on imperfections (such as wage and/or price rigidities, or expec-tational errors) that create demand-constrained outcomes in the short run,whereas in the long run, adjustments take place (in expectations orprices/wages) that automatically restore the economy to a position of supply-determined equilibrium. Tracy Mott addresses this misconception by using aKaleckian model of the short run to study the impact on macroeconomicoutcomes over time of changes in longer-run factors, such as the quantity andtype of capital used in production, and the conditions of competition betweenfirms. The point is to explore the possible evolution of an economy from aposition of short-run equilibrium when these longer-run factors are allowed tochange Ð the point being that the conventional conception of automaticconvergence towards a supply-determined equilibrium defined independentlyof demand conditions is simplistic and inaccurate. Instead, Mott uses thelonger-run forces named above to help explain historical developments intwentieth-century US capitalism in the context of a modified Steindl model ofsecular stagnation. Instead of being the temporary result of various self-correcting aberrations, then, the KeynesÐKalecki short run is revealed as beingthe point of departure for study of the forces that determine accumulation andgrowth in a capitalist economy.
The chapters by Marc Lavoie and Mario Cassetti draw attention to thepotential interplay of the conflict theory of inflation and Kaleckian growththeory. Lavoie develops a mechanism, based on the conflict theory of infla-tion, which reconciles the actual and target rates of return in a Kaleckian
10 Introduction
Downloaded from Elgar Online by not authorized at 07/12/2013 03:10:36AM

growth model.15 A standard Kaleckian growth model is first developed,exhibiting both the paradox of thrift (an increase in the propensity to savereduces the rates of profit and growth) and the paradox of costs (an increase inreal wages increases the rates of profit and growth). One problem with thismodel is that the actual and target rates of return (and hence the actual andnormal rates of capacity utilization) need not be equal in the long run. When amechanism that causes the target rate of return to adjust towards the actual rateis introduced, this problem is solved Ð but at a cost. The paradox of costsdisappears.
Lavoie then introduces the conflict theory of inflation, in which inflation isa function of inconsistencies in the income aspirations of workers and firms.He shows that when this model of inflation is combined with the standardKaleckian growth model, the latter exhibits the paradox of thrift. Moreover,when a mechanism that causes the target rate of return to adjust towards theactual rate is introduced, not only are these rates of return equalized in the longrun, but the rate of capacity utilization remains endogenous. This ensures thatthe model also exhibits the paradox of costs.
Mario Cassetti further develops this marriage of conflict inflation andKaleckian growth theories by considering a two-way interaction between therates of capacity utilization and growth on one hand, and the distribution ofincome on the other. This is done by first integrating a conflict inflation modelinto a Kaleckian growth model, as in the previous chapter. In the resultingmodel, changes in distribution can affect capacity utilization and growth, as inthe standard Kaleckian model. But these changes in capacity utilization andgrowth are then allowed to have feedback effects on the dynamics of wage-and price-setting behaviour and hence the distribution of income, operating viatheir influence on the bargaining power of workers and firms.
Cassetti shows that either a positive or negative relationship between capac-ity utilization and the profit share can emerge, depending on whether increasesin the utilization rate enhance the bargaining power of firms relative to that ofworkers, or vice versa. As a result, a variety of equilibrium positions canemerge, which differ according to the profit shares of income and the rates ofgrowth and capacity utilization associated with them, depending on (amongother things) whether it is the relative bargaining power of firms or workers thatis enhanced by increases in the rate of capacity utilization. An extension of themodel to an open economy setting reveals that the equilibrium rate of capacityutilization in a closed economy may not be sustainable in an international envi-ronment, if the resulting rate of inflation exceeds that of the rest of the world.Ruling out the possibility of continuous exchange rate depreciation, the econ-omy is confronted with two choices: deflate, or use an incomes policy to recon-cile the competing income claims of workers and firms with the constraintimposed by external inflation. Once again, the analysis recalls the potential
Introduction 11
Downloaded from Elgar Online by not authorized at 07/12/2013 03:10:36AM
importance of the institutional environment in conditioning the outcomes ofgrowth dynamics.
According to Kriesler (1999, p. 401) Ôthe traverse is at the same time oneof the most important concepts in economic theory, and also one of the mostneglectedÕ. Mark Setterfield takes up this theme in the section on TraverseAnalysis and Demand-led Growth, arguing that, despite being one of fewHicksian concepts to have languished in obscurity, the principle of the traverseis suggestive of a general method suitable for all macrodynamic analysis. Heapplies this idea to Kaldorian growth theory, reinterpreting KaldorÕs cumula-tive growth schema as a traverse towards a steady state. The conditions andhence position of the latter are, however, shown to be sensitive to the traversepath itself. What emerges is a model of long-run growth that nests medium-term episodes of cumulative causation within growth ÔregimesÕ, the structureof which is endogenous to the economyÕs past growth performance. The wayin which this endogeneity Ð and hence the economyÕs path dependence Ð ismodelled involves systemic openness and novelty, giving rise to what isdescribed as evolutionary hysteresis. Ultimately, the model both extendsKaldorian growth analysis by allowing for endogenous changes in relativegrowth rates, and suggests an analytical framework that, because of its faith-fulness to KaldorÕs emphasis on historical process, may be conducive to thefurther development of Kaldorian growth theory.
Each of the chapters in the final section on Structural Change and Demand-led Growth draws attention to the fact that growth involves not just the expan-sion of demand and productive capacity in the aggregate, but also changes inwhat is produced, how it is produced and for whom. These changes in thecomposition or structure of economic activity are, at once, influences on andinfluenced by the rate of growth in the aggregate, with which most growthanalysis is, of course, solely preoccupied. George Argyrous notes that,although demand is a lead element in the growth process according to someeconomists, little attention has been devoted to theorizing the historical evolu-tion of aggregate demand itself. Transformational growth theory, however,provides just such a historically based account of the evolution of demand, andthe primary purpose of ArgyrousÕs chapter is to outline this account.
Three key processes are identified as having been instrumental in the emer-gence and subsequent growth and development of mass markets in contempo-rary capitalism: the initial creation of a wage-labour (and hencenon-self-sufficient) class; the productivity-enhancing (and therefore cost- andprice-reducing) effects of industrial mass production; and changes in thecomposition of demand as personal incomes have grown. These developmentsin the market for consumer goods are then shown to stimulate the growth ofdemand for investment goods, as production itself is transformed in responseto the transformational growth of consumer demand. This, in turn, further
12 Introduction
Downloaded from Elgar Online by not authorized at 07/12/2013 03:10:36AM

enhances the development of the mass market for consumer goods, the resultbeing a cumulatively self-reinforcing process of growth in the demand forconsumer and investment goods. Argyrous notes, however, that althoughindustrial production and mass consumer markets have been subject to a virtu-ous circle of self-reinforcing growth in the past, their further growth anddevelopment is not inevitable. Instead, endogenously generated obstacles togrowth Ð such as short-run limits to production in the capital goods sector,distributional effects or the increasing tertiarisation of the economy Ð mayultimately inhibit the growth process.
The chapter by Edward Nell returns to ArgyrousÕs theme that theorizing thegrowth of demand is an important but underdeveloped pursuit in economics.Despite the fact that firms require an expansion of demand if they are to real-ize profits from the production of additional goods and services, most long-runmacroeconomic theory simply assumes that demand responds passively tosupply, so that the expansion of the latter is all that is of interest to growththeorists. Meanwhile, Nell argues that even theories that purport to takedemand seriously in the long run Ð such as the HarrodÐDomar and Cambridgegrowth models Ð are deficient in their treatment of demand.
Based on a critique of LancasterÕs (1966) ÔcharacteristicsÕ theory ofconsumption, Nell develops a theory of the transformational growth ofdemand in which social pressures result in a demand for self-improvementwhich is, in turn, associated with both the growth of productivity andconsumer demand. Particular attention is paid to the relationship between self-improvement and the emergence of new markets (especially for services suchas education and communications), which is identified as the sine qua non ofsustained growth. A model of this process is used to shed light on the incen-tive to introduce new technology that is labour saving but capital using Ð atendency that has been an enduring feature of capitalist economies.Furthermore, education and communications are identified as collectivegoods Ð goods that are not consumed individually (like ice-creams orsweaters) but by networks of users, thus creating interdependencies betweenconsumers. Nell argues that the need to coordinate consumers of collectivegoods and to capture the network externalities associated with them enhancesthe role of the state, so that as an economy develops and the importance ofcollective goods increases, there is a tendency for government spending toincrease as a proportion of total income. This expansion of the governmentsector further contributes to the expansion of markets set in motion by thequest for self-improvement, thus itself contributing to the processes by whichgrowth in developed economies is sustained.
The interplay between patterns of consumer demand, productivity and theimportance of networked activities brought to light in NellÕs chapter providesthe central focus of the final chapter in this volume, by Pascal Petit and Luc
Introduction 13
Downloaded from Elgar Online by not authorized at 07/12/2013 03:10:36AM

Soete. Petit and Soete begin by identifying three stylized facts associated withthe current growth episode in capitalist economies Ð an increase in incomeinequality, skill-biased technological change in the workplace and polarizationin the consumption of quality improvements in consumer goods Ð positing thatthese stylized facts are causally linked in a self-reinforcing process of cumu-lative causation. It is recognized that transitions between growth episodes arelengthy, so that the trends described above may be transitory effects of theslow diffusion of new information and communication technologies (ICTs)embodied in producer and consumer goods. But Petit and Soete argue that thepotential exists for these trends to interact cumulatively and thereby influencelong-run growth outcomes. In this scenario, a group of sophisticatedconsumers use their high incomes, human capital and access to intermediationservices to create markets for Ôhigh-techÕ, high-value-added output, in theproduction of which their skills and abilities to use intermediation services arealso essential. Their consumption and production activities are thus mutuallyself-reinforcing Ð as are those of a group of less sophisticated, lower-incomeconsumer/workers, who are simultaneously engaged in less technologicallyintensive and less remunerative production and consumption activities. Thisthreatens to create a segmented or dualistic society that is less socially cohe-sive than the more economically unified Fordist growth regime, associatedwith the postwar (1945Ð73) Golden Age of capitalist growth. Moreover, thesegmentation or dualism in patterns of consumption and production, by limit-ing the diffusion of and positive externalities associated with ICTs on both thedemand and supply sides, threatens to inhibit the growth-enhancing potentialof current technological change. Petit and Soete end with a review of thedebates on skill-biased technological change and the mismeasurement of theconsumer price index, designed to highlight some of the most significantconnections between technology, learning and patterns of production andconsumption.
NOTES
1. See also Chapters 2 and 3.2. These issues are taken up in Chapter 7.3. See McCombie and Thirlwall (1994) and Chapters 5Ð7 and 12 for further discussion of these
various strands of Kaldorian growth theory.4. Chapters 8Ð11 are illustrative of these developments.5. See also Pasinetti (1981) and Petit (1986) for discussions of the importance for growth of
economic structure, and Cornwall and Cornwall (1994) for a more recent exposition of theideas described above.
6. Chapters 13Ð15 discuss the relationship between demand-led growth and economic struc-ture, including the structure of demand itself.
7. In fairness, it should be noted that some neoclassical analyses do entertain the possibilitythat short-run variations in aggregate demand can affect the economyÕs potential output path
14 Introduction
Downloaded from Elgar Online by not authorized at 07/12/2013 03:10:36AM

and hence long-run rate of growth (see, for example, Blackburn 1999). But this hypothesisis strictly peripheral to the core of neoclassical growth theory, which claims that long-rungrowth is determined by factors on the supply side of the economy. There is certainly notruth to the suggestion that aggregate demand is viewed as a necessary constituent of growthanalysis in neoclassical theory. This is, however, precisely the view held by advocates ofdemand-led growth theory.
8. It may be objected that, by defining the economyÕs potential output at any point in time, theconditions of supply define a ÔceilingÕ below which the actual output path described abovemust lie. But this ceiling concept merely serves to draw attention to the general importanceof effective demand failures in demand-led growth theory, as a result of which the economyis normally expected to suffer a shortage of demand relative to potential supply. Moreover,the potential output path of the economy is not independent of its actual output path, as willbecome clear below.
9. See, for example, the chapters by Setterfield and Cornwall, Blecker, Mott, Lavoie andCassetti.
10. See the chapter by Blecker in this volume for a survey of different investment functionsembodying this principle.
11. Chapters 2, 5, 7 and 12 all make use of KaldorÕs notion of endogenous technical progress.See also McCombie and Thirlwall (1994, p. 464) for a demonstration of the relationshipbetween KaldorÕs technical progress function and the Verdoorn law.
12. See Boyer and Petit (1991) and Setterfield (1997b, pp. 48Ð50) for further discussion of thesources of demand-led technical change.
13. McCombie and RobertÕs chapter is based on their ÔDemand and economic growth from aKaldorian perspectiveÕ, Review of Political Economy, 15, forthcoming(http://www.tandf.co.uk).
14. PalleyÕs chapter is reprinted from the Review of Political Economy, 15, forthcoming(http://www.tandf.co.uk).
15. LavoieÕs chapter is based on his ÔKaleckian effective demand and Sraffian normal prices:towards a reconciliationÕ, Review of Political Economy, 15, forthcoming(http://www.tandf.co.uk).
REFERENCES
Asimakopulous, A. (1975) ÔA Kaleckian theory of income distributionÕ, CanadianJournal of Economics, 8, 313Ð33.
Blackburn, K. (1999) ÔCan stabilisation policy reduce long-run growth?Õ EconomicJournal, 109, 67Ð77.
Boyer, R. and P. Petit (1991) ÔKaldorÕs growth theories: past, present and prospects forthe futureÕ, in E.J. Nell and W. Semmeler (eds) Nicholas Kaldor and MainstreamEconomics, New York, St. MartinÕs Press, 485Ð517.
Brouwer, E. and A. Kleinknecht (1999) ÔKeynes-plus? Effective demand and changesin firm-level R&D: an empirical noteÕ, Cambridge Journal of Economics, 23,385Ð99 .
Chick, V. and M. Caserta (1997) ÔProvisional equilibrium in macroeconomic theoryÕ,in P. Arestis, G. Palma and M. Sawyer (eds) Markets, Unemployment and EconomicPolicy: Essays in Honour of Geoff Harcourt, Vol. II, London, Routledgepp. 223Ð47.
Cornwall, J. (1972) Growth and Stability in a Mature Economy, London, MartinRobertson.
Cornwall. J. (1977) Modern Capitalism: Its Growth and Transformation, London,Martin Robertson.
Introduction 15
Downloaded from Elgar Online by not authorized at 07/12/2013 03:10:36AM

Cornwall, J. and W. Cornwall (1994) ÔGrowth theory and economic structureÕ,Economica, 61, 237Ð51.
Dixon, R. and A.P. Thirlwall (1975) ÔA model of regional growth rate differences alongKaldorian linesÕ, Oxford Economic Papers, 27, 201Ð14.
Harris, D. (1974) ÔThe price policy of firms, the level of employment and distributionof income in the short runÕ, Australian Economic Papers, 13, 144Ð51.
Kaldor, N. (1957) ÔA model of economic growthÕ, Economic Journal, 67, 591Ð624.Kaldor, N. (1970) ÕThe case for regional policiesÕ, Scottish Journal of Political
Economy, 18, 337Ð48.Kaldor, N. (1972) ÔThe irrelevance of equilibrium economicsÕ, The Economic Journal,
82, 1237Ð55.Kaldor, N. (1981) ÔThe role of increasing returns, technical progress and cumulative
causation in the theory of international trade and growthÕ, �conomie Appliqu�e, 34,593Ð617.
Kaldor, N. (1985) Economics Without Equilibrium, Cardiff, University College CardiffPress.
Kalecki, M. (1971) ÔTrend and the business cycleÕ, in Selected Essays on the Dynamicsof a Capitalist Economy, 1933Ð1970, Cambridge, Cambridge University Press.
Kriesler, P. (1999) ÔHarcourt, Hicks and Lowe: incompatible bedfellows?Õ in C.Sardoni and P. Kriesler (eds) Themes in Political Economy: Essays in Honour ofGeoff Harcourt, London, Routledge, pp. 400Ð417.
Lancaster, K. (1966) ÔA new approach to consumer theoryÕ, Journal of PoliticalEconomy, 74, 132Ð57.
Lucas, R.E. (1988) ÔOn the mechanics of economic developmentÕ, Journal of MonetaryEconomics, 22, 3Ð42.
McCombie, J.S.L. and A.P. Thirlwall (1994) Economic Growth and the Balance ofPayments Constraint, London, Macmillan.
Nell, E.J. (1992) Transformational Growth and Effective Demand, London, Macmillan.Pasinetti, L. (1981) Structural Change and Economic Growth: A Theoretical Essay on
the Dynamics of the Wealth of Nations, Cambridge, Cambridge University Press.Petit, P. (1986) Slow Growth and the Service Economy, New York, St. MartinÕs Press.Robinson, J. (1956) The Accumulation of Capital, London, Macmillan.Romer, P. (1986) ÔIncreasing returns and long-run growthÕ, Journal of Political
Economy, 94, 1002Ð37.Rowthorn, R.E. (1982) ÔDemand, real wages and economic growthÕ, Studi Economici,
18, 3Ð53.Schmookler, J. (1966) Innovation and Economic Growth, Cambridge, MA, Harvard
University Press.Setterfield, M. (1997a) ÔShould economists dispense with the notion of equilibrium?Õ
Journal of Post Keynesian Economics, 20, 47Ð76.Setterfield, M. (1997b) Rapid Growth and Relative Decline: Modelling
Macroeconomic Dynamics with Hysteresis, London, Macmillan.Solow, R. (1956) ÔA contribution to the theory of economic growthÕ, Quarterly Journal
of Economics, 70, 65Ð94.Thirlwall, A.P. (1979) ÔThe balance of payments constraint as an explanation of inter-
national growth rate differencesÕ, Banca Nazionale Del Lavoro Quarterly Review,128, 45Ð53.
16 Introduction
Downloaded from Elgar Online by not authorized at 07/12/2013 03:10:36AM
2. Keynesian macroeconomics and the theory of economic growth: putting aggregate demand back in the picture
Thomas I. Palley
INTRODUCTION
Keynesian macroeconomics, which dominated the economics profession fromWorld War II through to the mid-1970s, emphasized the significance of thelevel of aggregate demand for the determination of the level of economicactivity. Yet, when it came to constructing a theory of growth, the effect ofaggregate demand was visibly absent. This absence created a significant inter-nal inconsistency that likely contributed to the decline of the Keynesian para-digm. In stark contrast, new classical macroeconomics, which came tosupersede Keynesian macroeconomics as the dominant paradigm in the mid-1970s, was consistent with growth theory. This consistency promoted its rise.
Over the last decade, there has emerged a new ÔendogenousÕ growth theorythat breaks with the earlier ÔoldÕ growth theory by making the steady-stategrowth rate endogenous to the system. This chapter uses a simple analyticalframework predicated on the familiar distinction between potential and actualoutput to frame the relation between growth theory and macroeconomics. Theframework is then used to explore the relation between growth theory, newclassical macroeconomics, neo-Keynesian macroeconomics and Keynesianmacroeconomics. Whereas old growth theory was deeply inconsistent withKeynesian macroeconomics and its emphasis on aggregate demand, newendogenous growth theory is not. Growth theory can therefore now berendered consistent with Keynesian macroeconomics. This is a significantadvance in the reconstruction of a consistent Keynesian paradigm.
OLD GROWTH THEORY
The Solow (1956) neoclassical growth model represents the paradigmaticmodel of old growth theory. The most important feature of the model is that
19
Downloaded from Elgar Online by University of Melbourne at 07/12/2013 03:12:13AM

the steady-state growth rate depends exclusively on the rates of populationgrowth and labour augmenting technical technical progress, and as long asthese variables are exogenous, steady-state growth is also exogenous.
Figure 2.1 illustrates the path of potential gross domestic product(PGDP) as described by the Solow growth model.1 The vertical axis plotsthe natural logarithm of output, while the horizontal axis plots time. Theslope of the PGDP line represents the rate of growth of potential output, andis given by:
gy = n + a [2.1]
where gy is the rate of growth of output, n is the rate of population growth anda is the rate of labour-augmenting technical progress. Within this model, thelevel of potential output can be raised by increasing the rate of capital accu-mulation (that is, the savings rate), but the steady-state rate of output growthremains unchanged. This is illustrated in Figure 2.1 by the shifting-up of thePGDP line at time t0. The increase in the capital stock per worker, caused by
20 Fundamental issues in the theory of demand-led growth
Figure 2.1 The evolution of potential output, and the effect of an increasein the capitalÐlabour ratio in the Solow growth model
In (Output)
Time
PGDP
t0
n + a
Downloaded from Elgar Online by University of Melbourne at 07/12/2013 03:12:13AM

increased saving, increases the level of PGDP. However, the growth rate,which is given by the slope of the PGDP line, remains unchanged.
The effect of a change in the trend rate of growth is illustrated in Figure 2.2,in which the PGDP line is kinked at time t0. In this instance, the trend rate ofgrowth is shown as falling, since the slope of the PGDP line falls. This is howthe Solow model would represent the productivity growth slowdown whichafflicted the USA in the 25-year period after 1973. The slowdown is seen asthe product of an exogenous decrease in the rate of labour-augmenting techni-cal progress. Those who argue that the USA has become characterized by aÔnew economyÕ in the 1990s would argue that the productivity growth slow-down has reversed itself, and the slope of the PGDP line has steepened andreverted to its earlier slope.
The rate of potential output growth can also be made to exhibit variabilityby adding a random error term to equation [2.1], which becomes:
gyt = n + a + et [2.1¢]
Keynesian macroeconomics/theory of economic growth 21
In (Output)
Time
PGDP
t0
n + a
Figure 2.2 The effect on the evolution of potential output of an exogenouschange in the rate of labour augmenting technical progress
Downloaded from Elgar Online by University of Melbourne at 07/12/2013 03:12:13AM

where et represents white noise. The expected rate of potential output growthis exogenous, given by:
Et[gy] = n + a [2.2]
In terms of Figure 2.1, the PGDP line now represents the expected PGDP line,and its slope is the expected rate of potential output growth. Actual potentialGDP randomly fluctuates around the expected PGDP line.
The Solow growth model embodies the core features of the neoclassicalparadigm. However, it lacks any concern with monetary factors, and the realinterest rate is determined exclusively by real factors, being equal to themarginal product of capital. Tobin (1965) expanded the scope of the model byincorporating money and portfolio considerations. The motivation behind thisstep was to show how the inclusion of money and portfolio choices affectedthe steady-state interest rate and capitalÐlabour ratio. In making this change,Tobin incorporated the Keynesian liquidity preference theory of interest ratesinto neoclassical growth theory, thereby making Keynesian monetary theoryrelevant for long-run economics.2
However, though incorporating monetary factors, TobinÕs amendments tothe Solow model do not endogenize steady-state growth, and nor do theychange the exclusively supply-determined nature of growth. Thus, in the Tobinmodel, growth is still determined by the exogenously given rates of populationgrowth and technical progress, and the growth path (potential and actual)remains as in Figure 2.1. Increases in the rate of nominal money supply growthhave an affect akin to an increase in the saving rate in the Solow model. Theytherefore cause the PGDP line to shift up, but do not alter its slope. The logicis that faster money supply growth causes higher steady-state inflation, and thiscauses a portfolio shift away from money holdings towards holdings of realcapital, thereby raising the steady-state capitalÐlabour ratio and raising PGDP.
Moreover, as in the Solow model, capital accumulation continues to bedriven by household savings behaviour rather than firmsÕ investment spend-ing, so that saving drives investment. In these regards, TobinÕs monetarygrowth model remains similar to the Solow model, and both models areseverely non-Keynesian, owing to their neglect of demand-side influences ongrowth.
OLD GROWTH THEORY AND NEW CLASSICALMACROECONOMICS
The analytical framework above can be used to illustrate the relationshipbetween short-run macroeconomics and growth theory. Neoclassical growth
22 Fundamental issues in the theory of demand-led growth
Downloaded from Elgar Online by University of Melbourne at 07/12/2013 03:12:13AM
theory is fully consistent with new classical equilibrium business cyclemodels, such as those developed by Lucas (1975) and Long and Plosser(1983). In both cases, actual output (AGDP) fluctuates around the PGDP lineas shown in Figure 2.3. In the Lucas (1975) model, these fluctuations are dueto monetary surprises, and the speed of return of AGDP to PGDP depends onthe degree of persistence of the shocks. Such persistence derives from capitalstock effects. Positive monetary surprises induce overinvestment, which thenkeeps AGDP above PGDP until the excess capital has been depreciated away.The reverse holds for negative monetary surprises. The size of AGDP fluctu-ations around PGDP depends on the size of monetary surprises. The noisiermonetary policy is, the noisier the path of AGDP around PGDP. Figure 2.3also captures Long and PlosserÕs (1983) real business cycle model, only nowthe fluctuations in AGDP are due to temporary technology shocks that impactthe aggregate production function.
The underlying consistency between new classical macroeconomics andneoclassical growth theory derives from the fact that both adopt a competitiveequilibrium approach to economics. Growth in the Solow model takes place
Keynesian macroeconomics/theory of economic growth 23
In (Output)
Time
PGDP
n + a
AGDP
Figure 2.3 The relationship between potential and actual output
Downloaded from Elgar Online by University of Melbourne at 07/12/2013 03:12:13AM

along a full employment path, factor markets clear and factors are paid theirmarginal products. The same considerations apply to new classical macroeco-nomics, only now there is room for temporary departures from equilibriumowing either to monetary surprises which confound expectations, or to tech-nology shocks that work their way through the system gradually, owing toconvex costs of adjustments.
OLD GROWTH THEORY AND KEYNESIAN MACROECONOMICS
Whereas the theoretical relationship between new classical macroeconomicsand old growth theory is clear, the relationship between old growth theory andKeynesian macroeconomics is less so. Here, there is a need to distinguishbetween ÔfundamentalistÕ Keynesian macroeconomics and neo-Keynesianmacroeconomics. Whereas the latter is consistent with old growth theory, theformer is not.
From a neo-Keynesian perspective, the PGDP line in Figure 2.3 representspotential output, and its slope corresponds to the natural rate of output growth.The PGDP line describes the long-run evolution of output, and is constructedon the basis of the neoclassical growth model. The evolution of output contin-ues to be represented by AGDP, which wanders around PGDP, but now thelevel of AGDP is determined according to the principles of neo-Keynesianmacroeconomics as reflected in models such as the ISÐLM framework. Thus,negative shocks to the level of aggregate demand decrease the level of AGDP,with the gap between PGDP and AGDP corresponding to the ÔOkun gapÕ.
What is the relationship between AGDP and PGDP? Neo-Keynesianmacroeconomics interprets the path of AGDP in terms of a disequilibriumprocess. This interpretation dates back to ModiglianiÕs (1944) extension of theISÐLM model to include a labour market, in which nominal wage rigidityblocks off the Keynes and Pigou effects, thereby preventing an instantaneousreturn to full employment. This disequilibrium approach was rigorouslyformalized in the general disequilibrium literature associated with Clower(1965), Barro and Grossman (1971) and Malinvaud (1977). According to theneo-Keynesian disequilibrium perspective, frictions in the process of price andnominal wage adjustment mean that economies can temporarily get stuckbelow potential output. However, over time, prices and nominal wages areflexible, and this allows AGDP to gradually drift back to PGDP.
Within the neo-Keynesian framework, the PGDP line therefore represents acentre of gravitation and actual output eventually converges back to potential.The role of monetary and fiscal stabilization policy is to stabilize the path ofactual output around potential output by minimizing fluctuations in aggregate
24 Fundamental issues in the theory of demand-led growth
Downloaded from Elgar Online by University of Melbourne at 07/12/2013 03:12:13AM

demand. If actual output is subject to a large negative demand shock, mone-tary and fiscal policy can speed up the process of adjustment.
New Keynesian macroeconomics elaborates on this interpretation, andseeks to provide a microeconomic justification for the neo-Keynesian assump-tion of downward stickiness of prices and nominal wages. Mankiw (1985)explains such stickiness in terms of menu costs. An alternative explanationrelies on the kinked nature of firmsÕ demand curves, and emphasizes informa-tional and strategic considerations that provide firms with an incentive not tochange prices (Woglom, 1982).3
Another question concerns whether recessions have permanent effects oneither the level or growth of potential output. Within the neo-Keynesian frame-work, the answer is no. Recessions (large Okun gaps) are characterized byreductions in the level of investment spending, and this lowers the rate ofgrowth of the capital stock. If the reduction in investment spending werepermanent, the economy would shift to an output trajectory with a lower equi-librium capitalÐlabour ratio. However, once it had reached the new equilib-rium, output would continue to grow at the exogenously given natural rate.This follows from the logic of the Solow growth model.
The microeconomics of marginal productivity theory, which underpin boththe neo-classical growth model and the neo-Keynesian macro model, alsodictate that there is a unique capitalÐlabour ratio that is jointly determined bythe rate of time preference and the natural rate of growth (Sidrauski, 1967).Thus, investment spending must ultimately recover all the ground lost in therecession, such that the steady-state equilibrium interest rate is:
r = fk Ð d = n + a + s [2.3]
where r denotes the real interest rate, fk is the marginal product of capital, d isthe rate of depreciation and s the rate of time preference. This means that thesteady-state capitalÐlabour ratio and the level of potential output are bothunchanged by recessions.
In sum, within the neo-Keynesian construction of the macro-growth bridge,the effects of recessions are temporary. Though recessions are costly, in thatthey cause a ÔflowÕ loss of output that is never recovered, they leave behind nopermanent mark in the form of a permanently lower capital stock per worker,a permanently lower potential output per worker or a permanently changedrate of potential output growth.
Whereas neo-Keynesian economics can be rendered consistent with oldgrowth theory, the same is not true of fundamentalist Keynesian macroeco-nomics. Keynes (1936) argued that economies can get stuck at equilibria withless than full employment because of a persistent shortage of aggregatedemand. A fundamentalist Keynesian perspective therefore has economies
Keynesian macroeconomics/theory of economic growth 25
Downloaded from Elgar Online by University of Melbourne at 07/12/2013 03:12:13AM

characterized by a continuum of possible Ôdemand-determinedÕ equilibria.This contrasts with the neoclassical Ôsupply-constrainedÕ conception of equi-librium, according to which there exists a unique full employment level ofoutput that is determined by constraints on the supply side of the economy.4
The important implication is that from a fundamentalist Keynesian perspec-tive, the AGDP line in Figure 2.3 itself represents an equilibrium outcome, andthe PGDP line is not a centre of gravity.
Fundamentalist Keynesian macroeconomics also challenges the sticky-price construction of macroeconomics, on the grounds that price adjustmentsmay be destabilizing. One line of argument emphasizes the Fisher (1933) debteffect. The logic of this effect is that if debtors have a higher marginal propen-sity to consume than creditors do, reductions in the price level can reduceaggregate demand owing to the existence of inside debt. This is because lowerprices raise the burden of debt, and make creditors wealthier at the expense ofdebtors. Consequently, the resultant decrease in spending by debtors exceedsthe increase in spending by creditors. A second line of argument is the Mundell(1963)ÐTobin (1965) effect, whereby price deflation makes monetary assetsrelatively more attractive. This promotes a portfolio shift into money whichraises real interest rates, thereby reducing investment spending and aggregatedemand. These arguments challenge the claim that price adjustment canrestore full employment.
From a growth theoretic perspective, this fundamentalist Keynesiancritique raises a number of issues. First, if points on the AGDP line can bepoints of steady-state equilibrium, what determines the steady-state growthrate (that is, the slope of the AGDP line)? Second, the possibility that theAGDP growth rate may differ from the PGDP growth rate implies that thescale of the Okun gap (the amount of excess capacity) may matter for thegrowth rate. Keynes, of course, had nothing to say about these issues in TheGeneral Theory, which was a tract on the determination of the level of outputrather than the rate of growth.
NEW ENDOGENOUS GROWTH THEORY
Whereas the steady-state rate of growth is exogenously determined in the ÔoldÕSolow growth model, new endogenous growth theory introduces a range ofmechanisms that render steady-state growth subject to endogenous variation.These mechanisms involve respecifying the process generating technicalchange so as to allow it to depend on the decisions of economic agents.
Within endogenous growth models the rate of growth is given by:
gy = n + a(x) a¢ > 0 [2.4]
26 Fundamental issues in the theory of demand-led growth
Downloaded from Elgar Online by University of Melbourne at 07/12/2013 03:12:13AM

where x is a vector of choice variables positively affecting the rate of labour-augmenting technical progress. The endogenous growth approach is illustratedin Figure 2.4, in which the line denoted PDGP0 corresponds to x = x0, and theline PGDP1 corresponds to x = x1. There are now a continuum of possiblegrowth paths, each of which is contingent on the particular selection of x.
Within the USA, endogenous growth theory has emphasized knowledgeand human capital formation, and the steady-state rate of growth is thereforeaffected by choices, policies and institutions affecting knowledge and humancapital acquisition. Endogenous growth emerges when the aggregate stock ofhuman capital is allowed to have an external effect on the rate of technicalchange, as in Romer (1990). Human capital is therefore identified as the ÔxÕvariable.
The British variant of endogenous growth emphasizes investment inphysical capital. Drawing on a line of reasoning pioneered by Kaldor (1957)and Kaldor and Mirrlees (1961/2), Scott (1989) suggests that endogenousgrowth operates through the effects of investment spending on the flow rate
Keynesian macroeconomics/theory of economic growth 27
In (Output)
Time
PGDP1
PGDP0
Figure 2.4 Alternative paths of potential output in an endogenous growthmodel
Downloaded from Elgar Online by University of Melbourne at 07/12/2013 03:12:13AM

of technological innovation.5 Technical progress is therefore both ÔrevealedÕand ÔrealizedÕ through investment, so that investment serves simultaneously asthe means of expanding the capital stock, feeding technical innovations intothe production process and uncovering further possibilities for innovation.Expanding the capital stock is the traditional Ôold growthÕ interpretation ofinvestment. Feeding innovations into the capital stock is the ÔvintageÕapproach to investment. Uncovering new possibilities for further technicaladvances is the endogenous growth interpretation of investment.
The notion of endogenous growth can be captured through the followingspecification of the technical progress function (Palley, 1996b):
a = AkbIc A > 0 [2.5]
Equation [2.5] determines the rate of labour-augmenting technical progress,which is a positive function of the capitalÐlabour ratio and the level of invest-ment spending per worker. Nested within [2.5] is the standard case of exoge-nous technical progress, which occurs if b = c = 0. If b = 0, then only the ÔflowÕof investment spending per worker affects the rate of technical advance. Ifc = 0, only the current ÔstockÕ of capital per worker has an effect.6
Equation [2.5] is a reduced form specification. The microeconomics of whyinvestment spending affects the rate of technical advance are detailed in Scott(1989). From a policy standpoint, the important implication is that the rate oftechnical progress can be influenced by policies that affect either the capitalstock per worker, or the flow of investment per worker.
Exactly the same considerations apply for representative agent, choicetheoretic endogenous growth models that rely on knowledge and R&D expen-ditures (for example, Romer, 1990). In these models, research and develop-ment (R&D) spending affects the growth rate, and policies or institutionalarrangements that affect R&D spending therefore affect the equilibriumgrowth rate. Such models implicitly embody a Kaldorian technical progressfunction in which the symbols k and I are replaced by the stock and flow ofR&D. This reveals Kaldor (1957) to be the progenitor of endogenous growththeory.
Equation [2.5] also sheds light on the issues of cumulative causation andthe cross-country convergence of growth rates. If the rate of technicalprogress is positively affected by the capital stock and the level of investmentspending per worker, then countries with larger capital stocks and greaterinvestment spending per worker will have faster growth rates. Both channelspromote cumulative causation, since the flow of investment spending tends tobe positively related to the capital stock. Accumulation of capital thereforeaccelerates the growth process, and this explains why capital-abundant coun-tries have had historically rising growth rates. It can also help explain why
28 Fundamental issues in the theory of demand-led growth
Downloaded from Elgar Online by University of Melbourne at 07/12/2013 03:12:13AM

cross-country growth rates have diverged, with the gap between capital-abun-dant and capital-scarce countries growing over time.
The divergence in growth rates between capital-abundant (developed) andcapital-scarce (undeveloped) countries would be further compounded if thereare positive externalities in firmsÕ production functions. This could occur if theproductivity of firmsÕ private capital stocks is positively impacted by theaggregate capital stock. The effect would be to promote de-industrialization incapital-scarce countries, as firms would have an incentive to locate in capital-abundant countries where the private marginal product of capital is higherowing to the positive externality. In this fashion, the technological progressfunction in [2.5] can help explain a range of puzzles regarding the pattern ofcross-country growth and development.
MACROECONOMIC IMPLICATIONS OF ENDOGENOUSGROWTH THEORY
Rendering the rate of labour-augmenting technical progress endogenousmakes the rate of potential output growth endogenous. This is a developmentthat can be readily incorporated into old neoclassical growth models (Palley,1996b). In the earlier old growth models (Tobin, 1965), monetary and fiscalpolicies could be used to affect the flow of investment spending and thesteady-state capitalÐlabour ratio, but the steady-state growth rate was unaf-fected. Now, these same instruments also affect the growth rate.
New Classical Macroeconomics and New Growth Theory
New classical macroeconomics was always consistent with old growth theory,and it is also consistent with new endogenous growth theory. The latter contin-ues to use a competitive equilibrium framework to determine the steady-stategrowth path, and new classical macroeconomics shares this approach. Thus, aLucas (1975) monetary surprise mechanism can be included by making thelevel of investment spending a positive function of the gap between the actualand expected money supply. This would then generate a monetary surprisebusiness cycle, in which AGDP fluctuates around the endogenously deter-mined path of PGDP. Similarly, real business cycle effects can be introducedby having temporary technology shocks that impact the production function.The only difference from the earlier synthesis between old growth theory andnew classical macroeconomics is that business cycle fluctuations will nowtake place around the particular growth path that the economy is locked intoas a result of choice of the vector of factors (x) affecting the growth rate.
The new growth framework also introduces a distinction between short-run
Keynesian macroeconomics/theory of economic growth 29
Downloaded from Elgar Online by University of Melbourne at 07/12/2013 03:12:13AM
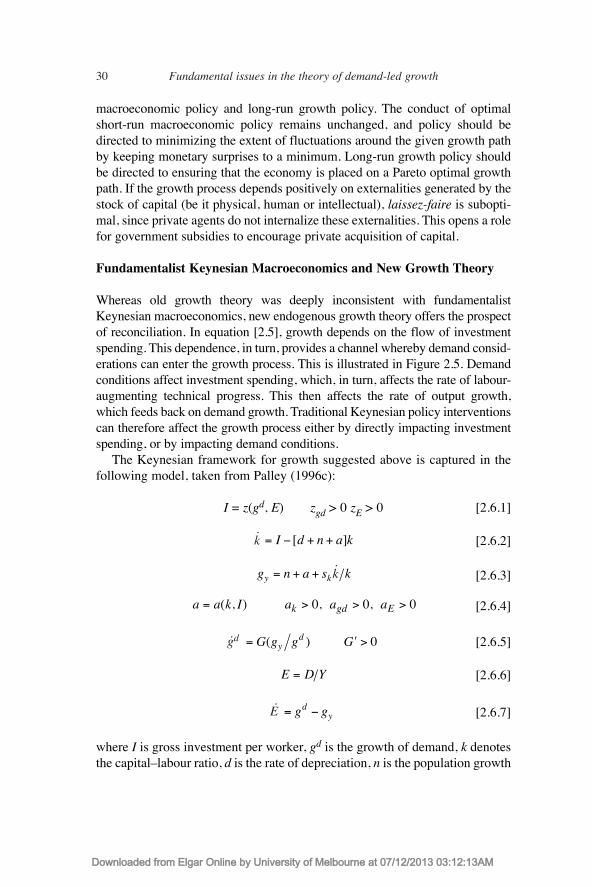
macroeconomic policy and long-run growth policy. The conduct of optimalshort-run macroeconomic policy remains unchanged, and policy should bedirected to minimizing the extent of fluctuations around the given growth pathby keeping monetary surprises to a minimum. Long-run growth policy shouldbe directed to ensuring that the economy is placed on a Pareto optimal growthpath. If the growth process depends positively on externalities generated by thestock of capital (be it physical, human or intellectual), laissez-faire is subopti-mal, since private agents do not internalize these externalities. This opens a rolefor government subsidies to encourage private acquisition of capital.
Fundamentalist Keynesian Macroeconomics and New Growth Theory
Whereas old growth theory was deeply inconsistent with fundamentalistKeynesian macroeconomics, new endogenous growth theory offers the prospectof reconciliation. In equation [2.5], growth depends on the flow of investmentspending. This dependence, in turn, provides a channel whereby demand consid-erations can enter the growth process. This is illustrated in Figure 2.5. Demandconditions affect investment spending, which, in turn, affects the rate of labour-augmenting technical progress. This then affects the rate of output growth,which feeds back on demand growth. Traditional Keynesian policy interventionscan therefore affect the growth process either by directly impacting investmentspending, or by impacting demand conditions.
The Keynesian framework for growth suggested above is captured in thefollowing model, taken from Palley (1996c):
I = z(gd, E) zgd > 0 zE > 0 [2.6.1]
[2.6.2]
[2.6.3]
[2.6.4]
[2.6.5]
[2.6.6]
[2.6.7]
where I is gross investment per worker, gd is the growth of demand, k denotesthe capitalÐlabour ratio, d is the rate of depreciation, n is the population growth
= -g gdy
E D Y=
= ¢ >G g g Gyd( ) 0
a a k I a a ak gd E= > > >( , ) , , 0 0 0
g n a s ky k= + +
= - + +I d n a k[ ]
30 Fundamental issues in the theory of demand-led growth
kù
kù
gùd
Eù
Downloaded from Elgar Online by University of Melbourne at 07/12/2013 03:12:13AM

rate, gy denotes the rate of growth of output, E is the level of excess capacityutilization, D is the level of demand, Y is potential capacity, a is the rate oflabour-augmenting technical progress and sk is the elasticity of output withrespect to capital in a CobbÐDouglas production function.
Equation [2.6.1] is the investment function. Investment spending is posi-tively related to the growth of aggregate demand, with firms expanding capac-ity to meet growing demand. This represents a form of the accelerator model.Investment is also a positive function of the level of excess capacity, E, reflect-ing the impact of excess demand on the incentive to expand capacity. Equation[2.6.2] determines the evolution of the capitalÐlabour ratio (capital deepen-ing). Equation [2.6.3] determines the rate of output growth, while equation[2.6.4] (the technical progress function) is the mechanism of endogenousgrowth, in which both the capital stock per worker and the flow of investmentper worker positively affect the rate of technical progress.
Equation [2.6.5] determines the evolution of the rate of aggregate demandgrowth, which responds positively to the rate of output growth. For an equi-librium to exist, demand growth must ultimately equal output growth, or else
Keynesian macroeconomics/theory of economic growth 31
Figure 2.5 The link between demand conditions and output growth in afundamentalist Keynesian model with endogenous growth
Technical progress
Demand conditions
Outputgrowth
Investmentspending
Downloaded from Elgar Online by University of Melbourne at 07/12/2013 03:12:13AM

the economy would be characterized by ever-expanding excess demands orsupplies. In the current formulation, aggregate demand growth is assumed torespond positively to output growth. This represents what may be termed thecase of Ôoptimistic Keynesian dynamicsÕ (Palley, 1997), and involves fastersupply growth drawing forth faster demand growth. An alternative case ofÔpessimistic Keynesian dynamicsÕ is when aggregate demand growth respondsnegatively to output growth, and in this case demand growth slows whensupply growth accelerates. Finally, equation [2.6.6] defines the level of excesscapacity, while [2.6.7] defines its rate of change.
Substituting [2.6.1] into [2.6.4] yields:
a = a(k, z(E, gd )) = a(k, gd, E) [2.6.4¢]
and differentiating with respect to E yields:
daydE = aIzE > 0
The effect of excess demand on the rate of technical progress is therefore posi-tive, reflecting the effect of excess demand on investment spending and exten-sive growth. Consequently, the size of the Okun gap now matters for the rateof growth.7
By a process of substitution, the system of equations above can be reducedto the dynamic, three-equation system:
[2.7.1]
[2.7.2]
[2.7.3]
This system can be linearized around a local equilibrium. As a three-dimen-sional system, the stability conditions are complicated expressions that may ormay not be satisfied.
The logic of potential instability is readily understandable, and rests on theinteraction between the process of capital deepening and demand growth. Thus,a positive shock to the rate of demand growth could accelerate the process ofcapital deepening, thereby accelerating the pace of technical advance andoutput growth. Thanks to equation [2.6.5], this would then accelerate demandgrowth, giving rise to the potential for a cumulatively unstable process.
Such instability can be viewed as the dynamic analogue of multiplier insta-bility in the static incomeÐexpenditure model. In the latter, stability requires
= - - - - -g n s a k g E s s z E g kdk
dk k
d[ ] ( , , )[ ] ( , )1 1
= - + - +{ }( )G n s a k g E s s z E g k gkd
k kd d[ ] ( , , )[ ] ( , )1 1 y
= - + +z E g n a k g E d kd d( , ) [ ( , , ) ]
32 Fundamental issues in the theory of demand-led growth
kù
gùd
Eù
Downloaded from Elgar Online by University of Melbourne at 07/12/2013 03:12:13AM

that induced increases in the level of demand be less than the initial increasein income. In a Keynesian growth model, stability requires that the inducedincrease in demand growth be less than the initial increase in output growth.
Figure 2.6 illustrates the possibility of multiple equilibria, with the outerequilibria being stable and the inner equilibrium being unstable. The interest-ing feature of the model is the fact that the Okun gap affects equilibriumgrowth. This means that traditional Keynesian aggregate demand manage-ment, which directly affects the size of the Okun gap, can be used to influencesteady-state growth.
In equilibrium, the level of excess demand, the capitalÐlabour ratio, and therate of demand growth are all constant. Setting Eù = kù = 0 and gd = gy impliesthat:
z(E, gd) Ð [n + a(k, gd, E) + d]k = 0 [2.8.1]
and:
Keynesian macroeconomics/theory of economic growth 33
45°
gd = gy
gy = n + a(k,gy,E)
gy
gd
Figure 2.6 Determination of the equilibrium rate of growth in a fundamentalist Keynesian growth model in which the growth ofdemand affects investment spending and technical progress
Downloaded from Elgar Online by University of Melbourne at 07/12/2013 03:12:13AM
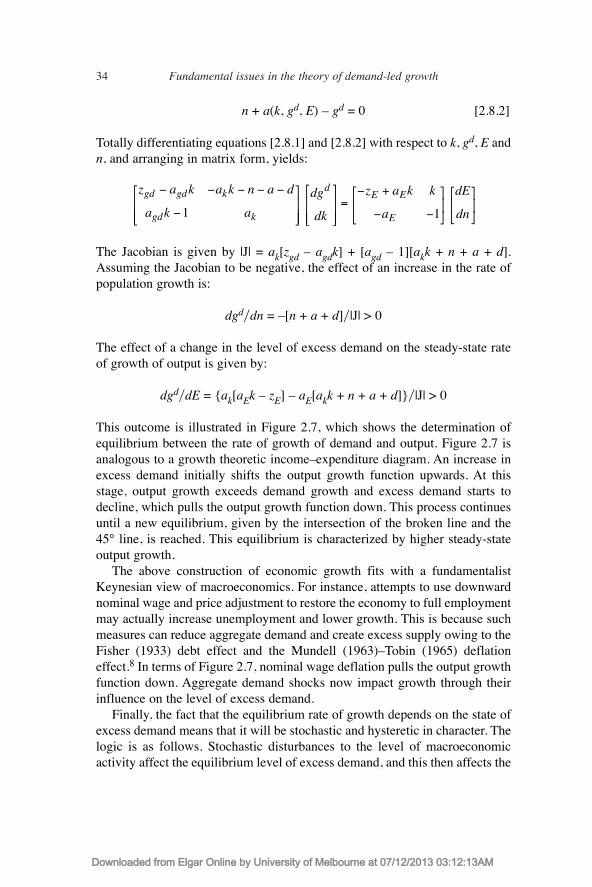
n + a(k, gd, E) Ð gd = 0 [2.8.2]
Totally differentiating equations [2.8.1] and [2.8.2] with respect to k, gd, E andn, and arranging in matrix form, yields:
The Jacobian is given by |J| = ak[zgd Ð agdk] + [agd Ð 1][akk + n + a + d].Assuming the Jacobian to be negative, the effect of an increase in the rate ofpopulation growth is:
dgdydn = Ð[n + a + d]y|J| > 0
The effect of a change in the level of excess demand on the steady-state rateof growth of output is given by:
dgdydE = {ak[aEk Ð zE] Ð aE[akk + n + a + d]}y|J| > 0
This outcome is illustrated in Figure 2.7, which shows the determination ofequilibrium between the rate of growth of demand and output. Figure 2.7 isanalogous to a growth theoretic incomeÐexpenditure diagram. An increase inexcess demand initially shifts the output growth function upwards. At thisstage, output growth exceeds demand growth and excess demand starts todecline, which pulls the output growth function down. This process continuesuntil a new equilibrium, given by the intersection of the broken line and the45¡ line, is reached. This equilibrium is characterized by higher steady-stateoutput growth.
The above construction of economic growth fits with a fundamentalistKeynesian view of macroeconomics. For instance, attempts to use downwardnominal wage and price adjustment to restore the economy to full employmentmay actually increase unemployment and lower growth. This is because suchmeasures can reduce aggregate demand and create excess supply owing to theFisher (1933) debt effect and the Mundell (1963)ÐTobin (1965) deflationeffect.8 In terms of Figure 2.7, nominal wage deflation pulls the output growthfunction down. Aggregate demand shocks now impact growth through theirinfluence on the level of excess demand.
Finally, the fact that the equilibrium rate of growth depends on the state ofexcess demand means that it will be stochastic and hysteretic in character. Thelogic is as follows. Stochastic disturbances to the level of macroeconomicactivity affect the equilibrium level of excess demand, and this then affects the
z a k a k n a d
a k a
dg
dk
z a k k
a
dE
dn
gd gd k
gd k
dE E
E
- - - - -
-
é
ëêê
ù
ûúú
é
ëêê
ù
ûúú
=- +
- -
é
ëê
ù
ûú
é
ëê
ù
ûú1 1
34 Fundamental issues in the theory of demand-led growth
Downloaded from Elgar Online by University of Melbourne at 07/12/2013 03:12:13AM

growth rate and renders it stochastic. To the extent that these shocks impactinvestment spending and change the capitalÐlabour ratio, they will then impactthe steady-state growth rate, which can then exhibit hysteresis.
SOME LOOSE ENDS: SECTORAL AND BALANCE-OF-PAYMENTS GROWTH MODELS
The above construction of the growth process explicitly introduces aggregatedemand into the theory of economic growth, thereby linking growth theorywith static Keynesian macroeconomics. By way of closing, it is worthcontrasting this approach with two other approaches that emphasize sectoralinfluences and the balance of payments, respectively. Doing so serves to illu-minate the comprehensive and novel nature of the above construction.
Cornwall and Cornwall (1994) present a model of endogenous growth inwhich the equilibrium rate of growth changes over the course of development
Keynesian macroeconomics/theory of economic growth 35
Figure 2.7 The effect of an increase in the level of demand on the equilibrium rate of growth in a fundamentalist Keynesianendogenous growth model
45°
gd = gy
gy = n + a(gd,k,E1)
gy
gd
gy = n + a(gd,k,E2)
gy = n + a(gd,k,E0)
gd0 gd2
Downloaded from Elgar Online by University of Melbourne at 07/12/2013 03:12:13AM
because of the changing composition of output. This compositional changeoccurs because of changing income elasticities of demand that result frommovement along Engel incomeÐexpansion curves. As a result, the rate ofgrowth exhibits a time-varying, hysteretic path, with demand factors matter-ing through their influence on the composition of output.
However, a closer examination of the Cornwall model shows that it contin-ues in the tradition of old exogenous growth theory, and the influence ofdemand is neoclassical rather than Keynesian. The model consists of threesectors Ð agriculture, manufacturing and services. Within each sector, the rateof growth is exogenous. Manufacturing has the highest rate of growth. Theeconomy-wide growth rate is a weighted average of the sectoral rates ofgrowth, the weights determined by sectoral output shares. The model can besummarized as follows:
gy = sagraagr + smanaman + sseraser aman > aagr, aser > 0 [2.9.1]
sagr + sman + sser = 1 [2.9.2]
1 > sagr = sagr(y) > 0 s¢agr < 0 [2.9.3]
1 > sman = sman(y) > 0 s¢man > 0 initially, then s¢man < 0 [2.9.4]
1 > sser = sser(y) > 0 s¢ser > 0 [2.9.5]
where a denotes the exogenous rate of growth in the jth sector ( j = agr, man,ser), s is the output share of the jth sector and y is the level of output per capita.The agricultural share of output declines with income, as spending shiftstowards spending on manufactures and services. Initially, manufactured goodshave an income elasticity greater than one, and spending shifts towards manu-facturing. However, once a certain level of income is reached, spending onmanufacturing declines as a share of income. Services are strong normalgoods, and the share of spending on services rises throughout the process ofdevelopment.
This elegant model is capable of producing a rich pattern of growth. Thegrowth rate initially accelerates as economic activity shifts from the agricul-tural sector into the manufacturing sector. However, at some stage the outputshare of the manufacturing sectors peaks, and the growth rate then declines asactivity shifts into the service sector.
The aggregate growth rate is endogenous because of the changing expen-diture shares. However, at the sectoral level, growth rates are exogenous, andin this sense the model remains in the spirit of old growth theory. Demandfactors affect growth by changing the composition of spending. This is a
36 Fundamental issues in the theory of demand-led growth
Downloaded from Elgar Online by University of Melbourne at 07/12/2013 03:12:13AM
neoclassical treatment and not Keynesian, in the sense that the level of aggre-gate demand does not matter. Instead, it is preferences that matter. Moreover,the economy is also always at full employment along the growth path. Forthese reasons, the model remains un-Keynesian.
A second branch of growth theory that emphasizes demand is balance-of-payments-constrained growth (BPCG) theory (Thirlwall, 1979; McCombieand Thirlwall, 1994). In these models, the rate of export growth acts as aconstraint on growth, because countries are unable to grow with ever-increas-ing current account deficits measured as a share of output.
Such models are clearly intended to be Keynesian in spirit, with exportgrowth serving as the engine of demand growth. However, though Keynesianin intent and though elevating conventional Keynesian demand factors to thefore, the BPCG model suffers from two distinct weaknesses. First, the worldeconomy is ultimately a closed system, so that export growth cannot be theengine of growth for the world economy as a whole. At best, the BPCG modelmay apply to small open economies, but this then calls for a separate theory ofgrowth for the large industrialized economies.9 Second, and even more trou-bling, is the lack of attention given to the supply side and the need to balancesupply growth and demand growth. In particular, if the rate of productivitygrowth exceeds the rate of demand growth (as determined by the rate of exportdemand growth), then there will be ever-increasing excess potential supplyand unemployment. The reverse holds if demand growth exceeds supplygrowth.
This problem can be seen from the following simple statement of the BPCGgrowth model:
x = a0g* [2.10.1]
m = b0g [2.10.2]
x = m [2.10.3]
l = c0 + c1g [2.10.4]
gs = l + n [2.10.5]
where x represents the rate of export growth, g* is the rate of foreign incomegrowth, m denotes the rate of import growth, g is the rate of domestic incomegrowth, l is the rate of labour productivity growth, gs is the rate of output growthand n is the rate of population growth. Equation [2.10.1] is the export demandgrowth equation. Equation [2.10.2] is the import demand equation. Equation[2.10.3] is the balance-of-payments constraint, which requires equality between
Keynesian macroeconomics/theory of economic growth 37
Downloaded from Elgar Online by University of Melbourne at 07/12/2013 03:12:13AM

the long-run rates of import and export growth to prevent a growing currentaccount deficit or surplus. Equation [2.10.4] is the Verdoorn law, which endo-genizes productivity growth by linking it to domestic output growth. Finally,equation [2.10.5] determines the rate of potential output growth.
Solutions for the equilibrium rates of actual and potential output growth aregiven by:
g = a0g*yb0 [2.11.1]
and:
gs = c0 + c1a0g*yb0 + n [2.11.2]
The model is overdetermined, and it is only by chance that actual outputgrowth will equal potential output growth. The necessary condition is:
g* = [c0 + n]y[a0yb0 Ð c1]
If this condition is not satisfied, there will be growing imbalance betweenactual and potential output. If g* > [c0 + n]y[a0yb0 Ð c1], there will be grow-ing excess demand. If g* < [c0 + n]y[a0yb0 Ð c1], there will be growing excesssupply.
The above inconsistency is fundamental to Keynesian models that seek toextrapolate short-run supply conditions to the long run. In the short run, asmall increase in the ÔlevelÕ of demand can change the equilibrium level ofoutput because idle capacity exists. In the long run, demand and supply capac-ity must grow together, and this imposes an additional equilibrium conditionbecause of the technical relations implied by production conditions.10
CONCLUSION
Keynesian macroeconomics and growth theory have tended to exist as sepa-rate branches of economics. This chapter has explored the consistencybetween different branches of macroeconomics and growth theory. WhereasKeynesian macroeconomics was inconsistent with old growth theory, it iscompatible with new endogenous growth theory. At the heart of this compati-bility lies the Kaldorian concept of an endogenous technical progress function,which allows demand-side influences to feed back and impact the supply side.The reconciliation of growth theory and Keynesian macroeconomics is animportant development in the construction of a unified theory of Keynesianeconomics.
38 Fundamental issues in the theory of demand-led growth
Downloaded from Elgar Online by University of Melbourne at 07/12/2013 03:12:13AM

NOTES
1. In the Solow growth model, the PGDP path is also the realized GDP path.2. TobinÕs (1965) approach to money and growth was macroeconomic in character, in that it
assumed the existence of a well-defined money demand function. Sidrauski (1967) adopteda microeconomic approach that sought to provide a microeconomic foundation for moneybased on the presence of money in either householdsÕ utility functions or firmsÕ productionfunctions.
3. Viewed in this light, we can see the commonalities and differences between the neo-Keynesian and Friedman (1968)ÐLucas (1975) research paradigms. Both emphasize distur-bances that push AGDP away from PGDP. Neo-Keynesians emphasize demand disturbancesoriginating within the macro-economy. Friedman and Lucas emphasize disturbances attrib-utable to the monetary authority. A big difference is that neo-Keynesians believe the econ-omy only drifts back to PGDP slowly, and this calls for policy interventions to speed up theadjustment process. Friedman and Lucas believe that adjustment is fairly rapid, and thatpolicy cannot do anything to systematically speed up the process (the rational expectationshypothesis). New Keynesians aim to provide a justification for the neo-Keynesian claim ofslow adjustment to equilibrium, and thereby open a way for systematic policy to affecteconomic activity.
4. The differences between the Keynesian and classical approaches to macroeconomic equi-librium are fully explored in Palley (1996a).
5. Another dimension to ScottÕs (1989) work is the issue of growth accounting, and measure-ment of capital. This latter issue is not addressed in the current chapter.
6. Stock effects may be important because they introduce increasing returns to the growthprocess, and this can explain the non-convergence of cross-country growth rates. A possiblemicroeconomic rationale of their effect is that more capital per worker yields more oppor-tunities for seeing where innovations are possible.
7. Palley (1996c) allows excess demand to directly affect the rate of technical progress throughits effect on the incentive to innovate. In this case, the sign of the effect of excess demandon technical progress can be ambiguous.
8. These effects are discussed extensively in Palley (1996a, chapter 5).9. For further discussion of this issue, see Chapter 6 by McCombie and Roberts.
10. See Chapter 7 for a suggested resolution of this problem in the context of the BPCG model.
REFERENCES
Barro, R. and H. Grossman (1971) ÔA general disequilibrium model of income andemployment,Õ American Economic Review, 61, 82Ð93.
Clower, R.W. (1965) ÔThe Keynesian revolution: a theoretical appraisal,Õ in F.H. Hahnand F. Brechling (eds) The Theory of Interest Rates, London, Macmillan, 103Ð25.
Cornwall, J. and W. Cornwall (1994) ÔGrowth theory and economic structure,ÕEconomica, 61, 237Ð51.
Fisher, I. (1933) ÔThe debt-deflation theory of great depressions,Õ Econometrica, 1,337Ð57.
Friedman, M. (1968) ÔThe role of monetary policy,Õ American Economic Review, 58,1Ð17.
Kaldor, N. (1957) ÔA model of economic growth,Õ Economic Journal, 67, 591Ð624.Kaldor, N. and J.A. Mirrlees (1961/2) ÔA new model of economic growth,Õ Review of
Economic Studies, 29, 174Ð90.Keynes, J.M. (1936) The General Theory of Employment, Interest and Money, London,
Macmillan.
Keynesian macroeconomics/theory of economic growth 39
Downloaded from Elgar Online by University of Melbourne at 07/12/2013 03:12:13AM

Long, J.B. and C. Plosser (1983) ÔReal business cycles,Õ Journal of Political Economy,91, 39Ð69.
Lucas, R.E. Jr. (1975) ÔAn equilibrium model of the business cycle,Õ Journal ofPolitical Economy, 83, 1113Ð44.
Malinvaud, E. (1977) The Theory of Unemployment Reconsidered, New York, HalsteadPress.
Mankiw, G. (1985) ÔSmall menu costs and large business cycles: a macroeconomicmodel of monopoly,Õ Quarterly Journal of Economics, 100, 529Ð39.
McCombie, J.S.L. and A.P. Thirlwall (1994) Economic Growth and the Balance ofPayments Constraint, London, Macmillan.
Modigliani, F. (1944) ÔLiquidity preference and the theory of interest and money,ÕEconometrica, 12, 45Ð88.
Mundell, R. (1963) ÔInflation and real interest,Õ Journal of Political Economy, 59,280Ð83.
Palley, T.I. (1996a) Post Keynesian Macroeconomics: Debt, Distribution and theMacroeconomy, London, Macmillan.
Palley, T.I. (1996b) ÔOld wine for new bottles: putting old growth theory back into thenew,Õ Australian Economic Papers, 35, 250Ð62.
Palley, T.I. (1996c) ÔGrowth theory in a Keynesian mode: some Keynesian foundationsfor the theory of economic growth,Õ Journal of Post Keynesian Economics, 19,113Ð35.
Palley, T.I. (1997) ÔAggregate demand and endogenous growth: a generalizedKeynesÐKaldor model of economic growth,Õ Metroeconomica, 48, 161Ð76.
Romer, P.M. (1990) ÔEndogenous technical change,Õ Journal of Political Economy, 98,S71Ð102.
Scott, M.F.G. (1989) A New View of Economic Growth, Oxford, Clarendon Press.Sidrauski, M. (1967) ÔRational choice and patterns of growth in a monetary economy,Õ
American Economic Review, 57, 534Ð44.Solow, R.M. (1956) ÔA contribution to the theory of economic growth,Õ Quarterly
Journal of Economics, 70, 65Ð94.Thirlwall, A.P. (1979) ÔThe balance of payments constraint as an explanation of inter-
national growth rate differences,Õ Banca Nazionale Del Lavoro Quarterly Review,128, 45Ð53.
Tobin, J. (1965) ÔMoney and economic growth,Õ Econometrica, 33, 671Ð84.Woglom, G. (1982) ÔUnderemployment equilibria with rational expectations,Õ
Quarterly Journal of Economics, 97, 89Ð108.
40 Fundamental issues in the theory of demand-led growth
Downloaded from Elgar Online by University of Melbourne at 07/12/2013 03:12:13AM

3. The exogeneity of investment: from systemic laws of accumulationand growth to effective demand conditions
Joseph Halevi and R�duane Taouil
INTRODUCTION
This chapter argues that the concept of effective demand constitutes a majorconceptual break not just with marginalist economics, but also with classicalpolitical economy. The nature of the break lies in the treatment of investmentas an exogenous variable. Classical economics can be considered as the mostcoherent form of endogenous growth theory. This is especially true for MarxÕstheory of cyclical growth.
As shown in the next section, Marx explained cyclical fluctuations in termsof changes in the reserve army of labour. Investment is, in this context, anendogenous variable, determined by the rate of profit. By giving primacy tocapitalistsÕ expenditure, Kalecki distanced himself from Marx in a twofoldmanner. On one hand, he considered investment as a causal variable deter-mining the level of profits; on the other, he viewed investment as being deter-mined independently from savings.
The third section discusses the way in which Kalecki treats investment as anexogenous variable. Firstly, we analyse KaleckiÕs approach to the trade cycle bypointing out the crucial distinction between output as determined by productivecapacity and output as determined by the level of investment. Secondly, westudy KaleckiÕs use of MarxÕs schemes of reproduction and argue that, unlikeMarxÕs, they are never closed in terms of the allocation of investment goods. Theabsence of closure is not accidental: it reflects the view that there is no internalmechanism establishing how many investment goods will be produced and inwhat proportion they will be distributed to the capital and consumption goodssectors of the economy. The existence of such a mechanism would amount to theformulation of an endogenous investment function. It is then pointed out thatwhen writing about a socialist planned economy, Kalecki was perfectly capableof closing his growth model through the decision rule of the planning authority.
41
Downloaded from Elgar Online by University of Melbourne at 07/12/2013 03:16:44AM

Finally, KeynesÕ approach to the problem of investment decisions isdiscussed. It is argued that the author of the General Theory put forward twointerpretations of investment: one based on the comparison between the rateof interest and the position on the marginal efficiency of investment schedule,and one centred on the state of long-run expectations. We contend that thelatter interpretation has the upper hand and that investment is fundamentally avariable which cannot be determined through some kind of functional relation.
MARXÕS CYCLE AND THE ABSENCE OF EFFECTIVE DEMAND
A simple model will suffice to highlight the main points of MarxÕs theory,wherein the rate of profit drives the rate of accumulation and growth. Let X bethe level of output of a one-sector corn economy, K its corn capital stock, d itsrate of depreciation, b the output per unit of capital, n the number of workersper unit of corn capital, W the wage bill and w the corn wage rate. We thenhave the following accounting expression for the level of profits:
P = X Ð W Ð dK [3.1]
With d = 1, all capital is circulating capital.Expressing X and W in terms of K we have:
X = bK [3.2]
nK = E [3.3]
where E is employment, and:
W = wE [3.4]
Substituting equations [3.4], [3.3] and [3.2] into [3.1] and dividing by K, weobtain the following expression for the rate of profit:
r = b Ð wn Ð d [3.5]
The rate of profit is thus proportional to the output-capital ratio b, and variesinversely to the wage rate and to the number of workers per machine.Neglecting the extremely special case of a falling rate of profit in the long run,caused by a fall in b not offset by a still greater fall in n, MarxÕs theory of thetrade cycle is fully captured by equation [3.5].
42 Fundamental issues in the theory of demand-led growth
Downloaded from Elgar Online by University of Melbourne at 07/12/2013 03:16:44AM

Under the pressure of competitive tendencies, capitalists ought to invest thebulk of their surplus, so that:
sP = I = gK [3.6]
where s is the propensity to save out of profits (which is assumed to be verynear unity) and g is the discrete growth rate of capital. By dividing [3.6] by Kwe get:
g = sr [3.7]
Substitution of [3.5] into [3.7] yields:
g = s(b Ð wn Ð d) [3.7a]
The expression in brackets in equation [3.7a] is the full capacity rate of profit.Equation [3.7] is the familiar KaldorÐPasinetti expression for long-run
growth. As pointed out at the end of this chapter, the KaldorÐPasinetti condi-tion does not prescribe a ÔlawÕ of accumulation but only establishes the prereq-uisites for the capitalist system to function. In a Marxian context, r varies inaccordance with the reserve army mechanism, so that the expression in brack-ets in [3.7a] varies systematically with the unemployment cycle. Thus, in aMarxian framework, [3.7a] defines the cyclical law of capitalist accumulation.
In Marx, the accumulation of capital is not constrained by the growth of theactive population. Starting from an initial situation of abundant labour supply,the acceleration of the rate of accumulation generates a dwindling reservearmy of labour. The ensuing increase in the wage rate will, as prescribed byequation [3.5], reduce the rate of profit and with it the rate of accumulation(Marx, 1967, 1968; Sylos-Labini, 1984). This process is at the root of MarxÕstheory of technical change. The rise in the wage rate (fall in the profit rate)leads to the adoption of more mechanized methods of production. The emer-gence of technological unemployment and the reduced intake of workers intothe system caused by the profit squeeze replenishes the reserve army of labour.This factor sets the stage for a new upturn in profitability and growth asprescribed by equation [3.7].
The Marxian cycle combines variations in the rate of profit with move-ments in the industrial reserve army in a precise manner. Investment varies inrelation to the rate of profit which, in turn, varies in relation to the reservearmy. Investment appears, therefore, as an endogenous variable. In this frame-work, cyclical changes in the rate of profit and in the distribution of incomeform, along with the tendency of the rate of profit to fall in the long run, thegeneral law of the accumulation of capital.
The exogeneity of investment 43
Downloaded from Elgar Online by University of Melbourne at 07/12/2013 03:16:44AM
In effect, MarxÕs law, far from being general, finds its application only in amonosectoral competitive classical economy. The law assumes away the influ-ence that variations in the size of the reserve army may have on the effectivedemand for wage goods. The introduction of effective demand implies theabandonment of the hypothesis of a tendency towards a long-period positionin favour of a short-period temporal framework. Indeed, as soon as weconsider a two-sector economy and we introduce the concept of effectivedemand, the results turn out to be different from MarxÕs.
The growth of the reserve army cannot possibly take place without alsoaffecting the level of aggregate demand. The fall in the wage rate comingin the wake of the expansion of the reserve army will negatively affect thedemand for consumption goods. Thus unused capacity is likely to emergein the consumption goods industries, thereby creating an additional layer ofunemployment but, this time, of a Keynesian nature. The Keynesiancomponent of unemployment will lead, in the absence of wage fixing bytrade unions, to a further downward pressure on the wages of employedworkers. The cumulative effects of both reserve army and Keynesian unem-ployment are likely to engender a persistent underutilization of equipmentin the consumption goods sector. Such an occurrence will negatively affectthe degree of utilization of equipment in the capital goods sector via thereduced demand for capital goods emanating from the consumption goodssector.
As a consequence, in contrast to Maxian cyclical growth theory, the econ-omy will not experience a new upswing but will enter, instead, a state ofchronic depression and stagnation. It follows that the formation of the reservearmy does not generate the renewal of the growth process, as much as compe-tition does not ensure the viability of progressive accumulation. Hence,through the introduction of the concept of effective demand, the time horizonof the economy logically becomes that of the short period.
The Conceptual Break
The emergence Ð via the mechanism of effective demand Ð of unused produc-tive capacity as a structural tendency in the economy no longer allows for aclear-cut inverse relation between the rate of profit and the wage rate. If udenotes the rate of capacity utilization, the actual profit rate, s, becomes:
s = u(b Ð wn Ð d) [3.8]
where d < 1 because u < 1.Neglecting, for simplicity, changes in the rate of depreciation stemming
from changes in the rate of capacity utilization, an increase in the rate of profit
44 Fundamental issues in the theory of demand-led growth
Downloaded from Elgar Online by University of Melbourne at 07/12/2013 03:16:44AM

is compatible with an increase in the wage rate when the differential of s inrelation to u and w yields:
(b Ð wn Ð d)u¢ > unw¢ [3.9]
Since the expression in brackets (call it h) represents net output per machineat full capacity Ð or the full capacity profit rate Ð equation [3.9] can be restatedas:
[u¢yw¢] > [uyh]n [3.10]
Equation [3.10] states the conditions necessary for a rise in the rate of profitwhen the wage rate also increases.
With unused capacity as a persistent phenomenon in the system, both thewage rate and the rate of profit can rise (Halevi and Kriesler, 1991). In non-depressionary situations, a rise in the wage rate is likely to induce an increasein the degree of capacity utilization due to the multiplier effect, as well as afurther set of increases due to accelerator effects. Thus it may be concludedthat, barring the extreme cases of u = 1 and of u approximating very lowvalues, the inverse link between the rate of profit and the wage rate is not ageneral case. The existence of unused capacity cannot be considered a tempo-rary phenomenon, since it is inherent in the workings of a decentralized econ-omy. It results from the separation between investment and saving.
When a fall in wages leads to unused capacity in the consumption goodssector, society has performed an act of saving. Yet there is nothing in thisaction that will instruct capitalists to increase investment and production in thecapital goods sector. It must be noted that this outcome is possible because ofthe very existence of money that allows savers not to spend at least part oftheir income on goods and services. In a two-sector model, the monetary sepa-ration between saving and investment is consistent with the assumption that allprofits and no wages are saved. Indeed if, because of the emergence of areserve army, money wages fall with consumption goods prices remaining thesame or declining by a lesser amount, money profits in the consumption goodssector will also fall by the amount of the reduced wage bill in the capital goodssector. Hence the savings and investment of the capitalists in the consumptiongoods sector will have declined. It is the capital goods sector that will end upwith greater savings, but in the form of unused capacity.
From the foregoing analysis it may be concluded that investment ceases to bean endogenous variable since, whenever consumption demand falls in the wakeof a rise in unemployment, no automatic increase in investment will occur.Profits, while remaining the objective of capitalistsÕ activities, do not lead accu-mulation but instead depend on the externally given level of investment, as
The exogeneity of investment 45
Downloaded from Elgar Online by University of Melbourne at 07/12/2013 03:16:44AM

argued by Kalecki. Hence the crucial multiplier in Kalecki is the profit multi-plier (Kalecki, 1971, p. 2). Thus:
P = [1y(1 Ð s)](A + B) [3.11]
where B is capitalistsÕ autonomous expenditure and A gross accumulation(gross investment), both appearing as exogenous variables. Here, the multi-plier is 1y(1 Ð s) with the multiplicand being the sum of gross accumulationand capitalistsÕ autonomous consumption.
THE EXOGENEITY OF INVESTMENT: KALECKI
In the Theory of Economic Dynamics, Kalecki maintained that the profit multi-plier relation Ð equation [3.11] Ð is the differentia specifica between the actualbehaviour of a capitalist economy and the way in which a planned economyought to function (Kalecki, 1954, 1971). This view was reiterated in twopapers quite critical of steady-state growth theories (Kalecki, 1968a).
In Kalecki (1962), the distribution of income is explicitly included. Hence:
Y = Pyq [3.12]
where Y is aggregate output and q is the share of profits. The level of profits,P, is deemed to be a function of the level of investment, I, so that equation[3.11] becomes:
P = zI [3.13]
where z > 1.It follows that profits are determined by the level of investment and that,
given q, investment determines the level of income. However, if q were notfixed, then Y could increase even with a stable level of P for any fall in q.According to Kalecki, the latter case ought to be the norm in a planned econ-omy where output is determined by the level of productive capacity and not bythe link between investment and profits via the fixity of the distributive factor,q. To summarize a long quotation from Kalecki (1954, 1971, p. 97),1 a fall ininvestment, under conditions of an invariant distribution of income, will leadto a fall in profits and in national income causing unused capacity in both thecapital goods and the consumption goods sectors. By contrast, if q were down-wardly flexible Ð a situation which Kalecki ascribed to a centrally plannedeconomy2 Ð full capacity could be maintained in both sectors. A lower level of(net) investment would, in this context, imply an increase in the share of the
46 Fundamental issues in the theory of demand-led growth
Downloaded from Elgar Online by University of Melbourne at 07/12/2013 03:16:44AM

consumption goods sectorÕs output in national income. In other words, wageswould have to be increased relatively to prices.
The important point to retain from the above discussion is that nowheredoes Kalecki gauge the dynamics of profits and of national income in terms ofthe endogenous capacity to accumulate. Attempts to introduce internalelements in the determination of investment decisions were made in the paperpublished subsequently in 1968, a sequel to the 1962 essay. Yet the conclu-sions reached by the author are extremely negative. In particular, for reason-able initial values of the capital stock and profit share of income, the economymay display chronic unused capacity Ð even under significant technicalprogress which, in general, accelerates the obsolescence of capital equipment(Kalecki, 1968a; Halevi, 1992).
These results prompted Kalecki to leave the factors influencing investmentdecisions mostly outside the model and to express the conviction Ð outlined ina paper delivered at the 1968 UNESCO Conference on the centenary of DasKapital Ð that capitalism, if left to its own devices without strong externalimpulses of an institutional and political nature, may well settle into a state ofsimple reproduction (Kalecki, 1968b).
The UNESCO paper is one of the most lucid characterizations of the ques-tion of effective demand from a Marxian perspective. Using a three-sectormodel (capital goods, wage goods and luxury goods), Kalecki shows that thereis no reason to assume that realized profits will lead to a corresponding levelof capital accumulation. By contrast, when Marx goes on to study the mecha-nism of expanded reproduction, the intersectoral equilibrium condition alsospecifies the part of surplus value invested in the expansion of constant capi-tal in the department producing the means of consumption, as well as the addi-tional variable capital accruing to the department producing the means ofproduction. In other words, in order to generate growth Marx had to specify,regardless of the problem of effective demand, the way in which the surplus isinvested.
Such is not the case in KaleckiÕs approach, where the schemes of repro-duction are open on the demand side. The level of profits in the wage goodssector, Pw , is given by the spending out of wages in the capital and luxurygoods sector. The size of Pw may well be above the level of replacementrequirements, i.e., above simple reproduction. Yet we do not know how therealized profits Pw will be spent. This will depend on the degree of capacityutilization in all three sectors and on capitalistsÕ expectations of futuredemand. The passive nature of Pw , relative to what investment might be, arisesfrom the fact that the determinants of changes in wage bill of the capital goodssector are capitalistsÕ autonomous investment decisions. Kalecki cannot beaccused of not knowing how to close a two-sector Marxian model. Indeed,elsewhere he closed it in his writings on the economic growth of a socialist
The exogeneity of investment 47
Downloaded from Elgar Online by University of Melbourne at 07/12/2013 03:16:44AM

economy (Kalecki, 1972). In the first case, he developed a Feldman-typemodel, in which the structure of investment Ð i.e., the proportion of investmentallocated to the capital goods sector Ð is determined by the planned rate ofgrowth (Kalecki, 1972, chapter 11; Halevi, 1981; Kriesler, 1995).
By comparing and contrasting the ways in which Kalecki used the Marxianschemes of reproduction and sectoral growth models in capitalist and plannedeconomies, we cannot but help observe that the crucial difference lies in theabsence of a closure in the capitalist case. This confirms that investment is notviewed as an endogenous variable.
KEYNES: EXPECTATIONS AND THE EXOGENEITYOF INVESTMENT
In Kaleckian theory, the exogeneity of investment (and thus of the main engineof accumulation and growth) emerges in a straightforward manner. Keynes,however, presented two interpretations of the factors governing the level ofinvestment. One was centred on the motives leading to investment decisionsby means of a calculation based on comparing a downward-sloping marginalefficiency schedule with the interest rate, while the other was based on thestate of confidence of entrepreneurs. The view that it may not be possible todetermine the level of investment in the long run through a causal relation isembedded in this second interpretation.
The relationship between the level of investment and the rate of interest, viathe downward-sloping marginal efficiency of investment curve, appears in thesecond chapter of the General Theory and does not sit well with the principle ofeffective demand. The determination of the marginal efficiency of investment issimilar to the determination of the internal rate of return, which equalizes the costof and future returns to an investment project. Future returns are determined bythe difference between the expected values of sales and the cost of productionstemming from a given investment project. Thus, if C is the cost of the projectand Rt is the value of expected sales proceeds, while Vt is the cost of the produc-tion flow generated by the investment project during its life span, we have:
[3.14]
or, multiplying both sides of [3.14] by (1 + e)¢, we obtain:
[3.15]C e R V ent t
n t
t
n
( ) ( )( )1 10
+ = - + -
=å
CR V
et t
t
n
=-
+ ¢=å ( )1
0
48 Fundamental issues in the theory of demand-led growth
Downloaded from Elgar Online by University of Melbourne at 07/12/2013 03:16:44AM
The stream of future returns is given by:
[3.16]
Future returns are therefore identical to the returns that a given amount of capi-tal would generate if it were financially invested at an annual rate of return e.Now, the left-hand side of equation [3.15] is the value of capital at period tgrowing at the compound interest rate e per year. The right-hand side of theexpression is nothing but the net returns earned by an investment project madein period t calculated over n Ð t periods at the rate e. Over the lifespan of theproject, net proceeds are thereby equalized to the proceeds associated to theinterest capitalization of an investment fund. This equalization must imply thatprofits, or net proceeds, must always be invested at a rate of return e. Such acalculation is based on the presupposition that the entrepreneur knows thelifespan of a capital good, as well as the distribution over time of proceeds,costs and profits.
In this context, we cannot but conclude that the marginal efficiency ofinvestment approach to the determination of the level of investment is incontrast with the existence of uncertainty. The very reinvestment of profits isuncertain for reasons that Keynes himself explained in chapters 12 and 16 ofthe General Theory. Whenever decisions are taken in a framework of uncer-tainty, in which the future is unknown and unknowable, the determination ofinvestment requires the integration of subjective elements, such as the state ofbusiness confidence. Thus, for any given rate of interest, the level of invest-ment depends upon the state of expectations and the state of confidence. Iffirms are optimistic, the level of investment at any given rate of interest willbe higher than otherwise. However, if we ascribe to investment decisions aneminently subjective dimension, the amount of investment cannot be ascer-tained by means of a function which depends upon the calculation of futurereturns. The marginal efficiency-based investment function is not compatiblewith KeynesÕs notion of uncertainty and if we wish to keep the latter, thehypothesis of an exogenously determined level of investment becomes neces-sary.
The hypothesis of diminishing returns must also be treated with caution,since it conflates long with short-period phenomena. The hypothesis is, inKeynes, based on decreasing returns due to the growth in the size of the stockof capital (a long-period phenomenon) and on the rise in the price of capitalresulting from the increase in investment. The latter falls unambiguouslywithin the realm of short-period analysis. In this context, the investment func-tion developed by Keynes in chapter 11 starts from an arbitrary choice, as ittakes into account only the impact of investment on prices. The calculations
R VR V
e
R V
en n
n0 01 1
1 1-
-+
¼-
+, , ,
( )
The exogeneity of investment 49
Downloaded from Elgar Online by University of Melbourne at 07/12/2013 03:16:44AM
based on a compound interest rate imply both stable expectations and theabsence of any realization problem, whereas the hypothesis of diminishingreturns leads to the elimination of uncertainty because returns are evaluated onthe basis of the whole lifespan of capital goods.
At any rate, the short and the long run cannot be projected on the sameplane since, as Sylos-Labini has pointed out, their treatment is asymmetrical(Sylos-Labini, 1984). In relation to the short period, Keynes calculates profitsas the excess of the value of production relative to usersÕ costs. In the long run,returns are determined by the marginal efficiency of investment. The distinc-tion between the two periods has a twofold consequence. In the short run,entrepreneurial decisions do not stem from the comparison between currentreturns and interest rates. In the long run, investment decisions dependprecisely on such a comparison. Furthermore, long-term returns are tied tocapital goods, whereas in the short run, with a given stock of capital, returnsdepend entirely on the expansion of employment levels.
The hypotheses of diminishing returns and of the systematic reinvestmentof profits turns out to be inconsistent with each other. The former implies adecline in the rate of return so as to discourage investment, whereas the latterrequires a continuous growth of investment. Under these circumstances, thecurve defining the marginal efficiency of investment is indeterminate. It istherefore impossible to aggregate all the demand curves for capital goods inorder to construct a downward-sloping macroeconomic demand curve forcapital.
Chapter 12 of the General Theory demonstrates the impossibility of fixingthe determinants of investment in the same manner as consumption andsavings. Long-term expectations are crucially influenced by subjective factorswhich, in KeynesÕs terminology, are referred to as the Ôstate of confidenceÕ.These expectations are, in their turn, fashioned by evaluations concerning thefuture, as well as by the trust bestowed on them by entrepreneurs themselves.In other words, expectations depend on the degree to which entrepreneursbelieve in what they are thinking. It follows that Ð unlike the ironclad mechan-ics of classical accumulation Ð the state of long-run expectations rests on toofragile a basis to allow for the formulation of a stable functional expression ofthe factors governing investment decisions.
KeynesÕs approach to the trade cycle is a good example of the importanceassigned to the state of confidence. The analysis carried out in chapter 22 ofthe General Theory, while listing a series of objective factors, stresses the roleplayed by the way in which entrepreneurs conceive and perceive their ownenvironment. On the basis of the collective psychology approach, the tradecycle is split into three phases. During the phase of illusion, entrepreneursoverestimate future returns, although neither the expected nor the currentinterest rate would justify such optimism. Investment decisions are, in this
50 Fundamental issues in the theory of demand-led growth
Downloaded from Elgar Online by University of Melbourne at 07/12/2013 03:16:44AM

case, the outcome of a cumulative race despite the rising costs of capital. Thephase of disillusion signals a sudden reversal in expectations due to the risinggap between actual and expected returns. This phase brings to the fore theprecarious nature of the evaluations forming the basis of expectations, therebyleading to a decline in the level of investment that heralds the phase of depres-sion. The fall in investment generates conditions for mutually reinforcingtendencies that bring about a decline in the volume of production and in thelevel of employment.
It is in the treatment of the trade cycle that KeynesÕs philosophical differ-ences vis-�-vis Marx regarding the dynamics of capitalism emerge in aremarkably clear-cut way. In the Marxian theory of cyclical accumulation,there is strict symmetry between the upward and the downward phases. Whenthe rate of profit falls as the result of previous accumulation, the downswingbegins because very little corn profits are left for investment. The ensuingslackening in the growth rate, coupled with technological transformations(Sylos-Labini, 1984), regenerates the reserve army of the unemployed.Workers, by competing against each other, drive down the real wage. The rateof profit, the share of profits and the share of investment will rise anew, rekin-dling the dynamics of accumulation. A permanent crisis, Marx stressed quitewrongly, cannot exist. The crisis is, for the author of Capital, part and parcelof the self-renewal process of capital accumulation. Unused capacity is just anoccurrence during the crisis as it does not hinder in any fundamental way thetransition from recession to recovery (Halevi, 1985).
For Keynes, by contrast, the upward and downward phases of the cycle areasymmetrical. In chapter 22 Keynes argued that while the recovery, oncestarted, tends to feed on itself, in the downward phase Ð with large amounts ofunused capacity in the economy Ð Ôthe schedule of the marginal efficiency ofcapital may fall so low that it can scarcely be corrected, so as to secure a satis-factory rate of new investment by any practicable reduction in the rate of inter-estÕ (Keynes, 1936, pp. 219Ð20). It follows that there is no natural andendogenous way out from a recessionary state. This means that, as far as thedetermination of investment is concerned, KeynesÕs model has no closure, justlike that of Kalecki. Given the instability of the state of long-run expectations,the forces pulling the system out of a situation of unemployment and idlecapacity lie in the institutional and political spheres.
The conceptual implications of the volatile nature of investment which, asa consequence, makes the formulation of an endogenous investment decisionfunction a virtually insurmountable task, are summarized by Keynes in thefollowing passage:
The theory can be summed up by saying that, given the psychology of the public,the level of output and employment as a whole depends on the amount of invest-ment. I put it in this way, not because this is the only factor on which aggregate
The exogeneity of investment 51
Downloaded from Elgar Online by University of Melbourne at 07/12/2013 03:16:44AM

output depends, but because it is usual in a complex system to regard as the causacausans that factor which is most prone to sudden fluctuations. More comprehen-sively, aggregate output depends on the propensity to hoard, on the policy of themonetary authority as it affects the quantity of money, on the state of confidenceconcerning the perspective yield of capital assets, propensity to spend and on thesocial factors which influence the level of the money-wage. But of these severalfactors it is those which determine the rate of investment which are most unreliable,since it is they which are influenced by our views of the future about which weknow so little (Keynes, 1937, p. 221).
CONCLUSION
Jean-Pierre Dupuy vividly summarizes the behaviour of the Keynesian entre-preneur as follows: ÔWithout illusions who would ever dare invest in the longrun?Õ (Dupuy, 1992, p. 186. AuthorsÕ translation from French). Such a state-ment contains a major implication: investment depends on incalculableelements which are, necessarily, exogenous when the stimulus to invest is tiedto uncertain expectations. By taking investment as the exogenous variable,Kalecki constructed his version of the principle of effective demand on arecursive model in which capitalistsÕ expenditure Ð the prime mover of thesystem Ð is outside the static logic in which expectations are given and stable.
We can find the same conception of economic activity in Keynes once weseparate his analysis of the relationship between marginal efficiency of capi-tal and the rate of interest from that of the state of long-run expectations. Inthis context, the principle of effective demand is anti-classical. It militatesagainst the role assigned to the relationship between savings and investmentby the classical economists, including Marx, whose theory of accumulation isradically different from that of Kalecki. The theory of effective demand doesnot require that investment be expressed by means of a determinate relationindicating the direction of growth. Instead, the only meaningful relationdescribing investment is that given by the inequality set out in an approxi-mate way by Kaldor and made robust by Pasinetti (1974). The importance ofthe KaldorÐPasinetti inequality lies in that it defines the essential conditionsfor the existence of a capitalist economy. Hence, as Kaldor (1996, p. 28)correctly noted, if total investment were not larger than saving out of wagesÔthe sales proceeds of entrepreneurs as a class would fall short of their outlaysand the capitalist system couldnÕt functionÕ. It follows that the share ofinvestment in national income has to be smaller than the percentage of prof-its saved and greater than the percentage of wages saved. TheKaldorÐPasinetti inequality, therefore, while essential for understanding theraison dÕ�tre of capitalism, avoids the trap of foretelling history by construct-ing a scientific law of motion.
52 Fundamental issues in the theory of demand-led growth
Downloaded from Elgar Online by University of Melbourne at 07/12/2013 03:16:44AM

NOTES
1. The full quotation is as follows:
When investment reaches its top level during the boom the following situation arises.Profits and national income, whose changes are directly related to those of investment,ceases to grow as well, but capital equipment continues to expand because net investmentis positive. The increase in productive capacity is thus not matched by the rise in effectivedemand. As a result, investment declines and this causes in turn a fall in profit andnational income. To put the causation of the downswing into proper perspective it is usefulto inquire what would have happened in a similar situation in a socialist economy. (É)the changes in national income would not be tied to those in investment but would followthe changes in productive capacity. If investment remained constant while the stock offixed capital expanded, prices would be reduced or wages raised. In this way the demandfor consumption goods would increase in accordance with the expansion of the stock ofcapital (Kalecki, 1962, pp. 139Ð40).
2. For Kalecki, a socialist economy should be characterized by central planning but not byinvestment priority in the capital goods sector. To this effect, he criticized both the practicedominating in the USSR and Eastern Europe, as well as DobbsÕs preference for capital-inten-sive techniques of production (Kalecki, 1972).
REFERENCES
Dupuy, J.P. (1992) Introduction aux sciences sociales, Paris, Ellipses.Halevi, J. (1981) ÔThe composition of investment under conditions of non-uniform
growth,Õ Banca Nazionale del Lavoro Quarterly Review, 137, 213Ð32.Halevi, J. (1985) ÔThe contemporary significance of Baran and SweezyÕs notion of
monopolistic capitalism,Õ in M. Jarsulic (ed.) Money and Macro-policy, Boston andDotrecht, Kluwer Nijhoff, pp. 109Ð33.
Halevi, J. (1992) ÔKalecki and modern capitalism,Õ Monthly Review, 44, 42Ð52.Halevi, J. and P. Kriesler (1991) ÔKalecki and the surplus approach,Õ Review of Political
Economy, 3, 79Ð92.Kaldor, N. (1996) Causes of Growth and Stagnation in the World Economy,
Cambridge, Cambridge University Press.Kalecki, M. (1954) The Theory of Economic Dynamics, London, Allen and Unwin.Kalecki, M. (1962) ÔObservations on the theory of growth,Õ Economic Journal, 72,
pp. 134Ð53. Reprinted in M. Kalecki (1991), op. cit., pp. 411Ð34.Kalecki, M. (1968a) ÔTrend and business cycle reconsidered,Õ Economic Journal, 78,
pp. 263Ð76. Reprinted in M. Kalecki (1991), op. cit., pp. 65Ð83.Kalecki, M. (1968b) ÔThe Marxian equations of reproduction and modern economics,Õ
Social Science Information. Reprinted in Kalecki (1991) op cit., pp. 459Ð66.Kalecki, M. (1971) Selected Essays on the Dynamics of the Capitalist Economy
1933Ð1970, Cambridge, Cambridge University Press.Kalecki, M. (1972) Selected Essays on the Economic Growth of the Socialist and the
Mixed Economy, Cambridge, Cambridge University Press.Kalecki, M. (1991) Collected Works of Michal Kalecki, Vol. II. Capitalism: Economic
dynamics, ed. Jerzy Osiatynski, trans. Chester Adam Kisiel, Oxford, ClarendonPress.
The exogeneity of investment 53
Downloaded from Elgar Online by University of Melbourne at 07/12/2013 03:16:44AM

Keynes, J.M. (1936) The General Theory of Employment, Interest and Money, London,Macmillan.
Keynes, J.M. (1937) ÔThe General Theory of Employment,Õ Quarterly Journal ofEconomics, 51, pp. 209Ð23. Reprinted in G.K. Shaw (ed.) (1988) The KeynesianHeritage, Vol. 1, Aldershot, Edward Elgar 7Ð21.
Kriesler, P. (1995) ÔFeldmanÕs structural model of economic growth,Õ in P.Groenewegen and B. Mcfarlane (eds) Socialist Thought in the Post Cold War Era,Manila, Journal of Contemporary Asia Publishers in conjunction with the Centre forthe Study of the History of Economic Thought at the University of Sydney, pp.27Ð38.
Marx, K.H. (1967) Capital, vols I, II, III, Moscow, Progress Publishers.Marx, K.H. (1968) Wage, Price and Profit, Moscow, Progress Publishers.Pasinetti, L. (1974) Essays on Growth and Income Distribution, Cambridge,
Cambridge University Press.Sylos-Labini, P. (1984) The Forces of Economic Growth and Decline, Cambridge, MA,
MIT Press.
54 Fundamental issues in the theory of demand-led growth
Downloaded from Elgar Online by University of Melbourne at 07/12/2013 03:16:44AM
4. Growth and fluctuations in the USA: a demand-oriented explanation
H. Sonmez Atesoglu1
INTRODUCTION
This chapter provides a demand-oriented explanation of growth and fluctua-tions in aggregate output in the USA. Empirical cointegration and vector errorcorrection models are developed using quarterly data. Findings reveal thatinvestment, government spending, exports and the money supply determinethe time path of output. These results suggest that there is bidirectional causal-ity among output, investment and the money supply, and unidirectional causal-ity running from government spending and exports to output, investment andthe money supply.
In recent years, there has been a growing emphasis on the role of supply-side factors, such as technology shocks, in accounting for growth and fluc-tuations in aggregate output. In neoclassical macroeconomic theory, thepossibility that aggregate demand and the money supply have long-termeffects on output is generally ignored. Indeed, in some versions of theneoclassical approach, such as the new classical rational expectationsmodels, not even short-term aggregate demand effects on output are allowedfor.2
The neoclassical Ôendogenous growthÕ theory recognizes, in addition totechnological change, the crucial role of investment in explaining economicgrowth (see for example, Romer, 1986). The simpler neoclassical growthmodels of the Feder (1983) type allow exports and government spending acrucial role in determining economic growth.3 But in these neoclassicalgrowth models, there is no room for either aggregate demand or (and in partic-ular) the money supply in determining economic growth.
The empirical evidence reported below in favour of the demand-orientedexplanation of output, which allows the money supply to interact with invest-ment, government spending and exports in explaining growth and fluctuations,raises doubts about the relevance of the neoclassical approach while lendingsupport to the Keynesian/post-Keynesian alternative.
55
Downloaded from Elgar Online by University of Melbourne at 07/12/2013 03:19:38AM

ANALYSIS OF THE DATA
The time paths of the macroeconomic variables examined below are depictedin Figures 4.1Ð4.4. Here, QL represents real GDP, IL is real investment (grossprivate domestic investment), GL is real government spending (governmentconsumption expenditures and gross investment), XL is real exports (exportsof goods and services) and M2L is the real M2 money supply (M2 deflated bya chained price index).4 All of these variables are stated in natural logarithms.Observe that, in general, investment, government spending, exports and themoney supply all move together over time with output, suggesting that thesevariables are likely to be cointegrated. The main exception to this observationis government spending in the late 1960s and late 1980s. The informationconveyed in Figures 4.1Ð4.4 supports the demand-driven explanation ofgrowth and fluctuations in output, which emphasizes the role of investment,government spending, exports and the money supply in providing an accountof movements in the macro-economy.
A more rigorous confirmation of the demand-oriented explanation ofgrowth and fluctations requires a formal empirical demonstration that theabove variables are integrated of order one, and that their first differencesare stationary. In addition, a quantitative cointegrating relation must be
56 Fundamental issues in the theory of demand-led growth
Figure 4.1 Real GDP and real investment
9.0
8.8
8.6
8.4
8.2
8.0
7.8
7.6
7.5
7.0
6.5
6.0
5.5
5.060 65 70 75 80 85 90 95
QL
IL
Downloaded from Elgar Online by University of Melbourne at 07/12/2013 03:19:38AM
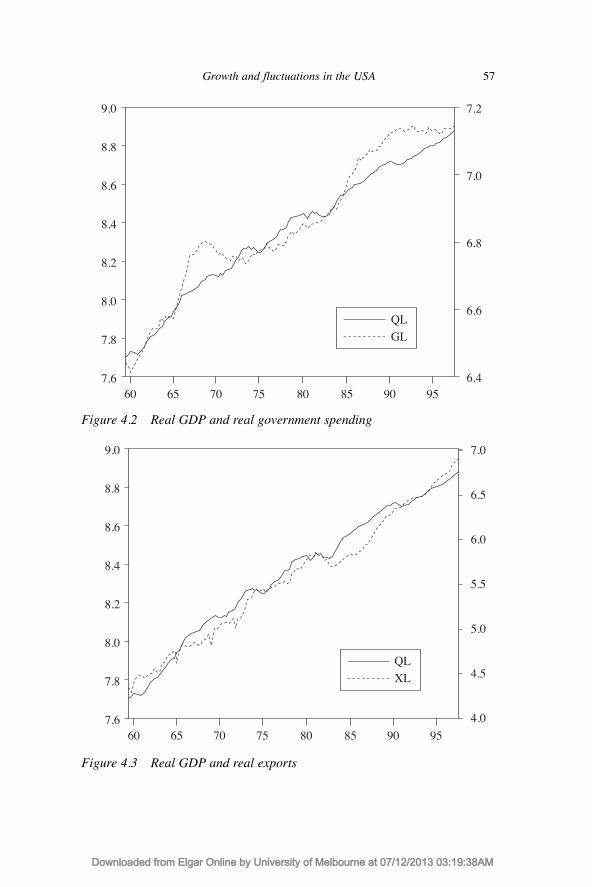
Growth and fluctuations in the USA 57
9.0
8.8
8.6
8.4
8.2
8.0
7.8
7.6
7.2
7.0
6.8
6.6
6.460 65 70 75 80 85 90 95
QL
GL
Figure 4.2 Real GDP and real government spending
Figure 4.3 Real GDP and real exports
9.0
8.8
8.6
8.4
8.2
8.0
7.8
7.6
7.0
6.5
6.0
5.5
5.0
4.5
4.0
60 65 70 75 80 85 90 95
QL
XL
Downloaded from Elgar Online by University of Melbourne at 07/12/2013 03:19:38AM

demonstrated, with the functional signs required by a Keynesian, demand-driven aggregate output equation.
In Table 4.1, Augmented Dickey-Fuller (ADF) test results are reported.These results indicate that QL, IL, GL, XL and M2L are integrated of orderone, and that their first differences are stationary.
A DEMAND-ORIENTED EXPLANATION
The aggregate output equation was estimated by employing the Johansenprocedure and the EViews program (Version 2.0, Quantitative MicroSoftware). The Johansen procedure is considered to be superior to other co-integration procedures (see Gonzalo, 1994). However, there is an importantconsideration in employing the Johansen method Ð the selection of the laglength to be employed. Recently, Granger (1997) has emphasized this practi-cal difficulty while recognizing the advantages of the Johansen cointegrationprocedure.
Since the results of the Johansen procedure and their interpretation candiffer with the lag lengths employed, in this study, following the suggestion byCharemza and Deadman (1997, chapter 6, pp. 200Ð1), the lag length was
58 Fundamental issues in the theory of demand-led growth
9.0
8.8
8.6
8.4
8.2
8.0
7.8
7.6
3.6
3.4
3.2
3.0
2.8
2.6
2.4
60 65 70 75 80 85 90 95
QL
M2L
Figure 4.4 Real GDP and real M2 money supply
Downloaded from Elgar Online by University of Melbourne at 07/12/2013 03:19:38AM

selected by first estimating the cointegration equation starting with a relativelylong lag length (12 quarters). The lag length was then systematically reducedto 8 and then to 6 quarters, while observing that there were no notable changesin the estimates and the cointegration test results. Since at the lag length of 4quarters the results changed, the appropriate lag length was taken to be 6 quar-ters. A lag length of 6 quarters is also close to the lag length of 4 quarters thatis most commonly employed with quarterly data.
The estimated empirical aggregate output model is given by the followinglong-run cointegration equation:
QL = 3.446 + 0.255IL + 0.213GL + 0.128XL + 0.346 M2L [4.1](0.018) (0.023) (0.011) (0.024)
Sample: 1959:3Ð1997:3, number of observations = 146,eigenvalue = 0.280, likelihood ratio = 82.896 and 5 per cent
critical value = 68.52, lag interval = 1 to 6.A linear deterministic trend is assumed in the data.
The parameter estimates in equation [4.1] are normalized long-term cointe-gration coefficients. Values in parentheses are the standard errors of normal-ized cointegration coefficients. The likelihood ratio (Trace) test indicates onecointegrating equation at the 5 per cent critical level.
The results in equation [4.1] reveal a significant and positive long-run
Growth and fluctuations in the USA 59
Table 4.1 Tests of stationarity
Variable Sample (adjusted) Levels Differences
ADF test statisticQL 1960:4Ð1997:3 Ð1.782
1961:1Ð1997:3 Ð5.382*IL 1960:4Ð1997:3 Ð1.168
1961:1Ð1997:3 Ð6.949*GL 1960:4Ð1997:3 Ð1.814
1961:1Ð1997:3 Ð3.210*XL 1960:4Ð1997:3 0.629
1961:1Ð1997:3 Ð5.573*M2L 1960:4Ð1997:3 Ð2.557
1961:1Ð1997:3 Ð3.058*
Notes: Rejection of the unit root hypothesis according to McKinnonÕs critical value at 5 per centis indicated with an asterisk. In the test equation, an intercept and four lagged differences areincluded.
Downloaded from Elgar Online by University of Melbourne at 07/12/2013 03:19:38AM

cointegrating relationship between output and investment, government spend-ing, exports and the money supply. This important empirical finding, whichlends strong support to the demand-oriented explanation of changes in aggre-gate output, is also supported by the results from an estimation of equation[4.1] using the OLSQ method:
QL = 0.683 + 0.173IL + 0.215GL + 0.180XL + 0.342 M2L [4.2](0.010) (0.018) (0.005) (0.016)
Sample: 1959:3Ð1997:3, number of observations = 153,R-squared = 0.999, S.E. = 0.011, DW = 0.474.
Values in parentheses are standard errors.
Note that the parameter estimates in equation [4.2] have the same signs as andsimilar values to those reported in equation [4.1]. The results in equation [4.2]are consistent with and complementary to those of the Johansen procedure,and raise confidence in the conclusion that there is a positive long-run cointe-grating relationship between output and investment, government spending,exports and the money supply.5
In Table 4.2, results from the vector error correction model estimated by theJohansen procedure are reported. Each of the five equations of the vector errorcorrection model can be thought of as short-run explanations of changes inoutput, investment, government spending, exports and the money supply,respectively.
The error correction term in each equation of the vector error correctionmodel indicates whether or not the dependent variable adjusts in response to
60 Fundamental issues in the theory of demand-led growth
Table 4.2 Results from estimation of vector error correction model
Error correction equation, dependent variable
ÆQL ÆIL ÆGL ÆXL ÆM2LError correction term 0.189 1.942 Ð0.103 0.026 0.112(t-statistic) (2.315) (5.111) Ð1.032 (0.070) (1.791)[s.e] [0.082] [0.380] [0.100] [0.367] [0.063]R-squared 0.421 0.518 0.303 0.326 0.655S.E. (equation) 0.008 0.037 0.010 0.035 0.006
Notes: Sample (adjusted): 1961:2Ð1997:3, number of observations = 146 (after adjustingend points), lag interval = 1 to 6. Standard errors are reported in brackets and t-statistics inparentheses. In each error correction equation, in addition to the error correction term and anintercept, lagged values of ÆQL, ÆIL, ÆGL, ÆXL and ÆM2L were included as explanatoryvariables.
Downloaded from Elgar Online by University of Melbourne at 07/12/2013 03:19:38AM

disequilibrium between the dependent variable and the explanatory variablesof the error correction equation (see Enders, 1995). It can be seen that the errorcorrection term is a significant determinant of output, investment and themoney supply. However, the error correction term is not a significant determi-nant of government spending and exports.
The above findings and cointegration results from equation [4.1] suggestthat there is bidirectional causality among output, investment and the moneysupply, and unidirectional causality running from government spending andexports to output, investment and the money supply. These causal relations areconsistent with Keynesian and post-Keynesian macroeconomic theory, inwhich government spending and exports determine output, while investmentand the money supply both affect output and are, themselves, influenced bydevelopments in the macro-economy.
CONCLUSION
The findings discussed above provide rigorous empirical support for demand-oriented explanations of growth and fluctuations. The empirical models esti-mated indicate that investment, government spending, exports and the moneysupply play a crucial role in determining the time path of aggregate output.These macroeconomic variables typically occupy a central place in Keynesianand post-Keynesian macroeconomic theory (see for example Kaldor, 1981;Weintraub, 1981Ð2; Davidson, 1994; Cornwall and Cornwall, 1997). Animportant feature of post-Keynesian macroeconomic thought is the idea thatthe real and monetary sectors of the economy are interdependent. The positivecointegrating relationship reported above between the money supply and other(real) variables confirms this Keynesian view.
The strong empirical support that the demand-oriented approach to growthand fluctuations receives from USA data corroborates the favourable empiri-cal evidence from other industrialized countries (see Atesoglu, 1996; Cornwalland Cornwall, 1997).6 The findings reported in this study also help to defusethe aggregate demand management pessimism (which claims that Keynesiandemand management policies are neither effective nor required)7 that has beenembraced by neoclassical macroeconomists in recent years, and which seemsto hold great sway among policy makers.
NOTES
1. An earlier version of this chapter was presented at the Eastern Economic Association, 25thAnnual Conference, March, 1999. I would like to thank the session participants for theircomments.
Growth and fluctuations in the USA 61
Downloaded from Elgar Online by University of Melbourne at 07/12/2013 03:19:38AM

2. Gordon (1993) and Mankiw (1997) discuss the varieties of neoclassical macroeconomics. Fora critique of the neoclassical approach to economic growth, see McCombie and Thirlwall(1994, 1997) and McCombie (1999).
3. In addition to Feder (1983), see also Ram (1986).4. The source of this data is the ÔFredÕ database of the Federal Reserve Bank of St. Louis, as of
21 December 1997.5. Granger (1997) recommends comparing and complementing results from the Johansen proce-
dure with OLSQ-based results, despite GonzaloÕs (1994) demonstration that the Johansenprocedure is the best available for estimating cointegration relations.
6. Favourable results for the demand-oriented Keynesian theory also corroborate those findingssupportive of the demand-driven, balance-of-payments-constrained growth model ofThirlwall (see Atesoglu, 1997), and the post-Keynesian explanation of employment in theUSA by Atesoglu (1999).
7. Cunningham and Vilasuso (1994Ð5) and Davidson (1996) discuss this demand managementpessimism.
REFERENCES
Atesoglu, H.S. (1996) ÔA demand-oriented explanation of economic growth inGermany,Õ Journal of Post Keynesian Economics, 19, 101Ð11.
Atesoglu, H.S. (1997) ÔBalance-of-payments-constrained growth: evidence for the U.S.economy,Õ Journal of Post Keynesian Economics, 19, 327Ð53.
Atesoglu, H.S. (1999) ÔA Post Keynesian explanation of employment in the UnitedStates,Õ Journal of Post Keynesian Economics, 21, 603Ð610.
Charemza, W.W. and D.F. Deadman (1997) New Directions in Econometric Practice,Aldershot, Edward Elgar.
Cornwall, J. and W. Cornwall (1997) ÔThe unemployment problem and legacy ofKeynes,Õ Journal of Post Keynesian Economics, 19, 525Ð42.
Cunningham, S.R. and J. Vilasuso (1994Ð5) ÔIs Keynesian demand management policystill viable?Õ Journal of Post Keynesian Economics, 17, 187Ð210.
Davidson, P. (1994) Post Keynesian Macroeconomic Theory, Aldershot, EdwardElgar.
Davidson, P. (1996) ÔThe viability of Keynesian demand management in an open econ-omy context,Õ International Review of Applied Economics, 10, 91Ð105.
Enders, W. (1995) Applied Econometric Time Series, New York, John Wiley and SonsFeder, G. (1983) ÔOn exports and economic growth,Õ Journal of Development
Economics, 12, 59Ð73.Gonzalo, J. (1994) ÔFive alternative methods of estimating long-run equilibrium rela-
tionships,Õ Journal of Econometrics, 60, 203Ð33.Gordon, R.J. (1993) Macroeconomics, New York, Harper Collins.Granger, C.W.J. (1997) ÔOn modelling the long run in applied economics,Õ Economic
Journal, 107, 169Ð77.Kaldor, N. (1981) Origins of the New Monetarism, Cardiff, University College Cardiff
Press.Mankiw, N.G. (1997) Macroeconomics, New York, Worth Publishers.McCombie, J.S.L. (1999) ÔA problem with the empirical neoclassical analysis of multi-
sector growth,Õ in M. Setterfield (ed.) Growth, Employment and Inflation: Essays inHonour of John Cornwall, London, Macmillan, 127Ð48.
McCombie, J.S.L. and A.P. Thirlwall (1994) Economic Growth and the Balance ofPayments Constraint, New York, St. MartinÕs Press.
62 Fundamental issues in the theory of demand-led growth
Downloaded from Elgar Online by University of Melbourne at 07/12/2013 03:19:38AM
McCombie, J.S.L. and A.P. Thirlwall (1997) ÔThe dynamic Harrod foreign trade multi-plier and the demand-oriented approach to economic growth: an evaluation,ÕInternational Review of Applied Economics, 11, 5Ð26.
Ram, R. (1986) ÔGovernment size and economic growth: a new framework and someevidence from cross-section and time-series data,Õ American Economic Review, 76,191Ð203.
Romer, P.M. (1986) ÔIncreasing returns and long-run growth,Õ Journal of PoliticalEconomy, 94, 1002Ð37.
Weintraub, S. (1981Ð2) ÔKeynesian demand serendipity in supply-side economics,ÕJournal of Post Keynesian Economics, 4, 101Ð11.
Growth and fluctuations in the USA 63
Downloaded from Elgar Online by University of Melbourne at 07/12/2013 03:19:38AM

Downloaded from Elgar Online by University of Melbourne at 07/12/2013 03:19:38AM
5. A neo-Kaldorian perspective on the rise and decline of the Golden Age
Mark Setterfield and John Cornwall
INTRODUCTION
The focus of this chapter is the generalized slowdown in output and produc-tivity growth rates in the advanced capitalist economies since 1973. Ourpurpose is to construct a neo-Kaldorian model capable of explaining thisgrowth slowdown.
Our approach rests on the notion that capitalism is not self-regulating,because it does not automatically create either sufficient demand or the insti-tutional structures necessary for rapid Ð much less full employment Ð growth.The model posits that capitalistic growth occurs in discrete episodes, and thateach episode can be characterized in terms of a historically specificMacroeconomic Regime (MR). These MRs comprise a process of incomegeneration embedded within a historically specific institutional framework,which together give rise to the conditional steady-state output and productiv-ity growth outcomes characteristic of a growth episode.1 The conditionality ofthese steady states arises from the fact that institutions, although relativelyinert and enduring, are not immutable Ð they can and do change over time. Anyequilibrium is thus conditional on the reproduction over time of a specificinstitutional structure.
The resulting model is neo-Kaldorian in the sense that it modifies a tradi-tional Kaldorian growth schema, based on cumulative causation, by intro-ducing institutional considerations. These are modelled as discreteparameter changes, thereby allowing us to characterize the episodic natureof capitalist growth. Our ultimate aim is to apply the model in order toexplain the Golden Age (1945Ð73) and Age of Decline (post-1973) asdistinct and relatively enduring growth episodes.2 This is a task to whichmainstream (neoclassical) growth theory is particularly unsuited. Its Ôonceand for allÕ characterization of growth dynamics makes no systematic effortto distinguish between structurally different episodes in capitalist growthand the marked differences in growth performance with which they can beassociated.
67
Downloaded from Elgar Online by University of Melbourne at 07/12/2013 03:24:02AM

The rest of the chapter is organized as follows. The next section outlinessome stylized facts of modern capitalism and the essential features of our neo-Kaldorian conception of growth. The third section then constructs models ofthe Golden Age (GA) and Age of Decline (AoD), showing how differences inthe institutional structures of these growth episodes have resulted in the gener-alized slowdown in growth since 1973. A fourth section offers some conjec-tures about the 1990s and the prospects for a new, neoliberal growth episodeand the final section concludes.
STYLIZED FACTS, GROWTH EPISODES AND ANEO-KALDORIAN CONCEPTION OF GROWTH
Some Stylized Facts about Modern Capitalism
It is well known that the post-war Golden Age of capitalism (1945Ð73) wascharacterized by low rates of unemployment and inflation, rapid rates ofoutput and productivity growth, high rates of investment, stable internationaltrade and payments systems coupled with a rapid rate of growth of world tradeand a Ôvalue sharingÕ norm of distributive justice that resulted in a high andstable wage share of income and growing real wages.3 By contrast, the erasince 1973 has witnessed high rates of unemployment and inflation, a gener-alized output and productivity growth slowdown, lower rates of investment,volatile international trade and payments systems coupled with a reduction inthe rate of growth of world trade and the emergence of a Ôwinner take allÕ normof distributive justice, associated with an increase in the profit share of incomeand the stagnation of real wages.
The stylized facts reported above suggest that the GA and AoD consti-tute two distinct episodes in modern capitalism, distinguished by differ-ences in both their structure and macroeconomic performance. The stylizedfacts of performance indicate that the GA was a high-(productivity andoutput) growth episode, whereas the AoD is a low-growth episode.Meanwhile, the GA and AoD can also be distinguished in terms of twoimportant sets of structural stylized facts, pertaining to norms of distribu-tion on one hand, and the institutional structure of international trade andfinance on the other.
The GA was characterized by a Ôvalue sharingÕ norm of distributive justice.Central to this norm were social bargains between capital, labour and the statethat reconciled the competing claims on total income of the social classes(Cornwall, 1990, 1994; Cornwall and Cornwall, 2001).4 Under the terms ofthese social bargains, capital retained the Ôright to manageÕ the workplace, inreturn for a commitment to a high and stable wage share of income and annual
68 Kaldorian models of demand-led growth
Downloaded from Elgar Online by University of Melbourne at 07/12/2013 03:24:02AM
growth in real wages. By reconciling distributional conflict, social bargainsprevented the emergence of an inflationary constraint on macroeconomicperformance during the GA.5 This facilitated a second important aspect of theGA norm of distributive justice Ð the stateÕs commitment to and active pursuitof conditions of full employment.
By way of contrast, the AoD is characterized by a Ôwinner take allÕ normof distributive justice. This emerged from the collapse of the GA socialbargains (see Cornwall, 1990, 1994) and the subsequent emergence of aÔmarket powerÕ approach to industrial relations by capital, labour and thestate. Initially (that is, during the late 1960s/early 1970s), the market powerapproach manifested itself in a challenge to capitalÕs control of the workplaceand pressure on the profit share of income Ð the latter accompanied by theunleashing of inflationary pressures. However, this provoked reactions byboth capital and the state, the results of which have become the hallmark ofthe AoD norm of distributive justice: changes in corporate organization,changes in labour law and the abandonment of the full employment goal, thelatter part of a deliberate strategy to raise unemployment, disempower work-ers and subdue inflationary pressures (Cornwall, 1990, 1994; Palley, 1998;Osterman, 1999).
A second set of structural stylized facts that distinguish the GA from theAoD concerns the institutions of international trade and finance. During theGA, international trade and payments were governed by the Bretton Woodssystem. A particularly important feature of this system was its use of capitalcontrols to protect fixed exchange rates and, at the same time, liberate macro-economic policy to pursue domestic goals. By contrast, the AoD has beencharacterized by the collapse of the Bretton Woods system and increasingderegulation of international financial markets. The increased prominence andmobility of financial capital in this new regime has encouraged the use ofdeflationary domestic macroeconomic policies designed to placate the infla-tion- and currency-depreciation-averse international financial community(Cornwall and Cornwall, 2001; Palley, 1998).6
The question that now confronts us is how, if at all, these structural stylizedfacts can be related to the stylized facts of performance discussed earlier? Inother words, can we relate the institutional differences between the GA andAoD to their different growth performances?
It was suggested earlier that growth episodes can be understood as beingthe result of an income-generating process embedded within an institutionalframework. The structural stylized facts discussed above describe key aspectsof the institutional frameworks of the GA and AoD growth episodes. In orderto relate these institutional frameworks to growth outcomes, then, we need toarticulate the income-generating processes embedded within them. It is to thistask that we now turn.
Rise and decline of the Golden Age 69
Downloaded from Elgar Online by University of Melbourne at 07/12/2013 03:24:02AM

A Neo-Kaldorian View of Growth
The income-generating process characteristic of both the GA and the AoD restson what we identify as two ÔfundamentalsÕ of a capitalist economy. By a funda-mental, we mean a causal proposition that we take as basic to the functioningof capitalism, regardless of the precise growth episode that we are dealing with.These fundamentals are, of course, necessary but not sufficient for the analysisof capitalist economies; they must be supplemented by historically specificinstitutional features of the system if we are to understand actual economicoutcomes. Our fundamentals reduce to the following propositions:
a. the actual rate of growth is demand determined. Because there is no inher-ent tendency for the value of demand to equate with the value of what isproduced, neither the level of economic activity at a point in time nor its growthover time can be analysed exclusively in supply-side terms. Rather, explicitaccount must be taken of the propensity for relatively autonomous demandforces to determine both the utilization rate of existing resources (capital andlabour) at any point in time, and changes in this utilization rate over time.
b. the division of labour depends on the extent of the market or, more gener-ally, the potential (or Harrodian natural) rate of growth is influenced bydemand. Demand affects not just the utilization of productive resources at anypoint in time, then, but also the very development of these resources over time,through induced technological progress and innovation, and the influence ofdemand on labour force participation and the allocation of labour across differ-ent sectors of the economy (see, for example, Cornwall, 1977, chapters 6 and7). It should be noted that the influence of demand on supply as postulatedhere is accompanied by feedbacks from supply to demand, as will becomeclear in the formal model developed below. Ultimately, then, there exists arecursive, joint interaction between supply and demand in our growth schema.However, supply cannot automatically create its own demand, whereas we can(although need not) observe ÔSayÕs law in reverseÕ (demand creating its ownsupply). Demand, therefore, occupies a privileged position in this recursiveinteraction, from which our emphasis on demand and the nomenclatureÔdemand-led growthÕ emerge straightforwardly.
The fundamentals identified above, together with the notion of an institu-tional framework within which they are embedded, permit us to identify threeÔregimesÕ on which the analysis of capitalistic growth can be based. These arethe Demand Regime (DR), the Productivity Regime (PR) and the InstitutionalRegime (IR).7 A DR describes demand formation or, more precisely, the deter-mination of the rate of growth of aggregate demand, and the relationship in
70 Kaldorian models of demand-led growth
Downloaded from Elgar Online by University of Melbourne at 07/12/2013 03:24:02AM

which the latter stands to the growth of output (of which it is the proximatedeterminant). Beyond this fundamental relationship, the precise form of theDR is influenced by the dominant theoretical and policy visions regarding therole of aggregate demand in the economy, and hence the extent to whichaggregate demand is or is not purposively managed in the pursuit of utilizingand encouraging the development of productive resources.
A PR, meanwhile, describes the determination of the rate of productivitygrowth. It is based on the fundamental proposition that the division of labourdepends on the size of the market Ð that is, that the determinants of the naturalrate of growth are, themselves, demand-determined. Beyond this fundamentalrelationship, the precise form of the PR depends on those institutions that impingeupon the organization of the production process, as reflected in the size of theelasticity of productivity with respect to output, or the Verdoorn coefficient.
Finally, an IR is a relatively enduring macro-institutional structure withinwhich economic behaviour takes place. It constitutes the Ôoperating systemÕthat provides the social infrastructure necessary, in an environment of uncer-tainty and conflict, to create stability, undergird the state of long-run expecta-tions, reconcile competing distributional demands and hence facilitateeconomic activity among decentralized decision makers.
As demonstrated below, the idea of an income-generating mechanismbased on a DR, a PR and their joint interaction can be derived from KaldorÕs(1985) model of cumulative causation. Essentially, then, our neo-Kaldorianmodel proposes that capitalistic growth can be understood as a series ofgrowth episodes, each characterized by a Kaldorian cumulative growthschema embedded in a historically specific IR (the latter evidenced by thedifferent structural stylized facts of each episode). The DR, PR and IR thuscombine to form the Macroeconomic Regime (MR) on which the growthepisode is based. This, in turn, yields the conditional steady-state outcomesfrom which an episodeÕs stylized facts of performance can be derived.8 Byemploying a Kaldorian growth schema in tandem with the structural stylizedfacts described earlier, then, we can model the GA and AoD growth episodes,and explain the growth slowdown characteristic of the latter episode. It is tothis task that we now turn.
MODELLING THE GA AND THE AOD: THE ANATOMY OFTHE GROWTH SLOWDOWN
A Traditional Kaldorian Growth Schema
Our basic model of the income-generating process is a traditional Kaldorianmodel of cumulative causation (see, for example, McCombie and Thirlwall,
Rise and decline of the Golden Age 71
Downloaded from Elgar Online by University of Melbourne at 07/12/2013 03:24:02AM

1994). The model, which provides a stylized description of a ÔrepresentativeÕadvanced capitalist economy, can be stated as follows:
q = r + ay [5.1]
p = w Ð q + t [5.2]
x = b(pw Ð p) + gyw [5.3]
y = l(wXx + wAa) [5.4]
where q denotes productivity growth, y is the rate of growth of output, p is therate of inflation, w denotes nominal wage inflation, t is the rate of growth ofthe gross mark-up,9 x is the rate of growth of exports and a is the rate ofgrowth of autonomous expenditures other than exports. Meanwhile, the para-meter r represents exogenous determinants of q, a is the elasticity of produc-tivity with respect to output or Verdoorn coefficient, b is the price elasticity ofdemand for exports, g is the income elasticity of demand for exports, l is anexpenditure multiplier and wX and wA denote, respectively, the shares ofexports and other autonomous expenditures in real income. The subscript wdenotes the value of a variable in the rest of the world.10
Notice that this model does more than capture the fundamentals of growthdescribed earlier. First, implicit in the structure of the second and third equa-tions are features of an IR Ð namely, the convention of cost-based (rather thannon-price) competition. Specifically, international competition is described asworking through the impact of the growth of unit labour costs on inflation(equation [5.2]) which, in turn, has an inverse effect on export growth via itseffects on the relative prices of tradables (equation [5.3]).11 Second, the valueof key parameters (such as r, a, a and yw) will be affected by the IR, as willbecome clearer in what follows. For now, note that the model can be writtenin reduced form as:
q = r + ay [5.1]
y = W + lwXbq [5.5]
where W = l(wAa Ð wXbr + wX(g Ð awb)yw). Equation [5.1] represents the PR,and [5.5] is the DR. Assuming that W > 0 > Ð rya and that 1ya > lwXb ÞlwXab < 1,12 the PR and DR described above can be represented as in Figure5.1, in which the PR intersects with the DR from below, giving rise to theconditional steady-state rates of output and productivity growth yG and qG.Suppose, however, that y and q are below their conditional equilibrium values
72 Kaldorian models of demand-led growth
Downloaded from Elgar Online by University of Melbourne at 07/12/2013 03:24:02AM

to begin with. At q1, for example, the economy will initially experience thedemand-determined rate of output growth y1. But this rate of output growth willcause an increase in productivity growth to q2, thanks to the Verdoorn effectscaptured in the PR (equation [5.1]). The increase in productivity growth sodescribed will then stimulate an increase in the rate of output growth to y2. Thisoccurs as the increased rate of productivity growth lowers domestic inflation(equation [5.2]) which spurs export growth (equation [5.3]) and hence thegrowth of demand (equation [5.4]) Ð a sequence of events that is summarizedby the DR in equation [5.5]. The new, higher rate of output growth y2 will causea further increase in productivity growth to q3, and so on. In fact, productivityand output growth will continue to increase in this fashion (as indicated by thearrow in Figure 5.1) until they reach their conditional steady-state values.13
Modelling the GA and AoD
Now suppose that the model above represents the GA Ð in other words, thatthe parameters of [5.1] and [5.5] reflect the two structural stylized facts about
Rise and decline of the Golden Age 73
Figure 5.1 The Golden Age growth episode
Demandregime
Productivityregime
y
qGq3q2q1
y1
y2
yG
W
Ðr/a
q
Downloaded from Elgar Online by University of Melbourne at 07/12/2013 03:24:02AM

the GA described earlier, so that qG and yG in Figure 5.1 represent, respec-tively, the conditional steady-state rates of productivity and output growthduring the GA. Suppose further that the AoD can be represented by the follow-ing PR and DR, again derived from an income-generating process similar tothat described in equations [5.1]Ð[5.4], but this time reflecting the structuralstylized facts of the AoD:
q = r¢ + a¢y [5.6]
y = W¢ + lwxbq [5.7]
where W¢ = l(wAa¢ Ð wXbr¢ + wX(g Ð awb)y¢w). Equation [5.6] captures the PRof the AoD, and equation [5.7] the DR of this episode.
It is clear by inspection of equations [5.1], [5.5], [5.6] and [5.7] that anydifferences between the growth performances of the GA and AoD must stemfrom differences between the parameters r and r¢, and a and a¢ and W andW¢ Ð or, in other words, differences between the GA and AoD IRs, and theimpact of these IRs on the PR and DR of the Kaldorian income-generatingmechanism outlined above. The question that now confronts us, then, is whatis the relative size of these parameters?
Changes in the institutional structure of postwar capitalism since the end ofthe GA have adversely affected both its DR and PR, and hence its growthperformance. Consider first the DR. The GA IR was conducive to both refla-tionary macroeconomic policies and high rates of accumulation.14 As notedearlier, both the social bargains of the norm of distributive justice and the insti-tutions of international trade and finance relieved macroeconomic policyconstraints (inflation problems and the need to placate international financialcapital, respectively), while the commitment to full employment embodied inthe social bargains ensured that macroeconomic policy was reflationary in itsorientation. Meanwhile, high rates of accumulation can be explained by therelative absence of distributional conflict and uncertainty as to the profit shareof income, together with the accelerator-type effect of high and rising aggre-gate demand (and hence conditions of full employment) Ð both of which wereproducts of the GA IR.
However, the demise of the GA IR resulted in the advent of both deflation-ary macroeconomic policies (Epstein and Schor, 1990, pp. 143Ð9) and adecreased rate of accumulation (Glyn et al., 1990, p. 87). The former, whichwas coordinated across individual capitalist economies, constituted a deliber-ate effort to increase labour market discipline in response to inflationary pres-sures. The latter can be understood as having initially been the consequence ofincreased conflict and uncertainty as the GA IR unravelled, and subsequently,of new policy norms embedded in the AoD IR, which included abandonment
74 Kaldorian models of demand-led growth
Downloaded from Elgar Online by University of Melbourne at 07/12/2013 03:24:02AM

of the stateÕs commitment to the maintenance of high and rising aggregatedemand in the pursuit of full employment. These changes in the orientation ofmacroeconomic policy and the rate of investment amount to declines in therates of growth of domestic autonomous demand and (owing to the synchro-nization of deflationary policies and reduced accumulation among capitalisteconomies) world income. In terms of equations [5.5] and [5.7], they can becaptured by the inequalities a¢ < a and y¢w < yw, so that ceteris paribus,W¢ < W.15
Meanwhile, the demise of the GA IR adversely affected the PR of capital-ist economies in two ways. First, since investment is necessary for the real-ization of technical progress embodied in physical capital, the decline in therate of accumulation noted above had a negative impact on productivitygrowth.16 Second, the demise of the GA social bargains had a direct, negativeeffect on productivity growth. This is because the Ôeffective effortÕ of labour(i.e., both exertion and cooperation) is necessary for the realization of produc-tivity gains associated with technological and organizational change (Bucheleand Christiansen, 1999). But the labour market discipline effects of slowergrowth and high unemployment Ð a necessary accompaniment of the marketpower AoD IR Ð are not an effective substitute for the explicit conciliation andcooperation of a social bargain in eliciting effective effort from workers(Weisskopf, 1987). In terms of equations [5.1] and [5.6], these developmentscan be captured by a reduction in the Verdoorn coefficient, so that we havea¢ < a.
Finally, there is one important structural change unrelated to institutionsthat has nevertheless had an important effect on the PRs of capitalisteconomies during the postwar era. Specifically, the ongoing transformation ofcapitalism associated with the increasing prominence of the service sector hashad an adverse effect on productivity growth during the postwar years(Cornwall and Cornwall, 2001). In terms of equations [5.1] and [5.6], this canbe captured by a decline in the autonomous trend rate of productivity growth,so that we have r¢ < r.
Comparative Growth Performance during the GA and AoD
Based on the considerations in the previous section, we can now restate ourneo-Kaldorian models of postwar growth as:
q = r + ay [5.1]
y = W + lwXbq [5.5]
for the GA, and:
Rise and decline of the Golden Age 75
Downloaded from Elgar Online by University of Melbourne at 07/12/2013 03:24:02AM

q = r¢ + a¢y [5.6]
y = W¢ + lwXbq [5.7]
for the AoD, where r¢ < r, a¢ < a and W¢ < W. Assuming that W¢ > 0 > Ð r¢ya¢and that 1ya¢ > lwXb Þ lwXa¢b < 1,17 the PRs and DRs of the GA and AoD Ðand hence their comparative growth outcomes Ð can be represented by Figure5.2.
In Figure 5.2, yA and qA denote, respectively, the conditional steady-staterates of growth of output and productivity during the AoD. This figure clearlydepicts the decline in output and productivity growth that has occurred sincethe end of the GA. The declines in these growth rates can be associated withchanges in both the PR and DR over the post-war period, changes that can, inturn, be traced to differences between the IRs of the GA and AoD. The resultof these structural differences Ð as depicted in Figure 5.2 Ð has been a gener-alized slowdown in output and productivity growth in capitalist economiesduring the post-1973 period.
76 Kaldorian models of demand-led growth
Figure 5.2 The golden age and age of decline growth episodes compared
y
qGqA
yG
W
Ðr/a
W'
q
DRG
Ðr'/a'
DRA
PRG
PRA
yA
Downloaded from Elgar Online by University of Melbourne at 07/12/2013 03:24:02AM

What all this demonstrates is that by taking a Kaldorian growth schema torepresent the ÔfundamentalsÕ of the income-generating mechanism of capital-ism, structural changes that are primarily institutional in nature, and whichalter the social environment or Ôoperating systemÕ within which the funda-mentals of income generation are embedded, can be used to explain themarked differences in growth performance between the GA and the AoD.
CONJECTURES ON THE 1990S: A NEW, NEOLIBERALGROWTH EPISODE IN THE MAKING?
During 1990s, the macroeconomic performance of the US economy hasmarkedly improved, relative to its own performance during the 1970s and1980s, and that of other capitalist economies. In particular, a long boom hasresulted in the reduction of unemployment to levels last seen at the end of theGA, without the accompaniment of significant inflation. More recently, therehas also been an improvement in productivity growth. The purpose of thissection is to suggest that these developments can be explained in terms of ourneo-Kaldorian model, by taking into account the institutional characteristics ofthe 1990sÕ boom in the USA, and their impact on the PR and DR of the USeconomy.
A key development in the US economy in recent decades has been the insti-tutionalization of the discipline necessary to relieve pressure on the profitshare/rate of inflation in a market power industrial relations system. This hasbeen brought about by anti-labour law in the 1980s and its impact on tradeunions, changes in the structure of the labour market (in particular, the growthof part-time and contingent work), and increased capital mobility, which hasresulted in the ability of US producers to ÔimportÕ the disciplinary effects ofunemployment from other capitalist economies (and from high unemploymentregions within its own borders) by threatening to relocate production(Setterfield, 2000). Finally, there has been a deflation of worker aspirations Ða change in the norms advising worker demands, resulting in the emergence ofa new convention of expecting less in an environment characterized by theÔnatural orderÕ of Ôfree marketsÕ. In sum, both constraints and (lack of) aspira-tions have resulted in institutionalized worker compliance.
These changes suggest that, at the present point in time, the USA does notneed to use deflationary policies designed to maintain high unemployment inorder to discipline workers and thus contain inflation. A reflation of the US DRhas thus been permitted, led by a relaxation of monetary policy and a debt-financed consumption boom (Godley, 1999, pp. 8Ð10). Fiscal policy hasremained restrictive, however, and although the rate of growth of investmenthas increased significantly relative to its rate during the AoD (see Table 5.1),
Rise and decline of the Golden Age 77
Downloaded from Elgar Online by University of Melbourne at 07/12/2013 03:24:02AM

it has done so only since the mid-1990s, as a result of a surge in investment ininformation technology.18 The US DR during the 1990s can thus be written as:
y = W² + lwXbq [5.8]
where W¢ < W² < W.As regards its PR, the USA can now rely on an increased supply of Ôeffec-
tive effortÕ by workers (and its concomitant positive effects on the Verdoorncoefficient) because of a mixture of non-unemployment-based disciplineeffects coupled with aspiration deflation (see Osterman, 1999).19 Thereremains controversy, however, as to whether or not coercing workers in thisfashion is as successful in eliciting effective effort as GA-style social bargainmethods, based on the ÔcarrotsÕ of participation and value sharing (Bucheleand Christiansen, 1999).
A second controversy surrounding the US PR concerns the impact ofinformation and communications technologies (ICTs), and the extent towhich there is now a Ônew economyÕ in the USA in which investment in ICTshas raised the trend rate of productivity growth. As noted above, there hasbeen a boom in investment in ICTs in the USA since 1995. At the same time,labour productivity has grown at about 2.5 per cent per annum 1995Ð99, a fullpercentage point higher than its rate of growth during the previous four years.According to Oliner and Sichel (2000), this is no coincidence: ICTs accountfor two-thirds of the increase in the rate of labour productivity growth in theUSA since 1995. Gordon (2000), however, is doubtful as to whether thisconstitutes a Ônew economyÕ in the sense described above.20 First, he notesthat a significant portion (as much as 0.5 percentage points) of the increase inproductivity growth is attributable to cyclical effects. Second, he finds thatwhile the trend rate of multi-factor productivity growth has increased in thedurable manufacturing sector, there has been a decrease in the trend rate of
78 Kaldorian models of demand-led growth
Table 5.1 Average annual rates of growth of real non-residential investment in the USA, selected periods, 1960Ð99
Period Rate of growth of investment (%)
1960Ð67 7.731967Ð73 5.831973Ð79 5.201979Ð89 3.171989Ð99 7.16
Source: Bureau of Economic Analysis (2000).
Downloaded from Elgar Online by University of Melbourne at 07/12/2013 03:24:02AM
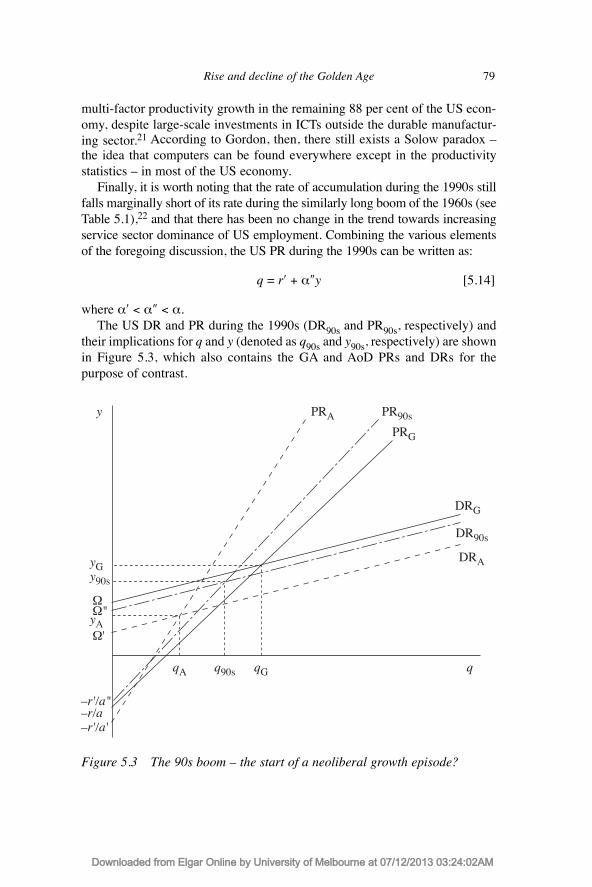
multi-factor productivity growth in the remaining 88 per cent of the US econ-omy, despite large-scale investments in ICTs outside the durable manufactur-ing sector.21 According to Gordon, then, there still exists a Solow paradox Ðthe idea that computers can be found everywhere except in the productivitystatistics Ð in most of the US economy.
Finally, it is worth noting that the rate of accumulation during the 1990s stillfalls marginally short of its rate during the similarly long boom of the 1960s (seeTable 5.1),22 and that there has been no change in the trend towards increasingservice sector dominance of US employment. Combining the various elementsof the foregoing discussion, the US PR during the 1990s can be written as:
q = r¢ + a²y [5.14]
where a¢ < a² < a.The US DR and PR during the 1990s (DR90s and PR90s, respectively) and
their implications for q and y (denoted as q90s and y90s, respectively) are shownin Figure 5.3, which also contains the GA and AoD PRs and DRs for thepurpose of contrast.
Rise and decline of the Golden Age 79
Figure 5.3 The 90s boom Ð the start of a neoliberal growth episode?
y
qGqA
yG
W
Ðr/a
W'
q
DRG
Ðr'/a'
DRA
PRG
PRA PR90s
DR90s
q90s
y90s
W"yA
Ðr'/a"
Downloaded from Elgar Online by University of Melbourne at 07/12/2013 03:24:02AM

Figure 5.3 shows increases in y and q in the USA during the 1990s relativeto the AoD; neither recovers to rates comparable with the GA. Furthermore,Figure 5.3 shows that regardless of the inferiority of PR90s relative to PRGA, itis still possible for the USA to raise both y and q by reflating the DR (confirm-ing the views of Howes, 1999), but that any given rate of output growth is nowassociated with lower productivity growth. This is confirmed in Table 5.2, inwhich the final row shows what the 1990sÕ boom would have looked like hadthe reflation of the US DR during this decade been accompanied by a PR akinto that of the GA.
A final question that confronts the analysis in this section is whether or notrecent US performance is sustainable. The USA may now have a new MR, ifthe institutional features of the 1990sÕ boom described above are enduring. Butthe resulting neoliberal growth episode will feature lower per capita incomegrowth (q90s < qGA) and both higher inequality and the potential for greatersocial strife than during the GA, owing to the corporate-dominated marketpower IR on which US growth is currently based.
Alternatively, it is possible that the current US market power IR will not
80 Kaldorian models of demand-led growth
Table 5.2 Average annual rates of growth of non-farm real output, labourproductivity and employment in the USA, selected periods,1960Ð98
Period Output growth Productivity growth Employment growth(%) (%) (%)
1960Ð67 5.1 3.4 1.71967Ð73 4.3 2.6 1.71973Ð79 3.3 1.3 2.01979Ð89 3.2 1.4 1.81989Ð98 3.4 1.9 1.51960Ð73 4.7 3.0 1.71973Ð89 3.2 1.4 1.91989Ð98 3.4 1.9 1.51989Ð981 3.4 2.2 1.2
Notes: 1. Productivity and output growth are calculated here using the accounting proportionsof the 1960Ð73 period Ð i.e., each one percentage point of real output growth is associated with0.72 percentage points of productivity growth and 0.28 percentage points of employmentgrowth.
Source: Economic Report of the President, 2000, p. 363.
Downloaded from Elgar Online by University of Melbourne at 07/12/2013 03:24:02AM
prove sustainable, if growth and lower unemployment rapidly lead to thereflation of worker aspirations and/or increasing challenges to the structuralconstraints on labour embedded in this IR. In this case, US performanceduring the 1990s represents a long boom in GDP, and not the start of a newlong-run growth episode.
CONCLUSIONS
This chapter has argued that modern capitalism can be subdivided into discretegrowth episodes, characterized by different stylized facts of performance anddifferent structural stylized facts. Moreover, given certain ÔfundamentalÕ prop-erties of the income-generating process common to advanced capitalisteconomies, it has been shown that differences in the stylized facts of perfor-mance as between the GA and the AoD growth episodes can be explained bydifferences in the structures Ð and in particular, the institutional frameworks Ðof these growth episodes, within which the fundamentals of income generationare embedded. Structural and especially institutional differences, as capturedby the structural stylized facts of the GA and AoD episodes, can thereforeexplain the generalized slowdown in output and productivity growth since1973.
The chapter also claims that the same neo-Kaldorian model of growth canbe used to understand improvements in the relative macroeconomic perfor-mance of the US economy during the 1990s. Again, structural and in particu-lar institutional changes in the US economy provide an explanation of why USgrowth rates have improved, although not to rates comparable with those ofthe GA. Whether the recent improvement in US performance is a long trade-cycle boom or the start of a new long-run growth episode is an open question,the answer to which depends, according to this analysis, on the durability ofthe market power IR that has been established in the USA over the past twodecades.
APPENDIX 5.A
Equation [5.4] is derived from the expression:
Y = cY + X Ð mY + A
where A º I + G, i.e., investment plus government deficit spending. This canbe written as:
Rise and decline of the Golden Age 81
Downloaded from Elgar Online by University of Melbourne at 07/12/2013 03:24:02AM

Y = l(X + A)
where l = 1y(1 Ð c + m)
Þ y = l(wXx + wAa)
where wX = XyY and wA = AyY.Equation [5.5] is derived by substituting equations [5.2] and [5.3] into
equation [5.4], which yields:
y = l(wX[b(pw Ð w + q Ð t) + gyw] + wAa)
Assuming that qw = r + awyw and pw = ww Ð qw + t, we can write:
y = l(wX[b(ww Ð r Ð awyw + t Ð w + q Ð t) + gyw] + wAa)
and given that ww = w (the Kaldorian stylized fact of constant wage relativi-ties), we get:
y = W + lwXbq [5.5]
The values yG and qG shown in Figure 5.1 are derived as follows.Substituting [5.1] into [5.5], we get:
y = lwAa Ð lwXbr + lwX(g Ð awb)yw + lwXbr + lwXaby
Substituting [5.5] into [5.1], we get:
q = r + alwAa Ð alwXbr + alwX(g Ð a Ð wb)yw + alwXbq
Þ (1 Ð alwXb)q = (1 Ð alwXb)r + al(wAa + wX[g Ð awb]yw)
The conditional steady-state values qA and yA, and q90s and y90s, in Figures 5.2and 5.3 are similarly derived, taking into account relevant changes in parame-ter values.
Þ = ++ --
q ra y
GA X w w
X
al w w g a balw b
( [ ] )
1
Þ =+ -
-y
a yG
A X w w
X
l w w g a blw ab
( [ ] )
1
82 Kaldorian models of demand-led growth
Downloaded from Elgar Online by University of Melbourne at 07/12/2013 03:24:02AM

NOTES
1. Note that there may be feedbacks from growth outcomes to the institutional framework ofwhich they are, in part, a product. In this case, MRs will both determine and, in turn, beinfluenced by the rate of growth, resulting in a two-way or joint interaction between growthoutcomes and the MRs of which they are a product. This would give rise to a path-depen-dent growth model, in which a MR creates growth outcomes that feed back onto the struc-ture of the MR itself, giving rise to structural change in the MR and hence a new growthepisode.
2. The Golden Age is sometimes described as having begun in 1948 or 1950, given that severalof the advanced capitalist economies were under reconstruction (both physically and interms of their institutions) immediately after the Second World War. However, the precisedating of the GA growth episode does not affect the broad, comparative conclusions aboutcapitalist growth episodes that are drawn below.
3. See Glyn et al. (1990) for further discussion of the stylized facts described above.4. This social bargain strategy was not pursued uniformly among capitalist economies. It was
most clearly in evidence in the northern European and Japanese economies, and much lesswell developed in the Anglo-Saxon economies. In the USA, for example, the GA was char-acterized by a limited ÔcapitalÐlabour accordÕ (Bowles et al., 1990), but retained features ofwhat is described below as a Ômarket powerÕ approach to industrial relations. This lack ofuniformity in the pursuit of social bargains helps to account for differences in macroeco-nomic performance among the advanced capitalist economies during the GA (see Cornwall,1990, 1994).
5. See Cornwall (1990, 1994) and Cornwall and Cornwall (2001) on the inflationary bias incapitalism, and the chapters by Lavoie and Cassetti in this volume on the relationshipbetween distributional conflict and inflation.
6. The trend towards greater central bank independence can be understood as both a reactionand contributory factor to these new constraints on macroeconomic policy. See, for exam-ple, Epstein and Schor (1990) on the relationship between central bank independence andmacroeconomic policy.
7. Note that this trichotomy is somewhat false, since both the DR and PR are embedded in (inother words, partially constituted by) the IR. Because they derive some of their features fromthe IR, it is thus impossible to fully specify the nature of the DR and PR independently ofthe IR.
8. As intimated earlier, the conditionality of the steady state stems from the fact that it iscontingent on the reproduction of the structure of the MR over time. See Setterfield (1997)on the notion of conditional equilibria, and Chick and Caserta (1997) on the related notionof provisional equilibria.
9. The gross mark-up is given by (1 + j) in the mark-up pricing equation:
where P is the price level, 0 < j < 1 is the percentage mark-up of prices over average primecosts, W is the nominal wage, N is the level of employment and Q is the level of output. Notethat the wage share of income varies inversely with (1 + j), so that t 0 will affect the distri-bution of income. In what follows, we overlook the implications for the DR of redistributionfor the sake of simplicity Ð but see the chapters by Blecker, Mott, Lavoie and Cassetti in thisvolume on how redistribution can affect demand-led growth.
10. Whichever growth episode is being characterized, it is assumed that the MR in the rest ofthe world is identical to that of the individual economy under discussion.
See Appendix 5.A for notes on the form of equation [5.4], and also on the derivation ofthe results that follow.
11. The model does not preclude non-price competition, which can be thought of as affectingexport growth via its impact on the income elasticity of demand for exports, g, in [5.3].
PWN
Q= +( )1 j
Rise and decline of the Golden Age 83
Downloaded from Elgar Online by University of Melbourne at 07/12/2013 03:24:02AM

However, the cost-based competition described above is central to the two-way interactionbetween q and y in the system of equations [5.1]Ð[5.4].
McCombie and Thirlwall (1994) argue that non-price factors are now of overwhelmingimportance in international trade. Carlin et al. (2001), however, while not disputing theimportance of non-price competitiveness, do find that unit labour costs have a significantimpact on export performance. Hence the emphasis on cost-based competition in the two-way interaction between q and y above can be regarded as an incomplete but not entirelyinappropriate description of international competition.
12. These conditions are sufficient to ensure that a positive and stable conditional steady-stategrowth rate exists. The stability of the conditional steady state is demonstrated intuitivelybelow.
13. Similarly, any initial rates of output and productivity growth higher than yG and qGwill result in successive reductions in y and q until conditional equilibrium isregained Ð again, assuming that the structure of the MR is invariant with respect to thisprocess of traverse.
14. From 1950Ð73, the average annual rate of growth of the non-residential, fixed capital stockwas 5.5 per cent. This was more than three times greater than its rate of growth from1913Ð50, and constituted Ôan investment boom of historically unprecedented length andvigourÕ (Glyn et al., 1990, p. 42).
15. Note that ¶Wy¶a = lwA > 0, while ¶Wy¶yw = lwX(g Ð awb) > 0 if g > awb. This latter condi-tion is plausible, given the importance of non-price relative to price competition (suggestingg > b Ð see McCombie and Thirlwall, 1994) and the likelihood of aw < 1 (i.e., a less-than-unit elasticity of productivity with respect to output).
Note that even with a¢ < a and y¢w < yw, it does not automatically follow that W¢ < W,because ¶Wy¶r = ÐlwXb < 0 and, as will be argued below, r¢ < r. However, it is plausible toargue that (¶Wy¶a)da + (¶Wy¶yw)dyw + (¶Wy¶r)dr = dW < 0 nevertheless, on the basis ofsome simple stylized facts.
First, according to Cornwall and Cornwall (2001, chapter 11), some 42.6 per cent of the2.28 percentage-point decline in productivity growth after 1973 is accounted for by factorsunrelated to the pressure of demand on output, suggesting that dr Å 0.97 percentage points.But the rate of growth of investment alone fell by 1.1 percentage points in the six years after1973, before falling further thereafter (Glyn et al., 1990, pp. 42, 86Ð7). Given that this wasaccompanied by a move towards contractionary macroeconomic policies that would havecaused further reductions in the rate of growth of autonomous expenditures, it would appearthat |da| > |dr| in the transition from the GA to the AoD.
Meanwhile, the average value of wA from 1965Ð85 (calculated as the share of governmentconsumption plus gross fixed capital formation and net additions to stocks) was approxi-mately 41 per cent, whereas that of wX was closer to 17 per cent (using OECD figures asreported in OECD Historical Statistics). Given the importance of non-price relative to pricecompetition as mentioned above, it is highly unlikely that b > 2.5. On this basis, it is possi-ble to conclude that lwA > lwXb.
In sum, what these stylized facts suggest that, even neglecting the role of(¶Wy¶yw)dyw < 0, we have (¶Wy¶a)da + (¶Wy¶r)dr < 0 and hence dW < 0 in the transitionfrom the GA to the AoD.
16. Cornwall and Cornwall (2001, chapter 11) estimate that the declining rate of growth ofinvestment accounted for over 13 per cent of the decline in productivity growth in theadvanced capitalist economies after 1973.
17. Again, these conditions are sufficient to ensure that a positive and stable conditional steady-state growth rate exists for the AoD model.
18. Beginning from a low base in the early 1990s, real investment in computers and peripheralequipment grew at an annual average rate of 18.71 per cent up to 1995, since when its rateof growth has more than doubled to 46.88 per cent per annum (Economic Report of thePresident, 2000, p. 327).
19. The US economy was always ripe for this outcome. Unlike other capitalist economies, disci-pline was capable of raising productivity in the USA even during the early phases of the AoD(Weisskopf, 1987).
84 Kaldorian models of demand-led growth
Downloaded from Elgar Online by University of Melbourne at 07/12/2013 03:24:02AM

20. Both Oliner and SichelÕs and GordonÕs findings are based on a neoclassical growth account-ing framework, in which long-run productivity growth is conceived as a technical, supply-side phenomenon. The demand-side and socio-institutional influences on long-runproductivity growth emphasized in the model developed in this chapter are overlooked,although Gordon does allow for a short-run impact of demand on productivity growth overthe course of the cycle. Moreover, as Gundlach (2001) points out, the rate of growth of totalfactor productivity, which is calculated as a residual and is crucial to the sustainability ofincreased productivity growth in these growth-accounting exercises, is sensitive to assump-tions about whether technological progress is capital or labour augmenting, or both. Hencegrowth accounting provides no means of specifying the exact size of any increase in thetrend rate of productivity growth it purports to identify.
21. Over 76 per cent of all computers are used in the wholesale and retail trades, finance, insur-ance, real estate and other services (Gordon, 2000, p. 57).
22. This may be, in part, because Ôzapping labourÕ does not just institutionalize discipline, butalso, by relieving wage pressures on employers, influences the choice of technique. Insteadof going Ôhigh techÕ to avoid costly labour, then, some US industries can now afford to adoptlabour-intensive production techniques. The result is an adverse effect on the Verdoorn coef-ficient Ð productivity becomes less elastic with respect to output than it was during higherwage pressure eras prior to the 1990s.
REFERENCES
Bowles, S., D. Gordon and T. Weisskopf (1990) After the Waste Land, Armonk, NY,M.E. Sharpe.
Buchele, R. and J. Christiansen (1999) ÔLabor relations and productivity growth inadvanced capitalist economies,Õ Review of Radical Political Economics, 31,87Ð110.
Bureau of Economic Analysis (2000), Survey of Current Business, www.bea.doc.gov/bea/pubs.htm.
Carlin, W., A. Glyn and J. Van Reenen (2001) ÔExport market performance of OECDcountries: an empirical examination of the role of cost competitiveness,Õ EconomicJournal, 111, 128Ð62.
Cassetti, M. (2000) ÔConflict, inflation, distribution and terms of trade in the Kaleckianmodel,Õ this volume.
Chick, V. and M. Caserta (1997) ÔProvisional equilibrium and macroeconomictheory,Õ in P. Arestis, G. Palma and M. Sawyer (eds) Markets, Unemployment andEconomic Policy: Essays in Honour of Geoff Harcourt, vol. 2, London, Routledge,223Ð47.
Cornwall. J. (1977) Modern Capitalism: Its Growth and Transformation, London,Martin Robertson.
Cornwall, J. (1990) The Theory of Economic Breakdown, Oxford, Basil Blackwell.Cornwall, J. (1994) Economic Breakdown and Recovery, Armonk, NY, M.E. Sharpe.Cornwall, J. and W. Cornwall (2001) Capitalist Development in the Twentieth Century:
An Evolutionary- Keynesian Analysis, Cambridge, Cambridge University Press.Economic Report of the President (2000), Washington DC, US Government Printing
Office.Epstein, G. and J. Schor (1990) ÔMacropolicy in the rise and fall of the Golden Age,Õ
in S.A. Marglin and J.B. Schor (eds) op. cit., 126Ð52.Glyn, A., A. Hughes, A. Lipietz and A. Singh (1990) ÔThe rise and fall of the Golden
Age,Õ in S.A. Marglin and J.B. Schor (eds) op. cit., 39Ð125.
Rise and decline of the Golden Age 85
Downloaded from Elgar Online by University of Melbourne at 07/12/2013 03:24:02AM
Godley, W. (1999) ÔSeven unsustainable processes: medium-term prospects and poli-cies for the United States and the world,Õ Special Report of The Jerome LevyEconomics Institute at Bard College.
Gordon, R.J. (2000) ÔDoes the Ònew economyÓ measure up to the great inventions ofthe past?Õ Journal of Economic Perspectives, 14, 49Ð74.
Gundlach, E. (2001) ÔInterpreting productivity growth in the new economy: someagnostic notes,Õ Kiel Institute of World Economics, Working Paper no. 1020.
Howes, C. (1999) ÔMust U.S. per capita income growth be constrained by slow produc-tivity growth in services?Õ Review of Radical Political Economics, 31, 30Ð9.
Kaldor, N. (1985) Economics Without Equilibrium, Cardiff, University College CardiffPress.
Lavoie, M. (2000) ÔThe Kaleckian growth model with target return pricing and conflictinflationÕ, this volume.
Marglin, S.A. and J.B. Schor (eds) (1990) The Golden Age of Capitalism:Reinterpreting the Post War Experience, Oxford, Oxford University Press.
McCombie, J.S.L. and A.P. Thirlwall (1994) Economic Growth and the Balance-of-Payments Constraint, London, Macmillan.
Oliner, S.D. and D.E. Sichel (2000) ÔThe resurgence of growth in the late 1990s: isinformation technology the story?Õ Journal of Economic Perspectives, 14, 3Ð22.
Osterman, P. (1999) Securing Prosperity: The American Labor Market: How It HasChanged and What to Do about It, Princeton, Princeton University Press.
Palley, T.I. (1998) Plenty of Nothing: The Downsizing of the American Dream and theCase for Structural Keynesianism, Princeton, Princeton University Press.
Setterfield, M. (1997) ÔShould economists dispense with the notion of equilibrium?ÕJournal of Post Keynesian Economics, 20, 47Ð76.
Setterfield, M. (2000) ÔIs recent US economic performance replicable? Some remarkson the ÒlogicÓ of neo-liberalism,Õmimeo, Trinity College.
Weisskopf, T.E. (1987) ÔThe effect of unemployment on labor productivity: an inter-national comparative analysis,Õ International Review of Applied Economics, 1,127Ð51.
86 Kaldorian models of demand-led growth
Downloaded from Elgar Online by University of Melbourne at 07/12/2013 03:24:02AM
6. The role of the balance of payments in economic growth
J.S.L. McCombie and M. Roberts
INTRODUCTION
KaldorÕs long insistence on the importance of both static and dynamic increas-ing returns to scale (broadly defined to include induced technical progress) inunderstanding the growth process has been largely vindicated by recent devel-opments in neoclassical ÔendogenousÕ growth theory. This theory assumes thatthere are no diminishing returns to capital (see Kaldor, 1977, where he is oneof the first to make this assumption). KaldorÕs argument that it is equally (oreven more) important to consider the role of demand, as opposed to the supplyside, in economic growth has, however, been largely ignored by the orthodoxy.The purpose of this chapter is to present an interpretative survey of some ofthe work that has taken forward the Kaldorian view. In particular, the role ofthe balance of payments in limiting economic growth below the maximumpotential determined by supply-side considerations is discussed. This wasimplicit in KaldorÕs earlier writings (see Thirlwall, 1987, pp. 284Ð5). It wasthe influential paper by Thirlwall (1979) that both formalized and popularizedthis approach (see Thirlwall, 1997), and it was endorsed by Kaldor (1981).
KaldorÕs views on the importance of the growth of demand did not origi-nate fully developed, but evolved over the years. Nevertheless, it is possible inhis writings to distinguish between two categories of demand that play differ-ent roles in the economic growth process. The first, which applies to a largelyclosed economy, is the role of the growth of demand emanating from the agri-cultural sector in determining the overall pace of economic growth. Thesecond, in an open economy, is the crucial role that the growth of demand orig-inating from exports plays. In both cases it is necessary, of course, for SayÕslaw not to hold, even in the long run. In other words, as Kaldor was fond ofpointing out, Ricardo was fundamentally wrong when he asserted that Ôthereis no amount of capital which may not be employed in a country becausedemand is only limited by productionÕ.
In the first case, it is not possible to understand growth without explicitlyconsidering the complementary roles played by the agricultural sector, which
87
Downloaded from Elgar Online by University of Melbourne at 07/12/2013 03:26:40AM

is subject to diminishing returns and surplus labour, and the more advancedindustrial sector. Kaldor (1975, 1977, 1996) demonstrated that there may notbe any set of relative prices that enables markets in both sectors to clear simul-taneously ensuring the full utilization of resources, and that the growth of theindustrial sector may be constrained by the lack of the growth of agriculturalpurchasing power and (to a certain extent) vice versa.
With economic development, the relative importance of the agriculturalsector in the economy clearly declines. Nevertheless, Kaldor argued that evenfor the advanced countries, the growth of exogenous demand is still the key tounderstanding relative growth performances (see Kaldor, 1981). While the lessdeveloped countries can hardly be considered to be resource-constrained,according to Kaldor, it is difficult to argue persuasively that the growth of evenadvanced countries is determined by the exogenously given growth of effec-tive employment (see Cornwall, 1977). Countries differ in their growth ratesbecause of variations in the growth of demand for their exports. That is to say,overall economic growth is ultimately constrained by the rate of growth ofexports, and it is not something that can be remedied by merely pump-prim-ing the economy in Keynesian fashion and by boosting the growth of aggre-gate demand. It is not investment, as Keynes argued, that is the key element ofexogenous demand, but, in an open economy, the growth of demand for acountryÕs exports. A common theme in both the closed and the open economyKaldorian models is the importance of the role of the (dynamic) Harrodforeign trade multiplier and the Hicks super-multiplier (Harrod, 1933; Hicks,1950).
We first consider the question as to why other forms of demand, such asinvestment, cease to be the key exogenous factors that determine the rate ofeconomic growth Ð a question which goes back to the NorthÐTiebout debateof 1956.1 The argument that changes in the exchange rate have little effect onthe growth of trade flows, and that the growth of capital flows has little effecton the balance-of-payments equilibrium growth rate is then elaborated andassessed. An extension of the balance-of-payments equilibrium growth modelin which growth becomes path dependent is then outlined. Finally, weconsider the degree to which this approach can explain the rapid growth of theEast and Southeast Asian economies. We conclude by discussing an export-ledgrowth strategy and the fallacy of composition.
EXPORT-LED GROWTH AND THE BALANCE-OF-PAYMENTS CONSTRAINT
Kaldor was by no means the first to stress the importance of the export sectoras a determinant of the overall rate of economic growth. One of the earliest
88 Kaldorian models of demand-led growth
Downloaded from Elgar Online by University of Melbourne at 07/12/2013 03:26:40AM

was North (1955), who used it to explain the growth of the Pacific Northwestof the USA, in the process of developing one of the earliest cumulative causa-tion models. North was also aware of the importance of the foreign trademultiplier Ð Ôsince residentiary industry depends entirely on demand withinthe region, it has been historically dependent upon the fate of the export baseÕ.Tiebout (1956), however, raised two potentially damaging criticisms ofexport-led growth models, although, as we shall see, these turn out not to beserious.
First, Ôthere is no reason to assume that exports are the sole, or even themost important, autonomous variable determining regional incomeÕ (Tiebout,1956, emphasis added). From the national income accounting identity and theconsumption, investment, government expenditure and import demand func-tions, the growth of demand may be expressed as yd = aa + bx where a is thegrowth of autonomous domestic expenditure and x is the growth of exports.The coefficients a and b denote the dynamic domestic and foreign trade multi-pliers (McCombie, 1993). The question is Ôwhat is so important about thegrowth of exports compared with any other autonomous increase indemand?Õ.2
Second, the theory is spatially scale-dependent, which Tiebout saw as adisconcerting feature. At one extreme, an individual is normally wholly depen-dent upon exporting labour services. At the other extreme, Ôobviously, for theworld as a whole, there are no exportsÕ (Tiebout, 1956).
Tiebout came to the conclusion that the export-base theory may be a usefulexplanation of the short-run growth of a region; but it is not the completestory, especially in a long-term context. In particular, he notes that Ôsince aregion must optimize the use of factors and residential outputs, a decline inexport activity may even be accompanied by rising regional incomeÕ.
NorthÕs (1956) reply is not particularly convincing, merely asserting thatthe exogenous growth rates of categories such as investment have only a short-term effect. The most effective rebuttal to Tiebout, which North does notmake, is that there is a major difference between the growth of exports andother components of autonomous demand, in that only the former automati-cally generates foreign earnings to pay for imports. Once this is taken intoaccount, the growth of exports is revealed as the crucial exogenous componentof demand growth (although there may be some feedback from the growth ofoutput to that of exports. In this sense, the growth of exports is weakly exoge-nous). An increase in the growth rate of exports has two effects on the growthof income. First, it increases the growth rate of income through the dynamicHarrod foreign trade multiplier. Second, by relaxing the balance-of-paymentsconstraint, it permits the growth of other ÔautonomousÕ components ofdemand. That is to say, the growth of other supposedly autonomous expendi-tures is actually endogenous to export growth. The combination of these
The role of the balance of payments in economic growth 89
Downloaded from Elgar Online by University of Melbourne at 07/12/2013 03:26:40AM

effects represents a working of the Hicks Ôsuper-multiplierÕ (McCombie, 1985;McCombie and Thirlwall, 1994, chapter 6). This answers not only TieboutÕsfirst but also his second criticism. Even though the value of exports may besmall in comparison to total income, the balance-of-payments constraint andthe super-multiplier mean that export growth is still the determining factor oftotal growth. Of course, Tiebout is perfectly correct to say that, for the worldas a whole, growth cannot be export-led. Likewise, all countries cannot besimultaneously balance-of-payments-constrained. However, all that isrequired is for one trading bloc to be Ôpolicy-constrainedÕ (the deliberaterestriction of growth due, for example, to the fear of inflation) or Ôsupply-constrainedÕ (there may be a limit to the rate at which labour can be transferredbetween sectors or capacity can be increased). This, through the operation ofthe balance-of-payments constraint, will limit the growth rates that other coun-tries can achieve, even though domestic conditions could sustain a fastergrowth rate (see McCombie, 1993).
The implications of this are far-reaching, as Kaldor has noted:
This doctrine [of the foreign trade multiplier and the super-multiplier] asserts thevery opposite of SayÕs law: the level of production will not be confined by the avail-ability of capital and labour; on the contrary, the amount of capital accumulated, andthe amount of labour effectively employed at any one time, will be the resultant ofthe growth of external demand over a long series of past periods which permittedthe capital accumulation to take place that was required for enabling the amount oflabour to be employed and the level of output to be reached which was (or could be)attained in the current period (Kaldor, 1977).
Following the seminal work of Thirlwall (1979), what may be termed theÔstandardÕ balance-of-payments-constrained growth model consists of thefollowing equations (where all variables are expressed as growth rates):3
Export demand equation: x = ez + h (pd Ð pf Ð er) [6.1]
Import demand equation: m = py Ð y ( pd Ð pf Ð er) [6.2]
Balance-of-payments identity: wx + (1 Ð w)f º m + pf + er Ð pd [6.3]
where x, m, y and z are the growth rates of exports, imports, domestic incomeand the income of the rest of the world, respectively, f is the growth of realcapital flows expressed in terms of the domestic currency and er is the growthof the nominal exchange rate (er > 0 representing a continuous appreciation ofthe currency). The subscripts d and f denote ÔdomesticÕ and ÔforeignÕ, respec-tively. The parameters e and p are the income elasticities of demand forexports and imports, while w is the share of exports in total foreign exchange
90 Kaldorian models of demand-led growth
Downloaded from Elgar Online by University of Melbourne at 07/12/2013 03:26:40AM

receipts. The parameters h (< 0) and y (< 0) are the price elasticities ofdemand for exports and imports (for ease of exposition, the own and cross-price elasticities are assumed to have the same absolute values).
One of the key differences between the Thirlwall model and the Solowneoclassical model of growth is the formerÕs emphasis on the importance,especially in highly oligopolistic markets, of non-price competition, such asquality improvements, product innovation, etc.4 This is (imperfectly) capturedby the differences between countries in the values of their income elasticitiesof demand for imports, as well as international differences in the income elas-ticities of demand for exports.5 We are not in a world where trade flowsrespond rapidly to small changes in relative prices. This allows the develop-ment of a simple model, which gives some illuminating insights into thegrowth process, but clearly further work (such as that of Greenhalgh, 1990) isneeded to model more explicitly the non-price factors that determine thegrowth of demand for imports and exports. The other difference between theThirlwall and Solow models is that growth in the former is essentiallydemand-determined.6
Underlying this model is a theory of the firm where prices are determinedby a constant mark-up over unit costs. The firm sets the price and is preparedto meet demand at this price. An element of excess capacity is maintained tomeet short-term increases in demand and a generally Keynesian approach isadopted in that investment is determined by the rate of growth of expectedfuture sales. (See Blecker, 1998, for an elaboration of the possible microfoun-dations underlying this approach.)
Substituting equations [6.1] and [6.2] into [6.3], we obtain an equation forwhat might be termed the ÔextendedÕ balance-of-payments equilibrium growthrate of the country under consideration:7
[6.4]
If changes in relative prices have no effect on the growth of income andthe weighted growth rate of capital flows is relatively insignificant (both ofwhich are generally the case, as we see below), the balance-of-paymentsequilibrium growth rate becomes ezyp = xyp, which has come to be knownas ÔThirlwallÕs lawÕ (Thirlwall, 1979). (We denote this growth rate simply byyB). If the growth of productive potential (yP ) exceeds the balance-of-payments equilibrium growth rate, the actual growth rate (yA) will be equal tothe latter. It is the growth of income that adjusts to make yA = yB < yP. Theneoclassical approach, however, has the rate of change in relative pricesrelaxing the balance-of-payments constraint, allowing yB to increase until itreaches yP.8,9
yz p p er f
Bd f
1 =+ + + - - + -we wh y w
p
( )( ) ( )1 1
The role of the balance of payments in economic growth 91
Downloaded from Elgar Online by University of Melbourne at 07/12/2013 03:26:40AM

PRICE AND NON-PRICE COMPETITION IN INTERNATIONAL TRADE
As we have noted, a central tenet of this approach is that the rate of change inrelative prices does not have a significant impact on increasing the balance-of-payments equilibrium growth rate, and hence the growth rate is given byThirlwallÕs law. This is not to say that exchange rate adjustments have noeffect on the current account at a given growth rate.10 What the empiricalevidence does suggest is that it is implausible that a devaluation can affect thelong-run growth rates of exports and imports and thereby remove the balance-of-payments constraint. Relative prices are unimportant in spite of the fact thatthey may change in the short run, either because these changes do not trans-late into sustained real exchange rate movements or, even if they do, they havelittle impact on trade flows. The reason for the former, especially in the shortrun, may be pricing to market and, in the longer term, the effect of real wageresistance.11 Knoester (1995) provides evidence of real wage resistance for theadvanced countries, which goes a long way to answering the criticism that thisis an ad hoc assumption of the model. Even if there are changes in the realexchange rate (and this has been the case post-1972, although often inresponse to capital rather than trade flows), these have little impact because ofthe importance of non-price competitiveness and the fact that the price elas-ticities of demand for imports and exports are low. (The ineffectiveness offloating exchange rates after the breakdown of Bretton Woods soon becameapparent. A floating exchange rate did not prevent the UKÕs sterling crisis of1976, which resulted in the International Monetary Fund (IMF) being calledin and subsequent deflationary policies being imposed. Nor did floatingexchange rates prevent balance-of-payments crises in, for example, Italy in1980Ð1 and France in 1982.)12
Moreover, changes in the real exchange rate are often reversed in themedium to long term. The success of a country in world markets is due toproduct innovation, namely, developing products for which world demand willrapidly grow. It is unlikely that merely reducing the prices of existing productsby squeezing costs and real wages will be a successful long-term strategy. Inother words, in the context of the long run, outward shifts of a productÕsdemand curve are more important than shifts down the demand curve.
There are now numerous studies estimating import and export demandfunctions as part of a test of ThirlwallÕs law, and these generally report esti-mated price elasticities that are either statistically insignificant, low or have apriori unexpected signs (see the discussion in McCombie and Thirlwall, 1994,chapter 3). For example, Alonso and Garcimartin (1998Ð9) estimated importand export demand functions for ten advanced countries using a disequilib-rium approach. They found that although the individual price elasticities were
92 Kaldorian models of demand-led growth
Downloaded from Elgar Online by University of Melbourne at 07/12/2013 03:26:40AM

statistically significant in many cases, the sums of the absolute values of theseprice elasticities were not large, ranging from 1.41 (Canada) to 0.57 (Sweden)(excluding Japan, which had an exceptional value of 2.43). TheMarshallÐLerner condition was satisfied in only 4 out of 10 cases. Moreover,with traditional multiplicative import and export demand functions, anincrease in the balance-of-payments equilibrium growth rate requires asustained rate of change of relative prices. For example, if w = 1, p = 1.5 andïh + yï = 1.2, relative prices must fall by 7.5 per cent per annum to bringabout a permanent increase in the rate of output growth of one percentagepoint. (This is the same order of magnitude that was found for the UK usingthe National Institute of Economic and Social Research forecasting model Ðsee McCombie and Thirlwall, 1994, chapter 10.) For the advanced countriesat least, the rate of change in relative prices necessary to raise the equilibriumgrowth rate by one or two percentage points is likely to be much too large tobe plausible.
There is also a good deal of other evidence that suggests that price compe-tition is relatively unimportant. Kravis and Lipsey (1971), for example, foundthat few firms in Germany or the USA attributed their success in exporting totheir price competitiveness. McCombie and Thirlwall (1994, chapter 4)discuss this and other evidence on the importance of non-price competitive-ness in more detail.
The price elasticities of homogeneous products are likely to be significantlyhigher than for goods characterized by significant product differentiation.There is some evidence that a devaluation, by encouraging the production ofmore homogeneous goods, may actually switch production away from themore sophisticated products for which the world income elasticity of demandis high (Brech and Stout, 1981). Thus, paradoxically, a devaluation may harmthe prospects for future export growth.
THE IMPACT OF THE GROWTH OF CAPITAL FLOWS
With increasing liberalization of international financial flows over the lastcouple of decades, it is important to see to what extent this has relaxed thebalance-of-payments constraint. The answer, as we shall see, is not to anygreat degree.
International financial markets become increasingly nervous if the netforeign debt to income ratio approaches a certain critical maximum, althoughthis value is likely to vary between countries. In the international debt crisisthat began in 1982, the debt to GDP ratio of the ÔBaker 15Õ less developedcountries reached 46.6 per cent in 1984 (see Toye, 1992, Table 1.4, p. 27). Wemay therefore infer that any figure over about 40 per cent is likely to present
The role of the balance of payments in economic growth 93
Downloaded from Elgar Online by University of Melbourne at 07/12/2013 03:26:40AM

a less developed country (and some advanced countries) with serious financialproblems. Let this maximum debt to income ratio be denoted by DyY = qmax,where D and Y are the stock of real net foreign debt and the level of realincome. Differentiating DyY with respect to time gives d(DyY)ydt =m Ð y(DyY) where m denotes the current account deficit expressed as a propor-tion of income. Setting d(DyY)ydt = 0 it follows that mmax = yqmax. In otherwords, for any given y, qmax implies that there is a maximum sustainable ratioof the current account deficit to income, and vice versa (see McCombie andThirlwall, 1997b and Moreno-Brid, 1998Ð9 for an alternative derivation ofthis relationship). Table 6.1 reports the values of mmax and qmax for givengrowth rates of income.
What is interesting is that the balance-of-payments equilibrium growth rateneed not necessarily imply that the current account should exactly balance, iffinancial markets are prepared to tolerate a certain persistent net debt toincome ratio. Moreover, the faster the growth of income (and exports), thelarger is the current account deficit that will be sustainable for any given debtto income ratio. Nevertheless, after an allowance is made for this, the effect onthe balance-of-payments equilibrium growth rate is negligible.
To see this, first assume that there is no growth in real capital flows. Fromequation [6.4] (assuming that the weighted changes in relative prices are unim-portant), the expression for the balance-of-payments equilibrium growth ratebecomes yB2 = wxyp. For a relatively open economy where the ratio of exportsto income is, say, 30 per cent and the initial current account deficit is, forexample, 2 per cent of income, w = 0.94. In other words, if we assume thatp = 1.5, the balance-of-payments equilibrium growth rate will be given by
94 Kaldorian models of demand-led growth
Table 6.1 The relationship between the growth of income, the maximum netdebt to income ratio and the maximum current account deficit toincome ratio
Growth of income Current Account Deficit to Income (% per annum) Ratio (%)
(40) (50) (60)1 0.4 0.5 0.62 0.8 1.0 1.23 1.2 1.5 1.84 1.6 2.0 2.45 2.0 2.5 3.06 2.4 3.0 3.6
Notes: Figures in parentheses are the net foreign debt to income ratios (percentage).
Downloaded from Elgar Online by University of Melbourne at 07/12/2013 03:26:40AM

yB2 = 0.63x instead of by yB = 0.67x.13 Thus, for any given growth rate ofexports, an initial balance-of-payments deficit on current account reduces theequilibrium growth rate. Or to put it another way, for any given growth rate ofincome, the growth rate of exports has to be commensurately higher if there isan initial current account deficit. But the differences are negligible. If x = 4 percent per annum, yB equals 2.67 per cent per annum when the current accountis in equilibrium. If, however, the current account deficit equals 2 per cent ofincome, yB is reduced slightly as yB 2 = 2.50 per cent per annum.
What happens if we instead assume that the ratio of the current accountdeficit to income does not alter? Again assuming no changes in relative prices,the equation for the balance-of-payments equilibrium growth rate when f = ybecomes:
yB3 = wxy(p Ð 1 + w) [6.5]
It can be seen that this growth of capital flows is unlikely to substantiallyaffect the balance-of-payments equilibrium growth rate.14 If p is greater thanunity, as is generally the case, the balance-of-payments equilibrium growthrate will be reduced. It will be unaffected if p = 1. For illustrative purposes,consider again our economy where exports are 30 per cent of income, p = 1.5,and the foreign exchange markets consider that a current account deficit of 2per cent of income is sustainable. It follows that the equilibrium growth rate isgiven by yB3 = 0.65x, whereas if there is no growth in capital flows and thecurrent account is in equilibrium, yB = 0.67x. This result proves insensitive tothe exact share of exports in income. If the figure is 10 per cent instead of 30per cent, for a current account deficit equal to 2 per cent of GDP, yB3 = 0.63xand if the share of exports in income is 50 per cent, yB3 only increases to 0.66x.
A small complication is that, as may be seen from Table 6.1, a currentaccount deficit of 2 per cent of income will lead to a stabilization of the debtto income ratio at different values, depending on the growth rate. If financialmarkets set a maximum debt to income ratio, then the maximum currentaccount deficit as a proportion of income will vary according to the growthrate. But once again, this does not significantly alter the balance-of-paymentsequilibrium growth rate. Suppose that qmax = 50 per cent. Then assumingexports account for 30 per cent of income, the growth of exports necessary forincome growth of 2 per cent per annum is 3.1 per cent per annum, instead of3 per cent when the current account balances.15 If the growth rate of incomerises to 6 per cent per annum (which, as may be seen from Table 6.1, will leadto a sustainable current account deficit to an income ratio of 3 per cent), thenecessary growth rate of exports is 9.3 per cent per annum (compared with 9per cent per annum when the current account is balanced). Again, this resultproves relatively insensitive to the degree of openness of the economy. The
The role of the balance of payments in economic growth 95
Downloaded from Elgar Online by University of Melbourne at 07/12/2013 03:26:40AM
overall picture is clear Ð even if there is a sustainable current account deficit,the quantitative impact on the equilibrium growth rate is so small that y =xyp = ezyp, i.e. ThirlwallÕs law, will give a very good approximation to thebalance-of-payments-constrained growth rate.
However, this is not to say that a rapid inflow of capital such as some lessdeveloped countries have experienced, even though unsustainable in thelong run, may not temporarily enable the growth rate to exceed thatpredicted by ThirlwallÕs law (see Thirlwall and Hussain, 1982). This may beillustrated by a final numerical example. Suppose we have a less developedcountry with exports equal to 30 per cent of income, p = 1.5, its currentaccount in balance and its net foreign debt equal to zero. Its exports aregrowing at a rapid rate of 8 per cent per annum and so yB equals 5.33 percent per annum. Let us further suppose that in year 1, there are capitalinflows equivalent to 4 per cent of income and these grow at twice the rateof exports for the next ten years. The growth of income will increase bynearly one percentage point to 6.26 per cent per annum. However, by year10, the debt to income ratio will have risen to 66 per cent and the ratio of thecurrent account deficit to income will have increased to just over 10 per cent,which is likely to be unsustainable.
RECENT TESTS OF THE BALANCE-OF-PAYMENTS-CONSTRAINED EQUILIBRIUM GROWTH MODEL
Since the publication of ThirlwallÕs (1979) seminal article, there have beennumerous attempts to test the balance-of-payments-constrained growth model.In this section, we briefly consider some of the studies that have been under-taken since those surveyed in McCombie and Thirlwall (1994), although noclaim is made for completeness. The more recent studies use modern time-series analysis, such as testing for stationarity and cointegration, but theseresults have largely confirmed the results of earlier studies. For example,Andersen (1993) took a sample of 16 OECD countries and using pooled datafor 1960Ð73, 1973Ð80 and 1980Ð90 concluded that having estimated thevalues of e and p using an error correction model, there was a close relation-ship between y and yB ÔmerelyÕ in the long run. But, of course, it is preciselyin the long run when the law is expected to hold.
In the spring edition of the 1997 Journal of Post Keynesian Economics,there was a mini symposium on ThirlwallÕs Law. Hieke (1997) showed thatthe model performed well for the USA over the period 1950Ð90, eventhough it has been able to run current account deficits for long periods.However, in the light of the discussion on capital flows above, and the factthat the current account deficit did not increase as a percentage of GDP, this
96 Kaldorian models of demand-led growth
Downloaded from Elgar Online by University of Melbourne at 07/12/2013 03:26:40AM

is not particularly surprising. During the period 1967Ð90, there was asubstantial slowdown in the growth rate of the US economy, resulting froman increase in the income elasticity of demand for imports, which reducedyB. This result was also found by Atesoglu (1995). Atesoglu (1997) showedthat the USAÕs exports and income were cointegrated over the period1924Ð94.16 This relationship broke down in the post-Bretton Woods era, butonly due to increased capital flows that made it easier to finance currentaccount deficits, rather than any relaxation of the balance-of-paymentsconstraint resulting from the increased flexibility of nominal exchangerates.
McCombie (1997) surveyed the various methods for testing ThirlwallÕs lawand revisited the law for the USA, Japan and the UK, explicitly allowing forstructural breaks in the estimation of the import demand function. Japan hasalways been treated as an outlier, with yA significantly below yB. This has beenaccompanied by the accumulation of large trade surpluses. However, it wasfound that when the import demand function was estimated using first differ-ences of the logarithms of the levels of variables, rather than the log levelsthemselves, the possibility that Japan was growing at its balance-of-payments-constrained growth rate could not be ruled out. Turner (1999) found that thepost-1973 slowdown in the growth of the G7 countries could be explained interms of the fall in the growth rate of world trade, together with the growinginternationalization of the world economy.
Bairam (1997) found that for a small sample of less developed countries(LDCs), e is negatively related to the level of per capita income while pshowed no correlation (the latter is not surprising, given the prevalence ofvarious forms of import controls in the LDCs). On the face of it, this wouldsuggest that the less developed a country is, the less likely it is to be balance-of-payments-constrained. While the possibility of a relationship between theincome elasticities of demand and the level of development is worth pursuing,Thirlwall (1997) suggests that BairamÕs sample is too small for any firmconclusions to be drawn.
Hussain (1995) has examined the relevance of ThirlwallÕs law for thedeveloping countries and suggests that the balance-of-payments constraintis more severe for the low-income African countries than for the moredeveloped Southeast Asian countries. However, in many cases the estimatesof the import demand functions are implausible, which is no doubt due tothe existence of serious errors in the measurement of income for thesecountries arising from their large informal economies and their rudimentarycollection of national income statistics. This indicates that care must betaken when testing ThirlwallÕs law for countries that are in the very earlystages of development.
Le�n-Ledesma (1999) tested ThirlwallÕs law for the Spanish economy over
The role of the balance of payments in economic growth 97
Downloaded from Elgar Online by University of Melbourne at 07/12/2013 03:26:40AM

the period 1965Ð93. Having estimated the import demand function andobtained a value of p, he used this together with mean decennial growth ratesof exports in overlapping periods to calculate yB. A close correspondencebetween yA and yB for most years was found and where there was a divergence,this was the result of a sudden change in capital flows (which were not incor-porated into the formal model). Le�n-Ledesma concludes that Ôalthough forthe periods that cover the two energy crises, the movement of relative pricesand long-run capital flows could have been expected to have played a role, thelong run regularity shows that the adjustment to balance-of-payments equilib-rium came via incomeÕ.
Moreno-Brid and Perez (1999) and Perez and Moreno-Brid (1999)considered the applicability of the model to the long-term growths of coun-tries in Central America (Costa Rica, El Salvador, Guatemala, Honduras,Nicaragua, Panama and two Caribbean countries, namely the DominicanRepublic and Haiti) over the period 1950Ð97. These countries have had aturbulent post-war experience, including stagnation during the 1980s (coin-cident with the debt crisis), and periods of political instability and repres-sion. Both studies found that growth conformed to ThirlwallÕs law, with theexception of Haiti, where other factors had led to a growth rate below thebalance-of-payments equilibrium growth rate. ÔIts [ThirlwallÕs lawÕs]empirical adequacy may be grounded on these developing countriesÕ keydependence on imported machinery, equipment and other inputs fromabroad so that the availability of foreign exchange puts a ceiling on the rateof domestic productionÕ. A significant long-term relationship between thegrowth of exports and that of GDP is found, with no evidence of any signif-icant effect of changes in the terms of trade on growth. Moreno-Brid (1999)also considered the degree to which MexicoÕs growth could be explained interms of the balance-of-payments-constrained growth model. The resultsconfirmed a positive and statistically significant cointegrating relationshipbetween real GDP and exports over the period 1950Ð96. Interestingly,Mexico experienced sustained and rapid growth until the debt crisis of 1982and a subsequent period of slow growth punctuated by balance-of-paymentscrises. The latter period was not accompanied by any marked slowdown inthe growth rate of exports (their growth rate actually increased). Instead,there was a marked increase in the income elasticity of demand for importsfrom 1.04 over the period 1950Ð81 to 2.47 for 1982Ð96. This reduced thebalance-of-payments equilibrium growth rate and is attributed by Moreno-Brid to the end of import substitution policies in Mexico and the liberaliza-tion of trade.
These studies suggest that, at the very least, explanations of long-rungrowth that ignore the role of demand and economic openness are likely to beincomplete.
98 Kaldorian models of demand-led growth
Downloaded from Elgar Online by University of Melbourne at 07/12/2013 03:26:40AM
CUMULATIVE CAUSATION, THE BALANCE-OF-PAYMENTS EQUILIBRIUM GROWTH RATE AND STRUCTURAL CHANGE
A major theme in KaldorÕs later writings is that growth is a historical, ratherthan an equilibrium, process. It is to be understood not by reference to unex-plained, exogenously determined data as in, say, the Solow model, but byreference to the growth path that has previously been traversed. Probably theclearest statement of this is Kaldor (1972) and, although this emphasis isusually contrasted with his attempts to model the growth process prior to his1966 inaugural lecture, Setterfield (1998) has persuasively argued that theorigins of KaldorÕs interest in path dependency may be traced back muchfurther, in particular, to one of his earliest papers, ÔA classificatory note on thedeterminateness of equilibriumÕ, published in 1934.
However, despite this, the ÔstandardÕ cumulative causation model of Dixonand Thirlwall (1975) that is often taken as providing a formal representationof KaldorÕs post-1966 views on the growth process is essentially a model ofequilibrium growth.17 This is equally true of ThirlwallÕs law.
These models are not, therefore, completely in accord with KaldorÕs viewsof the growth process. Setterfield (1997) has suggested that perhaps the tran-sitional dynamics of the DixonÐThirlwall model are so slow that, in fact, allwe generally observe is disequilibrium growth. If this were so, it would miti-gate the seriousness of the problem, although not entirely remove it. This isbecause during the disequilibrium phase of growth in the standard cumulativecausation model, an economyÕs growth rate is a function of its assumed initialgrowth rate. However, as has been shown by Roberts (2001a), for reasonableparameter and exogenous variable values, the modelÕs transitional dynamicsoperate extremely rapidly Ð indeed, much more quickly than in standardneoclassical growth models.
More interestingly, Setterfield (1997) has suggested that an alternativeapproach to overcoming the inconsistency is to acknowledge that the exoge-nous parameters of the standard cumulative causation model are, in reality,Ôdeeply endogenousÕ.18 That is to say, they are not data that are fixed inde-pendently of an economyÕs past growth performance. Rather, there is a feed-back from an economyÕs past growth performance to the values of the modelÕsparameters, thereby rendering them dependent on its historical growth path.Thus, for example, Setterfield suggests that the income elasticity of demandfor an economyÕs exports is a function of its past growth rates of output: thatis, et = f (y0, y1, . . ., yi, . . ., ytÐ1) where ¶fy¶yi 0.19 In particular, he arguesthat, at least for mature economies, previous fast growth rates of output arelikely to have a negative effect on the income elasticity of demand for an econ-omyÕs exports. This is because, if a country is to succeed in international
The role of the balance of payments in economic growth 99
Downloaded from Elgar Online by University of Melbourne at 07/12/2013 03:26:40AM

markets, it must, over time, keep up with the movement of internationalconsumer demand through a commodity hierarchy. However, to do so requiresa continual adaptation of the structure of production. Fast growth rates inprevious periods might make this difficult because they tend to encourage thelock-in of a production structure that subsequently becomes outmoded.20
One problem, formally speaking, is that specifying the income elasticity ofdemand for exports to be a negative function of previous growth rates is not asufficient condition for removing the equilibrium properties of the standardcumulative causation model. Indeed, such a specification actually makes theequilibrium of the standard model more stable. This implicitly follows fromRobertsÕs (2001a) demonstration that specifying the income elasticity ofdemand for exports to be a positive function of the previous periodÕs growthrate slows down the transitional dynamics of the standard model. What isneeded to transform the standard model into a truly historical model of growthis not only to specify the income elasticity of demand as a function of pastgrowth rates, but as a strongly non-linear function of past growth rates (seeRoberts, 2001b). In particular, while high values of previous growth rates maybe allowed to have the negative impact on the income elasticity postulated bySetterfield, low values of previous growth rates must have a positive impact.This can be justified on the grounds that while high values of previous growthrates may be expected to give rise to the forces for lock-in that Setterfielddescribes, low values cannot. Rather, one would expect poor previous growthperformance to give rise to a sense of dissatisfaction and thus to pressure forreform of an economyÕs production structure. This dissatisfaction can beexpected to arise at two levels. The first is at the political level as the electoratebecomes dissatisfied with poor growth rates, and the high levels of unem-ployment and low rates of real wage growth that inevitably accompany such apoor performance. The second is at the level of production itself, as share-holders become dissatisfied with the rates of return being earned on theirinvestments.
However, our concern in this study is not with the standard cumulativecausation model, but with the balance-of-payments-constrained growth model.Yet, identical considerations to those discussed above apply here. In thismodel, an economyÕs growth rate is traditionally specified as independent ofits past growth performance. This is because the income elasticities of demandfor imports and exports have been assumed to be exogenous. However, theincome elasticities of demand do in fact change, albeit generally slowly, asrelative non-price competitiveness changes. It therefore follows that while themodel captures the KaldorÐThirlwall idea that the balance-of-payments acts asa constraint on growth, it is inconsistent with KaldorÕs wider views concern-ing the historical nature of the long-run growth process. Furthermore, itfollows that one can overcome this problem by respecifying the exogenous
100 Kaldorian models of demand-led growth
Downloaded from Elgar Online by University of Melbourne at 07/12/2013 03:26:40AM

parameters in this model as deeply endogenous functions of previous growthrates, with the functional forms being assumed to be strongly non-linear. Inparticular, for expositional purposes assume that:
(eyp)t = g1 + g2(f Ð ytÐ1)ytÐ1 g1 > 0, g2 > 0 [6.6]
Where g1, g2 and f are constants, equation [6.6] specifies that the currentratio of the income elasticity of demand for an economyÕs exports to its incomeelasticity of demand for imports is a strongly non-linear function of its pastgrowth performance, as represented by the growth rate of income in the previ-ous period, ytÐ1. It should be noted that the non-linearity is such that the ratio ofe to p is increasing with ytÐ1 at low levels of ytÐ1, but decreasing with ytÐ1 at highlevels of ytÐ1. This reflects the intuition outlined above that poor previousgrowth rates can be expected to give rise to pressure for reform, while highprevious growth rates can be expected to encourage lock-in. Also, note that ithas been assumed that it is the ratio of e to p rather than just e that is deeplyendogenous here. This is plausible because, given that they both reflect aneconomyÕs non-price competitiveness, e and p tend to be jointly determined.Thus, reform of an economyÕs production structure can be expected to not onlyincrease its value of e, but also reduce its value of p. Conversely, lock-in of aproduction structure that subsequently becomes outmoded can be expected notonly to reduce its value of e, but also increase its value of p.
Upon substituting equation [6.6] into ThirlwallÕs law, growth emerges as ahistorical process for plausible parameter and exogenous variable values. Forexample, assume g1 = 0.70, g2 = 746.123, f = 0.10 and that the growth rate ofworld income is constant at 4 per cent per annum. These values imply that eypis bounded from above by the value 2.565 and from below by the value 0.50 Ðvalues that are very similar to those experienced by Japan and the UK, respec-tively, during the period 1955Ð65 (see Houthakker and Magee, 1969;McCombie and Thirwall, 1994; Krugman, 1989). The emergence of growth asa historical process in the model is depicted in Figure 6.1, which illustrates agrowth path that commences from point A.
Examining Figure 6.1, it makes more sense to think of the periods t not ascalendar years, but as growth eras. The figure shows the model economy evolv-ing through a seemingly random series of growth eras, each growth era givingrise to the forces that bring about eventually, for better or for worse, its owndemise. The seeming randomness of the growth era changes reflects the fact thatthe depicted dynamics are chaotic in nature, and it is this that makes the modela truly historical one of the growth process. This is because the chaotic dynam-ics rule out the existence of a determinate equilibrium growth rate at which theeconomy will settle down. Furthermore, they mean that it is not possible topredict an economyÕs future pattern of growth era changes without knowing its
The role of the balance of payments in economic growth 101
Downloaded from Elgar Online by University of Melbourne at 07/12/2013 03:26:40AM

growth rate during the current era with infinite precision, something thatmeasurement and sample errors in data collection make impossible. This, in turnimplies that the behaviour of the economy is strongly path dependent.
This approach is suggestive of the way future research may go, rather thanbeing a definitive method. But it certainly accords with KaldorÕs views ongrowth, according to which the state of the economy Ôcannot be predictedexcept as a result of [perfect knowledge of] the sequence of events in previousperiods [eras] which led up to itÕ (Kaldor, 1972).21
THE EAST ASIAN MIRACLE AND THIRLWALLÕS LAW
We now briefly consider the implications of ThirlwallÕs law for economicdevelopment. We do not undertake any new statistical testing but show that thebalance-of-payments-constrained growth approach can be a useful one forunderstanding development strategies.
102 Kaldorian models of demand-led growth
0.15
0.10
0.05
0.05 0.10 0.15Ð0.05
Ð0.05
Ð0.10
yt
yt Ð1
A
45° line
Figure 6.1 The balance-of-payments equilibrium growth rate when e/pchanges endogenously
Downloaded from Elgar Online by University of Melbourne at 07/12/2013 03:26:40AM

The term Ôeconomic miracleÕ has been justifiably used in the case of anumber of East Asian countries that have achieved unprecedented high ratesof both total and per capita output growth over the last three decades. The mostnotable successes are what have come to be known as the four ÔAsian TigersÕ(Hong Kong, South Korea, Singapore and Taiwan). Over the period 1965Ð96,the Tigers averaged growth rates of output per capita in excess of 6 per centper annum. This is truly remarkable, given that these growth rates weresustained for more than 30 years. The Southeast Asian economies (Indonesia,Malaysia, the Philippines and Thailand) also grew rapidly on the coat-tails ofthe Tigers. Over the same 30-year period their average per capita growth rateswere around 4 per cent per annum.22
The causes of the rapid growth of the East Asian Tigers are still unresolved,but there are two main explanations. The first, stemming from the detailedgrowth accounting approach of Young (1992, 1995), and popularized byKrugman (1994), suggests that growth was largely the result of the rapidincrease of factor inputs. On the other hand, the ÔassimilationistsÕ stress therole of the diffusion of innovations from the more advanced countries (seeNelson and Pack, 1999, for a recent discussion of these views and one whichtends to support the latter interpretation). There is not space here to discussthese competing explanations: suffice it to say that most of the evidence seemsto be that growth was export-led, resulting in high rates of capital accumula-tion. There has also been a debate about whether growth was, in WadeÕs (1990)terms, based on the Ôfree marketÕ, the Ôsimulated free marketÕ (where govern-ments intervened to correct distortions and hence attempted to simulate thefree market) or the Ôgoverned marketÕ (where there was active governmentintervention). WadeÕs careful analysis of the somewhat conflicting evidencesuggests that the governed market was the rule rather than the exception. It isalso noticeable that in much of neoclassical growth theory, there is virtually nomention of international trade or the growth of exports except where it is todiscuss technological externalities or spillovers. Yet discussions of the Asianmiracle, whether from a neoclassical or any other viewpoint, are often centredon the role of exports, although there is controversy over the direction ofcausation.
There has been a plethora of cross-country regression studies using varioussamples of advanced countries and LDCs that have attempted to explain thedeterminants of growth. Of particular interest in this context is the study ofThirlwall and Sanna (1998). Surveying the literature, they note that when atrade variable is included Ôit is invariably insignificant or loses its significancewhen combined with other variablesÕ. But in many studies this is because theeffect of trade appears to work through investment. ÔIf this is the case, it is aninteresting and significant conclusion, because it means that many of the stud-ies would support the Keynesian/post-Keynesian position that it is not saving
The role of the balance of payments in economic growth 103
Downloaded from Elgar Online by University of Melbourne at 07/12/2013 03:26:40AM

that drives investment, but trade and the growth of output itselfÕ. Their ownempirical work suggests that export growth (as opposed to static measures ofthe degree of openness such as the ratio of exports to GDP) is a significantdeterminant of economic performance and that the debt-service ratio is also animportant constraint on economic growth in developing countries.
In the East Asian countries, it was deliberate government policy (at leastinitially) to encourage the development of those exports for which worlddemand was either growing, or was likely to grow fast. The export structure inEast Asia has, in the words of the World Bank (1998), Ôbecome characterizedby (a) early exit from low-skill labour-intensive exports; (b) specialization inhigh-technology exports, and (c) strong inter-regional linksÕ. In terms of thebalance-of-payments-constrained growth model, this led to high income elas-ticities of demand for the regionÕs exports that enabled a fast growth ofdemand through the dynamic Harrod trade multiplier and the Hicks super-multiplier.23
Although their sample period is now somewhat dated, Bairam andDempster (1991) have provided some estimates of balance-of-payments equi-librium growth rates for four of the East Asian countries, namely, Singapore,Indonesia, the Philippines and Thailand. Their results are presented in Table6.2.
It can be seen that both specifications of ThirlwallÕs law give a good approx-imation to the observed growth rates of the East Asian countries. A corollary isthat capital flows and the rate of change of relative prices had little impact onthe equilibrium growth rate (it should be remembered that this period wasbefore financial liberalization led to a rapid increase in short-term capitalflows). In all cases but one, the estimated price elasticities of demand were notstatistically different from zero, and in the one case where a price elasticity wassignificant (the price elasticity of demand for exports for Indonesia), it took thewrong sign. The key to the fast growth rates of these countries was thus theespecially high income elasticities of demand for their exports.
104 Kaldorian models of demand-led growth
Table 6.2 Balance-of-payments equilibrium growth rates in selected Asianeconomies
Country Period e p yB = ezyp yB = xyp y
Singapore 1973Ð80 7.9 3.6 7.5 9.2 8.2Indonesia 1966Ð85 3.5 2.7 4.8 7.9 6.5Philippines 1961Ð85 2.6 2.4 4.1 4.1 4.4Thailand 1961Ð85 3.4 1.9 6.8 7.0 6.9
Source: Bairam and Dempster (1991).
Downloaded from Elgar Online by University of Melbourne at 07/12/2013 03:26:40AM

More recently, Ansari, et al. (2000) have undertaken a further analysis ofthe applicability of ThirlwallÕs law to Indonesia, Malaysia, the Philippines,and Thailand over the period 1970Ð96. The terminal date was chosen toexclude the period of the East Asian financial crisis. They calculated the aver-age balance-of-payments-constrained growth rate (excluding any allowancesfor the growth of capital flows) for these four countries to be 5.41 per cent perannum, while their actual average growth rate was 6.40 per cent per annum.The difference between the actual growth rate, y and yB was only statisticallysignificant in the case of Thailand, where y > yB. Ansari et al. attribute this tothe marked deterioration in ThailandÕs trade deficit as a percentage of GDPafter 1983, which resulted from the decline in export earnings of tin, sugar andtapioca. The imposition of quota restrictions further exacerbated the situation.It is interesting to note that this explanation is couched in terms of the relativefailure of export performance, rather than in terms of physical supplyconstraints. It is also instructive to note that while the price term took the apriori expected sign in Ansari et al.Õs regressions, it was only statisticallysignificant in the case of the Philippines. In the cases of Indonesia, Malaysiaand the Philippines, Ansari et al. conclude that ÔThirlwallÕs proposition cannotbe rejected . . . The main policy implication is that these countries shouldcontinue to follow the outward-looking growth strategy with emphasis onexport performance for a continued high rate of economic growthÕ.
As we have seen above, the achievement of a high income elasticity ofdemand for exports is not the result of a once-and-for-all effort. Over time,with technical change and product innovation, world tastes and sectoraldemand are continually changing, and to maintain a growth rate above theworld average requires a continual process of rapid structural change. Basedon his work on what constitutes a successful development strategy, Wade(1990, p. 362), following some sceptical comments on the effectiveness ofdevaluation, emphasized the importance of non-price competitiveness,broadly defined:
Where, nevertheless, heavy reliance is to be placed on trade, the government mustrecognise that successful exporting of manufactured goods to richer countries is notjust a matter of getting the exchange rate right and keeping labour cheap, in theabsence of protection. This is because many kinds of manufactured exports to richercountries are only saleable as complete packages meeting all buyer specifications,including packaging, labelling, colors, raw materials, finishes and technical specifi-cations. Costs rule out the option of importing an incomplete or defective packageand correcting the defects in a subsequent stage of manufacturing. Thus, marketing,transmission of information and quality control turn out to be the key activities forexport success. Buyers can supply some of these services; but especially because ofexternalities the government also has an important role. The government canarrange for information about foreign markets and about domestic suppliers to beeasily and freely available; it can directly help the promotion of some products (e.g.
The role of the balance of payments in economic growth 105
Downloaded from Elgar Online by University of Melbourne at 07/12/2013 03:26:40AM

through trade fairs); and it can help to curb the tendency of firms without brandnames to compete by producing shoddy goods, spoiling the countryÕs reputation forother producers. Very importantly, the government can also inspire producers toseek out export markets as a normal part of their operations.
Nevertheless, there are limits to a strategy of export-led growth, and we nowturn to a consideration of this.
EXPORT-LED GROWTH STRATEGIES AND THEFALLACY OF COMPOSITION
One potential criticism that needs to be examined is that the export-led growthstrategy is flawed as it is subject to a fallacy of composition. As alreadymentioned, Tiebout (1956) correctly pointed out that, for the world as a whole,growth cannot be export-led. Moreover, there are problems for individualcountries, especially the LDCs, in trying to promote export-led growth, espe-cially if they concentrate on similar industries. A particular country willinevitably face fierce competition from other countries in the same position,and may find that a successful growth strategy can only be achieved at theexpense of another country. But ironically, while this could be treated as aweakness of the balance-of-payments-constrained growth model, precisely theopposite is the case. The fact that all countries are unlikely to be able to gener-ate fast rates of growth of exports that will enable them to raise their rate ofgrowth to that of their productive potential shows the importance of the exter-nal constraint. There is the danger of confusion here between the export-ledgrowth theory and the balance-of-payments-constrained growth theory. Theearly export-led growth theories did not incorporate a balance-of-paymentsconstraint (see, for example, Beckerman, 1962). To argue that an export-ledgrowth strategy for a particular country is necessary for rapid growth not to behindered by balance-of-payments crises is not the same as implying that allcountries can simultaneously achieve any growth rate of exports they desire.It has been argued that, in the long run, the only effective strategy is to encour-age production of those goods for which there is a high world income elastic-ity of demand.24 But if a number of countries are simultaneously trying tofollow such a policy and, especially if they are concentrating on the samegroup of export industries, the end result may be that only a few of the coun-tries will, ex post, achieve a marked increase in e. The others may simply havebeen running fast to stay still, and concomitantly, excess capacity maydevelop.25 In fact, one could argue that if the simple export-led growth theorydid not suffer from a fallacy of composition, there could be no such thing asbalance-of-payments-constrained growth in the long run.
106 Kaldorian models of demand-led growth
Downloaded from Elgar Online by University of Melbourne at 07/12/2013 03:26:40AM

The problem is that by generating a rapid domestic expansion, countriesexperience a rapid increase in imports from other countries. If they cannotincrease their growth of exports pari passu, then they are likely to encountera balance-of-payments crisis. This problem may be compounded by the factthat the additional imports need not be supplied by the countries to which theeconomies in our example are trying to export. There may be a geographicalmismatch in the composition of the growth of demand, which would need tobe analysed in a three-country model. The problem is also exacerbated bysome countries (such as Japan) running substantial trade surpluses. An impli-cation is that persuading these countries to open their markets may be one wayto increase the growth rates of balance-of-payments-constrained economies,although this will be a one-off effect. Far more damaging to the growth of, forexample, the Asian countries for which Japan provides the major exportmarket has been the substantial decline in JapanÕs growth rate since the mid-1970s.
Kaldor (1981) was fully aware of all this, and summarized the situation asfollows. The newly industrializing countries (NICs) will generate increasedexport penetration in the advanced countries. The resulting increase in thegrowth of income in the NICs will, in turn, stimulate the growth of demand forthe industrial countriesÕ exports. But as Kaldor remarks:
there is no guarantee that if we take any arbitrarily chosen pair of countries, or evena group of ÔdevelopedÕ or developing countries . . . that these two changes Ð reducedexport share of the older industrialized countries and the increase in total worlddemand Ð will fully offset one another. Taking any individual manufacturingexporter, the tendency to such an offset (which is the same as the tendency for acountry to gravitate to a state of equilibrium in its external balance of payments)may well be brought about through variations in growth rates.
If we were in a neoclassical world where countries faced an infinitely elas-tic price elasticity of demand for their exports, there could be no such thing asa balance-of-payments constraint. The foreign exchange revenue required tofund the growth in imports would be generated through an increased growthin exports resulting from an infinitesimal rate of change of relative prices.Likewise, if through industrial policies countries could actually increase theincome elasticities of demand for their exports irrespective of the actions ofcompetitor countries, then, in the long run, the balance-of-payments constraintwould no longer exist. But it should be remembered that if a group of coun-tries are following this strategy in a related product area, ex post, none of themmight find that their income elasticity of demand for a particular type of exporthas risen to any large extent. There are limits to the rate of growth of exportson a global scale, which in fact imposes a constraint on the growth rates ofindividual countries, and which constrains their rate of economic growth
The role of the balance of payments in economic growth 107
Downloaded from Elgar Online by University of Melbourne at 07/12/2013 03:26:40AM

below its potential. This does not mean, however, that there is necessarily anymore efficient method of increasing the rate of growth. It would be erroneousto interpret ThirlwallÕs law as implying all countries could, by pursuingexport-led growth strategies, simultaneously achieve any desired rate ofgrowth of output.
CONCLUSIONS
This chapter has discussed one major aspect of the Kaldorian approach toeconomic growth, namely the importance of the growth of autonomousdemand. In particular, it has been shown that, in open economies, the key tounderstanding a countryÕs economic growth is to be found in the performanceof its exports, or rather in the ratio of the income elasticities of demand forexports and imports together with the growth rate of the rest of the world Ð asencapsulated in ThirlwallÕs law. A corollary of this is that changes in relativeprices do not affect the growth rates of exports and imports, at least in the longrun, and that the growth of capital flows does not significantly raise thebalance-of-payments-constrained growth rate in the long run. It has beenshown that recent tests of ThirlwallÕs law have confirmed the results of earlierstudies that support the law. Estimates of balance-of-payments-constrainedgrowth rates generally closely approximate actual growth rates.
As Davidson (1990Ð1) has noted, problems will arise for LDCs if theyconcentrate on exporting raw materials and other basic commodities for whichEngelÕs law suggests the advanced countries have low income elasticities ofdemand. This is the case even though the static comparative advantage ofLDCs lies in these goods. Furthermore, if these countries also have a highincome elasticity of demand for the manufactured products of the advancedcountries, then their balance-of-payments-constrained growth rates will becommensurately lower than those of the advanced countries. This suggeststhat Ôif economic development and balance of payments equilibrium is left tothe free market then [ThirlwallÕs law] indicates that the LDCs are condemnedto relative poverty, and the global inequality of income will become largerover timeÕ (Davidson, 1990Ð1). Convergence in productivity levels and percapita income is by no means assured by the operation of market forces.
NOTES
1. For a discussion of KaldorÕs agriculture/industry two-sector model and a more detailed treat-ment of some of the issues raised in this paper, see McCombie and Roberts (2000). KaldorÕsemphasis on the role of increasing returns in economic growth is considered by McCombie(2002).
108 Kaldorian models of demand-led growth
Downloaded from Elgar Online by University of Melbourne at 07/12/2013 03:26:40AM
2. The growth of autonomous demand could also be the growth of agricultural demand. Thetransition between agricultural-led and export-led growth is not satisfactorily modelled atpresent and awaits the attention of future researchers. Thirlwall (1986) makes some sugges-tions as to how this may be accomplished.
3. Thirlwall (1997) provides an interesting discussion of the derivation of this approach and therelationship of his work to that on similar lines by Kaldor. Although Kaldor never devised aformal model, he intuitively saw many of its conclusions. In 1977, two UK governmenteconomists questioned whether the UK had a balance-of-payments problem since, whileimports as a proportion of GDP had grown markedly over the postwar period, so too hadexports. But as Kaldor pointed out, any autonomous increase in the share of imports innational income reduces demand for domestic goods and investment Ôuntil a sufficientcontraction occurs in the gross domestic product relative to exports to make the spontaneousrise in one ratio to be matched by an induced increase in the otherÕ. Kaldor (1981) presentsan analysis using ThirlwallÕs balance-of-payments-constrained growth model to explaingrowth rate differences.
4. More recent neoclassical trade and endogenous growth models are, however, beginning toconsider these factors.
5. Note that it is the relative differences, not the absolute values, of the income elasticities thatmatter. Although the average values of e and p may fall in the long run, this will not preventsome countries still being balance-of-payments-constrained.
6. The earlier ÔstandardÕ model of cumulative causation of Dixon and Thirlwall (1975), whichdid not include a balance-of-payments equilibrium constraint, had the Verdoorn law as anintegral part. (The Verdoorn law is the empirical relationship which shows that a fastergrowth of output induces a faster growth of productivity. See McCombie and Thirlwall,1994, chapter 2.) Starting from an initial position, an increase in the growth rate will, via theVerdoorn law, give rise to a positive feedback through an improvement in relative prices.However, given plausible parameter values, the growth rates in the model will converge toan equilibrium rate. It is a straightforward matter to include the Verdoorn law in the modelabove. However, given the fact that relative prices play an unimportant role in the model,the Verdoorn law instead leads to a faster-growing country having a faster growth of realwages (assuming rates of exogenous productivity growth are the same for all countries). It,therefore, does not affect the balance-of-payments equilibrium growth rate. Thus, for expo-sitional ease, we have not incorporated it into the balance-of-payments-constrained model.
7. While this incorporates the balance-of-payments identity, equation [6.4] is not itself an iden-tity. There is no reason, a priori, why the two income elasticities of demand should be statis-tically significant. Indeed, under the neoclassical approach where changes in relative pricesequilibrate the balance of payments, there is no theoretical reason why this should be thecase.
8. The balance-of-payments-constrained growth model has not been without its critics. For adiscussion of the more important objections that have been raised concerning this approachtogether with a rebuttal, see McCombie and Thirlwall (1997a).
9. See McCombie (1993) for a generalization to a two-country model and one that also explic-itly includes the domestic determinants of economic growth.
10. Thus the approach does not simply assume that changes in relative prices have no effect atall on trade flows, as is sometimes erroneously asserted.
11. Real wage resistance implies that relative purchasing power parity holds. This should not beconfused with the neoclassical theory of absolute purchasing power parity.
12. Kaldor, who had originally been an advocate of floating exchange rates, soon changed hismind in the light of this experience.
13. Note that as exports are growing faster than income and imports, both w and the currentaccount deficit will decrease slowly over time. If exports grow at 8 per cent per annum overa ten-year period, the average value of w is 0.95. However, we shall ignore this minorcomplication here.
14. It is assumed that (p Ð 1 + w) > 0, which implies (1 Ð w)yp < 1. To see what happens if thisis not the case, let us assume that ft = ytÐ1 (where we have dropped the subscript B3 for nota-tional ease) and xt = xtÐ1 = x. If (1 Ð w)yp > 1, the solution to the difference equation
The role of the balance of payments in economic growth 109
Downloaded from Elgar Online by University of Melbourne at 07/12/2013 03:26:40AM

yt = wxyp + (1 Ð w)ytÐ1yp is explosive and there is no balance-of-payments equilibriumgrowth rate. It should also be noted that unless p = 1, w will change slowly over time. Theintuition is that w will only be constant if both x and f are equal to the growth of total foreignexchange receipts and thus imports. Given that y is a weighted average of x and f this canonly occur if m = y. However, m = y will only hold, and hence w will only be constant, ifp = 1. If p >1, which is empirically likely to be the case, there will be global stability withw converging to 1, thus yielding ThirlwallÕs law (yB = xyp). If p < 1, then there is onlysaddle-path stability and, in general, w will tend to explode (Barbosa-Filho, 2001). In thelatter case, the government will have to use exchange rate adjustment or, as this is likely tobe ineffective, alter the growth rate by domestic demand management policies to take theeconomy on to the stable manifold. The discussion in the text assumes that the length of theperiod is such that w is approximately constant.
15. If qmax = 50 per cent, then if y is 2.0 per cent per annum, the maximum sustainable currentaccount deficit to income ratio is 1 per cent (see Table 6.1). Thus, from yB3 = wxy(p Ð1 + w), it follows that yB3 = 2.0 = 0.645x per cent per annum, or x = 3.1 per cent per annum.
16. See also the chapter by Atesoglu in this volume.17. Dixon and Thirlwall (1975) argued that Ôit also serves some purpose to give a not (unreal-
istic) specification which suggests on empirical grounds that divergence is not very likely, ifonly to induce those who adhere to the cumulative causation model to specify more preciselythe model they have in mind and to show the conditions under which regional growth rateswould diverge through timeÕ. They argue that the most likely extension would be that Ôtheprice and income elasticities could change in the course of time as the structure of produc-tion changedÕ. We show below how this may be accomplished in the context of the balance-of-payments-constrained growth model.
18. See also the chapter by Setterfield in this volume.19. He gives another example of this mechanism as affecting the value of the Verdoorn coeffi-
cient.20. Conversely, it is possible that a more rapid rate of growth, through generating a faster rate
of capital accumulation, may induce enterprise (rather than defensive) investment Ð to useLamfalussyÕs term Ð together with a faster increase in R&D expenditure and product inno-vation. This may actually lead to higher values for the world income elasticities of demandfor a particular countryÕs exports.
21. Figure 6.1 indicates that the rationale required to justify the non-linear functional form spec-ified for eyp is slightly more subtle than is indicated in the main text. This is because to theleft of the intersection between the curve depicting the function and the 45¡ line, the gapseparating the two at first increases before proceeding to decline. The implication is that thepressure for reform must have a positive (absolute) impact on eyp that at first increases withytÐ1 before then declining. This can be justified by arguing that reform of an economyÕsproduction structure is a costly business. At low levels of ytÐ1, a marginally higher ytÐ1 is thenassociated with greater positive reform because the higher ytÐ1 provides more revenue toboth government and firms to finance reform measures. However, at higher levels, a margin-ally higher ytÐ1 is associated with less positive reform because the pressure for change hasdiminished to a level where revenue to finance what is demanded is no longer a problem.
22. 1997 saw the onset of the East Asian financial crisis which caused a collapse in growth ratesin the region. It is beyond the scope of this study to consider the causes of this save to notethat, currently, there has been some recovery in East Asian economic performance. For asurvey of the issues involved, see Nixson and Walters (1999).
23. It should not be forgotten that a vibrant export sector is important for other reasons, espe-cially in LDCs. The more open an economy, the greater the degree of competition and thefaster the rate of diffusion of innovations. A faster growth of exports also means that foreignexchange earnings grow more rapidly, allowing a greater growth of imports of advancedtechnological capital equipment. Trade also allows greater specialization in production andhence enhanced possibilities of benefiting from economies of scale (see Edwards, 1993, fora survey).
24. Hence an industrial strategy (infant industry protection, export subsidies, etc.) may be neces-sary to improve the rate of growth of exports.
110 Kaldorian models of demand-led growth
Downloaded from Elgar Online by University of Melbourne at 07/12/2013 03:26:40AM
25. An implication is that to increase the success of an export-led growth strategy, countries,especially the LDCs, should not concentrate on the same broad product areas.
REFERENCES
Alonso, J.E. and C. Garcimartin (1998Ð9) ÔA new approach to the balance-of-paymentsconstraint: some empirical evidence,Õ Journal of Post Keynesian Economics, 21,259Ð82.
Anderson, P.S. (1993) ÔThe 45¡-rule revisited,Õ Applied Economics, 25, 1279Ð84.Ansari, M., N. Hashemzadeh and Y. Xi (2000) ÔThe chronicle of economic growth in
Southeast Asian countries: does ThirlwallÕs law provide an adequate explanation?ÕJournal of Post Keynesian Economics, 22, 573Ð88.
Atesoglu, H.S. (1995) ÔAn explanation of the slowdown in U.S. economic growth,ÕApplied Economics Letters, 2, 91Ð94.
Atesoglu, H.S. (1997) ÔBalance-of-payments-constrained growth model and its impli-cations for the United States,Õ Journal of Post Keynesian Economics, 19, 327Ð35.
Bairam, E.I. (1997) ÔLevels of economic development and appropriate specification ofthe Harrod foreign-trade multiplier,Õ Journal of Post Keynesian Economics, 19,337Ð44.
Bairam, E.I. and G.J. Dempster (1991) ÔThe Harrod foreign trade multiplier andeconomic growth in Asian countries,Õ Applied Economics, 23, 1719Ð24.
Barbosa-Filho, N.H. (2001) ÔThe balance-of-payments constraint: from balanced tradeto debt sustainability,Õ paper presented to the 2001 meeting of the Eastern EconomicAssociation, New York.
Beckerman, W. (1962) ÔProjecting EuropeÕs growth,Õ Economic Journal, 72, 912Ð25.Blecker, R.A. (1998) ÔInternational competitiveness, relative wages, and the balance-
of-payments constraint,Õ Journal of Post Keynesian Economics, 20, 495Ð526.Brech, M.J. and D. Stout (1981) ÔThe rate of exchange and non-price competitiveness:
a provisional study within UK manufactured exports,Õ Oxford Economic Papers, 33,268Ð81.
Cornwall, J. (1977) Modern Capitalism: Its Growth and Transformation, London,Martin Robertson.
Davidson, P. (1990Ð1) ÔA Post Keynesian contribution to ÔtheoryÕ,Õ Journal of PostKeynesian Economics, 13, 298Ð303.
Dixon, R.J. and A.P. Thirlwall (1975) ÔA model of regional growth-rate differences onKaldorian lines,Õ Oxford Economic Papers, 27, 201Ð14.
Edwards, S. (1993) ÔOpenness, trade liberalization and growth in developing coun-tries,Õ Journal of Economic Literature, 31, 1358Ð93.
Greenhalgh, C. (1990) ÔInnovation and the trade performance in the United Kingdom,ÕEconomic Journal, 100, 105Ð18.
Harrod, R.F. (1933) International Economics, Cambridge, Cambridge University PressHicks, J.R. (1950) A Contribution to the Theory of the Trade Cycle, Oxford, Oxford
University Press.Hieke, H. (1997) ÔBalance-of-payments-constrained growth: a reconsideration of the
evidence for the U.S. economy,Õ Journal of Post Keynesian Economics, 19, 313Ð25.Houthakker, H. and S. Magee (1969) ÔIncome and price elasticities in world trade,Õ
Review of Income and Statistics, 60, 111Ð25.Hussain, M. (1995) ÔThe balance of payments and growth,Õ African Development
Report (African Development Bank).
The role of the balance of payments in economic growth 111
Downloaded from Elgar Online by University of Melbourne at 07/12/2013 03:26:40AM

Kaldor, N. (1934) ÔA classificatory note on the determinateness of equilibrium,Õ Reviewof Economic Studies, 1, 122Ð36.
Kaldor, N. (1972) ÔThe irrelevance of equilibrium economics.Õ Economic Journal, 82,1237Ð55.
Kaldor, N. (1975) ÔWhat is wrong with economic theory.Õ Quarterly Journal ofEconomics,Õ 99, 347Ð57.
Kaldor, N. (1977) ÔEquilibrium theory and growth theory,Õ in M. Boskin (ed.)Economics and Human Welfare: Essays in Honour of Tibor Scitovsky, New York,Academic Press, 273Ð291.
Kaldor, N. (1981) ÔThe role of increasing returns, technical progress and cumulativecausation in the theory of international trade and economic growth,Õ �conomieAppliqu�e, 34, 593Ð617.
Kaldor, N. (1996) Causes of Growth and Stagnation in the World Economy,Cambridge, Cambridge University Press.
Knoester, A. (1995) Why a Depreciating Currency does not Improve the CurrentBalance, Erasmus University, Rotterdam, Research Memorandum no. 9506.
Kravis, I.B. and R.E. Lipsey (1971) Price Competitiveness in World Trade, New York,National Bureau of Economic Research.
Krugman, P. (1989) ÔDifferences in income elasticities and trends in real exchangerates,Õ European Economic Review, 33, 1001Ð46.
Krugman, P. (1994) ÔThe myth of AsiaÕs miracle,Õ Foreign Affairs,November/December, 62Ð78.
Le�n-Ledesma, M.A. (1999) ÔAn application of ThirlwallÕs law to the Spanish econ-omy,Õ Journal of Post Keynesian Economics, 21, 431Ð39.
McCombie, J.S.L. (1985) ÔEconomic growth, the Harrod foreign trade multiplier andthe Hicks super-multiplier,Õ Applied Economics, 17, 55Ð72.
McCombie, J.S.L. (1993) ÔEconomic growth, trade interlinkages, and the balance-of-payments constraint,Õ Journal of Post Keynesian Economics, 15, 345Ð505.
McCombie, J.S.L. (1997) ÔThe empirics of balance-of-payments constrained growth,ÕJournal of Post Keynesian Economics, 19, 345Ð75.
McCombie, J.S.L. (2002) ÔIncreasing returns and economic growth from a Kaldorianperspective,Õ in J.S.L. McCombie, M. Pugno and B. Soro (eds) Productivity, Growthand Economic Performance: Essays on VerdoornÕs Law, Basingstoke, Palgrave(forthcoming).
McCombie, J.S.L. and M. Roberts (2000) ÔDemand and economic growth from aKaldorian viewpoint,Õ mimeo, Downing College and New Hall, Cambridge.
McCombie, J.S.L. and A.P. Thirlwall (1994) Economic Growth and the Balance-of-Payments Constraint, London, Macmillan.
McCombie, J.S.L. and A.P. Thirlwall (1997a) ÔThe dynamic Harrod foreign trademultiplier and the demand-orientated approach to economic growth: an evaluation,ÕInternational Review of Applied Economics, 11, 5Ð26.
McCombie, J.S.L. and A.P. Thirlwall (1997b) ÔEconomic growth and the balance-of-payments constraint revisited,Õ in P. Arestis, G. Palma and M. Sawyer (eds)Markets, Unemployment and Economic Policy: Essays in Honour of GeoffHarcourt, Volume Two, London, Routledge, 498Ð511.
Moreno-Brid, J.C. (1998Ð9) ÔOn capital flows and the balance-of-paymentsconstrained growth model,Õ Journal of Post Keynesian Economics, 21, 283Ð89.
Moreno-Brid, J.C. (1999) ÔMexicoÕs economic growth and the balance of paymentsconstraint: a cointegration analysis,Õ International Review of Applied Economics,13, 149Ð59.
112 Kaldorian models of demand-led growth
Downloaded from Elgar Online by University of Melbourne at 07/12/2013 03:26:40AM

Moreno-Brid, J.C. and E. P�rez (1999) ÔBalance-of-payments-constrained growth inCentral America: 1950Ð1996,Õ Journal of Post Keynesian Economics, 22,131Ð47.
Nelson, R.R. and H. Pack (1999) ÔThe Asian growth miracle and modern growththeory,Õ Economic Journal, 109, 416Ð36.
Nixson, F.I. and B. Walters (1999) ÔThe Asian crisis: causes and consequences,ÕManchester School of Economics and Social Studies, 67, 496Ð523.
North, D.C. (1955) ÔLocation theory and regional economic growth,Õ Journal ofPolitical Economy, 63, 243Ð58.
North, D.C. (1956) ÔReply,Õ Journal of Political Economy, 64, 165Ð68.P�rez, E. and J.C. Moreno-Brid (1999) ÔTerms of trade, exports and economic growth
in Central America: a long-term view,Õ Banca Nazionale del Lavoro QuarterlyReview, 211, 431Ð49.
Pugno, M. (1998) ÔThe stability of ThirlwallÕs model of economic growth and thebalance-of-payments constraint,Õ Journal of Post Keynesian Economics, 20,559Ð81.
Roberts, M. (2001a) Essays in Cumulative Causation, Department of Land Economy,University of Cambridge, unpublished Ph.D dissertation.
Roberts, M. (2001b) ÔEndogenous structural change,Õ Zagreb International Review ofEconomics and Business, 4, 1Ð22. University of Cambridge.
Setterfield, M.A. (1997) ÔÒHistory versus equilibriumÓ and the theory of economicgrowth,Õ Cambridge Journal of Economics, 21, 365Ð78.
Setterfield, M.A. (1998) ÔHistory versus equilibrium: Nicholas Kaldor on historicaltime and economic theory,Õ Cambridge Journal of Economics, 22, 521Ð37.
Thirlwall, A.P. (1979) ÔThe balance of payments constraint as an explanation of inter-national growth rate differences,Õ Banca Nazionale Del Lavoro Quarterly Review,128, 45Ð53.
Thirlwall, A.P. (1986) ÔA general model of growth and development on Kaldorianlines,Õ Oxford Economic Papers, 38, 199Ð219.
Thirlwall, A.P. (1987) Nicholas Kaldor, Brighton, Wheatsheaf.Thirlwall, A.P. (1997) ÔReflections on the concept of balance-of-payments-constrained
growth,Õ Journal of Post Keynesian Economics, 19, 375Ð85.Thirlwall, A.P. and M.N. Hussain (1982) ÔThe balance of payments constraint, capital
flows and growth rate differences between developing countries,Õ Oxford EconomicPapers, 34, 498Ð570.
Thirlwall, A.P. and G. Sanna (1998) ÔThe macro determinants of growth and ÒNewÓGrowth Theory: an evaluation and further evidence,Õ in R. Arestis (ed.),Employment, Economic Growth and the Tyranny of the Market: Essays in Honourof Paul Davidson, Aldershot, Edward Elgar, 131Ð56.
Tiebout, C.M. (1956) ÔExports and regional economic growth,Õ Journal of PoliticalEconomy, 64, 160Ð64.
Toye, J. (1992) ÔBritain, the United States and the world debt crisis,Õ in J. Michie (ed.),The Economic Legacy, 1979Ð1992, London, Academic Press, 11Ð33.
Turner, P. (1999) ÔThe balance of payments constraint and the post 1973 slowdown ofeconomic growth in the G7 economies,Õ International Review of AppliedEconomics, 13, 41Ð53.
Wade, R. (1990) Governing the Market: Economic Theory and the Role of Governmentin East Asian Industrialization, Princeton, Princeton University Press.
World Bank (1998) East Asia: The Road to Recovery, Washington, DC, The WorldBank.
The role of the balance of payments in economic growth 113
Downloaded from Elgar Online by University of Melbourne at 07/12/2013 03:26:40AM

Young, A. (1992) ÔA tale of two cities: factor accumulation and technical change inHong Kong and Singapore,Õ National Bureau of Economic Research,Macroeconomics Annual, 13Ð54.
Young, A. (1995) ÔThe tyranny of numbers: confronting the statistical realities of theEast Asian growth experience,Õ Quarterly Journal of Economics, 110, 641Ð80.
114 Kaldorian models of demand-led growth
Downloaded from Elgar Online by University of Melbourne at 07/12/2013 03:26:40AM

7. Pitfalls in the theory of growth: an application to the balance-of-payments-constrained growth model
Thomas I. Palley
INTRODUCTION
Over the last decade, under the banner of new endogenous growth theory,there has been a revival of interest in the theory of economic growth. Thoughendogenizing steady-state growth, the new theory persists with the claim thatgrowth is a purely supply-side phenomenon. This is at odds with Keynesianeconomics that emphasizes the demand-side dimension of the growth process.However, the Keynesian paradigm has, itself, fallen into the pitfall of failingto properly account for the supply side. In the long run, there is a requirementthat the rates of demand and supply growth be equal. Absent this, there willeither be growing excess capacity or excess demand. If potential outputgrowth is subject to influences other than those acting on the demand side, orif it does not respond one-for-one to changes in the rate of demand growth, thisrequires mechanisms that equilibrate the two.
This study presents a short treatment of the demand- and supply-growthproblem, and then applies it to balance-of-payments-constrained (BOPC)growth theory (Thirlwall, 1979). In its simplest form, the BOPC model is apure demand-constrained model of growth. A Verdoorn law equation can beadded to describe the supply side, but this introduces problems of reconcilingsupply growth with the BOPC rate of demand growth. Building on Palley(1996), the study suggests how this inconsistency can be reconciled.
THE PROBLEM OF BALANCING DEMAND AND SUPPLY GROWTH
Neoclassical growth theory (Solow, 1956) claims that steady-state growth isdetermined by supply-side forces. Thus, in steady state the equilibrium growthrate is determined by:
115
Downloaded from Elgar Online by University of Melbourne at 07/12/2013 03:54:43AM

gs = g(S) [7.1]
g = gs [7.2]
where g is the steady-state growth rate, gs is the growth of potential output andS is a vector of supply-side forces. In the Solow model, the supply-side forcesare the rate of population growth and the rate of technological advance, bothof which are taken to be exogenous. Equation [7.2] implicitly assumes aÔdynamicÕ version of SayÕs law, whereby the growth of supply creates a match-ing growth of demand.
New endogenous growth theory retains this overarching framework, exceptthat the steady-state growth rate is now subject to influence by the choices ofgovernment and agents (Romer, 1993, 1994). Thus, equation [7.1] becomes:
gs = g(S, t) [7.1a]
where t is a vector of choice variables subject to control by government andprivate sector agents. These choice variables include public research anddevelopment (R&D) spending, the stock of public capital, public investment,the stock of human capital and investment in human capital. The central impli-cation is that the steady-state growth rate is subject to endogenous variationdespite an exogenously given vector of other supply side forces, S.
This neoclassical perspective contrasts with a Keynesian perspective,which emphasizes demand-side factors. In the Keynesian paradigm, growth isgiven by:
gd = g(D) [7.3]
g = gd [7.4]
where gd is the growth of demand, and D is a vector of demand-side forces,which can be both exogenous and endogenous. Equation [7.4] implicitlyassumes that the growth of supply adjusts to the growth of demand.
However, if there is a separate supply side (i.e. a production side of theeconomy), this requires that the following condition hold:
g = gs = gd [7.5]
Absent the satisfaction of this condition, there will either be growing excesscapacity or growing excess demand Ð neither of which are observed in moderncapitalist economies in the long run. The imposition of this growth equilibriumcondition in turn raises questions as to how equilibrium is achieved. In anendogenous growth framework, variation in the choices of individuals andgovernments could enable equilibration of demand and supply growth, but this
116 Kaldorian models of demand-led growth
Downloaded from Elgar Online by University of Melbourne at 07/12/2013 03:54:43AM

raises questions as to what are the market mechanisms and signals that giveagents an incentive to change their choices?1
The implications of requiring steady-state balance between demand andsupply growth are illustrated by the following Keynesian model (Palley, 1997):
gs = g(S, gd ) [7.6]
gd = g(D) [7.7]
g = gs = gd [7.8]
The model is Keynesian in that demand growth influences the rate of poten-tial output growth, and the rate of demand growth is influenced by choice ofD. Thus, government policy can influence the rate of demand growth, and inso doing it can influence the rate of potential output growth. Yet despite this,the set of growth equilibria may be very limited, and there may even be onlya single equilibrium point. This is illustrated in Figure 7.1, in which the rate of
Pitfalls in the theory of growth 117
Figure 7.1 Equilibrium growth with a strictly concave supply growth function
45°
gs
gd
gs, gd
Downloaded from Elgar Online by University of Melbourne at 07/12/2013 03:54:43AM

supply growth is a strictly concave function of the rate of demand growth. Inthis dynamized incomeÐexpenditure model, there is only on equilibrium point.Figure 7.2 illustrates an alternative representation, in which supply growth isa quasi-concave function of demand growth and there are three equilibria.2
Though increased in number, the set of equilibria is still very restricted. Themodel here is also very different from static Keynesian models of the equilib-rium ÔlevelÕ of income, which are marked by a continuum of equilibria. Inthese static models, policy makers can continuously vary the equilibrium levelof income by changing the level of demand. In the above dynamic model, theycan only cause jumps between equilibria, and even this requires that the supplygrowth function be shaped in a particular way. These differences illustrate thecritical importance of properly accounting for demand and supply growth, aswell as the pitfalls of failing to do so.
Finally, in connection with the above distinction between static anddynamic Keynesian models, the work of Cornwall (1972) provides a possibleintermediate position. Cornwall recognizes the importance of the distinctionbetween the growth of supply and the growth of demand, and also recognizes
118 Kaldorian models of demand-led growth
Figure 7.2 Equilibrium growth with a quasi-concave supply growth function
45°
gd
gs, gd
gs
Downloaded from Elgar Online by University of Melbourne at 07/12/2013 03:54:43AM

that the two must be equal in equilibrium. He then postulates that there maybe a range of demand growth where the two coincide. This is illustrated inFigure 7.3, in which the growth of supply and demand correspond over theregion gA Ð gB.
AN ILLUSTRATION: THE BOPC GROWTH MODEL
The BOPC growth model introduced by Thirlwall (1979) has become a work-horse of post-Keynesian growth theory. The BOP growth model is intended toshow how country growth rates are ultimately constrained by the rate ofgrowth of demand, thereby making for a Keynesian theory of growth. In thisregard, the growth of exogenous demand provided by exports is especiallyimportant. The logic is that the current account provides an ultimate constrainton growth, because countries cannot continuously increase their foreign debtto gross domestic product (GDP) ratios. Consequently, if domestic income andimport demand are growing in excess of export demand, at some stage the
Pitfalls in the theory of growth 119
45°
gd
gs, gd
gB
gs = g(gd)
gA
Figure 7.3 The Cornwall (1972) model, with a region of correspondencebetween supply and demand growth
Downloaded from Elgar Online by University of Melbourne at 07/12/2013 03:54:43AM

rising foreign debt to GDP ratio implied by a growing current account deficitwill force a slowdown that restores current account balance.
However, the BOPC model embodies an internal inconsistency owing to itsfailure to consistently incorporate the supply side of the economy. In the longrun, not only is growth constrained by the requirement of dynamic currentaccount balance, but there is also a requirement that the rate of growth ofoutput equal the rate of growth of potential output. This leads to the potentialfor inconsistency between the dual requirements of capacity balance andcurrent account balance. The problem can be seen from the following simplestatement of the BOPC growth model:
x = a0g* [7.9]
m = b0gd [7.10]
x = m [7.11]
l = c0 + c1gd [7.12]
gs = l + n [7.13]
where x is the rate of export growth, g* is the rate of foreign income growth,m is the rate of import growth, gd is the rate of domestic income growth, l isthe rate of labour productivity growth, gs is the rate of potential output growthand n is the rate of labour force growth. Equations [7.9] and [7.10] are, respec-tively, export and import growth equations. Equation [7.11] is the balance-of-payments constraint, which requires equality between the long-run rates ofimport and export growth to prevent a growing current account deficit orsurplus. Equation [7.12] is the Verdoorn law equation which endogenizesproductivity growth by linking it to domestic output growth. Lastly, equation[7.13] determines the rate of potential output growth.
Solutions for the equilibrium rates of actual and potential output growth aregiven by:
gd = a0g*yb0 [7.14]
and:
gs = c0 + c1a0g*yb0 + n [7.15]
The model is overdetermined, and it is only by chance that the BOPC rate ofoutput growth will equal potential output growth. The necessary condition is:
120 Kaldorian models of demand-led growth
Downloaded from Elgar Online by University of Melbourne at 07/12/2013 03:54:43AM

g* = [c0 + n]y[a0yb0 Ð c1] [7.16]
If this condition is not satisfied, there will be growing imbalance betweenactual and potential output. If g* > [c0 + n]y[a0yb0 Ð c1], there will be grow-ing excess demand. If g* < [c0 + n]y[a0yb0 Ð c1], there will be growing excesssupply.
A SUGGESTION FOR RECONCILING THE INCONSISTENCY IN THE BOP MODEL
The theoretical good sense of the BOP model and its ability to make empiri-cal sense of many countriesÕ growth experience (McCombie, 1997; Bairamand Dempster, 1991) suggest that the model is a worthwhile one. That said,reconciling the inconsistency between the current account and the capacitybalance constraints is an important matter.
A possible means of reconciliation is suggested by Palley (1996), whoshows how steady-state excess supply conditions can impact the steady-staterate of growth. This allows for growth without full employment. Such asuggestion can be incorporated into the BOP growth model by making theincome elasticity of demand for imports a negative function of the state ofexcess capacity, E. One rationale for this is that imports are driven by bottle-necks. As excess capacity and unemployment decrease, bottlenecks becomemore prevalent and the share of increments in income spent on importsincreases. Thirlwall and White (1974) and Thirlwall and Hughes (1979)provide some empirical evidence for this hypothesis, showing that the elastic-ity of demand for imports increases in conditions of excess demand.
In steady-state equilibrium excess capacity is constant, indicating thatdemand and supply are growing at the same rate. Given this, the modelbecomes:
x = a0g* [7.9]
m = b0(E)gd [7.10a]
x = m [7.11]
l = c0 + c1gd [7.12]
gs = l + n [7.13]
gd = gs [7.17]
Pitfalls in the theory of growth 121
Downloaded from Elgar Online by University of Melbourne at 07/12/2013 03:54:43AM

where E is the ratio of current output to normal capacity output.3 The changesfrom the earlier model concern the specification of [7.10a] and the addition ofa capacity balance condition given by [7.17].
The workings of the model can be understood as follows. The existence ofa balance-of-payments constraint requires that export growth equal importgrowth in the steady state. This imposes the condition:4
gd = a0g*yb0(E) [7.18]
Simultaneously, the requirement that demand growth equal supply growthimposes the condition:5
gd = [c0 + n]y[1 Ð c1] [7.19]
The potential inconsistency is illustrated in Figure 7.4. The ray from the originshows the rates of demand growth consistent with foreign income growth,while the horizontal line determines the rate of demand growth consistent with
122 Kaldorian models of demand-led growth
Figure 7.4 The inconsistency between the BOP-constrained growth rateand the capacity balance growth rate
g*
gd
gd = a0g*/b0
g1*
ged
gd = [c0 + n]/[1 Ð c1]
g1d
Downloaded from Elgar Online by University of Melbourne at 07/12/2013 03:54:43AM
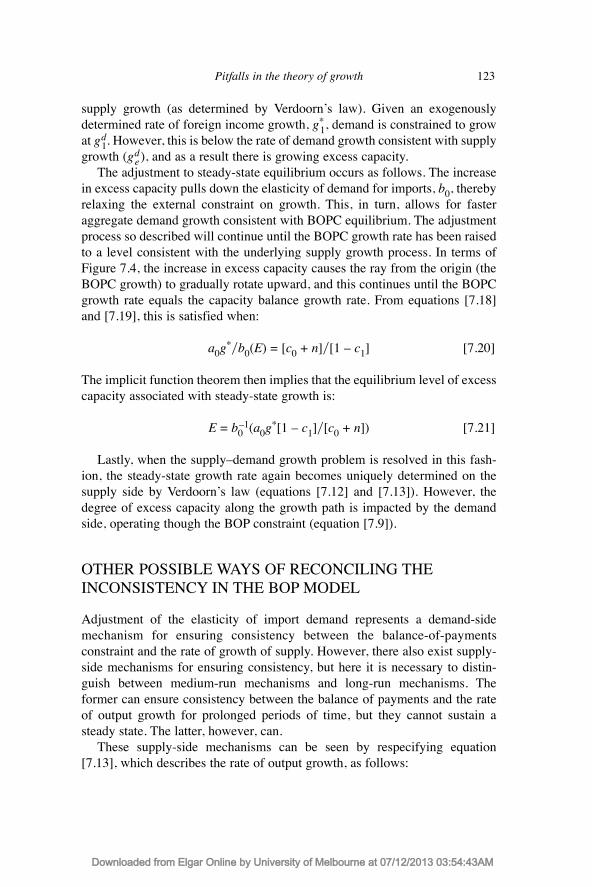
supply growth (as determined by VerdoornÕs law). Given an exogenouslydetermined rate of foreign income growth, g*
1, demand is constrained to growat gd
1. However, this is below the rate of demand growth consistent with supplygrowth (gd
e ), and as a result there is growing excess capacity.The adjustment to steady-state equilibrium occurs as follows. The increase
in excess capacity pulls down the elasticity of demand for imports, b0, therebyrelaxing the external constraint on growth. This, in turn, allows for fasteraggregate demand growth consistent with BOPC equilibrium. The adjustmentprocess so described will continue until the BOPC growth rate has been raisedto a level consistent with the underlying supply growth process. In terms ofFigure 7.4, the increase in excess capacity causes the ray from the origin (theBOPC growth) to gradually rotate upward, and this continues until the BOPCgrowth rate equals the capacity balance growth rate. From equations [7.18]and [7.19], this is satisfied when:
a0g*yb0(E) = [c0 + n]y[1 Ð c1] [7.20]
The implicit function theorem then implies that the equilibrium level of excesscapacity associated with steady-state growth is:
E = b0Ð1(a0g*[1 Ð c1]y[c0 + n]) [7.21]
Lastly, when the supplyÐdemand growth problem is resolved in this fash-ion, the steady-state growth rate again becomes uniquely determined on thesupply side by VerdoornÕs law (equations [7.12] and [7.13]). However, thedegree of excess capacity along the growth path is impacted by the demandside, operating though the BOP constraint (equation [7.9]).
OTHER POSSIBLE WAYS OF RECONCILING THE INCONSISTENCY IN THE BOP MODEL
Adjustment of the elasticity of import demand represents a demand-sidemechanism for ensuring consistency between the balance-of-paymentsconstraint and the rate of growth of supply. However, there also exist supply-side mechanisms for ensuring consistency, but here it is necessary to distin-guish between medium-run mechanisms and long-run mechanisms. Theformer can ensure consistency between the balance of payments and the rateof output growth for prolonged periods of time, but they cannot sustain asteady state. The latter, however, can.
These supply-side mechanisms can be seen by respecifying equation[7.13], which describes the rate of output growth, as follows:
Pitfalls in the theory of growth 123
Downloaded from Elgar Online by University of Melbourne at 07/12/2013 03:54:43AM

gs = l + h + s + p [7.13a]
where h is the rate of growth of hours worked, s denotes the rate of growth oflabour force participation and p is the rate of population growth. According to[7.13a], the growth of labour input can result from longer hours, greater labourforce participation or a growing population. In the event that a country isgrowth-constrained by its balance of payments, the rate of growth of supplycan adjust down to a consistent level. This can be achieved by falling hours,falling participation rates or falling population growth. However, falling hoursand participation rates represent medium-term adjustment mechanisms,because these variables are ultimately bounded. Both are bounded from belowby zero, while hours are bounded from above by 24, and participation rates arebounded from above by 100. Hours and participation rate adjustment mustultimately exhaust themselves, then, and at this stage the only sustainablelong-run adjustment mechanism is the rate of population growth. For instance,the rate of population growth may ultimately fall in response to persistentexcess supply growth that generates rising unemployment (as happened inindustrialized countries during the Great Depression), thereby reducing therate of supply growth. Such an adjustment mechanism would support a steady-state equilibrium.
CONCLUSION
Growth models have tended to assume away the problem of reconcilingdemand and supply growth. Neoclassical models assume away the demandside, while Keynesian models tend to assume away the supply side. This chap-ter presents a brief treatment of the demand and supply growth problematic,and illustrates this problematic with an application to the BOPC growthmodel. It then suggests a resolution of the problem that has the steady-stategrowth rate being uniquely determined by supply-side factors. Demandconstraints then impact the degree of excess capacity along the growth path,which in turns affects demand growth until the latter is reconciled with thegrowth of supply.
NOTES
1. The adoption of marginal productivity theory to explain income distribution introduces addi-tional complications, since it requires that the steady-state capitalÐlabour ratio be constant,which then further restricts the set of possible equilibria. In a marginal productivity frame-work, a constant capital Ð labour ratio is needed to prevent capital deepening from driving theinterest rate to zero.
124 Kaldorian models of demand-led growth
Downloaded from Elgar Online by University of Melbourne at 07/12/2013 03:54:43AM

2. Which of the three are stable depends on the details of the dynamic adjustment mechanism.See Palley (1997).
3. The rate of change of excess capacity is given by dEyE = gd Ð gs. Thus, dEyE = 0 whengd = gs. In the background of the current model is a multi-sector model with the stochasticdemand distribution, such as is described in Tobin (1972) and Palley (1994). In such an econ-omy, random shifts in demand mean that some sectors have excess capacity while others areat full capacity (bottleneck sectors). If the trend rate of aggregate demand growth exceeds thetrend rate of aggregate supply growth, there will be a steady increase in the proportion ofsectors subject to bottlenecks. The reverse holds if the rate of supply growth exceeds the rateof demand growth.
4. This condition is derived using equation [7.9], [7.10a] and [7.11].5. This condition is derived using equation [7.12], [7.13] and [7.17].
REFERENCES
Bairam, E.I. and G. Dempster (1991) ÔThe Harrod trade multiplier and economicgrowth in Asian countries,Õ Applied Economics, 23, 1719Ð24.
Cornwall, J. (1972) Growth and Stability in a Mature Economy, London, MartinRobertson.
McCombie, J.S.L. (1997) ÔThe empirics of balance of payments constrained growth,ÕJournal of Post Keynesian Economics, 19, 345Ð75.
Palley, T.I. (1994) ÔEscalators and elevators: a Phillips curve for Keynesians,ÕScandinavian Journal of Economics, 96, 117Ð23.
Palley, T.I. (1996) ÔGrowth theory in a Keynesian mode,Õ Journal of Post KeynesianEconomics, 19, 113Ð35.
Palley, T.I. (1997) ÔAggregate demand and endogenous growth: a generalizedKeynesÐKaldor model of economic growth,Õ Metroeconomica, 48, 161Ð76.
Romer, P.M. (1993) ÔEndogenous technical change,Õ Journal of Political Economy, 98,S71ÐS102.
Romer, P.M. (1994) ÔThe origins of endogenous growth,Õ Journal of EconomicPerspectives, 8, 3Ð22.
Thirlwall, A.P. (1979) ÔThe balance of payments constraint as an explanation of inter-national growth rate differences,Õ Banca Nazionale Del Lavoro Quarterly Review,128, 45Ð53.
Thirlwall, A.P. and J.J. Hughes (1979) ÔImports and labour market bottlenecks: a disag-gregated study for the UK.Õ Applied Economics, 11, 77Ð94.
Thirlwall, A.P. and H. White (1974) ÔUS merchandise imports and the dispersion ofmarket demand,Õ Applied Economics, 6, 275Ð92.
Tobin, J. (1972) ÔInflation and unemployment,Õ American Economic Review, 62, 1Ð26.
Pitfalls in the theory of growth 125
Downloaded from Elgar Online by University of Melbourne at 07/12/2013 03:54:43AM

Downloaded from Elgar Online by University of Melbourne at 07/12/2013 03:54:43AM

8. Distribution, demand and growth in neo-Kaleckian macro-models
Robert A. Blecker1
In economic theories that allow for aggregate demand to influence long-rungrowth, a crucial and unresolved question is how the distribution of incomebetween wages and profits affects aggregate demand and the growth rate. Along tradition of ÔunderconsumptionistÕ thinking dating back to the early nine-teenth century (surveyed by Bleaney, 1976) asserted that low wages (and highprofits) would lead to chronically depressed consumer demand, which in turnwould tend to cause overall economic stagnation unless offset by some otherfactors. However, another strand of thinking dating back to Ricardo and Marxrecognizes that a high rate of profit can be a stimulus to capital accumulationor, in more modern terms, demand for investment. These alternative viewshave led to different perspectives about whether demand-determined growth ismore likely to be wage-led or profit-led, and thus whether there is a conflictbetween growth and equity objectives in the formulation of economic policy.
This chapter analyses the problem of distributional effects on aggregatedemand and economic growth through the lens of macroeconomic models inthe neo-Kaleckian tradition. Michaò Kalecki was the first economist toconstruct formal models in which workers had a higher marginal propensityto consume than capitalists, and he often assumed for simplicity that work-ers spent all of their wages on consumption.2 He also analysed investmentfunctions in which the rate of investment depended positively on retainedprofits, which he justified by the idea that internal funds could relieve thefinancial constraints on investment implied by his principle of ÔincreasingriskÕ (Kalecki, 1937, 1954). Thus, KaleckiÕs analysis incorporated the two-sided effects of income distribution on consumption and investment demand.Kalecki also made two other key analytical contributions to macroeconomicmodelling. First, he grounded his theory of factor shares in a model ofoligopolistic mark-up pricing in manufacturing industries. Second, heconstructed models of economies with excess capacity, in which aggregatedemand determined the equilibrium levels of realized profits and nationalincome.
This chapter utilizes macroeconomic models in the tradition of Kalecki to
129
Downloaded from Elgar Online by University of Melbourne at 07/12/2013 04:02:56AM

analyse how the distribution of income between wages and profits affects thelevel of aggregate demand and the rate of economic growth. These effects (thatis, on demand and growth) do not always go in the same direction, and canvary depending on both the source of a distributional shift and the structure ofthe economy involved. While there is thus no simple answer to the question ofwhether demand-driven economies are more likely to be wage-led or profit-led, it is possible to construct a fairly complete analysis of the conditions underwhich one or the other result will obtain for any given objective (e.g., employ-ment or growth). This chapter attempts to provide such a comprehensive treat-ment within a neo-Kaleckian modelling framework.
A SURVEY OF NEO-KALECKIAN MACRO-MODELS
In the aftermath of the Great Depression and World War II, the early literaturethat built on KaleckiÕs work tended to emphasize the implication of a tendencytowards secular economic stagnation. Especially, Steindl (1952) argued thatthere was a strong tendency in capitalism for industries to concentrate, leadingto the emergence of oligopolistic competition with increasing profit margins.Since rising profit margins imply an increasing share of profits in nationalincome, overall consumer demand would stagnate.3 Steindl also believed thatthe emergence of oligopoly would dampen investment demand because large,concentrated firms would want to avoid installing undesired excess capacity.Hence, a ÔmatureÕ economy would tend towards a state of chronic stagnationin the absence of expansionary government policies or foreign trade surpluses.
The next generation of neo-Kaleckian macro-models generally reinforcedthe ÔstagnationistÕ view promoted by Steindl for economies with oligopolisticfirms and excess capacity. Harris (1974) and Asimakopulos (1975) developedstatic neo-Kaleckian macro-models in which an increase in the profit mark-uprate causes a contraction of output and employment. These authors tookinvestment as exogenously given, however, while emphasizing other issuessuch as the role of overhead labour costs and the determination of the profitshare. Krugman and Taylor (1978) developed a stagnationist model for adeveloping country, in which a currency devaluation has a contractionaryeffect on domestic output because it redistributes income towards profits (anidea originally due to D�az-Alejandro, 1963). They also took investment asexogenous.
Del Monte (1975), Rowthorn (1982), Dutt (1982, 1984, 1987), Taylor(1983, 1985) and Amadeo (1986) then made the breakthough of building neo-Kaleckian models in which investment demand was endogenous.4 Most ofthese authors assumed that investment was an increasing function of both theprofit rate and capacity utilization, and that all saving came out of profits.5
130 Kaleckian models of demand-led growth
Downloaded from Elgar Online by University of Melbourne at 07/12/2013 04:02:56AM
These models generally preserved the strong stagnationist result than anincrease in the profit share (or a reduction in the real wage) necessarilydepresses both capacity utilization6 and economic growth in an economy char-acterized by excess capacity, although each of these authors also considered avariety of other, related issues.7
Later, several economists showed that stagnationism is not a necessaryoutcome in more general neo-Kaleckian models, even assuming oligopolisticfirms with mark-up pricing and excess capacity. Bhaduri and Marglin (1990)and Marglin and Bhaduri (1990) coined the term ÔexhilarationismÕ to describethe opposite case, in which a higher profit mark-up (or profit share) stimulatesaggregate demand and raises capacity utilization.8 Exhilarationism occurs intheir models if there is a strongly positive response of investment demand toincreases in the profit share. Taylor (1990) showed that allowing for positivesaving out of wages also creates the possibility of an exhilarationist outcome,since it reduces the consumption-stimulating effects of redistributing incometowards labour Ð a result also demonstrated by Mott and Slattery (1994b).Blecker (1989) and Bhaduri and Marglin (1990) argued that exhilarationismcould result from international price competition, because a wage cut thatredistributes income towards profits also improves external competitiveness.If the resulting positive effect on the trade balance is large enough, aggregatedemand and economic growth may increase even if domestic expenditures aredepressed.9
While both stagnationist and exhilarationist cases have thus been presentedin the literature, there has not yet been a synthetic treatment that unifies thevarious cases and reveals the overall conditions required for distributionaleffects on demand and growth to go in one direction or the other.10 The rest ofthis chapter attempts to provide such a unifying framework and, thereby, toilluminate the key question of whether (or under what conditions) it is possi-ble to promote higher employment and faster growth with a more equitabledistribution of income. In order to focus sharply on the determinants of aggre-gate demand, all the models in this chapter take distributional relations andsupply-side conditions (for example, productivity) as exogenously given.Thus, these are not models of fully adjusted, long-run equilibrium positions.Although the models in this chapter may be considered as merely Ôshort-runÕ,static analyses, it is also possible to view them as models of Ômedium-runÕ orÔprovisionalÕ equilibria in the sense of Chick and Caserta (1997). In addition,the models in this chapter are ÔrealÕ models that largely ignore monetary andexpectational factors. The intention is to provide a comprehensive frameworkfor analysing the effects of income distribution on aggregate demand and itscomponents, which can be incorporated into models with more explicitdynamic feedbacks from growth and employment to distributive shares, andwith more explicit treatment of finance and expectations.11
Distribution, demand and growth 131
Downloaded from Elgar Online by University of Melbourne at 07/12/2013 04:02:56AM
A SIMPLE STAGNATIONIST MODEL
Consider the following very simple macro-model of a one-sector, closed econ-omy with no government and no workersÕ saving.12 Prices are set by a mark-up on what Kalecki called Ôprime costsÕ, or what are now called averagevariable costs (labour and raw materials). Abstracting from raw materials andoverhead costs for simplicity, and assuming that labour costs are constant, thepricing equation for the representative firm is
P = jaW [8.1]
where j > 1 is the profit mark-up factor or price-cost margin (one plus themark-up rate), a is the labour coefficient (hours/unit of output), W is themoney wage rate and aW is unit labour cost (both a and W are exogenouslygiven). The profit margin j is assumed to reflect KaleckiÕs Ôdegree of monop-olyÕ and is also taken as exogenously given in a closed economy.13
Abstracting from raw materials, price equals value added, and therefore theprofit share of value added is p = (P Ð aW )yP. Substituting [8.1] into thisexpression and simplifying yields:
p = (j Ð 1)yj [8.2]
where ¶py¶j > 0. Furthermore, from the definition of the profit rate r,
r = (P Ð aW)YyPK = [(j Ð 1)yj]u = pu [8.3]
where Y is real output, K is the capital stock, and u = YyK is the output-capi-tal ratio used as a proxy for the rate of capacity utilization.14 Defining the rateof accumulation made possible by realized saving as gs = SyK, and assumingthat all saving comes out of profits at the constant rate sr (0 < sr < 1), thesaving function (expressed as a proportion of the capital stock) is
gs = srr [8.4]
To complete the model, we need to specify an investment demand orÔdesired accumulationÕ function. Following Rowthorn (1982), Dutt (1984,1987) and Taylor (1983, 1991), investment is assumed to depend positively onthe profit rate and the utilization rate. Writing the function in linear form forconvenience,15 we have
gi = f0 + f1r + f2u, fj > 0 (j = 0, 1, 2) [8.5]
where gi = IyK is investment demand in proportion to the capital stock (ignor-ing depreciation for simplicity). The intercept term f0 > 0 reflects Keynesian
132 Kaleckian models of demand-led growth
Downloaded from Elgar Online by University of Melbourne at 07/12/2013 04:02:56AM
Ôanimal spiritsÕ of entrepreneurs, or the state of business confidence. The posi-tive effect of r can be justified either by reference to the use of corporateretained profits for relieving financial constraints on investment, or else bythinking of r as the expected rate of return on new investment (assuming thatexpected profits equal actual profits for simplicity). The positive effect of u isthe static equivalent of the accelerator effect, i.e., the effect of output growthon the demand for new capital equipment, which is proxied here by the effectof capacity utilization as reflected in the output-capital ratio.16
The goods market equilibrium condition is gs = gi (saving equals invest-ment). Substituting [8.3] into [8.4] and [8.5] and setting the resulting equationsequal, the equation for a neo-Kaleckian ÔIS curveÕ can be written as:
srpu = f0 + f1pu + f2u [8.6]
which, since it is linear, yields an explicit solution for the equilibrium level ofthe output-capital ratio (utilization):
u = f0y[(sr Ð f1)p Ð f2]. [8.7]
In order for the goods market to be stable, the induced increase in investmentas u rises must be less than the induced increase in saving, which requires thatthe denominator of [8.7] be positive.
From this the stagnationist result follows directly. Suppose that firmsincrease their monopoly power and thereby raise their mark-ups j. This willraise the profit share p by [8.2], and differentiating [8.7] with respect to pyields
duydp = Ð (sr Ð f1)f0y[(sr Ð f1)p Ð f2]2 < 0 [8.8]
The assumption that the denominator of [8.7] is positive for stability ensuresthat sr Ð f1 > f2yp. Given the assumption that f2 > 0, it follows that sr Ð f1 > 0and therefore duydp < 0. This result also implies a positive relationshipbetween the real wage and capacity utilization, since WyP = 1yaj = (1 Ð p)ya,and thus a decrease in j (or p) implies increases in both WyP and u. Sinceemployment (N = auK) is also positively related to utilization, we have theremarkable result that raising the real wage leads to increased employment Ðalthough workers can only get a higher real wage in this model if they caninduce firms to accept lower mark-ups.
Furthermore, not only is u negatively affected by a rise in p, but also theequilibrium profit rate r and growth rate g (that is, the rate at which gs = gi)are both negative functions of the profit share in this model. Differentiatingr = pu with respect to p and substituting [8.8] for duydp yields
Distribution, demand and growth 133
Downloaded from Elgar Online by University of Melbourne at 07/12/2013 04:02:56AM

duydp = Ð f2 f0y[(sr Ð f1)p Ð f2]2 < 0 [8.9a]
and, using [8.4] with the chain rule,
dgydp = Ð sr f2 f0y[(sr Ð f1)p Ð f2]2 < 0 [8.9b]
To avoid terminological confusion, we shall refer to the negative effect of pon u in [8.8] as ÔstagnationismÕ17 and the negative effect of p on g in [8.9b]as Ôwage-led growthÕ (recall that the real wage is inversely related to p). Wealso refer to the negative effect of p on r in [8.9a] as Ôcooperative stagna-tionismÕ, for reasons that will be discussed below (see Table 8.1 for defini-tions of these concepts). However, all of these results depend critically on the
134 Kaleckian models of demand-led growth
Table 8.1 Alternative concepts of distributional effects on aggregatedemand, the profit rate and the growth rate
Concept Verbal definition Mathematicaldefinition
Stagnationism (wage- Capacity utilization inversely duydp < 0led aggregate demand) related to the profit share
Cooperative Realized profit rate inversely drydp < 0related to the profit share
Conflictive Realized profit rate positively drydp > 0related to the profit share
Exhilarationism (profit- Capacity utilization positively duydp > 0led aggregate demand) related to the profit share
Cooperativea Total real labour income d(WNyP)ydp > 0positively related to the profitshare
Conflictivea Total real labour income d(WNyP)ydp < 0inversely related to the profitshare
Wage-led growth Capital accumulation rate dgydp < 0inversely related to the profitshare
Profit-led growth Capital accumulation rate dgydp > 0positively related to the profitshare
Notes: a. See note 23 on the cooperative and conflictive cases of exhilarationism.
Downloaded from Elgar Online by University of Melbourne at 07/12/2013 04:02:56AM

assumption of a positive utilization effect (f2 > 0) in the investment function[8.5], as well as the assumptions of no saving out of wages, no taxes and noforeign trade.
This model thus has very definite and strong political-economy implica-tions. If capital owners want a higher realized profit rate and higher growthrate, they must allow workers to have a higher real wage and a higher share ofnational income. If the profit recipients instead try to raise their own incomeshare, they will depress aggregate demand by so much that the fall in u endsup more than offsetting the rise in p and hence r = pu decreases. This then laysthe basis for a policy of Ôclass compromiseÕ, that is, a cooperative solution inwhich workers get higher real wages and more jobs while capitalists get higherrealized profits and faster capital accumulation, as long as the latter are will-ing to accept a smaller relative share of national income. But, as the rest of thischapter shows, these strong results do not necessarily hold in more generalneo-Kaleckian models once the simplifying assumptions made here aredropped.
THE INVESTMENT FUNCTION
Marglin and Bhaduri (1990; hereafter ÔMBÕ) argue that the assumption thatf2 > 0 in the investment function [8.5] amounts to the imposition of a Ôstrongaccelerator conditionÕ, that is, the depressing effects of reduced utilization unecessarily dominate the stimulating effects of a rise in the profit share pwhen income is redistributed to profits. MB observe that, since f2 = ¶giy¶u isa partial derivative that holds r constant, in order to hold r constant when uincreases (given that r = pu) p must fall equi-proportionately (that is, dr = 0if and only if dpyp = Ðduyu). Therefore, the assumption that f2 > 0 impliesthat, if u rises and p falls by the same percentage at the same time, firmsnecessarily desire to invest more.18 But MB argue that this is not sensible.Whether firms would want to invest more or less in this situation depends onwhether they are more concerned with demand and utilization (in which casethey would want to invest more) or with profitability (in which case theywould want to invest less). The sign of f2 should therefore be ambiguous, apriori.19
MB then posit what they consider to be a more general investment function(which we will not linearize for reasons that will become clear later):20
gi = h(p, u) [8.10]
with partial derivatives hp > 0 and hu > 0. According to MB, the assumptionthat hu > 0 is based on the weaker but more plausible presumption that, if u
Distribution, demand and growth 135
Downloaded from Elgar Online by University of Melbourne at 07/12/2013 04:02:56AM

rises while p stays constant Ð that is, if there is more demand with the sameprofit share Ð then firms necessarily desire to invest more.
Using [8.10] in place of [8.5] along with the saving function [8.4] in theequilibrium condition gs = gi, we get the IS curve
srpu = h(p, u) [8.11]
and by total differentiation of [8.11] we obtain:
duydp = Ð (sru Ð hp)y(srp Ð hu) [8.12]
The denominator of [8.12] must be positive for goods market stability, but thenumerator can be either positive or negative. Thus, the economy is stagna-tionist (duydp < 0) when sru > hp and exhilarationist (duydp > 0) whensru < hp. The key to obtaining the exhilarationist result, then, is a relativelylarge effect of the profit share on desired accumulation (hp).21
Exhilarationism, as defined here, is a very strong result: it requires that aredistribution of income towards profits stimulates overall aggregate demand,not just investment demand. In order to obtain the exhilarationist result in thismodel, the investment stimulus from a higher profit share must be so large asto more than offset the reduction in consumption spending. Under somewhatweaker conditions, a higher profit share could increase investment and growth,but still depress overall aggregate demand and reduce capacity utilization. MBrecognize this possibility with their analysis of ÔconflictiveÕ as opposed toÔcooperativeÕ stagnationism. (See Table 8.1 for definitions of all theseconcepts.)
To see this distinction, consider the effects of a rise in p on r and g. Sincer = pu, g = srpu, and sr is a constant, the relevant derivatives can be expressedin logarithmic (elasticity) form as follows:
[8.13]
In the stagnationist case, in which (d ln uyd ln p) < 0, [8.13] will be positive(that is, a rise in p will increase r and g even though it reduces u) if and onlyif (in absolute value terms) êd ln uyd ln p ê < 1, that is, if utilization is rela-tively inelastic with respect to the profit share. This is the case that MB callÔconflictive stagnationismÕ, in the sense that capitalists do not have an incen-tive to cooperate with workers because they can increase their profit rate andaccumulation rate by raising their mark-ups and profit share (and thus cuttingthe real wage), even though they depress aggregate demand and capacityutilization (and employment) in the process. The opposite case, where
d r
d
d g
d
d u
d
ln
ln
ln
ln
ln
ln.
p p p= = +1
136 Kaleckian models of demand-led growth
Downloaded from Elgar Online by University of Melbourne at 07/12/2013 04:02:56AM

êd ln uyd ln p ê > 1, that is, utilization is profit-share elastic, is what MB callÔcooperative stagnationismÕ, which corresponds to the simple stagnationistmodel presented earlier. Using [8.12] for duydp, the condition for cooperativeversus conflictive stagnationism can be expressed as whether hu(uyg) >hp(pyg) or hp(pyg) > hu(uyg), that is, whether investment demand is moreelastic with respect to the utilization rate or the profit share.22
However, the Ôconflictive-stagnationistÕ case allows for a class compromisein another sense. Since dgydp > 0 in this case, if workers accept a lower wageshare of income (and a lower real wage), they will nevertheless benefit fromfaster growth that will eventually increase employment opportunities. In thissituation, growth is profit-led even though aggregate demand is wage-led.This situation is possible because growth in the sense of capital accumulationdepends on only one element of aggregate demand (investment) and not on thetotal level. In contrast, in the more extreme exhilarationist case, not only isgrowth profit-led, but aggregate demand and employment are also stimulatedby a redistribution of income towards profits.23
Indeed, the MB model requires the assumption of an investment functionwith what might be called a Ôstrong profit-share effectÕ in order to generateexhilarationist results.24 By using some common explicit functional forms forMBÕs implicit investment function [8.10], we can show that the possibility ofsuch a strong profit-share effect is more dubious than MBÕs presentation(using the implicit function [8.10]) makes it appear. For example, using thelinear function:
gi = h0 + h1p + h2u [8.10¢]
with hj > 0 (j = 0, 1, 2), the equilibrium utilization rate is
u = (h0 + h1p)y(srp Ð h2) [8.14]
with srp Ð h2 > 0 for stability, and
duydp = (Ð h1h2 Ð srh0)y(srp Ð h2)2 < 0. [8.15]
Thus, the profit share effect can never be strong enough in [8.10¢] to lead toexhilarationism in this model, no matter how high is the coefficient h1.25
As another example, consider the ÔCobbÐDouglasÕ functional form
gi = Apaub [8.10¢¢]
with a > 0, b > 0. Setting [8.10¢¢] equal to [8.4] and differentiating logarith-mically:
Distribution, demand and growth 137
Downloaded from Elgar Online by University of Melbourne at 07/12/2013 04:02:56AM

[8.16]
Assuming b < 1 for goods-market stability, exhilarationism is possible only inthe extreme case where a > 1, that is, the elasticity of the desired accumula-tion rate with respect to the profit share exceeds unity. Under less extremeconditions, both conflictive and cooperative stagnationism can result, with theformer obtaining when b < a < 1 and the latter when a < b < 1.
Thus, the use of two common explicit functional forms for the MB invest-ment function implies that exhilarationism is either impossible or results onlyunder extreme elasticity assumptions, in a model that assumes no workersÕsaving, no government, and no foreign trade.26 This suggests that separatingthe utilization rate and profit share terms in the investment function by itselfis unlikely to produce an exhilarationist outcome, although separating theseterms easily allows for the ÔconflictiveÕ rather than the ÔcooperativeÕ variety ofstagnationism to occur.
POSITIVE SAVING OUT OF WAGES
This section shows that positive saving out of wages creates possibilities forexhilarationism and increases the likelihood of profit-led growth, even usingan investment function that would otherwise imply stagnationism. Supposethat wage-earners save at a rate which is less than the saving rate out of prof-its (sw < sr) as a result of the retention of a significant portion of profits bycorporations. In this case, the saving function can be written as
gs = [srp + sw(1 Ð p)]u [8.17]
in which the functional saving rates are weighted by the income shares of prof-its and wages, respectively, and multiplied by u for proportionality to the capi-tal stock.
For an investment function, we must choose between the various alterna-tives discussed above. An intuitively appealing specification that respectsMBÕs critique (and which is similar to one of the investment functions consid-ered by Lavoie, 1996) is the following:
gi = g0 + g1pv + g2u, [8.18]
where v is the Ôfull-capacityÕ output-capital ratio (measured at a ÔnormalÕrate of capacity utilization), and thus pv is the full-capacity profit rate (r =pv when u = v), with gj > 0 (j = 0, 1, 2). There is no Ôstrong accelerator
d u
d
ln
ln.
pab
= ---
1
1
138 Kaleckian models of demand-led growth
Downloaded from Elgar Online by University of Melbourne at 07/12/2013 04:02:56AM

conditionÕ here, since g2 > 0 is assumed holding p (not r) constant. Yet if[8.18] were used in a closed economy model with no saving out of wages,it would only permit a stagnationist outcome since it is just a variant on thelinear form [8.10¢].27
Using [8.17] and [8.18] in the equilibrium condition gs = gi yields the IScurve:
[(sr Ð sw)p + sw]u = g0 + g1pv + g2u [8.19]
which has the explicit solution:
u = (g0 + g1pv)yS(p) [8.20]
with the denominator S(p) = (sr Ð sw)p + sw Ð g2 > 0 for stability.Differentiating [8.20] with respect to p yields (after some rearranging):
duydp = [(sw Ð g2)g1v Ð (sr Ð sw)g0)]y[S(p)]2 [8.21]
which is ambiguous in sign. If sw is relatively large compared with sr and g2,then exhilarationism (duydp > 0) may result. Intuitively, if workers are rela-tively big savers, then there is a relatively small loss in consumption demandfrom redistributing income to profits, and the positive effects of increasedprofitability on investment demand dominate.
Even if this model is stagnationist (duydp < 0), it can be either coopera-tive- or conflictive-stagnationist and may exhibit either wage- or profit-ledgrowth because the signs of drydp and dgydp are ambiguous.28 The signsof these two derivatives no longer depend on the same parameter condi-tions, since g is not directly proportional to r when sw > 0. The economy isconflictive-stagnationist (drydp > 0) if sw + g1pv > g2 (that is, the savingrate out of wages and the profitability effect on investment are relativelylarge compared with the utilization effect on investment), and is coopera-tive-stagnationist if sw + g1pv < g2. Growth is profit-led (dgydp > 0) eventhough the economy is stagnationist if the following condition holds (inabsolute value):
that is, if utilization is relatively profit share-inelastic, and this condition ismore likely to hold if investment is relatively responsive to profitability (g1 islarge) and relatively unresponsive to utilization (g2 is small). Growth is wage-led (dgydp < 0) in the opposite case.
du
d u
g
g upp pn
× < 1
2
Distribution, demand and growth 139
Downloaded from Elgar Online by University of Melbourne at 07/12/2013 04:02:56AM

FISCAL POLICY AND THE PROGRESSIVITY OF INCOME TAXATION
The results of the previous section may appear to be relevant only to countrieswith high workersÕ saving rates, such as the East Asian economies. But thesame principles apply to the effects of income taxation, when effective taxrates differ between labour and capital income. Income taxes also constituteÔleakagesÕ from income-expenditure flows, and personal income tax rates canbe much larger than household savings rates.29 Thus, even where savings outof wages are relatively small, the progressivity or regressivity of the taxsystem can affect whether an economy is stagnationist or exhilarationist andwhether growth is wage-led or profit-led.
Suppose the government levies income taxes at the rates tr on profits and twon wages. We define the progressivity of the tax system by the extent to whichtr exceeds tw. The income shares p and (1 Ð p) are now interpreted as pre-taxshares and we continue to take p as exogenously given for simplicity.30 Taxrevenue, in proportion to the capital stock, is equal to:
TyK = [trp + tw(1 Ð p)]u [8.22]
Government spending is assumed to be a constant proportion of the capitalstock for simplicity:
GyK = cg. [8.23]
Assuming that personal and corporate savings come out of after-tax income,total private saving (in proportion to the capital stock) can be expressed as:
gs = [sr(1 Ð tr)p + sw(1 Ð tw)(1 Ð p)]u [8.17¢]
Assuming that business firms consider after-tax profits in making investmentdecisions, the investment function [8.18] becomes:
gi = g0 + g1(1 Ð tr)pv + g2u [8.18¢]
With a government sector but no foreign trade, the goods market equilib-rium condition can be written as:
gs + (T Ð G)yK = gi [8.24]
Substituting [8.22], [8.23], [8.17¢] and [8.18¢] into [8.24] and rearranging, weget the IS curve:
140 Kaleckian models of demand-led growth
Downloaded from Elgar Online by University of Melbourne at 07/12/2013 04:02:56AM

[(sr Ð sw)p + sw Ð g2]u = cg + g0 + g1(1 Ð tr )pv [8.25]
where sr and sw are Ôsaving-cum-tax ratesÕ for each type of income[sj = sj(1 Ð tj) + tj, j = r, w]. This yields the solution:
u = [cg + g0 + g1(1 Ð tr)pv]ys(p) [8.26]
where s(p) = (sr Ð sw)p + sw Ð g2 > 0 for stability, with slope:
duydp = [(sw Ð g2)g1(1 Ð tr)v Ð (sr Ð sw)(cg + g0)]y[s(p)]2 [8.27]
This slope is ambiguous in sign, creating the possibility of either stagna-tionist or exhilarationist regimes. The bigger is the saving-cum-tax rate out ofwages sw relative to the corresponding rate out of profits sr, the higher (thatis, more positive or less negative) is the slope duydp, and the more likely is anexhilarationist outcome. Thus, a more regressive tax system (in the sense thatwage and profit income are taxed at relatively similar rates) makes the econ-omy more likely to be exhilarationist, while a more progressive tax systemmakes the economy more likely to be stagnationist, holding other factorsequal. If the economy is stagnationist, it can be either cooperative or conflic-tive and it can have either wage-led or profit-led growth. Generally, highertaxation of wages relative to profits makes a stagnationist economy morelikely to be conflictive and to have profit-led growth, ceteris paribus.
INTERNATIONAL COMPETITION AND CAPITALMOBILITY
In an open economy, both international competition and capital mobility31
potentially make it more difficult for either demand or growth to be wage-led,depending on the forms that openness takes. Generally speaking, the more acountryÕs products are exposed to price-based competition with similar typesof foreign products in both home and foreign markets (that is, domestic andforeign goods are close substitutes and markets are relatively open), and themore a countryÕs investment is sensitive to relative profitability vis-�-vis othercountries (for example, because countries are competing for multinationalinvestment based on low unit labour costs), the more likely it is that the coun-tryÕs economy will behave in an exhilarationist (or conflictive-stagnationist)fashion.
For example, if increased nominal wages are passed through (to any extent)into higher goods prices, domestic products become less competitivecompared with foreign products and the trade balance is likely to worsen, with
Distribution, demand and growth 141
Downloaded from Elgar Online by University of Melbourne at 07/12/2013 04:02:56AM

a negative impact on aggregate demand. At the same time, internationalcompetitive pressures are likely to prevent firms from fully passing throughwage increases into higher prices, and thus profit margins are squeezed.32 Asa result, a redistribution of income towards wages puts downward pressure onaggregate demand via the trade channel. Also, if increased wages lead to areduction in the rate of profit, investment in the home country will become lessattractive compared with investment in foreign countries, thus leading to lowerdomestic investment (by both domestic and foreign capital). If these types ofeffects are strong enough to outweigh other effects of higher wages (especiallythe boost to consumption), they can possibly tilt the scales towards an exhila-rationist regime, or at least towards conflictive stagnationism and profit-ledgrowth.
There are several qualifications to this analysis. First, these considerationsapply only to individual countries that are open to trade and investment flows;the world economy as a whole remains a closed system and hence is notsubject to these types of competitive effects. Second, country size matters: thesmaller a country, and the greater are its shares of trade and foreign investmentin GDP, the more these kinds of competitive effects are likely to impact on thedomestic economy. Third, policy regimes also matter: protectionist trade poli-cies and controls on direct investment can make a countryÕs trade and invest-ment relatively insensitive to changes in relative prices or profitability, even ifthe country is small and the shares of foreign trade and investment are rela-tively large. Finally, the kinds of price-competitive effects emphasized heremay be less significant over longer time horizons than they are in the shortrun.33
Extending the neo-Kaleckian model to incorporate these aspects of inter-national trade and investment requires three modifications. First, the price-costmargin j in equation [8.1] needs to be made flexible in order to capture firmsÕreactions to international competitive pressures. For mathematical conve-nience, the profit margin is determined by the following constant-elasticityfunction:34
j = Fqq [8.28]
where q = eP*yP is the real exchange rate, e is the nominal exchange rate(home currency price of foreign exchange), P* is the foreign currency price ofcompeting products from other countries, F > 1 is the domestic firmsÕ ÔtargetÕprofit margin (an exogenously given parameter, reflecting KaleckiÕs Ôdegree ofmonopolyÕ) and q > 0 is the elasticity of the price-cost margin with respect tothe real exchange rate. Foreign prices P* are taken as exogenously given onthe small country assumption, while the nominal exchange rate e is assumedto be either fixed by government policy or else determined by financial factors
142 Kaleckian models of demand-led growth
Downloaded from Elgar Online by University of Melbourne at 07/12/2013 04:02:56AM

outside this model.35 The domestic price P is determined by [8.1], assumingfor simplicity that there are no imported intermediate goods and labour is theonly variable input. Substituting [8.28] into [8.1], using the definition of q, andsolving for j yields:
j = F1/(1+q)zq/(1+q) [8.29]
where z = eP*yaW = qj is the ratio of the price of foreign goods to domesticunit labour costs.36 Substituting [8.29] into [8.2], the profit share becomes apositive function of two underlying factors: the target profit margin F and thecost-competitiveness ratio z:
p = [F1/(1+q)zq/(1+q) Ð 1]yF1/(1+q)zq/(1+q) = p(F, z) [8.30]
with pF > 0 and pz > 0.37
Second, in the presence of capital mobility, domestic investment may besensitive to the difference between the domestic and foreign rates of return,that is, profit rates. This suggests modifying the investment function [8.18] asfollows:
gi = g0 + g1(pv Ð r*) + g2u [8.18¢¢]
where r* is the foreign rate of profit (taken as exogenously given on the smallcountry assumption).38 In addition, as suggested by You (1991), capital mobil-ity may imply a relatively high g1 coefficient (profitability effect on invest-ment), at least in situations where ÔfootlooseÕ capital chooses productionlocations based on relative profitability considerations.
Third, the saving-investment equilibrium condition needs to be modified toinclude the trade balance. We allow for saving out of both wages and profitshere, but assume no government spending or taxation for simplicity. Thisimplies the equilibrium condition:
gs = gi + b [8.31]
where gs is given by equation [8.17] above, gi is determined by [8.18¢¢], b isthe trade balance (measured as a ratio to the capital stock)39 and the rest of thecurrent account (net factor income inflows plus net unilateral transfers) isassumed to be zero for simplicity. The trade balance is determined by thefollowing reduced-form specification:
b = b(q, u) [8.32]
Distribution, demand and growth 143
Downloaded from Elgar Online by University of Melbourne at 07/12/2013 04:02:56AM

Assuming the MarshallÐLerner conditions holds,40 a real depreciation(increase in q) improves the trade balance (bq > 0). Higher capacity utilizationincreases import demand and thus worsens the trade balance (bu < 0).
Substituting [8.17], [8.18²] and [8.32] into [8.31], and using [8.29] and[8.30], we obtain the IS curve (goods market equilibrium condition):
[(sr Ð sw)p(F, z) + sw]u = g0 + g1[p(F, z)v Ð r*]+ g2u + b[FÐ1/(1+q)z1/(1+q), u]
[8.33]
where we have substituted q = zyj = FÐ1/(1+q)z1/(1+q). In this model, wecannot consider exogenous variations in p and must instead analyse theeffects of changes in its underlying determinants, the target profit margin Fand the cost-competitiveness ratio z. Although F and z have symmetrical,positive effects on p, they have opposite effects (negative and positive,respectively) on the real exchange rate q and therefore on the trade balance b.Thus, whether the economy exhibits stagnationist or exhilarationist behav-iour in this open economy model depends on the source of a distributionalshift.
Consider first an increase in cost competitiveness z, which could resultfrom a currency depreciation (risen in e), foreign inflation (rise in P*), produc-tivity improvement (decrease in a) or wage cut (fall in W ). Totally differenti-ating [8.33] with respect to u and z yields:
duydz = {[Ð(sr Ð sw)u + g1v]pz + [qyz(1 + q)]bq}ySo(p) [8.34]
where So(p) = (sr Ð sw)p + sw Ð g2 Ð bu > 0 for goods-market stability (thesubscript ÔoÕ stands for Ôopen economyÕ).41 The numerator of [8.34] isambiguous in sign, thus allowing for either stagnationist or exhilarationistoutcomes, but the open economy effects tend to push the system more in thelatter direction. The sign of the first term in the numerator, [×]pz, determineswhether the economy would be stagnationist (if negative) or exhilarationist (ifpositive) if it were closed to foreign trade.42 This term can also be thought ofas the effect of the rise in the profit share on domestic absorption (that is,consumption plus investment).
In addition, the positive term [qyz(1 + q)]bq, which reflects the gains in netexports from improved cost competitiveness, makes duydz more likely to bepositive, assuming that the MarshallÐLerner condition is satisfied. Even if theeconomy would be stagnationist in the absence of trade effects, internationalcompetition can make it exhilarationist if the increase in net exports caused bya rise in z (which also increases p) is large enough to outweigh the decrease indomestic absorption.43 Whether this occurs depends on the magnitude of theMarshallÐLerner elasticities and the ratio of the trade balance to the capital
144 Kaleckian models of demand-led growth
Downloaded from Elgar Online by University of Melbourne at 07/12/2013 04:02:56AM

stock, both of which are reflected in bq. In addition, the profitability effect oninvestment demand g1v is likely to be greater in the presence of capital mobil-ity, which also makes duydz more likely to be positive and the economy morelikely to be exhilarationist.44
Second, consider the effect of a higher target profit margin F, which isgiven by:
duydF = {[Ð(sr Ð sw)u + g1v]pF Ð [qyF(1 + q)]bq}ySo(p) [8.35]
Although this derivative is also ambiguous in general, it is much morelikely to be negative than [8.34] because in this case the internationalcompetitive effect (Ð[qyF(1 + q)]bq) is negative (again assuming MarshallÐLerner). When domestic firms increase their target profit margins, theyhave to raise their prices and thus their goods become less competitiveinternationally, causing net exports to fall. Only a strong profitability effecton investment demand (g1v) combined with a relatively large saving rateout of wages (sw) could make [8.35] positive. Thus, an open economy ismore likely to behave in a stagnationist fashion in response to changes infirmsÕ target profit margins than in response to changes in cost competi-tiveness. As a result, competition policies that reduce firmsÕ monopolypower and lower their target profit margins are still likely to be expansion-ary in an open economy, while raising real wages and redistributing incometo labour.45
Finally, this model can be used to analyse how the impact of a currencydevaluation is affected by its distributional impact. Since a devaluationincreases z, the effect on utilization (output) is determined by [8.34]: a deval-uation is contractionary if the economy is stagnationist (duydz < 0),46 andexpansionary if the economy is exhilarationist (duydz > 0). The effect on thetrade balance is given by:
dbydz = [qyz(1 + q)]bq + (duydz)bu [8.36]
The first term in [8.36] is the the relative price effect, which is positive underthe standard MarshallÐLerner condition. The second term is the income effect,which depends on whether the economyÕs response to the devaluation is stag-nationist or exhilarationist. If the economy is stagnationist and the devaluationis contractionary, the fall in utilization reduces the demand for imports andtherefore further improves the trade balance (recall that bu < 0). If the econ-omy is exhilarationist and the devaluation is expansionary, however, the risein utilization increases the demand for imports and thereby reduces theimprovement in the trade balance.47
Distribution, demand and growth 145
Downloaded from Elgar Online by University of Melbourne at 07/12/2013 04:02:56AM
CONCLUSIONS
Most early neo-Kaleckian models of demand-constrained growth tended toassume conditions that implied what has become known as Ôcooperative stag-nationismÕ: a situation in which a rise in the profit mark-up rate (or profitshare) depresses aggregate demand, capacity utilization, realized profits andeconomic growth. Under these conditions, redistributive policies favouringlabour are mutually beneficial to all classes in society. However, later modelsrevealed that this optimistic policy implication was implicitly based on anumber of highly restrictive assumptions. These assumptions included weakprofitability effects and strong accelerator effects on investment demand,negligible workersÕ saving, progressive tax systems, high trade barriers (orlow price elasticities of export and import demand) and immobile capital (or,at least, foreign investment motivated by factors other than profit rate differ-entials).
If these assumptions are relaxed, the door is opened to other possibleoutcomes. With relatively strong profitability effects and weak acceleratoreffects on investment, relatively high workersÕ saving, regressive tax systems,liberalized trade flows, high price elasticities and high capital mobility, aneconomy can become ÔexhilarationistÕ in the sense that redistributing incometowards profits stimulates aggregate demand and raises capacity utilization.Indeed, an economy need only have some of these conditions, not all, in orderto become exhilarationist. In addition, there are a variety of intermediateregimes that are weakly stagnationist (in the sense that a higher profit shareonly moderately depresses aggregate demand and capacity utilization andraises the realized rate of profit) and in which growth can be profit-led (in thesense that a higher profit share increases desired investment and the capitalaccumulation rate).
These intermediate regimes have been referred to as Ôconflictive-stagna-tionistÕ, because there is an incentive for capitalists to seek increases in profitmargins in order to raise their realized profit rates and increase the growth oftheir capital, in spite of the negative effects on output and employment. Yetwhat these intermediate regimes really do is to shift the onus of ÔcooperationÕfrom capitalists onto workers: instead of capitalists being forced to accept alower profit share in order to realize higher profit and growth rates, workersare forced to accept a lower wage share (and lower real wages48 and employ-ment) in order to obtain faster growth that eventually increases employment inthe future.
These theoretical distinctions have important practical implications in lightof recent structural changes and policy shifts in the global economy. As aresult of both technological advances and liberalization policies, Ôglobaliza-tionÕ has made most countries more open to international trade and foreign
146 Kaleckian models of demand-led growth
Downloaded from Elgar Online by University of Melbourne at 07/12/2013 04:02:56AM
investment than they were in previous decades (Baldwin and Martin, 1999).Many governments have made their tax systems less progressive throughfiscal ÔreformsÕ that have effectively shifted the burden of taxation from capi-tal to labour. A number of major countries, especially in East Asia, have veryhigh workersÕ saving rates. All of these factors suggest that many countriestoday are at least conflictive-stagnationist if not exhilarationist, and thatgrowth is often profit-led even where aggregate demand constraints on growthare binding.49 Nevertheless, since the world as a whole remains a closed econ-omy, the entire global economy can still be depressed by policies that repressaverage wages in most countries, even if some individual countries can gainshort-run competitive advantages in the process.
NOTES
1. The author wishes to acknowledge helpful comments and suggestions from Marc Lavoie,Tracy Mott and Lance Taylor, as well as feedback from his graduate students at AmericanUniversity, on earlier versions of this chapter. The usual caveats apply.
2. KaleckiÕs work on such models, from the earliest versions in the 1930s through the mostdefinitive treatments in the 1950s, is collected in Kalecki (1990, 1991).
3. Steindl also hypothesized that established oligopolistic firms would tend to capture the bene-fits of cost-reducing technological progress through rising profit margins, rather than passthe cost savings on to consumers through lower prices. Thus, the tendency towards risingprofit margins would continue during the stage of mature or oligopolistic capitalism, a viewlater expanded upon by Baran and Sweezy (1966).
4. I am indebted to Marc Lavoie for pointing out Del MonteÕs priority in this area. Del MonteÕswork, which was published in Italian, is little known among Anglo-American economists,and did not influence the later literature developed mostly in the USA and UK. Yet DelMonte obtained the same core results later obtained by Rowthorn, Dutt and Taylor regard-ing the negative effects of an increased degree of monopoly (profit mark-up) on steady-statecapacity utilization and economic growth. Lavoie (1992, p. 297) reports that Rowthorn andDutt each independently arrived at the same results, and Taylor (1983, p. 210, note 7)acknowledges that DuttÕs (1982) doctoral dissertation was the basis for his own work onstagnationism.
5. Taylor (1985) used a slightly different investment function, in which investment dependspositively on the net profit rate (after interest costs) and negatively on the profit mark-up (asa Ôreduced formÕ representing the presumptive negative effect of the mark-up on utilization).Amadeo (1986) assumed that investment was a function of the utilization rate only, basedon a rather peculiar reading of Steindl. Amadeo also considered positive saving out of wagesin an appendix (see note 28 below).
6. Some economists (for example, Skott, 1989; Dum�nil and L�vy, 1995) object to any modelin which capacity utilization is an endogenous variable in the long run. However, Lavoie(1996) shows that utilization can be a variable even in a fully adjusted long-run equilibriumprovided that there are hysteresis effects, that is, firms adapt their expectations of normalutilization to actual, past utilization rates. In this chapter, we sidestep this issue by consid-ering only short-run comparative statics.
7. Rowthorn contrasted the neo-Kaleckian case of excess capacity with the neo-Keynesian caseof full capacity, arguing that the traditional inverse relationships between the real wage andthe profit rate and between the real wage and the growth rate would only hold in the lattercase. Rowthorn included overhead labour in his models. Dutt emphasized developmentissues specific to the Indian economy in his 1984 paper, and stressed conflicting claims
Distribution, demand and growth 147
Downloaded from Elgar Online by University of Melbourne at 07/12/2013 04:02:56AM

inflation in his 1987 paper (a critique of Marglin, 1984). Taylor also analysed conflictingclaims inflation and emphasized asset market interactions and long-run dynamics in his1985 paper. TaylorÕs 1983 book included imported intermediate goods in variable costs andfocused on applications to development issues.
8. Marglin and Bhaduri also make another distinction, between ÔcooperativeÕ and ÔconflictiveÕregimes, which is discussed below.
9. This result requires a flexible or endogenous mark-up rate, while most (although not all) ofthe purely stagnationist models assume an exogenous mark-up. See also Sarantis (1990Ð1)and Blecker (1999) for other neo-Kaleckian models of open economies, and Bowles andBoyer (1995) and Stanford (1998) for empirical estimates of open economy effects.
10. The most complete synthesis to date is Mott and Slattery (1994b).11. Chapters in this book that consider some of these dynamic extensions include those by
Cassetti and Lavoie. Neo-Kaleckian macro-models are extended to incorporate finance andexpectations in Taylor (1991).
12. This model represents the ÔcoreÕ analysis of aggregate demand in Rowthorn (1982), Dutt(1984, 1987) and Taylor (1983, 1985), although (as discussed in note 7 above) these authorsalso considered a variety of other issues.
13. KaleckiÕs Ôdegree of monopolyÕ depends positively on the degree of industrial concentration,the level of overhead costs, and the sales effort, and inversely on the power of trade unions.In an open economy context, the degree of monopoly can be influenced by the degree offoreign competition. See Karier (1988) and the discussion of open economies, below.
14. Note that u = (YyY*)(Y*yK), where YyY* is the ratio of actual to potential output (the trueutilization rate) and Y*yK is the ratio of potential output (capacity) to the capital stock(defined as v, below), which may be assumed to be technologically fixed.
15. Equation (5) is written in linear form for convenience, but none of the results in this sectiondepend on the assumption of linearity. Steindl (1979) proposed a similar investment func-tion, but did not derive the type of analytical results shown here as did the other authors.
16. Del MonteÕs (1975) investment function included a true accelerator effect, that is, the growthrate of output. Del Monte used the changes in both the profit rate and the growth rate alongwith level of the output-capital ratio in his function for gi = IyK.
17. Note that a stagnationist economy need not actually be stagnant. Stagnationism is simply thecase of wage-led aggregate demand, in which an increased profit share depresses aggregatedemand, but an increased wage share boosts it.
18. Mathematically, substituting [8.3] into [8.5] and totally differentiating yields dgi = f1pdu +f1udp + f2du. If du/u = Ðdp/p, the first two terms cancel and dgi = Ðf2(uyp)dp < 0 (fordp > 0). Thus, the Ôstrong accelerator conditionÕ results from the fact that u is essentiallydouble-counted in [8.5]: f2u is the direct effect of u on gi, but the f1r = f1pu term contains asecond, indirect effect of u on gi as well.
19. Mott and Slattery (1994b) dispute this argument. They respond that investment depends on thelevel of realized profits because realized profits are the source of the Ôcash flowÕ that relievesfinancial constraints on investment. Normalizing investment and profits by the capital stockyields an investment function more like [8.5], rather than [8.10]. Mott and Slattery dismissMBÕs concerns over the double-counting of utilization effects in [8.5] because there is boththeoretical and empirical support for retain profits (cash flow) and utilization rates (or acceler-ator effects) having independent, positive effects on investment. In contrast, they argue thatthere is neither theoretical nor empirical support for investment depending on the profit share.
20. MB rationalize this function by asserting, following Robinson (1962), that desired accumu-lation depends on the expected profit rate re. They then argue that profit expectations arebased on the two variables, u and p, which determine r. Thus, gi = h(re), with re = re(p, u),implies gi = h(re(p, u)), which is equivalent to [8.10].
21. Just as a stagnationist economy is not necessarily stagnant, an exhilarationist economy isnot necessarily booming since it can be subject to a Ôprofit-squeezeÕ crisis. Although theterminology can be confusing, a low profit share causes stagnation in an exhilarationisteconomy.
22. See Marglin and Bhaduri (1990) for a graphical representation of this elasticity condition.However, they write their derivatives and elasticities upside-down as (in our notation) dpydu
148 Kaleckian models of demand-led growth
Downloaded from Elgar Online by University of Melbourne at 07/12/2013 04:02:56AM

and (d ln pyd ln u). This is confusing, since p is the independent variable and u is the dependentvariable, and it means that all their elasticity conditions are inverses of the ones shown here.
23. The exhilarationist case also allows for cooperative and conflictive sub-cases,, althoughthey have to be defined differently since drydp > 0 and dgydp > 0 always hold underexhilarationism. As shown in Table 8.1, the distinction is based on whether a rise inp leads to an increase or decrease in total real labour income, WNyP = uKyj = (1 Ð p)uK(that is, whether the rise in employment is large enough to offset the fall in the real wageor labour share). This condition can also be expressed in terms of the elasticity of theutilization rate with respect to the profit share. Cooperative exhilarationism results when(d ln u)y(d ln p) > py(1 Ð p) and conflictive exhilarationism results when(d ln u)y(d ln p) < py(1 Ð p).
24. I am indebted to the editor for suggesting this way of phrasing the point.25. However, the model with [8.10¢] can be either conflictive or cooperative and growth can be
either profit- or wage-led, since the signs of drydp and dgydp are ambiguous.26. Ironically, one functional form that readily implies the possibility of exhilarationism is [8.5],
provided that we allow for f2 < 0 while assuming f1p + f2 > 0 (that is, ¶giy¶u > 0, holdingp constant).
27. None of the qualitative results in this section depend on using the specific investment func-tion [8.18]. All of these results could be obtained using [8.5] together with [8.17], since withsw > 0 the model need not yield cooperative-stagnationist results in order to satisfy the stabil-ity condition. See Taylor (1990) and Mott and Slattery (1994b).
28. The possibility of a conflictive-stagnationist outcome with positive saving out of wages wasanticipated (although not recognized) by Amadeo (1986, p. 94). Amadeo shows that (in ournotation) drydp is ambiguous in sign when sw > 0, but du/dp < 0 and dgydp < 0 always holdin his model due to his peculiar investment function (see note 5 above), regardless ofwhether workers save. The ambiguity in drydp is buried in a mathematical appendix and notdiscussed in the text. I am indebted to Marc Lavoie for this reference.
29. For example, wages in the USA today are subject to federal income taxes at either a 15 percent or 28 per cent marginal rate, a social insurance payroll tax of 15.3 per cent and state andlocal income taxes of varying rates. In contrast, the US personal saving rate has generallybeen below 10 per cent in recent decades and fell below 5 per cent in 1996Ð9, and this is anupper bound on workersÕ saving since it is an average rate including wealthy households thatreceive capital income.
30. This assumption avoids the issue of tax incidence, that is, to what degree firms can shift theirtax burden onto consumers (most of whom are workers) via higher prices, and to what extentworkers can shift their tax burden onto firms via increased wages. This chapter is concernedwith the effects of variations in income distribution under a given tax structure rather thanthe effects of changes in tax rates on different classes of income earners. For a neo-Kaleckian analysis of tax incidence, see Mott and Slattery (1994a).
31. Capital mobility here refers to direct investment by multinational corporations in productivefacilities, not to purely financial flows.
32. Profit margins in open economies are sensitive to changes in the real exchange rate (relativeprice of foreign to domestic goods), as emphasized by Krugman and Taylor (1978). Realappreciation induces firms to ÔsqueezeÕ j in order to preserve market shares (both at homeand abroad), while real depreciation allows firms to raise j without losing market shares. Asshown analytically below, a rise in the home country nominal wage is equivalent to a realappreciation.
33. Relative price effects on the trade balance are ruled out by assumption in most models ofbalance-of-payments-constrained growth, as discussed in the chapters by McCombie andAtesoglu in this volume. In part, this difference can be attributed to the fact that thosemodels take a long-term perspective, and it is more reasonable to assume that relative pricesare stable over long periods of time (that is, relative purchasing power parity is more likelyto hold in the long run Ð see Rogoff, 1996). In addition, there are different views aboutwhether price elasticities are large enough to lead to significant competitive effects on thetrade balance and economic growth. Finally, the present model does not assume a balance-of-payments constraint; the trade balance is endogenous and any resulting trade imbalance
Distribution, demand and growth 149
Downloaded from Elgar Online by University of Melbourne at 07/12/2013 04:02:56AM
is assumed to be accommodated by the requisite net capital flows. While these differencescannot be resolved here, the open economy model presented in this chapter is designed tohighlight the implications of relative price effects when they are large enough to matter andwhen trade balances are unconstrained.
34. This approach has been used previously by Blecker (1989) and Blecker and Seguino (2002).For an alternative approach to modelling a flexible mark-up see Blecker (1999).
35. The real exchange rate q is not fixed at unity because domestic and foreign products areassumed to be imperfect substitutes, and hence the Ôlaw of one priceÕ does not apply.
36. The elasticity q is inversely related to the degree of Ôexchange rate pass-throughÕ, which ismeasured by 1 Ð [qy(1 + q)] = 1y(1 + q). Thus, pass-through is full when q = 0 and j = Fis a constant, and approaches zero in the limit as q approaches infinity and j becomes moreand more sensitive to z.
37. In this specification, the sensitivity of income shares to international competition impliesthat those shares are sensitive to domestic wage-setting as well. If workers win a highernominal wage rate W, z = eP*yaW falls, which lowers the profit share p. This did not occurin the closed economy model, where j was determined independently of W.
38. A similar specification is used in Blecker (1996) in a two-country setting.39. Note that b is likely to be inversely related to country size, holding other factors equal, and
therefore trade effects will tend to be relatively smaller in larger countries.40. This requires assuming that the sum of the price elasticities of demand for exports and
imports exceeds unity in absolute value. Strictly speaking, this condition requires assumingb = 0 initially, but analogous elasticity conditions can be derived with initially imbalancedtrade. Of course, if this condition is violated, or if there is a large initial trade imbalance (forexample, a large deficit, with the trade balance measured in domestic currency), then bq ² 0is possible.
41. Note that since Ðbu > 0, the stability condition is easier to satisfy in an open economy.42. It can be shown that [Ð(sr Ð sw)u + g1v]ySo(p) in (34) is equal to [(sw Ð g2)g1v -
Ð (sr Ð sw)g0)]y[S(p)]2 in [8.21] when trade balance effects are eliminated.43. Of course, if the domestic absorption effect is positive, then the economy is definitely exhil-
arationist as long as bq > 0.44. Although space limitations preclude a full discussion of drydz and dgydz here, it should be
noted that even if duydz < 0 (stagnationism), the open economy effects (internationalcompetition and capital mobility) tend to make the elasticity (duydz)(zyu) smaller inabsolute value, and hence make the economy more likely to be conflictive-stagnationist(drydz > 0) and to have profit-led growth (dgydz > 0).
45. A similar result was obtained by Dutt (1984), who assumed a fixed mark-up rate thatreflected monopoly power of firms. Thus, Dutt obtained a result similar to [8.35] but couldnot obtain [8.34].
46. This is the case considered by Krugman and Taylor (1978).47. See Blecker (1999) for a further analysis of the effects of a devaluation on the trade balance.48. An exception is the case of an increase in labour productivity (decrease in a) in the open
economy model, which can potentially lead to an increase in the real wage even though thewage share falls.
49. As various authors (for example, Rowthorn, 1982; Amadeo, 1986; Taylor, 1991) make clear,once economies reach capacity constraints they are likely to revert to profit-led growth.
REFERENCES
Amadeo, E.J. (1986) ÔNotes on capacity utilization, distribution and accumulation,ÕContributions to Political Economy, 5, 83Ð94.
Asimakopulos, A. (1975) ÔA Kaleckian theory of income distribution.Õ CanadianJournal of Economics, 8, 313Ð33.
150 Kaleckian models of demand-led growth
Downloaded from Elgar Online by University of Melbourne at 07/12/2013 04:02:56AM
Baldwin, R.E. and P. Martin (1999) ÔTwo waves of globalization: superficial similari-ties, fundamental differences,Õ NBER Working Paper no. 6904, January.
Baran, P.A. and P.M. Sweezy (1966) Monopoly Capital: An Essay on the AmericanEconomic and Social Order, New York, Monthly Review Press.
Bhaduri, A. and S.A. Marglin (1990) ÔUnemployment and the real wage: the economicbasis for contesting political ideologies,Õ Cambridge Journal of Economics, 14,375Ð93.
Bleaney, M.F. (1976) Underconsumptionist Theories: A History and Critical Analysis,New York, International Publishers.
Blecker, R.A. (1989) ÔInternational competition, income distribution and economicgrowth,Õ Cambridge Journal of Economics, 13, 395Ð412.
Blecker, R.A. (1996) ÔThe new economic integration: structuralist models ofNorthÐSouth trade and investment liberalization,Õ Structural Change and EconomicDynamics, 7, 321Ð45.
Blecker, R.A. (1999) ÔKaleckian macro models for open economies,Õ in J. Deprez andJ.T. Harvey (eds) Foundations of International Economics: Post KeynesianPerspectives, London, Routledge, 116Ð49.
Blecker, R.A. and S. Seguino (2002) ÔMacroeconomic effects of reducing gender wageinequality in an export-oriented, semi-industrialized economy,Õ Review ofDevelopment Economics 6, forthcoming.
Bowles, S. and R. Boyer (1995) ÔWages, aggregate demand, and employment in anopen economy: an empirical investigation,Õ in G. Epstein and H. Gintis (eds)Macroeconomic Policy After the Conservative Era, Cambridge, CambridgeUniversity Press, 143Ð71.
Chick, V. and M. Caserta (1997) ÔProvisional equilibrium and macroeconomic theory,Õin P. Arestis, G. Palma and M. Sawyer (eds) Markets, Unemployment and EconomicPolicy: Essays in Honour of Geoff Harcourt, vol. II, London, Routledge, 223Ð37.
Del Monte, A. (1975) ÔGrado di monopolio e sviluppo economico,Õ RivistaInternazionale di Scienze Sociale, 83, 231Ð63.
D�az-Alejandro, C.F. (1963) ÔA note on the impact of devaluation and the redistributiveeffect,Õ Journal of Political Economy, 71, 577Ð80.
Dum�nil, G. and D. L�vy (1995) ÔA Post-Keynesian long-term equilibrium with equal-ized profit rates?Õ Review of Radical Political Economics, 27, 135Ð41.
Dutt, A.K. (1982) ÔStagnation, income distribution, and monopoly power,Õ unpublishedPh.D. dissertation, Massachusetts Institute of Technology.
Dutt, A.K. (1984) ÔStagnation, income distribution, and monopoly power,Õ CambridgeJournal of Economics, 8, 25Ð40.
Dutt, A.K. (1987) ÔAlternative closures again: a comment on ÒGrowth, distribution andinflationÓ,Õ Cambridge Journal of Economics, 11, 75Ð82.
Harris, D.J. (1974) ÔThe price policy of firms, the level of employment and distributionof income in the short run,Õ Australian Economic Papers, 13, 144Ð51.
Kalecki, M. (1937) ÔThe principle of increasing risk,Õ Economica, 4, 440Ð47.Kalecki, M. (1954) Theory of Economic Dynamics, London, Unwin. Reprinted New
York, Monthly Review Press, 1968.Kalecki, M. (1990) Collected Works of Michaò Kalecki, Volume I, Capitalism: Business
Cycles and Full Employment, ed. J. Osiatyn«ski, trans. C.A. Kisiel, Oxford, OxfordUniversity Press.
Kalecki, M. (1991) Collected Works of Michalò Kalecki, Volume II, Capitalism:Economic Dynamics, ed. J. Osiatyn«ski, trans. C.A. Kisiel, Oxford, OxfordUniversity Press.
Distribution, demand and growth 151
Downloaded from Elgar Online by University of Melbourne at 07/12/2013 04:02:56AM

Karier, T. (1988) ÔNew evidence on the effects of unions and imports on monopolypower,Õ Journal of Post Keynesian Economics, 10, 414Ð27.
Krugman, P.R. and L. Taylor (1978) ÔContractionary effects of devaluation,Õ Journal ofInternational Economics, 8, 445Ð56.
Lavoie, M. (1992) Foundations of Post-Keynesian Economic Analysis, Aldershot,Edward Elgar.
Lavoie, M. (1996) ÔTraverse, hysteresis, and normal rates of capacity utilization inKaleckian models of growth and distribution,Õ Review of Radical PoliticalEconomics, 28, 113Ð47.
Marglin, S.A. (1984) ÔGrowth, distribution and inflation: a centennial synthesis,ÕCambridge Journal of Economics, 8, 115Ð44.
Margin, S.A. and A. Bhaduri (1990) ÔProfit squeeze and Keynesian theory,Õ in S.A.Marglin and J.B. Schor (eds) The Golden Age of Capitalism, Oxford, OxfordUniversity Press, 153Ð86.
Mott, T. and E. Slattery (1994a) ÔTax incidence and macroeconomic effects in aKaleckian model when profits finance affects investment and prices may respond totaxes,Õ Journal of Post Keynesian Economics, 16, 391Ð409.
Mott, T. and E. Slattery (1994b) ÔThe influence of changes in income distribution onaggregate demand in a Kaleckian model: stagnation vs. exhilaration reconsidered,Õin P. Davidson and J. Kregel (eds) Employment, Growth, and Finance, Cheltenham,Edward Elgar, 69Ð82.
Robinson, J. (1962) An Essay on the Theory of Economic Growth, London, Macmillan.Rogoff, K. (1996) ÔThe purchasing power parity puzzle,Õ Journal of Economic
Literature, 34, 647Ð68.Rowthorn, B. (1982) ÔDemand, real wages and economic growth,Õ Studi Economici, 18,
3Ð53.Sarantis, N. (1990Ð1) ÔDistribution and terms of trade dynamics, inflation, and
growth,Õ Journal of Post Keynesian Economics, 13, 175Ð98.Skott, P. (1989) ÔEffective demand, class struggle and cyclical growth,Õ International
Economic Review, 30, 231Ð47.Stanford, J. (1998) ÔOpenness and equity: regulating labor market outcomes in a glob-
alized economy,Õ in D. Baker, G. Epstein and R. Pollin (eds) Globalization andProgressive Economic Policy, Cambridge, Cambridge University Press, 245Ð70.
Steindl, J. (1952) Maturity and Stagnation in American Capitalism, Oxford, Blackwell.Reprinted New York, Monthly Review Press, 1976.
Steindl, J. (1979) ÔStagnation theory and stagnation policy,Õ Cambridge Journal ofEconomics, 3, 1Ð14.
Taylor, L. (1983) Structuralist Macroeconomics, New York, Basic Books.Taylor, L. (1985) ÔA stagnationist model of economic growth,Õ Cambridge Journal of
Economics, 9, 383Ð403.Taylor, L. (1990) ÔReal and money wages, output and inflation in the semi-industrial-
ized world,Õ Economica, 57, 329Ð53.Taylor, L. (1991) Income Distribution, Inflation, and Growth, Cambridge, MA, The
MIT Press.You, J. (1991) ÔCapitalÐlabor relations and economic development,Õ unpublished Ph.D.
dissertation, Harvard University.
152 Kaleckian models of demand-led growth
Downloaded from Elgar Online by University of Melbourne at 07/12/2013 04:02:56AM

9. Longer-run aspects of Kaleckianmacroeconomics
Tracy Mott1
INTRODUCTION
The significance of Ôlonger-runÕ factors was soon appealed to as a counter tothe conclusions of ÔKeynesianÕ macroeconomics following the publication ofJ.M. KeynesÕs General Theory in 1936. The first major use of such was byA.C. Pigou (1943). The idea that money wage and price-level changes wouldeventually occur in response to aggregate demand effects on output andemployment was well acknowledged by Keynes. What Keynes denied thatPigou sought to demonstrate was that money wage or price-level movementsare capable of restoring the full employment level of output in an economy.
PigouÕs argument was never championed as a device that would continu-ously maintain full employment, and many economists who found the logic ofthe argument convincing held that its workings would require too long a timefor it to have practical significance. Coupled with the notion of the stability ofthe demand for money, however, ÔmonetaristsÕ, led by Milton Friedman,posited that the return to a level of output consistent with the Ônatural rateÕ ofunemployment would occur soon enough as to make the use of activistdemand-management policies pointless and perhaps even destabilizing.2 Theoccurrence of price inflation at levels of unemployment thought to be signifi-cantly above full employment in the industrialized capitalist economies in the1970s was taken by many as supportive of this view.
Most macroeconomists were willing to agree that in the Ôlong runÕ, aggre-gate output and employment are determined by the supplies of labour andcapital desiring to be employed at returns equal to their marginal factorproductivities. This left plenty of room for argument about how long it wouldtake to reach this Ôlong runÕ, and so how useful demand-management policieswould be in practice. Longer-run factors, in any event, should not be ignored,as these are phenomena that will create change over time, as long as thecurrent state of affairs does not block them. KeynesÕs (1971 [1923], p. 65)famous remark Ð ÔIn the long run we are all deadÕ (emphasis in original) Ðmight well still apply to an analysis which ignores everything but the long run,
153
Downloaded from Elgar Online by University of Melbourne at 07/12/2013 04:06:39AM

but it need not rule out the notion that there can be longer-run factors at workaffecting economic conditions in particular short-run periods.
I would argue that the emphasis on longer-run factors which arose as mone-tarism was intensified by the theory of Ôrational expectationsÕ, and as consid-erations of Ôsupply-sideÕ matters came more to the fore, has been exaggeratedto the point of nonsense. The problem that I wish to focus on here, though, isthat the emphasis on long-run factors in macroeconomics has been basedsolely on the perspective of neoclassical economic theory. I want to demon-strate that consideration of longer-run factors in the macroeconomics associ-ated with the work of Michaò Kalecki gives us a quite different longer-runanalysis of capitalist economies, and one in which aggregate output andemployment are not determined by the supplies of labour and capital desiringto be employed at return equal to their marginal factor productivities.
THE KALECKIAN SHORT RUN
In Kaleckian analysis, national output at any particular instant is determinedby the propensity to spend out of wages (on consumption) and out of profits(on consumption and Ð mainly Ð on investment), the distribution of incomebetween wages and profits, and the demand arising from government spend-ing and exports minus imports. Employment is related to output by the labourrequirements of producing this output, which reflect labour productivity.Given those requirements, we have a purely demand-side determination ofoutput and employment. Given the spending propensities of workers and capi-talists and the level of labour productivity, the level and distribution ofnational income determine one another recursively. In the simplest case of afully integrated economy with no government sector in which there is nosaving out of wages, spending out of profits determines profits, and theweighted average mark-up of prices above labour costs determines incomeshares and so, given profit income, total wage income. Labour productivitydetermines how many person-hours of employment is needed to produceprofit plus wage income. Money wages per worker times workers per unit ofoutput determines labour costs per unit. Unit labour costs times the percentagemark-up gives prices.
In a neoclassical macro-model, output and employment are determined ulti-mately by labour supply and productivity considerations, as the real wagesettles at the level where it equals both the marginal disutility and marginalproductivity of labour. For Keynes and Kalecki, this is rather an unlikelyoutcome, because changes in money wages in the short run would largely onlychange prices. Should falling money wages lead to falling real wages, thiswould reduce demand as much as costs. Only a Pigou effect, whereby falling
154 Kaleckian models of demand-led growth
Downloaded from Elgar Online by University of Melbourne at 07/12/2013 04:06:39AM

money wages leading to falling prices would increase consumption spendingout of monetary wealth, or a ÔKeynesÕ effect, whereby falling money wagesleading to falling prices would lower interest rates, could automatically elim-inate involuntary unemployment.
WHAT LONGER-RUN FACTORS ARE RELEVANT?
If we accept, along with Kalecki and Keynes, the implausibility of theseneoclassical mechanisms, we still must examine the impact of whateverlonger-run factors can plausibly affect the current short-run situation.Returning to the short-run Kaleckian equilibrium described above, whatshould we be considering in this regard? I suggest the first set of questionsshould be these: (1) what determines spending out of profits? (2) what deter-mines the mark-up? (3) what determines labour productivity?
On (1), it may be safe to regard consumption out of profits as a percentageof profits that is not likely to change much over time. Indeed, if the propor-tion of profits devoted to consumption is small, it may not be worth worryingabout anyway. Investment is the most significant type of spending that isrelated to profits in the Kaleckian framework. Investment spending is eitherfinanced from retained profits, borrowing, or new equity issuance, and theavailability of the latter two sources of finance are, themselves, stronglyaffected by the level of profits.3 For Kalecki, then, investment is largelydetermined by the level of profits relative to the amount of productive capac-ity already in place, as an indicator of the additional profitability of investmentin more capacity.
It is difficult to answer question (2) precisely, but we start simply with Ôthedegree of monopolyÕ, to use the term that Kalecki borrowed from AbbaLerner. Perhaps Ôthe degree of competitionÕ is a better expression, as itcaptures the idea that economy-wide intensification of competition, otherthings being equal, should lower the aggregate mark-up, while relaxation ofcompetition should be associated with a rise in the mark-up.4 Regarding (3),labour productivity is determined by a number of factors, including theamount and type of productive capacity in place, the degree of utilization ofthis capacity, and decisions about employment practices and methods by firmsand workers.
I suggest that the economic variables we should examine in a long-runexploration of the Kaleckian framework are, then, the amount and type ofproductive capacity, and the degree of competition. Short-run equilibrium, asdescribed above, is determined by spending out of profits and wages and thedistribution of national income. Short-run equilibria over time will be differ-ent, as amounts and types of capacity and conditions of competition change.
Longer-run aspects of Kaleckian macroeconomics 155
Downloaded from Elgar Online by University of Melbourne at 07/12/2013 04:06:39AM

In contrast, the Ôsupply-sideÕ determinants of economic performance in theneoclassical longer term are labour supply and capital supply, the latter givenby the level of saving. Real wage and interest rate adjustments, as describedearlier, should automatically correct any short-run deviations from the gover-nance of these variables. Monetary effects (as in monetarist and rationalexpectations models) or their absence (as in real business cycle and neoclassi-cal growth models) ensure that these adjustments work. Labour and capitalsupply and technological change determine labour and capital productivityand so the demand for each factor of production.
In the Kaleckian framework, of course, labour and capital supply can onlydetermine the level of output if the aggregate demand for output is greater thanwhat the fully employed labour force can produce with the fully utilized stockof existing productive capacity. The ruling technology and production meth-ods are relevant in both theories, then, though their determinants may be theo-rized rather differently.
JOSEF STEINDLÕS CONTRIBUTION
The most significant work examining long-run conditions in a Kaleckianframework is that of Josef Steindl.5 Steindl argued that firms tend to build upproductive capacity ahead of demand. Firms in any industry that have lowercosts than others, or that can have lower costs with higher sales, will want toutilize their extra capacity by lowering their prices or by spending their extraprofits on the sales effort, or some combination of the two. This will keepprices close to unit costs. As these lower-cost firms can price below the costsof their rivals, they will grow faster than the industry as a whole. As their scaleexpands, they likely experience even lower unit costs.
Eventually, the industry reaches a stage at which the only significantcompetitors left should have sufficiently similar cost structures to makefurther price competition disadvantageous. Prices cease to respond to costreductions, so profit margins expand. In this stage of industry Ð ÔmaturityÕ Ðexcess capacity, which is not eliminated by price cuts, emerges, and invest-ment spending on additional capacity slows down.
This depicts a long-run tendency for competition to turn into oligopoly andfor excess capacity to emerge. Short-run demand-determined equilibria shouldthus be affected by long-run tendencies towards a lower average level ofinvestment spending as a percentage of capacity, and towards a rise in theaverage mark-up and hence the profit share of income.6 This combination ofstagnation in investment spending and the rise in the profit share should retardthe growth of short-run aggregate demand and employment.
A reduction in the rate of growth of labour productivity should accompany
156 Kaleckian models of demand-led growth
Downloaded from Elgar Online by University of Melbourne at 07/12/2013 04:06:39AM

the stagnation in investment. This will keep labour requirements from fallingas much as they might otherwise do. Of course, in times of greater price andcost competition, though productivity should be rising more rapidly, the gainsfrom these productivity increases should be reflected in higher real wages,offsetting the negative effect on the wage share of lower labour requirements.
Steindl (1976 [1952]) attributed the emergence of the Great Depression inthe USA to the development of maturity in a majority of its significant indus-tries. He held that the stage had been set by the end of the nineteenth centuryfor the US economy to endure such stagnation,7 but that its advent had beendelayed by the rise in the availability of stock market finance, which keptinvestment spending high enough to postpone the day of reckoning. Of course,the working-out of theoretical tendencies in actuality must always occurthrough historical developments that involve offsetting or enhancing tenden-cies, as other things do not remain equal in history.
HISTORICAL DEVELOPMENTS IN RESPONSE TO STAGNATION
More fundamentally, counter-tendencies may be seen to arise in response tothe effects of the original forces at work. In the case of the macroeconomicstagnation, which emerged not only in the USA, but world-wide in the 1930s,World War II was to a great extent a response, but increased governmentalresponsibility for the macroeconomy (with or without war) was the moregeneral outcome. Along with this came a rise in the power of organized labour,which had the effect of offsetting some of the monopoly power of big busi-ness, thus restraining the rise in mark-ups and capturing, in enhanced realwages, some of the gains in labour productivity.
A second result of increased government spending and trade union powerwas an increased propensity for any threats to the real value of profits or wagesto trigger price inflationary responses and more borrowing to finance businessand household spending.8 As noted earlier, conservative economists took thesephenomena to conform to a neoclassical view of how the chronic use of fiscaland monetary policy to maintain high employment in an economy tendingnaturally to stabilize itself in the long run would lead to excessive creditcreation and inflation. The rise in international economic interpenetration asWestern Europe and Japan recovered from the war also made national pricelevels and exchange rates greater objects of concern than they had been forsome time.
The policy response to the ÔstagflationÕ of the 1970s, supported by conser-vative neoclassical economists, involved monetary growth restraint, followingFriedmanÕs gospel of a money growth rule. As regards fiscal policy, the
Longer-run aspects of Kaleckian macroeconomics 157
Downloaded from Elgar Online by University of Melbourne at 07/12/2013 04:06:39AM
presumption on the conservative side was that government deficits ÔcrowdoutÕ an equivalent amount of private spending. As the decade wore on,Ôsupply-sideÕ economics emerged, which advocated lowering marginal taxrates on labour and capital income on the basis that this would encourage morelabour effort and more saving and investment. The neoclassical growth modeldeveloped by Solow (1956), who on short-run policy matters eagerlysupported ÔKeynesianÕ activist fiscal and monetary measures, countered thedemand-determined results of Harrod (1939) and Domar (1946), suggestingthat long-run growth is governed by labour force growth and the saving rate.9
The Ôsupply-sidersÕ argued that stimulating the supplies of labour and savingswas the prescription for non-inflationary growth. In practice, adoption of theversions of monetary restraint and tax rate cutting applied in the USA eventu-ally lowered the inflation rate and allowed an economic recovery weightedtowards the wealthy by first squeezing demand and then reviving it throughmilitary spending and the luxury consumption of the wealthy. Median realwages were the chief victims of this policy mix.10
KALECKIAN SHORT-RUN AND LONG-RUN INTERACTIONS
The Kaleckian perspective would understand the historical developmentsdescribed above as follows. Stagnation in output and employment growthresulted from demand shortfalls. Inflationary tendencies arose from rising mark-ups pushing up prices, or rigid mark-ups causing increases in money wagesexceeding productivity growth to be passed along in the form of higher prices.
This Kaleckian conception is consistent with a version of what has beencalled ÔunderconsumptionÕ. The aggregate mark-up largely determines theprofit share in national income. The higher it is, the more investment, govern-ment spending and net exports are needed to achieve any given level of outputand employment. The lower is investment spending, the lower mark-ups willbe, so that the consumption spending of wage earners will offset low invest-ment spending.
The following version of a model constructed by Harris (1974) portrays theKaleckian short run as described above, and helps to show how longer-runfactors may affect short-run outcomes over time:11
pY = W + P [9.1]
W = wL [9.2]
L = bY [9.3]
158 Kaleckian models of demand-led growth
Downloaded from Elgar Online by University of Melbourne at 07/12/2013 04:06:39AM
pI + pA = sPP + pT [9.4]
p = fwb [9.5]
Equation [9.1] states that the price level, p, multiplied by real nationalincome, Y, equals the wage bill, W, plus money profits, P. Equation [9.2]describes the wage bill as the money wage, w, multiplied by the level ofemployment, L. L, in turn, is determined in equation [9.3] by b, the number ofworkers per unit of output, times Y. Equation [9.4] shows how the Kaleckianmacroeconomic equilibrium (injections equal leakages) is related to changesin the level and distribution of national income. The price level multiplied bythe level of real investment spending, I, plus p times autonomous spending(net exports plus real government spending), A, equal the propensity to saveout of profits, sP, multiplied by money profits, plus p multiplied by real taxes,T. We are assuming zero saving out of wages, which should not make a differ-ence to the results unless we were to assume that the propensity to save out ofwages is implausibly high relative to sP. Equation [9.5] describes the pricelevel in terms of the index of labour costs, wb, where labour is the only non-produced input, multiplied by the ratio of prices to costs, F > 1. This ratioequals one plus the percentage price-cost mark-up. Hereafter, we will call Fthe mark-up.
The endogenous variables are p, Y, W, P, and L. Some significant equilib-rium conditions are:
[9.6]
[9.7]
and:
[9.8]
Equation [9.6] describes how national income is determined byautonomous and induced spending. Equation [9.7] shows KaleckiÕs determi-nation of profits by spending out of profits plus the government deficit and netexports, or KeynesÕs ÔwidowÕs cruiseÕ theory of profits in his Treatise onMoney (1971 [1930]).12 Equation [9.8] shows the relation between the profitshare and the aggregate mark-up, in which the profit share is wholly deter-mined by the mark-up.
æ ¸/p ö* f Ð 1çÑÑ÷ = ÑÑÑè Y ø f
æ ¸ ö * I + A Ð Tç Ñ÷ = ÑÑÑÑè p ø s¸
YI A T
s* ( )
( )=
+ --
ffP 1
Longer-run aspects of Kaleckian macroeconomics 159
Downloaded from Elgar Online by University of Melbourne at 07/12/2013 04:06:39AM

It is straightforward to show that:
[9.9]
and:
[9.10]
Equation [9.9] is the Keynesian ÔmultiplierÕ, which is still the reciprocal ofthe propensity to save. Since saving only takes place out of profits, the mark-up, which determines the distribution of income and profits, has to beincluded.
Note that rearranging equation [9.5], we get wyp = 1yfb. This demonstratesthe relationship between the real wage and the mark-up, given labour produc-tivity, and between the real wage and productivity, given the mark-up.Equation [9.10] shows that increasing the aggregate mark-up, other thingsbeing equal, decreases national income because part of profit income is saved,while all of wage income is spent.
These relationships show how underconsumption, defined here as thecondition that a drop in investment spending is not offset by a rise in consump-tion spending, is the cause of cyclical and longer-run stagnation. That is, if theaggregate mark-up, F, remains rigid, a decrease in investment will decreaseaggregate demand. All wages are spent on consumption, while only part ofprofits is spend on consumption, and sufficient investment plus governmentspending plus net exports is necessary to ensure that the part of profits savedis either channelled into or offset by such spending.13 If the aggregate mark-up (and so the profit share) were to change sufficiently with changes in invest-ment spending, aggregate demand would not change, as changes in investmentand consumption would offset one another.14
Again, none of this would change were we to allow for some saving out ofwage income, provided that the propensity to save out of wages were less thanthe propensity to save out of profits. It is also worth noting here that changesin the mark-up (that is, redistribution of income between wages and profits) asaggregate demand falls below or rises above its full employment level is themethod of stabilization used to offset the knife-edge that would otherwiseprevail in KaldorÕs (1956) Ôneo-KeynesianÕ macroeconomic income distribu-tion model.
Suppose we endogenize investment by making IyZ, where Z is capacitydefined in terms of how much output it can produce Ð that is, full-capacityoutput Ð a function of (Pyp)yZ and YyZ,15 on the grounds presented above that
¶¶
=- +
-<
Y s I A T
s
* ( ± )
[ ( )]f fP
P 102
¶¶ +
=-
>Y
I A T s
*
( ± ) ( )
ffP 1
0
160 Kaleckian models of demand-led growth
Downloaded from Elgar Online by University of Melbourne at 07/12/2013 04:06:39AM

the profitability of investment should largely be a matter of the level of exist-ing capacity utilization (YyZ), and that profits furnish the preferred source offinance for investment. In the short-run, with rigid mark-ups, we should havecycles due to interactions among I, Pyp, Y, and Z. In this KaleckiÐSteindlworld, instead of the extremes of the knife-edge, we have short-run cycles inwhich increases in investment raise profits and output demand, spurring moreinvestment, while increases in investment also increase capacity, which even-tually starts to retard the profitability of investment. Decreases in investmentthen decrease profits and output demand, decreasing the desirability of invest-ment even more, until the wearing-out of existing capacity, or some exogenousspur to aggregate demand or to the profitability of investment, turns invest-ment spending upwards again.
In the long run, in the sense now of long-run average magnitudes, IyZshould be proportional to YyZ and (Pyp)yZ, if the long-run sensitivities of IyZto YyZ and (Pyp)yZ do not change and as F is constant, which, as we know,makes (Pyp)yY constant and so YyZ and (Pyp)yZ proportional to one another.Will there be any systematic changes in the long-run average position of thesevariables over time? This will depend on what is going on in cyclical slumpsand recoveries and in the processes of longer-run technical change that wouldaffect I, Y and Z and hence their long-run values, and on what happens to thedegree of competition over time. How long slumps persist and what factors areresponsible for recoveries will affect the long-run trend, as they foster more orless drastic alterations of the economic environment.
The only ways in which Ôsupply creates its own demandÕ are due to forcescoming from innovative activity or encouraging policy actions. For example,new products or new processes indicating potential profitability, or high actualor potential unemployment resulting in government action, might be said todescribe supply-driven phenomena. Innovative activity or government policyactions of this sort, however, obviously work by creating demand for thesupply of new products being created, or for the supply of idle workers seek-ing employment.
THE LONGER-RUN RESULTS OF ANTI-RECESSIONARYDEMAND MANAGEMENT POLICY
Policy action which limits slumps and hastens recoveries tends to reduce theimmediate problem of excess capacity. It may, however, aggravate price-infla-tionary tendencies over time, and increase the ratio of private debt to income.The reasons for this have to do with the fact that demand-stimulating activitytends to reduce the pressures to lower costs over time and increase competi-tiveness, or to reduce debt leverage to avoid bankruptcy.
Longer-run aspects of Kaleckian macroeconomics 161
Downloaded from Elgar Online by University of Melbourne at 07/12/2013 04:06:39AM

These problems were emphasized by Minsky (1985, 1986), and can beshown using the model presented above. Recall equation [9.5], p = fwb.Increases in productivity (1yb) with F constant allow prices to fall as moneywages stay constant, or more likely, money wages to rise as prices stayconstant. Following SteindlÕs argument, when there are strong incentives forprice competition due to the emergence of large cost differentials betweenfirms because of technological improvements or scale economies, productiv-ity gains and pressure to keep mark-ups low will be high. When cost differen-tials are not large, price competition offers little reward, as rivals will normallyfollow any firmÕs price-cuts, making no one much better off. Price increaseswill only be advantageous if all firms in the industry follow suit, but this ismuch more likely to occur with a rise in costs which is experienced by all thefirms in the industry, such as industry-wide trade union wage demands. If theunion only asks for gains equal to productivity increases, these can be grantedand mark-ups preserved, leaving prices unchanged. If the union asks for wageincreases that exceed productivity gains, however, firms are more likely togrant these increases and to preserve mark-ups by raising prices if demand fortheir products is high. If there is a Ôsupply shockÕ, like the oil price increasesof the 1970s, prices and money wages should chase each other up in attemptsto maintain or increase real incomes.16
The tendency for the debt-income ratio to rise occurs as follows. Suppose thedesired capacity to output ratio (ZyY) to be unchanging within business cycles.Then the amount of capacity desired will depend upon the expected level ofdemand. Assuming F to be unchanging as well, we know that (Pyp)yZ will beconstant. If the rate of growth of output, YùyY, is greater than the rate of growthcapacity, ZùyZ, as it normally is during the first half of a cyclical upswing, theconsequent rise in YyZ will eventually spur an increase in ZùyZ = IyZ. For a time,then, firms will want ZùyZ to be greater than YùyY. This means they must order anincreased ratio of investment goods to the level of national income. In otherwords, desired IyY will increase in an attempt to maintain the desired capacityoutput ratio. Since (Pyp)yY will remain the same, the need for investmentfinance will grow faster than the availability of profits to provide such financeis growing. Thus recourse must be made to borrowing.17
To be sure, in the first half of the cyclical upswing and the last half of thedownswing, ZùyZ will be less than YùyY, so investment financing needs will tendto fall in relation to the flow of profits, and debt can be retired. From equation[9.7], we know that in equilibrium profits will equal I + A Ð TysP.18 If roughlyhalf of profits are distributed as dividends to shareholders, the governmentbudget and foreign trade are in balance, and sP is greater than 0.5, investmentspending will exceed the retained profits available for finance in equilibrium.So, if all external finance takes the form of debt, the long-run debt to incomeratio will be (sP Ð r)(Pyp)yY, where r is the rate of retention of profits.19
162 Kaleckian models of demand-led growth
Downloaded from Elgar Online by University of Melbourne at 07/12/2013 04:06:39AM
If, however, cyclical downswings are kept shorter than upswings by meansof counter-cyclical policy actions, the debt-income ratio should be higher thanthis, and rising over time. The increase in debt in cyclical upswings comesfrom the fact that desired investment rises. Higher actual investment will onlybe undertaken as finance can be obtained beforehand, but higher profits willonly be received as the actual investment spending occurs. As counter-cycli-cal policies involve government deficits, profits will be greater than otherwise,except as government deficits contribute to increases in trade deficits, whichwill decrease profits. MinskyÕs proposition that the use of counter-cyclicalpolicy to shorten slumps will raise the debt-income ratio over time is thus quiteplausible.20
As the increased use of counter-cyclical policy leads to an upward drift incosts and prices in any one country, it will face a loss in competitivenessrelative to foreign producers with lower costs and prices due to newer tech-nology or lower wages. Along with this, the price inflation and currencydepreciation, which can aggravate each other without helping to cure theproblem of uncompetitiveness, give rise to support for austerity measures inpolicy. In this way, we see political forces at work, as predicted by Kalecki(1990 [1943]), both within cycles and over longer periods of time. TheÔmonetaristÕ and Ôsupply-sideÕ policies discussed above can thus be under-stood as having been designed to produce cost restraint by means of wagerestraint.
The problem is that wage restraint can only be beneficial to the extent thatit reduces wages relative to those paid elsewhere. Moreover, pressure onwages can only be accomplished by a period of high unemployment and lowerprofits. These are both inimical to productivity, the other major element deter-mining costs and hence prices.21
As the debt-income ratio rises over time with policy limiting the durationof slumps, attempts to use policy to limit inflation run the danger of instigat-ing more serious slumps. Anything which impairs the ability of debtors tomeet their obligations will amplify decreases in effective demand. Concernsover the impairment of capital, of course, mean that higher debt ratios limitinvestment spending,22 putting a heavier burden on policy in the first place. AÔMinsky knife-edgeÕ situation may come into being.23
THE ROLE OF INNOVATIONS
Steindl (1990[1979] and 1990 [1981]) acknowledges that one of the assump-tions in Steindl (1976 [1952]) Ð that firms invest only in their own industriesÐ is unnecessarily restrictive, and that new product development is a possibleantidote to the stagnation brought about by the emergence of maturity in an
Longer-run aspects of Kaleckian macroeconomics 163
Downloaded from Elgar Online by University of Melbourne at 07/12/2013 04:06:39AM

economyÕs major industries.24 This does not overcome the tendencies towardsincreases in the mark-up and stagnation, but rather allows for periods of morevigorous competition to interrupt these trends from time to time. DesirableÔsupply-sideÕ policies would perhaps be those which stimulate new productdevelopment or other innovative research.
We also need to remember that changes in labour required per unit ofoutput are a matter of production technique as well as of economies of scale.Changes in the methods of production as they raise output per worker arecapable of affecting economic performance by raising the standard of livingfor those receiving income, but as income is tied to employment, they canlower incomes by decreasing employment. Minsky though this last consider-ation could make it desirable to decrease the Ôcapital intensityÕ of production.Thinking about this should remind us to note again how matters such asemployment, prices, incomes and productivity are interrelated in this frame-work.
CONCLUSION
The Kaleckian long run would like to be the Kaldorian long run, which avoidsthe HarrodÐDomar knife-edge through mark-up variation. Kalecki thoughtthis would only be possible in a socialist economy.25 The capitalist economyis doomed to cyclical movements around a level of activity below full employ-ment if counter-cyclical policy is not used, and to cyclical movements due topolicy actions if it is used, approaching full employment only during wartime.SteindlÕs analysis depicts the long run as being characterized by a tendency forcompetition to pass into oligopoly, bringing the stagnation with cycles thatKalecki had proposed. Two key longer-run factors Ð the aggregate mark-up (orÔdegree of monopolyÕ) and the amount and type of productive capacity Ð affectshort-run conditions over time by affecting the distribution of income betweenwages and profits, the amount of spending out of profits, the level of outputper worker, and the desirability and efficacy of policy actions, and thus thelevels of national income, employment, prices and the standard of living, bothoverall and for particular social classes.
NOTES
1. I would like to acknowledge Robert Blecker for helpful comments on an earlier draft, whileabsolving him of responsibility for any remaining mistakes.
2. Friedman (1968) offers a lucid statement of this view.3. This follows from KaleckiÕs Ôprinciple of increasing riskÕ. See Kalecki (1990 [1937], and
1991 [1954c]).
164 Kaleckian models of demand-led growth
Downloaded from Elgar Online by University of Melbourne at 07/12/2013 04:06:39AM
4. Kalecki (1991 [1954a], pp. 215Ð6) specified the major influences on the degree of monop-oly to be: (1) the degree of industry concentration, which enhances pricing power and allowsimplicit collusion among firms; (2) the level of sales promotion, which creates productdifferentiation; (3) the level of overheads, which must be covered over time, relative toprime costs; and (4) the strength of trade unions, which can perhaps push up money wageshigher than firms are willing to raise prices. Josef SteindlÕs (1976 [1952]) formulation of thedevelopment of industry competition over time, as we shall see below, provides a dynamicaccount of the development of such oligopolistic competition.
5. His major work on this is Steindl (1976 [1952]). KaleckiÕs own work on questions of long-run growth in a capitalist economy, the chief examples of which are Kalecki (1991 [1954d],1991 [1962], and 1991 [1968]), arrives at conclusions that are similar to much of what isargued in this study. I have chosen also to examine some issues that are not discussed as fullyby Kalecki as they are here.
6. SteindlÕs (1976 [1952], pp. 69Ð106) study of profit margins in US manufacturing industriesfrom 1899 to 1939 found no tendency for the share of wages in value added to change in theindustries he identified as competitive, but in those that were highly concentrated, he founda persistent tendency for the share of wages in value added to decline over the length of thisperiod.
7. Kalecki (1991 [1954a], p. 219) demonstrated a rise in the ratio of proceeds to prime costs(the aggregate mark-up) in US manufacturing between 1879 and 1889.
8. See the data for the US consumer price index in Table 9.A1 in Appendix 9.A.9. In SolowÕs model, of course, the rate of growth converges to the rate of labour force growth,
no matter what the propensity to save. Changes in the desire to save will only change theequilibrium capitalÐlabour ratio. Only in the recent neoclassical endogenous growth litera-ture do changes in saving actually affect the rate of growth. See, for example, Romer (1986)or Mankiw et al. (1992).
10. See the data on US interest rates and real wages in Table 9.A1 in Appendix 9.A.11. See also Asimakopulos (1975) and Harcourt (1972, pp. 210Ð14) for similar models.12. See also Levy (1943) and Boulding (1950).13. Ensuring that the ÔsurplusÕ is ÔabsorbedÕ is the way that Baran and Sweezy (1966) put it.14. Letting L = I + A Ð T in [9.6] and totally differentiating, we see that
dY = sP[f(f Ð 1)dL Ð Ldf]y[sP(f Ð 1)]2. Thus dY = 0 if f(f Ð 1)dL = Ldf.15. Note that Z ù = I, since investment is defined to be a quantity of the same commodity as
output.16. See the data on mark-ups, money wages, productivity and real wages in the USA in Table
9.A1 at the end of this chapter.17. This is a modification of an argument presented by Duesenberry (1958, pp. 111Ð2). See also
Mott (1985Ð6).18. With overhead labour, of course, the ratio of actual investment to income and the profit share
can vary both absolutely and relatively to each other, and indeed both will be pro-cyclical.The argument that investment finance needed will rise relative to profits will still hold,however. See Mott (1985Ð6).
19. If we modify our model to take into account the influence of profits and output relative tocapacity on investment, the long-run debt to income ratio should be something like(((a(f Ð 1) + bf)y(f Ð 1)) Ð r) ((Pyp)yY), where a and b are the sensitivity of investment toprofits and output, respectively. See Mott et al. (1997).
20. See the data on corporate and household debt-income ratios in the USA in Table 9.A1 at theend of this chapter.
21. See the data on wages, profits, productivity and unemployment in the USA in Table 9.A1 atthe end of this chapter.
22. This follows again from the principle of increasing risk.23. See the data on US investment spending in Table 9.A1 at the end of this chapter.24. See also Shapiro (1988). Kalecki (1991 [1954d], pp. 334Ð5; 1991 [1962]) held that a capi-
talist economy would lapse into zero growth in the absence of innovations.25. See Kalecki (1991 [1954b], pp. 254Ð5).
Longer-run aspects of Kaleckian macroeconomics 165
Downloaded from Elgar Online by University of Melbourne at 07/12/2013 04:06:39AM

APPENDIX 9.A
Table 9.A1 Selected US macroeconomic data, 1948Ð99
Year Money Productivity Prices Real Mark-up Unemploymentwages wages rate
1948 1.23 2.7 24.1 5.10 1.58 4.01949 1.28 3.4 23.8 5.38 1.59 6.61950 1.34 6.9 24.1 5.56 1.63 4.31951 1.45 2.5 26.0 5.58 1.60 3.11952 1.52 2.1 26.5 5.74 1.56 2.71953 1.61 2.3 26.7 6.03 1.53 4.51954 1.65 2.0 26.9 6.13 1.54 5.01955 1.71 4.2 26.8 6.38 1.58 4.21956 1.80 Ð0.8 27.2 6.62 1.55 4.21957 1.89 2.5 28.1 6.73 1.54 5.21958 1.95 2.3 28.9 6.75 1.53 6.21959 2.02 4.0 29.1 6.94 1.56 5.31960 2.09 1.3 29.6 7.06 1.53 6.61961 2.14 3.4 29.9 7.16 1.54 6.01962 2.22 4.5 30.2 7.35 1.56 5.51963 2.28 3.5 30.6 7.45 1.57 5.51964 2.36 4.2 31.0 7.61 1.58 5.01965 2.46 3.1 31.5 7.81 1.60 4.01966 2.56 3.5 32.4 7.90 1.57 3.81967 2.68 1.7 33.4 8.02 1.56 3.81968 2.85 3.1 34.8 8.19 1.55 3.41969 3.04 0.1 36.7 8.28 1.52 3.51970 3.23 1.5 38.8 8.32 1.49 6.11971 3.45 4.2 40.5 8.52 1.51 6.01972 3.70 3.4 41.8 8.85 1.51 5.21973 3.94 3.1 44.4 8.87 1.50 4.91974 4.24 Ð1.6 49.3 8.60 1.47 7.21975 4.53 2.7 53.8 8.42 1.52 8.21976 4.86 3.7 56.9 8.54 1.52 7.81977 5.25 1.5 60.6 8.66 1.53 6.41978 5.69 1.3 65.2 8.73 1.51 6.01979 6.16 Ð0.4 72.6 8.48 1.48 6.01980 6.66 Ð0.3 82.4 8.08 1.47 7.21981 7.25 1.2 90.9 7.98 1.51 8.51982 7.68 Ð0.6 96.5 7.96 1.51 10.8
166 Kaleckian models of demand-led growth
Downloaded from Elgar Online by University of Melbourne at 07/12/2013 04:06:39AM

Year Money Productivity Prices Real Mark-up Unemploymentwages wages rate
1983 8.02 4.5 99.6 8.05 1.53 8.31984 8.32 2.2 103.9 8.01 1.54 7.31985 8.57 1.3 107.6 7.96 1.53 7.01986 8.76 3.0 109.6 7.99 1.51 6.61987 8.98 0.4 113.6 7.90 1.51 5.71988 9.28 1.3 118.3 7.84 1.53 5.31989 9.66 0.8 124.0 7.79 1.52 5.41990 10.01 1.1 130.7 7.66 1.51 6.31991 10.32 1.2 136.2 7.58 1.51 7.31992 10.57 3.7 140.3 7.53 1.50 7.41993 10.83 0.5 144.5 7.49 1.51 6.51994 11.12 1.3 148.2 7.50 1.54 5.51995 11.43 0.9 152.4 7.50 1.54 5.61996 11.82 2.5 156.9 7.53 1.56 5.41997 12.28 1.8 160.5 7.65 1.56 4.71998 12.78 2.6 163.0 7.84 1.55 4.41999 13.24 2.9 166.6 7.95 1.55 4.1
Longer-run aspects of Kaleckian macroeconomics 167
Downloaded from Elgar Online by University of Melbourne at 07/12/2013 04:06:39AM

Table 9.A1 Selected US macroeconomic data, 1948Ð99 (continued)
Year Profits Real Investment Real Profits Investment
1948 30.8 127.8 26.8 111.21949 28.6 120.2 24.9 104.61950 35.4 146.9 27.8 115.41951 40.4 155.4 31.8 122.31952 38.4 144.9 31.9 120.41953 38.7 144.9 35.1 131.51954 37.9 140.9 34.7 129.01955 48.5 181.0 39.0 145.51956 47.4 174.3 44.5 163.61957 47.0 167.3 47.5 169.01958 42.4 146.7 42.5 147.11959 53.7 184.5 46.5 159.81960 52.3 176.7 49.4 166.91961 53.4 178.6 48.8 163.21962 61.6 204.0 53.1 175.81963 67.7 221.2 56.0 183.01964 74.9 241.6 63.0 203.21965 86.0 273.0 74.8 237.51966 92.0 284.0 85.4 263.61967 89.7 268.6 86.4 258.71968 96.6 277.6 93.4 268.41969 93.7 255.3 104.7 285.31970 81.6 210.3 109.0 280.91971 95.2 235.1 114.1 281.71972 109.8 262.7 128.8 308.11973 123.9 279.1 153.3 345.31974 114.5 232.3 169.5 343.81975 133.0 247.2 173.7 322.91976 160.6 282.2 192.4 338.11977 190.9 315.0 228.7 377.41978 217.3 333.3 278.6 427.31979 222.5 306.5 331.6 456.71980 198.5 240.9 360.9 438.01981 219.0 240.9 418.4 460.31982 201.3 208.6 425.3 440.71983 254.1 255.1 417.4 419.11984 309.8 298.2 490.3 471.91985 322.5 299.7 527.6 490.31986 300.7 274.4 522.5 476.71987 346.6 305.1 526.7 463.61988 405.0 342.3 568.4 480.51989 395.7 319.1 613.4 494.71990 408.6 312.6 630.3 482.21991 431.2 316.6 608.9 447.11992 453.0 322.9 626.1 446.31993 510.5 353.3 682.2 472.11994 573.1 386.7 748.6 505.11995 668.8 438.8 825.1 541.41996 754.0 480.6 899.4 573.21997 833.8 519.5 999.4 622.71998 815.1 500.1 1107.5 679.41999 856.0 513.8 1203.1 722.1
168 Kaleckian models of demand-led growth
Downloaded from Elgar Online by University of Melbourne at 07/12/2013 04:06:39AM
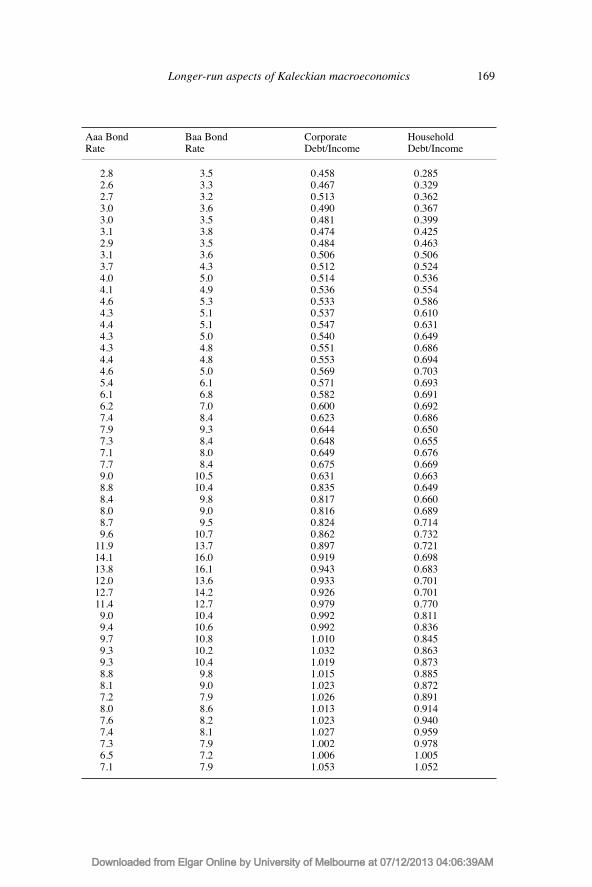
Aaa Bond Baa Bond Corporate HouseholdRate Rate Debt/Income Debt/Income
2.8 3.5 0.458 0.2852.6 3.3 0.467 0.3292.7 3.2 0.513 0.3623.0 3.6 0.490 0.3673.0 3.5 0.481 0.3993.1 3.8 0.474 0.4252.9 3.5 0.484 0.4633.1 3.6 0.506 0.5063.7 4.3 0.512 0.5244.0 5.0 0.514 0.5364.1 4.9 0.536 0.5544.6 5.3 0.533 0.5864.3 5.1 0.537 0.6104.4 5.1 0.547 0.6314.3 5.0 0.540 0.6494.3 4.8 0.551 0.6864.4 4.8 0.553 0.6944.6 5.0 0.569 0.7035.4 6.1 0.571 0.6936.1 6.8 0.582 0.6916.2 7.0 0.600 0.6927.4 8.4 0.623 0.6867.9 9.3 0.644 0.6507.3 8.4 0.648 0.6557.1 8.0 0.649 0.6767.7 8.4 0.675 0.6699.0 10.5 0.631 0.6638.8 10.4 0.835 0.6498.4 9.8 0.817 0.6608.0 9.0 0.816 0.6898.7 9.5 0.824 0.7149.6 10.7 0.862 0.732
11.9 13.7 0.897 0.72114.1 16.0 0.919 0.69813.8 16.1 0.943 0.68312.0 13.6 0.933 0.70112.7 14.2 0.926 0.70111.4 12.7 0.979 0.7709.0 10.4 0.992 0.8119.4 10.6 0.992 0.8369.7 10.8 1.010 0.8459.3 10.2 1.032 0.8639.3 10.4 1.019 0.8738.8 9.8 1.015 0.8858.1 9.0 1.023 0.8727.2 7.9 1.026 0.8918.0 8.6 1.013 0.9147.6 8.2 1.023 0.9407.4 8.1 1.027 0.9597.3 7.9 1.002 0.9786.5 7.2 1.006 1.0057.1 7.9 1.053 1.052
Longer-run aspects of Kaleckian macroeconomics 169
Downloaded from Elgar Online by University of Melbourne at 07/12/2013 04:06:39AM
APPENDIX 9.B
Data Definitions and Sources
Money wages average hourly earnings of production works, US Bureau of LabourStatistics.
Productivity annual percentage change in output per hour, US Bureau of LabourStatistics.
Prices Consumer price index, all urban consumers, US Bureau of Labour Statistics.Real wages computed by dividing the money wages series by the price series.Mark-up price per unit labour cost, Bureau of Economic Analysis, US Commerce
Department.Unemployment rate unemployment rate for civilian labour force in December of
each year, US Bureau of Labour Statistics.Profits corporate profits with inventory valuation and capital consumption adjust-
ments, Board of Governors of the Federal Reserve System.Real profits computed by dividing the profits series by the price series.Investment private non-residential fixed investment, Bureau of Economic Analysis,
US Commerce Department.Real investment computed by dividing the investment series by the price series.Aaa bond rate Average yield to maturity on selected long-term bonds rated Aaa by
MoodyÕs Investor Service, Board of Governors of the Federal Reserve System.Baa bond rate average yield to maturity on selected long-term bonds rated Baa by
MoodyÕs Investor Service, Board of Governors of the Federal Reserve System.Corporate debt/income computed by dividing total liabilities of non-farm non-
financial corporate business by national bond, Board of Governors of the FederalReserve System.
Household debt/income computed by dividing liabilities of household and non-profit organizations by disposable personal income, Board of Governors of theFederal Reserve System.
REFERENCES
Asimakopulos, A. (1975) ÔA Kaleckian theory of income distribution,Õ CanadianJournal of Economics, 8, 313Ð33.
Baran, P. and P. Sweezy (1966) Monopoly Capital, New York, Monthly Review Press.Boulding, K. (1950) A Reconstruction of Economics, New York, John Wiley & Sons.Domar, E. (1946) ÔCapital expansion, rate of growth, and employment,Õ Econometrica,
14, 137Ð47.Duesenberry, J. (1958) Business Cycles and Economic Growth, New York, McGraw-Hill.Friedman, M. (1968) ÔThe role of monetary policy,Õ American Economic Review, 58,
1Ð17.Harcourt, G.C. (1972) Some Cambridge Controversies in the Theory of Capital,
Cambridge, Cambridge University Press.Harris, D. (1974) ÔThe price policy of firms, the level of employment, and the distrib-
ution of income in the short run,Õ Australian Economic Papers, 13, 144Ð51.Harrod, R.F. (1939) ÔAn essay in dynamic theory,Õ Economic Journal, 49, 14Ð33.
170 Kaleckian models of demand-led growth
Downloaded from Elgar Online by University of Melbourne at 07/12/2013 04:06:39AM
Kaldor, N. (1956) ÔAlternative theories of distribution,Õ Review of Economic Studies,23, 83Ð100.
Kalecki, M. (1990 [1937]) ÔThe principle of increasing risk,Õ in J. Osiatyn«ski (ed.)Collected Works of Michaò Kalecki, vol. I, Oxford, Clarendon Press, 285Ð93.
Kalecki, M. (1990 [1943]) ÔPolitical aspects of full employment,Õ in J. Osiatyn«ski (ed.)Collected Works of Michaò Kalecki, vol. I, Oxford, Clarendon Press, 347Ð56.
Kalecki, M. (1991 [9154a]) ÔCosts and prices,Õ in J. Osiatyn«ski (ed.) Collected Worksof Michaò Kalecki, vol. II, Oxford, Clarendon Press, 209Ð25.
Kalecki, M. (1991 [1954b]) ÔDetermination of national income and consumption,Õ in J.Osiatyn«ski (ed.) Collected Works of Michaò Kalecki, vol. II, Oxford, ClarendonPress, 251Ð61.
Kalecki, M. (1991 [1954c]) ÔEntrepreneurial capital and investment,Õ in J. Osiatyn«ski(ed.) Collected Works of Michaò Kalecki, vol. II, Oxford, Clarendon Press, 277Ð81.
Kalecki, M. (1991 [1954d]) ÔLong-run economic development,Õ in J. Osiatyn«ski (ed.)Collected Works of Michaò Kalecki, vol. II, Oxford, Clarendon Press, 322Ð37.
Kalecki, M. (1991 [1962]) ÔObservations on the theory of growth,Õ in J. Osiatyn«ski(ed.) Collected Works of Michaò Kalecki, vol. II, Oxford, Clarendon Press, 411Ð34.
Kalecki, M. (1991 [1968]) ÔTrend and the business cycle,Õ in J. Osiatyn«ski (ed.)Collected Works of Michaò Kalecki, vol. II, Oxford, Clarendon Press, 435Ð50.
Keynes, J.M. (1971 [1923]) A Tract on Monetary Reform, London, Macmillan.Keynes, J.M. (1971 [1930]) A Treatise on Money, London, Macmillan.Keynes, J.M. (1964 [1936]) The General Theory of Employment, Interest and Money,
New York, Harcourt Brace.Levy, J. (1943) Economics Is an Exact Science, New York, New Economic Library.Mankiw, G., D. Romer and D. Weil (1992) ÔA contribution to the empirics of economic
growth,Õ Quarterly Journal of Economics, 107, 407Ð37.Minsky, H. (1985) ÔThe financial instability hypothesis: a restatement,Õ in P. Arestis and
T. Skouras (eds) Post Keynesian Economic Theory, Brighton, Wheatsheaf Books,24Ð55.
Minsky, Hyman (1986) Stabilizing an Unstable Economy, New Haven, Yale UniversityPress.
Mott, T. (1985Ð6) ÔKaleckiÕs principle of increasing risk and the relation among mark-up pricing, investment fluctuations, and liquidity preference,Õ Economic Forum, 15,65Ð76.
Mott, T., E. Slattery and G. Caudle (1997) ÔThe cycle, growth, and distributionaldynamics of a KaleckiÐMinsky macroeconomic model,Õ mimeo, University ofDenver.
Pigou, A.C. (1943) ÔThe Classical stationary state,Õ Economic Journal, 53, 343Ð51.Romer, P. (1986) ÔIncreasing returns and long run growth,Õ Journal of Political
Economy, 94, 1002Ð37.Shapiro, N. (1988) ÔMarket structure and economic growth: SteindlÕs contribution,Õ in
Social Concept, 4, 72Ð83.Solow, R. (1956) ÔA contribution to the theory of economic growth,Õ Quarterly Journal
of Economics, 70, 65Ð94.Steindl, J. (1976 [1952]) Maturity and Stagnation in American Capitalism, New York,
Monthly Review Press.Steindl, J. (1990 [1979]) ÔStagnation theory and stagnation policy,Õ in Economic Papers
1914Ð88, New York, St. MartinÕs Press, 107Ð26.Steindl, J. (1990 [1981]) ÔIdeas and concepts of long run growth,Õ in Economic Papers
1941Ð88, New York, St. MartinÕs Press, 127Ð38.
Longer-run aspects of Kaleckian macroeconomics 171
Downloaded from Elgar Online by University of Melbourne at 07/12/2013 04:06:39AM

10. The Kaleckian growth model withtarget return pricing and conflictinflation
Marc Lavoie1
INTRODUCTION
The Kaleckian model of growth is a demand-led model of growth. The ratesof accumulation and the rates of profit and capacity utilization are determinedby effective demand. In all variants, as in the old post-Keynesian models ofgrowth � la Robinson and Kaldor, an increase in the propensity to save leadsto a reduction in all of the above mentioned variables Ð the so-called paradoxof thrift. Also, as first argued by Rowthorn (1981), increases in real wages maylead to accelerating accumulation. These features have been obtained at somecost, however: in these models, in contrast to what most economists wouldexpect, neither the equilibrium rate of capacity utilization nor the equilibriumrate of profit are equal to their normal values.
Several authors, be they Sraffians or Marxists, have claimed that long-runmodels in which the rate of utilization is not equal to its normal value lacklogical consistency. For these authors, only fully adjusted positions are logi-cally consistent in a long-run analysis. In other words, in one-sector models,only equilibria where the realized and normal rates of profit are equal, andwhere the realized and normal rates of capacity utilization are equal, areadmissible. Only these equilibria are final, because otherwise there wouldexist economic forces that would change the long-run equilibrium configura-tion. One response to this critique has been to redefine the long run. HenceChick and Caserta (1997) label as medium-run models or provisional equilib-ria those models that achieve an equilibrium rate of growth without the actualand the normal utilization rates being equal. The other response has been tostudy the mechanisms that could lead these utilization rates to become equal,and to analyse the consequences of these mechanisms for the theory of effec-tive demand. This is the approach taken here, where a specific mechanism,based on a conflict theory of inflation, will be shown to yield a determinatesolution to our problem.
172
Downloaded from Elgar Online by University of Melbourne at 07/12/2013 04:09:04AM

The chapter proceeds as follows. In the next section we present the essen-tials of a Kaleckian model of growth with target return pricing. In the thirdsection, a simple mechanism is proposed to bring the economy back to a fullyadjusted position. In the fourth section, we introduce a conflict-based theoryof inflation. In the fifth section, it is shown that an adjustment process thattakes into account the bargaining power of workers does not bring back theeconomy to a fully adjusted position. Although target rates of return and real-ized rates of return are equated, actual rates of capacity utilization do notconverge towards normal rates. The final section offers some conclusions.
THE BASIC MODEL
The Profits Cost Equation
There are two crucial equations in the Kaleckian model of growth and distri-bution: one identifies the rate of profit from the supply side, the other from thedemand side. We start with the supply side. From the national accounts, itfollows that the value of net aggregate output is equal to the sum of wage costsand the profits on capital:
pq = wL + rpK
where p is the price level, q is the level of real output, w is the nominal wagerate, L is the level of labour employment, r is the rate of profit and K is thestock of capital in real terms. Thus,
p = w (Lyq) + rpKyq [10.1]
We then make the following definitions:
l = Lyq
u = qyqfc
v = Kyqfc
The first equation defines labour per unit of output, assuming away (as isconventional) overhead labour. The second equation defines the rate of capac-ity utilization, with qfc representing full capacity output. The third equationdefines the capital to capacity ratio, which is assumed to depend on technol-ogy. Using these definitions, equation [10.1] can be rewritten as:
p = wl + rpvyu [10.2]
The Kaleckian growth model 173
Downloaded from Elgar Online by University of Melbourne at 07/12/2013 04:09:04AM

Equation [10.2] gives the price of a unit of output in terms of the labourcosts per unit of output and the profits per unit of output. From this equation,we obtain the rate of profit in terms of the real wage rate:
r = (uyv)[1 Ð (wyp)l] [10.3]
The realized rate of profit thus depends on the exogenous real wage rateand the degree of capacity utilization.
At this stage, we need to introduce a pricing equation. Kaleckians havetraditionally favoured mark-up pricing, such that:
p = (1 + q)wl
where q is the size of the mark-up. It is not necessary to accept this cost-pluspricing procedure, however. Indeed, it has been argued by Lee (1994) thatpricing procedures are to a large extent dependent on accounting practices, andthat the latter have long been sophisticated enough to support normal cost pric-ing procedures, sometimes called full-cost pricing. Such pricing is based onunit costs, or more specifically standard unit costs, rather than unit direct costsonly. A particular specification of normal cost pricing is target return pricing,a practice that seems to have been prevalent for some time, both among largeand smaller firms (Lanzillotti, 1958; Shipley, 1981). Prices are set accordingto the normal unit costs of the price leader, assessed at some standard volumeof production, on the basis of a target rate of return. There is no presumptionthat this target rate of return will be the realized rate of profit: the former willbe achieved only if actual sales are equivalent to the standard volume ofoutput.
There exists an explicit pricing formula for target return procedures that isalmost as simple as the mark-up equation. What, then, would the mark-upproxy q be equal to? Suppose that the replacement value of the stock of capi-tal is pK, while the target rate of return, which we might want to call thenormal or the standard rate of profit, is rs. Required profits for the period arethen rs pK. With a normal (or standard) rate of capacity utilization, us, corre-sponding within the period to the level of output of qs, the required profits forthe period must be equal to rsvpqsyus. This must be equated to the total prof-its that are to be obtained by marking up unit costs at the standard rate ofutilization of capacity: qwl. After some manipulation, a simple pricing formulafor target pricing procedures can be found:2
[10.4]æ us
öp = ç ÑÑÑ÷ wl
è us Ð rsvø
174 Kaleckian models of demand-led growth
Downloaded from Elgar Online by University of Melbourne at 07/12/2013 04:09:04AM

Of course, the equation makes sense only if the denominator is positive,that is if us > rsv. This inequality must be fulfilled since it implies that wagesare positive (that is, profit income is smaller than total income). When thistarget return pricing formula is combined with equation [10.3], we obtain therate of profit seen from the cost side, i.e., the profits cost function:
rPC = rs(uyus) [10.5]
One should note that if the actual rate of capacity utilization u turns out tobe equal to the standard rate of utilization of capacity us, the actual rate ofprofit r is then equal to the target rate of return rs embodied in the costingmargin of the pricing procedure. Since equation [10.5] is linear in u, it clearlyshows that the standard and the actual rates of profit cannot be equal unless thestandard and the actual rates of capacity utilization are equal. This result willbe useful when the target rate of return is endogenized later on.
The Effective Demand Side
The previous equations define a rate of profit seen from the cost accountingside. The rate of profit that will be realized depends on the actual rate of capac-ity utilization. Effective demand, which has not yet been taken into account,helps determine the rate of capacity utilization. In the old post-Keynesianmodels, the rate of accumulation is taken to be exogenous. The impact ofeffective demand in the Cambridge equation is felt on the realized rate ofprofit, which is the endogenous variable. A crucial feature of the Kaleckianmodel is its investment function. The Cambridge equation must thus be rein-terpreted as a savings function. Using the standard assumption that there areno savings out of wages, the savings function in growth terms becomes:
gs = rsp
with sp the overall propensity to save out of profits.We now come to the investment function, which has been an important
subject of contention.3 Let us present a version of it which has often been usedby Kaleckian authors. The rate of accumulation set by firms depends on therate of capacity utilization and on the realized rate of profit:
gi = g + guu + grr
where g is some parameter, which must be positive in models without over-head labour (Dutt 1990, p. 25), while gu and gr are positive reaction parame-ters.
The Kaleckian growth model 175
Downloaded from Elgar Online by University of Melbourne at 07/12/2013 04:09:04AM

Putting together the previous two equations, one obtains what Rowthorn(1981, p. 12) calls the realization curve. To avoid confusion, and to emphasizethe role of effective demand, we shall call it the effective demand equation:
rED = (guu + g)y(sp Ð gr) [10.6]
The steady-state solution to this Kaleckian model of growth and distribu-tion can be obtained by combining the profits cost equation [10.5] and theeffective demand equation [10.6]. Doing so yields:
u* = gusy[rs(sp Ð gr) Ð guus]
r* = grsy[rs(sp Ð gr) Ð guus] [10.7]
As is standard with this kind of model, the solutions are positive and the modelis stable provided:
sp > gr + guusyrs
A FULLY ADJUSTED POSITION WITH AN ENDOGENOUSNORMAL RATE OF PROFIT
As is well known, the basic Kaleckian growth model exhibits two features.First, KeynesÕs paradox of thrift holds, even in the long run (an increase in thepropensity to save decreases u* and r*, and hence the rate of accumulation).Second, there is the paradox of cost: any increase in costs raises the realizedrate of profit (Rowthorn, 1981, p. 18). A higher target rate of return (that is, alower real wage) is associated with a lower rate of utilization, a lower realizedrate of profit and hence a lower rate of accumulation. Not all Kaleckiansendorse the sort of investment function that gives rise to the paradox of costs,but there is agreement, nonetheless, that the paradox of costs may occur undersome circumstances.4
Another controversy Ð central to the focus of this chapter Ð is the discrep-ancy between the target rate of return and the realized rate of profit. While thereis no objection to these two rates being different in the short run, several authorsbelieve that any discrepancy between the two rates contradicts the notion of along-run equilibrium Ð a final equilibrium where there should exist no induce-ment to modify the values taken by the main variables. Sraffian authors, suchas Vianello (1985), Committeri (1986) or Park (1997a), and Marxist authors,such as Dum�nil and L�vy (1995, 1999) or Auerbach and Skott (1988), insistthat, in the long run, targets should be achieved. The steady-state solutions of
176 Kaleckian models of demand-led growth
Downloaded from Elgar Online by University of Melbourne at 07/12/2013 04:09:04AM

the Kaleckian growth model in equation [10.7] may thus be interpreted as aprovisional equilibrium. How, then, can we arrive at a final equilibrium? Andwould this final equilibrium be a fully adjusted position?
One mechanism capable of generating a final, long-run position involvesthe normal rate of profit (or, more precisely, the target rate of return) beinginfluenced by the actual rate of profit. Whenever the rate of profit exceeds thetarget rate of return, firms react by (slowly) increasing the target rate of returnand the costing margin. A straightforward representation of this intuitionyields the following difference equation:
r×s = j (r* Ð rs) [10.8]
Will the operation of equation [10.8] assure convergence between theactual rate of profit and the target rate of return? When the actual rate of profitis higher than the target rate of return, the latter is set at a higher value. Theprofit margin is thus increased. The higher profit margin (the lower real wage)slows down effective demand growth, thus reducing the rate of utilization andthe realized rate of profit, despite the higher target rate of return. This processwill go on until the target rate of return is such that it generates an equivalentactual rate of profit. More formally, this can be seen by taking the derivativeof the equilibrium rate of profit in equation [l10.7] with respect to the targetrate of return:
dr*ydrs = Ð gguusyD2 < 0
where D is the denominator of [10.7].This process, however, will also bring together the realized rate of capacity
utilization and the standard rate of utilization. The actual rate of utilization inthe fully adjusted position thus becomes a predetermined variable, equal to thegiven conventional standard rate us. As a result, the paradox of costs disap-pears. An increase in the rate of growth is associated with a decrease in the realwage rate (and an increase in the target rate of return).
On the other hand, the paradox of thrift is sustained even in this fullyadjusted position. An increase in the propensity to save has a negative impact,from one fully adjusted position to the next, on the rate of accumulation. Thiscan be seen by putting together equations [10.5] and [10.6], defining the prof-its cost function and the effective demand function. In a fully adjusted posi-tion, the realized rate of capacity utilization is always equal to its standardlevel, so that u* = us. When solving for the long-run, when all adjustmentscorresponding to equation [10.8] have been exhausted, it is the target rate ofreturn rs which becomes the endogenous variable. Solving for this variable,and making use of the Cambridge equation, we obtain:
The Kaleckian growth model 177
Downloaded from Elgar Online by University of Melbourne at 07/12/2013 04:09:04AM

rs** = (guus + g)y(sp Ð gr)
g** = (guus + g)y[1 Ð (grysp)]
An increase in the propensity to save sp yields a fully adjusted position witha lower rate of accumulation. The paradox of thrift thus appears to be quiteresilient. Indeed, the results that are achieved with the addition of the adjust-ment process described by equation [10.8] are akin to those that were defendedby post-Keynesians such as Joan Robinson with the help of the old Cambridgemodel (Lavoie 1992, p. 357).
Are there other means to recover the paradox of thrift or the paradox ofcosts? It is possible to argue that the standard rate of utilization depends onactual utilization rates (Lavoie, 1996; Dutt, 1996; Park, 1997b). This line ofresearch, which generates a multiplicity of solutions, many of which retaintheir Kaleckian properties, will not be pursued here. We shall, instead, followa new avenue, based on the addition of a conflict-based model of inflation.This will allow us, within a fully determined model, to retain the flexibility ofthe rate of capacity utilization and the positive relation between the real wagerate and the rate of accumulation, while assuming equalization of the realizedand normal rates of profit.
A MODEL OF CONFLICT INFLATION
We now present a model of inflation which does not rely on excess demand.The model is based on the inconsistent income claims of firms and workers,that is, on what has variously been described as real wage resistance or theaspiration gap. In standard terminology, the focus of the analysis is on thewage-price spiral. As a first approximation, wageÐwage inflation and otherincome conflicts will be omitted, as will be feedback effects from the realeconomy. This will allows us to understand the essentials of the model and tointegrate it with target return pricing.
The conflict inflation model is Kaleckian because it has some affinity withKaleckiÕs last article (Kalecki, 1971, chapter 14). Whereas previously Kaleckitook the degree of monopoly to be an exogenous variable, he argues in thisarticle that trade unions have the power to achieve reductions in the mark-up,by demanding and achieving large increases in money wage rates.
Several post-Keynesian, neo-Marxian and even mainstream authors haveconstructed models of conflict inflation, as first presented by Rowthorn(1977). In these models, the rate of inflation is a function of the degree ofinconsistency between the mark-up that firms wish to target and the real wagerate that the leading labour bargaining units consider to be fair. As is clear
178 Kaleckian models of demand-led growth
Downloaded from Elgar Online by University of Melbourne at 07/12/2013 04:09:04AM

from the mark-up pricing equation, p = (1 + q)wl, a target set in terms of realwages can always be made equivalent to a target set in terms of a mark-up.With target return pricing procedures, this target corresponds precisely to atarget rate of return. Provided there is no change in productivity, it is thusunimportant whether we assume that firms and workers set real wage targetsor mark-up targets. Here, we shall formulate the model in terms of target ratesof return.
The basic model of conflict inflation is based on two equations (see forexample Dutt, 1990, p. 83). It is assumed first that the rate of growth ofmoney wages, which labour unions manage to negotiate, is a function of thediscrepancy between their real wage target and the actual real wage rate. Interms of target rates of return, this means that the target real wage rate ofworkers is equivalent to a target rate of return rsw. It is the discrepancybetween a high actual target rate of return and a low desired target rate ofreturn, seen from the workersÕ point of view, which drives up wage demands.It is also assumed that the rate of growth of money wages depends on theexpected rate of price inflation, pö e. In its simplest form, these ideas can beexpressed as:
wö = W1(rs Ð rsw) + W2pöe
Similarly, it may be assumed that firms increase prices when the actualmark-up is below the mark-up that they desire, and that the larger the differ-ential between these mark-ups, the higher the rate of price inflation will be.This may be formalized in terms of a target rate of return, which for the firmwe may denote as rsf . The target rate of return as assessed by firms may bedifferent from the actual target rate of return incorporated into prices. Whenfirms aim for higher mark-ups, given the current actual mark-up, they willspeed up the rate of price inflation, subject to the constraint of their bargain-ing power vis � vis labour and in product markets. Assuming that firms mayhave to list prices before wage increases have been settled, and taking intoaccount expected wage inflation, we have:
pö = Y1(rsf Ð rs) + Y2wö e
We are now able to give an explanation of why the target rate of returnmay fully adjust to the actual rate of profit, without the rate of capacityutilization becoming exogenous. To do so, it has to be recognized that firmsare not in a position to set the exact mark-up of their choice. One must thusdistinguish between two sorts of gross costing margins: the actual costingmargin, which arises from the bargaining process; and the desired costingmargin, which corresponds to the target rate of return and the standard rate of
The Kaleckian growth model 179
Downloaded from Elgar Online by University of Melbourne at 07/12/2013 04:09:04AM

capacity utilization that firms would like to incorporate into their pricingstrategy. In terms of wage rates, one would have to distinguish between twowage rates: the actual real wage rate arising from bargaining; and the realwage rate targeted by firms, corresponding to the standard rate of profit rsfassessed by firms.
A steady state in a model without technical progress occurs when the actualreal wage rate is constant, that is, when the actual and the expected rates ofwage inflation are equal to the actual and expected rates of price inflation. Insuch an equilibrium, the profit margin is constant, and equating the two equa-tions describing wage and price inflation, we get:
By solving the above equation for the target rate of return actually incor-porated into prices, rs, the distinction between this concept and the target rateof return rsf assessed by firms becomes clearer. There is a simple relationshipbetween the two concepts: the actual target rate of return rs is a weighted aver-age of both the target rate of return assessed by firms and the target rate ofreturn assessed by workers, where the sum of the weights (W and Y) is equalto one, such that:
rs = Yrsf + Wrsw [10.9]
where:
The resulting model of accumulation is exactly like the model firstpresented in the second section, which involved no complications related toinflation. In equations [10.4] and [10.5], we may now introduce the value ofthe actual target rate of return as given by the weighted average in equation[10.9]. Combining equations [10.7] and [10.9], one obtains:
[10.10]rr r
s r r usf sw
p r sf sw u s
* ( )
( ) ( )=
+
- + -
g
g g
Y W
Y W
YY W
W Y Y W=
-- + -
1 2
1 2 1 2
1
1 1
( )
( ) ( )
WW Y
W Y Y W=
-- + -
1 2
1 2 1 2
1
1 1
( )
( ) ( )
=-
-=
-
-
W
W
Y
Y1
2
1
21 1
( ) ( )r r r rs sw sf s
180 Kaleckian models of demand-led growth
pö
Downloaded from Elgar Online by University of Melbourne at 07/12/2013 04:09:04AM

An increase in the target rate of return as assessed by firms, rsf , will lead toan increase in the target rate of return incorporated into prices, rs, and hence,as shown in the third section, to a fall in the realized rate of profit r*, that is:
dr*ydrsf < 0 [10.11]
CONFLICT INFLATION WITH AN ENDOGENOUSTARGET RATE OF RETURN
Let us now endogenize the target rate of return as assessed by firms. Thismeans that higher realized rates of profit will modify what firms consider tobe the normal rate of profit. Let us assume, then, that firms slowly adjust theirassessed target rate of return (rsf ) according to the actual rate of profit (r), inthe manner of equation [10.8] above. More precisely, as suggested in Lavoie(1992, p. 418), equation [10.8] must now be written as:
r×sf = j(r* Ð rsf ) [10.12]
In the third section, it was argued that a long-run equilibrium is reachedwhen the target rate of return, rs, is the same in two successive periods Ð thatis, when the target rate of return and the actual rate of profit are equal, due tothe process in equation [10.8]. Here, in a world where trade unions have somebargaining power, the process of adjustment instead involves the target rate ofreturn rsf assessed by firms and equation [10.12]. In general, the processdescribed by equation [10.12] will thus come to an end without the fullyadjusted rate of return being actually incorporated in prices. This means thatthe rate of capacity utilization emerging from the adjustment process is notnecessarily the standard rate of utilization, and that as a consequence the rateof capacity utilization is endogenous despite the existence of this adjustmentprocess. The long-run equilibrium is not, in general, a fully-adjusted position.
The final equilibrium of such an economy with evolving bargaining powerthus requires the additional equation, r* = rsf . Unfortunately, adding thiscondition in equations [10.7] and [10.10] yields a quadratic equation. It is thuseasier to assess the adjustment process from a graphical point of view. We canfirst look at this adjustment process by considering the rate of profit only. Thisis done in Figure 10.1. The r* curve represents the negative link between thetarget rate of return assessed by firms, rsf , and the actual rate of profit thatarises from effective demand considerations. For instance, when the actualrate of profit is above the target rate of return as assessed by firms, firms reactby raising what they perceive to be the normal target rate of return. This, asshown by equation [10.11], leads to a decrease in the realized rate of profit.
The Kaleckian growth model 181
Downloaded from Elgar Online by University of Melbourne at 07/12/2013 04:09:04AM
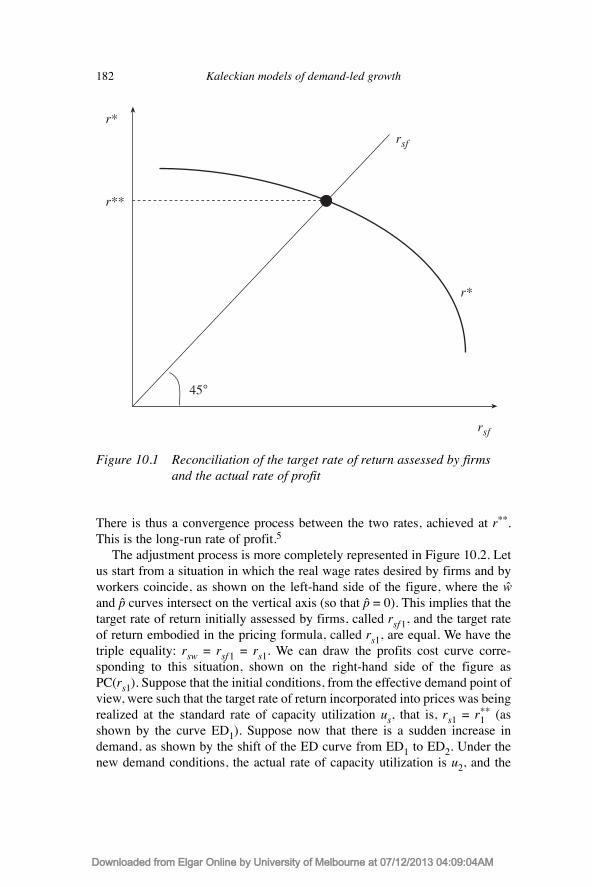
There is thus a convergence process between the two rates, achieved at r**.This is the long-run rate of profit.5
The adjustment process is more completely represented in Figure 10.2. Letus start from a situation in which the real wage rates desired by firms and byworkers coincide, as shown on the left-hand side of the figure, where the wöand pö curves intersect on the vertical axis (so that pö = 0). This implies that thetarget rate of return initially assessed by firms, called rsf 1, and the target rateof return embodied in the pricing formula, called rs1, are equal. We have thetriple equality: rsw = rsf 1 = rs1. We can draw the profits cost curve corre-sponding to this situation, shown on the right-hand side of the figure asPC(rs1). Suppose that the initial conditions, from the effective demand point ofview, were such that the target rate of return incorporated into prices was beingrealized at the standard rate of capacity utilization us, that is, rs1 = r1
** (asshown by the curve ED1). Suppose now that there is a sudden increase indemand, as shown by the shift of the ED curve from ED1 to ED2. Under thenew demand conditions, the actual rate of capacity utilization is u2, and the
182 Kaleckian models of demand-led growth
45°
r*
r*
rsf
r**
rsf
Figure 10.1 Reconciliation of the target rate of return assessed by firmsand the actual rate of profit
Downloaded from Elgar Online by University of Melbourne at 07/12/2013 04:09:04AM

actual rate of profit is r2. The actual rate of profit r2 is thus much higher thanthe target rate of return rsf 1 = r1
**. As a result, firms will slowly revise upwardstheir assessed target rate of return rsf , along the lines of equation [10.12], as isillustrated in Figure 10.1.
Three phenomena will now arise. First, as firms revise their estimate ofwhat the target rate of return is, a discrepancy arises between the real wage ratetargeted by firms and the real wage rate targeted by workers. This will inducewage and price inflation, along the lines of our conflict inflation model, whilethe actual real wage rate becomes different from the real wage targeted byfirms. Second, a similar wedge arises between the target rate of return assessedby firms and the target rate of return incorporated into prices. Third, as realwages diminish, the actual rate of profit falls. There is thus a convergencebetween the realized rate of profit, which falls, and the target rate of returnassessed by firms, which rises.
The end result of this convergence process is shown in Figure 10.2. Firmsare assessing a target rate of return of rsf 2. Because of the bargaining power oflabour, inflation occurs at a rate of pö2
*.6 The new profits cost curve PC(rs2) is
The Kaleckian growth model 183
Figure 10.2 Adjustment to long-run equilibrium following a change indemand conditions
ED1
u2u2**
rs
u
ED2
PC(rs2) PC(rs1)
rs2
r1**
r2
r2** = rsf2
pö2
pö1
wö
r
pö2*pö us
Downloaded from Elgar Online by University of Melbourne at 07/12/2013 04:09:04AM

such that the actual rate of profit, r2**, and the target rate of return assessed by
firms, rsf 2, are equated. The adjustment process of the target rate of return hasled to a new rate of capacity utilization u2
**, which is different from the stan-dard rate of utilization, us. The rate of capacity utilization in the long-run posi-tion is thus still endogenous, despite the presence of an adjustmentmechanism.
The introduction of real wage resistance by workers thus yields a modelwhere the equilibrium rate of capacity utilization remains endogenous (that is,does not have to equal its exogenously given standard rate), despite the adop-tion of a mechanism that brings the target rate of return and the actual rate ofprofit into equality. The realized rate of profit is equalized to the target rate ofreturn assessed by entrepreneurs, although this assessed normal rate of profitis not exactly incorporated into prices because of real wage resistance. The keycharacteristic of the Kaleckian model, that is the endogeneity of the rate ofcapacity utilization, even in the long run, is thus preserved within a model withdefinite solutions.
One last issue must be dealt with: does the paradox of costs still hold in thenew model? From the analysis portrayed in Figure 10.2, it is clear that thehigher fully adjusted rate of accumulation (induced by higher animal spirits ora lower propensity to save) has led to an increase in the profit margin andhence to a fall in the real wage rate. Thus, while the paradox of thrift has beenrecovered once again, one may wonder whether the attempt to extend theKaleckian model has resulted in the abandonment of key features of Kaleckiananalysis? This is not the case however. Even with adjustment mechanisms ofthe type entertained in equation [10.12], a rise in the rate of accumulation maybe accompanied by increases in the real wage rate.
This possibility is illustrated in Figure 10.3. Suppose again that we startfrom a fully adjusted position, where conditions are such that the actual rate ofcapacity utilization is equal to the standard rate of utilization, and where thetargets of workers and firms coincide. The rates of profit are thenr1
** = rs1 = rsf 1 = rsw1. The economy is at the intersection of the ED and PC(rs1)curves, while on the left-hand side of the figure, the wö 1 and pö1 curves intersecton the vertical axis. Now consider the case where workers are more militantand request a higher real wage rate, equivalent to a lower target rate of return,say rsw 2. Given this new target real wage, the wage inflation curve in the left-hand quadrant will shift from wö 1 and wö 2. Assume, for didactic purposes, thatthe actual real wage quickly settles to its stationary level, where wage infla-tion and price inflation are equated. This implies that the rate of profit incor-porated into prices will be rsp, given by the intersection of the wö 2 and pö1curves. The profits cost curve will thus rotate down from PC(rs1) to PC(rsp).The higher real wages will induce a higher rate of capacity utilization (u2), ahigher rate of accumulation and higher realized rates of profit (r2). This is the
184 Kaleckian models of demand-led growth
Downloaded from Elgar Online by University of Melbourne at 07/12/2013 04:09:04AM

usual Kaleckian result, but it is a provisional one. In the long run, the highrealized rate of profit will induce entrepreneurs to increase what they considerto be the assessed target rate of return. In Figure 10.3, this is represented bothby a displacement of the pö price inflation curve, from pö1 to pö2, and by anupward rotation of the PC curve, from PC(rsp) to PC(rs2), until finally, thefalling realized rate of profit equates the increasing assessed target rate ofreturn, such that in the end rsf 2 = r2
**. At this point, the new long-run rate ofreturn incorporated into prices is given by rs2, with rs2 < rs1. The new wö 2 andpö2 curves intersect at this rate of profit. The new long-run rate of utilization,u2
**, is necessarily on the given ED curve, between the initial rate us and theprovisional rate u2. Thus comparing long-run positions, where the assessedtarget rates of return and the realized rate of profit are equated, it follows that,in this case, a higher rate of capital accumulation is associated with a lowerincorporated target rate of return, and hence with a higher real wage.7 The keySraffian and Kaleckian belief, that higher rates of accumulation need not beassociated with lower real wages, is thus confirmed, even across long-runpositions.
The Kaleckian growth model 185
us u2** u
ED
PC(rs2)PC(rs1)
rsw2
rs2
r2
pö2 pö1
wö 2
r
pö2*pö
r1** = rsf1
rsp
r2** = rsf2
wö 1
u2
PC(rsp)
Figure 10.3 Adjustment to long-run equilibrium following a change in costconditions
Downloaded from Elgar Online by University of Melbourne at 07/12/2013 04:09:04AM

CONCLUSION
In contrast to what was initially assumed both by Marxists and neo-Keynesians � la Joan Robinson and Nicholas Kaldor, Kaleckians (and someSraffians) contend that higher rates of accumulation need not be associatedwith lower real wages, even without technical progress. This result is linkedto the endogeneity of the rate of capacity utilization. However valid withinthe short-run context, the result has been questioned on the basis that it relieson discrepancies between the standard and realized rates of capacity utiliza-tion, or between normal and realized rates of profit, discrepancies that arejudged to be unwarranted in long-run analysis. Other solutions have beenoffered in the past to avoid this logical problem, such as the distinctionbetween normal and average values (Park, 1997a; 1997b), as well as thepossibility of endogenous normal rates of capacity utilization, which gener-ates models of hysteresis (Dutt, 1997; Lavoie, 1996). There is also the solu-tion offered by Dum�nil and L�vy (1999), where a short-run Kaleckiangrowth model, with demand-led features, is transformed into a long-runsupply-led classical model of accumulation. In this model, faster growth infully adjusted positions requires higher savings rates and higher normalprofit rates.
Two other solutions, that do not forsake the long-run, demand-led approachto growth, were considered here. The first solution, where the normal profitrate is endogenous, responding to the values taken by the realized profit rate,transforms the Kaleckian model into the old Cambridge growth model � laJoan Robinson. When the adjustment process has been completed, the long-run equilibria are fully adjusted positions running at their normal rates ofcapacity utilization, where higher rates of accumulation require lower realwages and higher normal profit rates. Still, these fully adjusted positionsexhibit some demand-led features, namely the paradox of thrift.
The solution examined in greatest detail is also based on the endogeneity ofthe value taken by the normal rate of profit. But, in addition, we consideredthe possibility of a divergence between the rates of return assessed andtargeted by firms on the one hand, and the rate of return which is actuallyincorporated into prices on the other. This divergence arises because of thebargaining power of workers and their real wage resistance. There is conver-gence, however, between the realized rate of profit and the rate of profittargeted by firms. Under this conditions, the demand-led characteristics of theKaleckian model are sustained, even in long-run equilibrium. Such long-runequilibria are not fully adjusted positions, where the equilibrium rate of capac-ity utilization equals its normal value. The utilization rate remains an endoge-nous variable, even in long-run equilibrium. The paradox of thrift remains truein all cases, while the paradox of costs remains valid, in some cases, that is,
186 Kaleckian models of demand-led growth
Downloaded from Elgar Online by University of Melbourne at 07/12/2013 04:09:04AM

higher rates of accumulation need not be associated with lower real wages,even across long-run positions.
The model is a highly simplified one. For instance, technical progress hasbeen set aside; it has also been implicitly assumed that there is a reserve armyof workers and that fluctuations in employment do not have feedback effectson the real wage targeted by workers. However, realistic complications that gobeyond the above-mentioned heuristic simplifications can be added to themodel, without affecting the main results (Cassetti 2000).
NOTES
1. This chapter was presented at the annual meeting of the Eastern Economic Association, inBoston, in March 1999, and also at a seminar organized by Ramon Tortajada at the UniversityPierre Mend�s-France, Grenoble, in March 2000. I wish to thank participants in both eventsfor their comments.
2. A similar but more complicated formula could be derived in a two-sector case, as is done inLavoie and Ramirez-Gaston (1997).
3. See the chapter by Blecker in this volume for a review of this debate.4. Sraffian and Marxist authors, as is explicit in Kurz (1991, 1994) and Bhaduri and Marglin
(1990), generally endorse an investment function of the type: gi = g + guu + grrs . The paradoxof costs will only arise under some parameter constellations. This sort of investment function,however, creates some additional stability problems, as can be deduced from the work ofBruno (1999).
5. As can be seen, given the necessary negative relationship between the target rate of return andthe actual rate of profit, there can only be one economically relevant long-run equilibrium;the other solution would yield a negative rate of profit.
6. This rate of inflation is a steady-state rate of inflation, and not just a transitory phenomenon.7. We would still get this result if we had started from a situation where the steady-state rate of
inflation were greater than zero.
REFERENCES
Auerbach, P. and P. Skott (1988) ÔConcentration, competition and distribution,ÕInternational Review of Applied Economics, 2, 42Ð61.
Bhaduri, A. and S. Marglin (1990) ÔUnemployment and the real wage: the economicbasis for contesting political ideologies,Õ Cambridge Journal of Economics, 14,375Ð93.
Bruno, O. (1999) ÔLong-run positions and short-run dynamics in a classical growthmodel,Õ Metroeconomica, 50, 119Ð37.
Cassetti, M. (2000) ÔConflict, inflation, distribution and terms of trade in the Kaleckianmodel,Õ this volume.
Chick, V. and M. Caserta (1997) ÔProvisional equilibrium and macroeconomic theory,Õin P. Arestis, G. Palma and M. Sawyer (eds) Markets, Unemployment and EconomicPolicy: Essays in Honour of Geoff Harcourt, vol. II, London, Routledge, 223Ð37.
Committeri, M. (1986) ÔSome comments on recent contributions on capital accumula-tion, income distribution and capacity utilization,Õ Surplus Studies in PoliticalEconomy, 2, 161Ð86.
The Kaleckian growth model 187
Downloaded from Elgar Online by University of Melbourne at 07/12/2013 04:09:04AM

Dum�nil, G. and D. L�vy (1995) ÔA post-Keynesian long-term equilibrium with equal-ized profit rates? A rejoinder to Amitava DuttÕs synthesis,Õ Review of RadicalPolitical Economics, 27, 135Ð41.
Dum�nil, G. and D. L�vy (1999) ÔBeing Keynesian in the short term and classical inthe long term: the traverse to classical long term equilibrium,Õ Manchester Schoolof Economics and Social Studies, 67, 684Ð716.
Dutt, A.K. (1990) Growth, Distribution and Uneven Development, Cambridge,Cambridge University Press.
Dutt, A.K. (1997) ÔEquilibrium, path dependence and hysteresis in post-Keynesianmodels,Õ in P. Arestis, G. Palma and M. Sawyer (eds) Markets, Unemployment andEconomic Policy: Essays in Honour of Geoff Harcourt, vol. II, London, Routledge,238Ð53.
Kalecki, M. (1971) Selected Essays in the Dynamics of the Capitalist Economy,Cambridge, Cambridge University Press.
Kurz, H.D. (1991) ÔTechnical change, growth and distribution: a steady state approachto unsteady growth on Kaldorian lines,Õ in E.J. Nell and W. Semmler (eds) NicholasKaldor and Mainstream Economics, London, Macmillan, 421Ð48.
Kurz, H.D. (1994) ÔGrowth and distribution,Õ Review of Political Economy, 6,393Ð420.
Lanzillotti, R.F. (1958) ÔPricing objectives in large companies,Õ American EconomicReview, 48, 921Ð40.
Lavoie, M. (1992) Foundations of Post-Keynesian Economic Analysis, Aldershot,Edward Elgar .
Lavoie, M. (1996) ÔTraverse, hysteresis and normal rates of capacity utilization inKaleckian models of growth and distribution,Õ Review of Radical PoliticalEconomics, 28, 113Ð47.
Lavoie, M. and P. Ramirez-Gaston (1997) ÔTraverse in a two-sector Kaleckian modelof growth with target-return pricing,Õ Manchester School of Economic and SocialStudies, 65, 45Ð69.
Lee, F.S. (1994) ÔFrom post-Keynesian to historical price theory, part 1: facts, theoryand empirically grounded pricing model,Õ Review of Political Economy, 6, 303Ð36.
Park, M.S. (1997a) ÔNormal values and average values,Õ Metroeconomica, 48, 188Ð99.Park, M.S. (1997b) ÔAccumulation, capacity utilization and distribution,Õ Contributions
to Political Economy, 16, 87Ð101.Rowthorn, R.E. (1977) ÔConflict, inflation and money,Õ Cambridge Journal of
Economics, 1, 215Ð39.Rowthorn, B. (1981) ÔDemand, real wages and economic growth,Õ Thames Papers in
Political Economy, London, Thames Polytechnic.Shipley, D.D. (1981) ÔPricing objectives in British manufacturing industry,Õ Journal of
Industrial Economics, 29, 429Ð43.Vianello, F. (1985) ÔThe pace of accumulation,Õ Political Economy: Studies in the
Surplus Approach, 1, 69Ð87.
188 Kaleckian models of demand-led growth
Downloaded from Elgar Online by University of Melbourne at 07/12/2013 04:09:04AM
11. Conflict, inflation, distribution andterms of trade in the Kaleckian model
Mario Cassetti
INTRODUCTION
Recently, a new generation of models of growth and distribution, inspiredby the Kaleckian tradition, has emerged.1 As noted by Lavoie (1992, 1995),these models differ from the standard Cambridgian growth models in tworespects. First, they assume an oligopolistic environment, that is, firms havediscretionary power and set their margins above production costs in orderto generate funds for investment. Also, unions negotiate money wages witha view to achieving a ÔfairÕ or historic share of total real income. Second,the new models treat capacity utilization as endogenous, even in the longperiod. As a result, the real wage rate and the rates of capacity utilization,accumulation and profit are correlated both in the short and in the longperiod.
There is also a substantial difference between the standard Cambridgianand later Kaleckian models as regards the role of changes in income distri-bution. Such changes are confined to full employment (Kaldor, 1961) orfull capacity situations (Robinson, 1962) in the earlier post-Keynesianmodels, where KeynesÕs multiplier theory has two different uses. In theshort period, the principle of effective demand is put to work to determinereal income and employment, given the distribution of income. In the longperiod, it is applied to the determination of prices relative to wages, that is, to changes in the distribution of income, given the level of capacity or of employment. In this situation, an increase in investment results in an increase in the profit share and in savings. This is the long-period mech-anism by which savings are adjusted to investment. In the new Kaleckianmodels, in the long run, the capacity utilization rate (which may divergefrom full capacity), the rate of growth and income distribution are all jointlydetermined.
This chapter shows how to combine, in a Kaleckian framework, the theoryof effective demand and the conflict theory of inflation. In particular, it isassumed that the relative bargaining power of capitalists and workers affects
189
Downloaded from Elgar Online by University of Melbourne at 07/12/2013 04:18:01AM

the dynamics of prices and wages, and therefore modifies their income shares.The subsequent changes in investment and saving decisions influence growth,capacity utilization and employment levels. These, in turn, feed back to affectworkersÕ and capitalistsÕ bargaining strength.
Before summarizing this chapter, we first briefly discuss the existing liter-ature. Basic insights into the problem studied here can be found in Rowthorn(1977, 1981), Del Monte (1975), Marglin (1984, especially chapter 20), Taylor(1985), Skott (1989, especially chapter 8), Dutt (1984, 1990, 1992) and Lavoie(1992, 1995). None of these works, except for Dutt (1992), treats the distrib-ution of income as endogenous.
RowthornÕs fundamental papers deal with both growth and distribution, butseparately. Taylor combines aspects of Kaleckian growth with the conflicttheory of inflation. Unfortunately, he linearizes all functions, thus eliminatingthe possibility of multiple equilibria. Del Monte (1975) and Dutt (1984)explicitly consider the relationship between growth and distribution, butanalyse only the effects of exogenous changes in the mark-up.
The aim of DuttÕs (1992) model is essentially the same as ours, but itsdynamics are different.2 A long and comprehensive discussion of theKaleckian model and its extensions can be found in Lavoie (1992): this chap-ter explicitly models chapter 7 of LavoieÕs book.
The rest of the chapter is organized as follows. The second sectiondescribes a closed economy model that displays effective demand andconflicting claims features. Its dynamic and static implications are thendiscussed in the third and fourth sections. The model is extended in the fifthsection to include foreign trade, by bringing the terms of trade and the tradebalance into play. A final section considers instability in the long run.
THE CLOSED ECONOMY MODEL3
In this section, we describe the basic Kaleckian model of a closed economy.We begin with a list of assumptions sufficient to specify effective demand, andthen deduce their implications. Income distribution and inflation are intro-duced afterwards.
There are two social classes: workers, and capitalist who own firms. Firmsproduce outputs that are used both for consumption and investment.
The money supply is passive, that is, either monetary policy accommodatesfully all wage claims and pricing decisions, or the velocity of money adjustsinstantly to reestablish equilibrium.
At any time t, workers consume all their income, while capitalists save aconstant fraction, sp, of profits, Pt.
4 The ratio of the capital stock, Kt, to real,full capacity output, Yt
*, denoted by k, is constant. Capital does not depreciate.
190 Kaleckian models of demand-led growth
Downloaded from Elgar Online by University of Melbourne at 07/12/2013 04:18:01AM

We also assume that the ratio of government expenditure to the stock of capi-tal is constant, say b.
Since investment and savings are always equal, the well-known Cambridgeequation holds:
gt = sprt Ð b [11.1]
where gt is the ÔeffectiveÕ rate of growth and rt is the rate of profit.As is usually the case in Keynesian models, below full capacity, the short-
run supply of output adjusts immediately to demand. This means that equation[11.1] is always satisfied, and that gt is the ÔeffectiveÕ rate of growth.
The desired rate of accumulation, gtd, is a linear function of the expected
rate of profit, rte, and of the expected rate of capacity utilization, ue:
gtd = g + d rt
e + eute g _ 0; d, e > 0 [11.2]
where g is the autonomous rate of growth of capital, and d and e reflect thesensitivity of investors to the rates of profit and capacity utilization, respec-tively. The actual utilization rate is ut = YtyYt
*, where Yt stands for real output.Equation [11.2] is the standard KaleckiÐSteindlÐKaldor investment function.5
The assumptions given are sufficient to describe the effective demand sideof the model, which will be in equilibrium if gt = gt
d. We turn now to theconflicting claims side of the model.
In all post-Keynesian literature, the basic idea is that the wage rate is not anordinary price. Money wages depend largely on the balance of power betweenworkers and capitalists. Commodity prices, meanwhile, depend on the marketpower of firms and on their needs for internal funds. Real wages and incomedistribution, therefore, result from changes in money wages and prices.
Firms set the price as a mark-up, mt, on prime costs (which here consist onlyof labour costs), that is:
[11.3]
where pt is the price level, wt the money wage rate, and a the average produc-tivity of labour, which we assume constant. From [11.3] we can now derive anexpression for the rate of growth of prices.
Let Et denote the level of employment. Then total profits are:
Pt = ptYt Ð wtEt [11.4]
Combining [11.3] and [11.4], the share of profits, mt can be written as:
pw
att
t= +( )1 m
Conflict, inflation, distribution and terms of trade 191
Downloaded from Elgar Online by University of Melbourne at 07/12/2013 04:18:01AM

[11.5]
and the price equation [11.3] may be rewritten as:
[11.6]
Finally, diffentiating [11.6] with respect to time, we obtain:
[11.7]
Now assume that workers set the nominal wage in order to achieve the realwage target vw . In terms of the share of profits, this means that workers try tofix the profit share at the target value mw = 1 Ð vwya. Similarly, firms set pricesso as to achieve their target mark-up, which, in view of [11.5], corresponds toa target income share mf .
Expectations are adaptive. If the wage share is low, workers will press forhigher money wages until the wage share reaches the desired level. The equa-tion determining the rate of wage inflation is:
[11.8]
where qw measures the reaction speed of labour unions to a discrepancybetween the actual and workersÕ desired profit share of income.
Symmetrically, firms try to close the gap between the actual and their targetprofit share by increasing prices. The price change equation is given by:
[11.9]
where qf is the speed of adjustment of firms.Both qw and qf depend on the bargaining power of workers and capitalists,
respectively. Since both are positive and finite, the actual distribution ofincome will lie somewhere between the targets of the two groups.
The share targeted by firms is directly related to the ratio of demand to totalproductive capacity. The target set by labour unions, meanwhile, is positivelyinfluenced by the rate of employment et. Thus, the target share of firms is:
mf = m0 + m1ut m0, m1 > 0 [11.10]
pm m
tf f t f= - >q q( ) 0
wm m
tw t w w= - >q q( ) 0
p w mt t t
= +-1
wtæ 1 ö
pt = ÑÑ çÑÑÑ÷a è 1 Ð mt ø
mp Ytt
t t
t
t= =
+P m
m1
192 Kaleckian models of demand-led growth
pùt wù
t mùt
wùt
pùt
Downloaded from Elgar Online by University of Melbourne at 07/12/2013 04:18:01AM

while workersÕ desired profit share is given by:
mw = v0 Ð v¢1et v0, v¢1 > 0 [11.11]
where et = EtyLt is the employment rate, Lt being the total workforce, that is,the profit share that workers are willing to leave to firms is inversely relatedto the rate of employment, and directly related to the rate of unemployment.The rationale behind these relations is that when demand is high with respectto capacity, entrepreneurs try to take advantage of reduced competition in theproduct market by increasing their mark-ups and profits. The bargainingpower of workers increases with tightening of the labour market. This is theMarxian connection between the reserve army of the unemployed and thestrength of the working class.6
Notice that, given the stock of capital, Kt, and the size of the total workforce, Lt, there is a link between the employment and the utilization rate:
[11.12]
Equation [11.12] enables us to introduce another assumption of the neo-Marxian approach. The labour force is endogenous, and grows at the samerate as capital since the capitalistic sector of the economy can draw onlabour from the other sectors (see Marglin, 1984, where this assumption isjustified at length).7 Thus, in steady-state equilibrium, the ratio KyL isfixed, and the target share of workers may be written as a function of theutilization rate:
mw = v0 Ð v1ut where v1 = v ¢1(1yka) (KyL) > 0 [11.13]
Here, v1 reflects the rate at which workersÕ target profit share is revised inresponse to changes in the capacity utilization rate.
Notice now that, from [11.7], it follows that m× ty(1 Ð mt) = 0 wheneverp× t ypt = w× tywt. that is, given [11.8] and [11.9], the inflation rate, the profitsshare and the real wage bill will be constant.
We next derive a curve representing all the pairings of mt and ut for whichthe inflation rate is constant. Let us define pöt as a constant inflation rate, andmÐ
t the non-accelerating inflation profit share. Equating [11.8] and [11.9],substituting from [11.10] and [11.13], and rearranging, we have:
mÐt = z1 + z2ut [11.14]
where:
eE
Y
Y
Y
Y
K
K
L ka
K
Lut
t
t
t
t
t
t
t
t
t
tt= =*
* 1
Conflict, inflation, distribution and terms of trade 193
Downloaded from Elgar Online by University of Melbourne at 07/12/2013 04:18:01AM
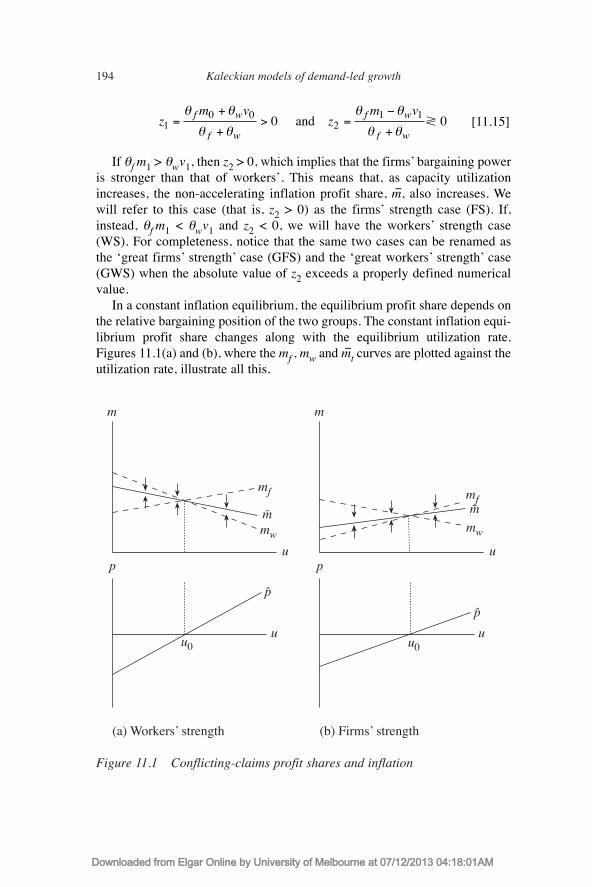
[11.15]
If qf m1 > qwv1, then z2 > 0, which implies that the firmsÕ bargaining poweris stronger than that of workersÕ. This means that, as capacity utilizationincreases, the non-accelerating inflation profit share, mÐ, also increases. Wewill refer to this case (that is, z2 > 0) as the firmsÕ strength case (FS). If,instead, qf m1 < qwv1 and z2 < 0, we will have the workersÕ strength case(WS). For completeness, notice that the same two cases can be renamed asthe Ôgreat firmsÕ strengthÕ case (GFS) and the Ôgreat workersÕ strengthÕ case(GWS) when the absolute value of z2 exceeds a properly defined numericalvalue.
In a constant inflation equilibrium, the equilibrium profit share depends onthe relative bargaining position of the two groups. The constant inflation equi-librium profit share changes along with the equilibrium utilization rate.Figures 11.1(a) and (b), where the mf , mw and mÐ
t curves are plotted against theutilization rate, illustrate all this.
zm v
zm vf w
f w
f w
f w1
0 02
1 10 0=+
+> =
-
+
q q
q q
q q
q q and _
194 Kaleckian models of demand-led growth
Figure 11.1 Conflicting-claims profit shares and inflation
m
u
mf
mw
mø
p
(a) WorkersÕ strength
u
pö
u0
m
u
mf
mw
mø
p
(b) FirmsÕ strength
u
pö
u0
Downloaded from Elgar Online by University of Melbourne at 07/12/2013 04:18:01AM

The mÐt curve is decreasing in the utilization rate when z2 < 0 (Figure
11.1(a)), and is increasing when z2 > 0 (Figure 11.1(b)). The arrows indicatethe direction of the movement that, at any given u, brings m to the mÐ line. Allpoints that lie off the mÐ curve imply a rate of wage inflation that differs fromthe rate of price inflation, and therefore a profit share that is subject to change.The convergence to a constant m is implied by the proportionality hypothesisof equations [11.8] and [11.9]. If firms get near mf , and thus workers departfrom mw, the increasing push for wages must eventually offset exactly thedecreasing pressure on prices.
The relation between the constant price inflation rate pö and u can beobtained from:
pö = wö = qw(mÐ Ð v0 + v1ut) [11.16]
Substituting [11.14] into [11.16] we obtain:
pö = h1 + h2ut [11.17]
where:
[11.18]
The slope of equation [11.17] depends on the adjustment coefficients qfand qw, and on the parameters m1 and v1. Notice that at the utilization rateu0 = (v0 Ð m0)y(m1 + v1), mf = mw and pö = 0. Below u0, pö is negative, and aboveit is positive (see the bottom panels of Figure 11.1(a) and (b)). To understandbetter the determinants of inflation, we rearrange [11.17] to give:
[11.19]
Inflation (or deflation) is generated by the aspiration gap (mf Ð mw), and isexacerbated by indexation mechanisms, represented by the termqf qwy(qf + qw ). An increase in the utilization rate always leads to greaterinflation.
It should be noted that conflict arises only when u > u0. It is only then thatworkers try to obtain higher real wages than firms are willing to allow. Instead,when capacity is below u0, targets may be reconciled, making it possible forthe equilibrium inflation rate to become negative.
=+
-q q
q qf w
f wf wm m( )
hm v
hm vf w
f w
f w
f w1
0 02
1 10 0=-
+< =
+
+>
q q
q q
q q
q q
( )
( )and
Conflict, inflation, distribution and terms of trade 195
pö
Downloaded from Elgar Online by University of Melbourne at 07/12/2013 04:18:01AM

DYNAMICS AND STABILITY
We now examine the dynamics of the model and in particular its stability.Distributional changes and investment savings decisions combine to deter-mine the long-run rate of growth. Write the profit rate, rt, as:
[11.20]
From equation [11.1] and [11.20] the equilibrium rate of capacity utiliza-tion can be written as:
[11.21]
Suppose that firms adjust the rate of growth of capital to maintain thedesired rate of growth. If entrepreneurial expectations are adaptive, we canwrite:
gùt = a(gt
d Ð gt) a > 0 [11.22]
Equation [11.22] is the first dynamic equation of our model.A second dynamic equation follows from [11.17], after substitution from
[11.8] and [11.9]:
[11.23]
Solving [11.21] for gt, substituting the resulting expression into [11.22],and then inserting [11.10], [11.13] and [11.21] into [11.23], we get the systemof nonlinear equations:
[11.24]
[11.25]
Notice that equation [11.24] holds only when there is excess capacity, so thatwhen gd > g investment can increase along with consumption. Instead, when
= + - + +é
ëêê
ù
ûúú
-( ) ( ) ( )q qf w tp t
t tz mz k
s mg b m1
2 1
é dmt + ek æ dmt + ek ö ùgùt = a ê g + ÑÑÑÑ b Ð ç 1 Ð ÑÑÑÑ÷ gt ú
ë spmt è spmt ø û
1-= - = - - -
m p wm m m m
t t tf f t w t wq q( ) ( )
uk
s mg bt
p tt= +( )
rK
m Y
K
m Y
K
Y
Y km ut
t
t
t t
t
t t
t
t
tt t= = = =
P *
*1
196 Kaleckian models of demand-led growth
pùt wù
tmùt
mùt
Downloaded from Elgar Online by University of Melbourne at 07/12/2013 04:18:01AM

capacity is fully utilized, ut = 1 and investment can grow only by increasingsavings to the detriment of consumption. In this case, substituting [11.20] into[11.1] and differentiating, we obtain:
[11.26]
This equation replaces [11.24] when capacity is fully utilized.We next analyse the existence and stability of all possible equilibria, start-
ing with those involving excess capacity.Equations [11.22] and [11.23] imply that, for an equilibrium to exist, it
must be true that gt = gtd and that mt = mÐ
t . Taking into account that, in equi-librium, the expected values re and ue equal the corresponding actual values,we get from equations [11.1], [11.2], [11.14] and [11.20], the non-linear equi-librium equations:
[11.27]
Solutions for u are given here by:
[11.28]
where the Ô+Õ part of the Ô±Õ sign yields u1*, and the ÔÐÕ part yields u2
*, whileÆ = 4kz2(b + g )(sp Ð d ) + [Ð(sp Ð d )z1 + ke]2.8
Now an excess capacity equilibrium u* is locally stable if
or:
(sp Ð d) (z1 + 2z2u*1,2) > ke [11.29]
Only one of the solutions in [11.28] can be stable. In fact, expression [11.29]holds true, after substituting from [11.28], only for u1
*.9
A number of different equilibria are possible, depending on the signs of(sp Ð d ), z2 and (b + g ), and on the magnitude êz2ê. These equilibria are shownin Table 11.1.
d g
d u
d g
d ut
t u u
td
t u u= =
>* *
u us z k
z sp
p1 2
1
22* *,
( )
( )=
- - + ± D
-
d e
d
s
km u b
km u
m z z u
pt t t t
t t
- = + +æèç
öø÷
= +
gd
e
1 2
=s
kp
Conflict, inflation, distribution and terms of trade 197
gùt mùt
Downloaded from Elgar Online by University of Melbourne at 07/12/2013 04:18:01AM

198
Tabl
e 11
.1Ty
pes
of e
xces
s ca
paci
ty e
quil
ibri
a
êSt
agna
tioni
st r
egim
e (s
p>
d)
êE
xhila
ratio
nist
reg
ime
(sp
< d
)ê
uFS
GFS
WS
GW
SFS
GFS
WS
GW
S
b+
g>
0
1 st
able
1 st
able
1 st
able
1 st
able
ÐÐ
ÐÐ
1 un
stab
leb
+g
< 0
1 un
stab
le1
unst
able
1 un
stab
le1
unst
able
1 un
stab
le1
unst
able
1 un
stab
le1
stab
le1
stab
le1
unst
able
Tabl
e 11
.2Ty
pes
of f
ull
capa
city
equ
ilib
ria
êSt
agna
tioni
st r
egim
e (s
p>
d)
êE
xhila
ratio
nist
reg
ime
(sp
< d
)ê
FSG
FSW
SG
WS
FSG
FSW
SG
WS
b+
g>
0
unst
able
unst
able
unst
able
stab
lest
able
stab
leÐ
Ðb
+g
< 0
stab
leun
stab
lest
able
stab
leÐ
Ðst
able
unst
able
Downloaded from Elgar Online by University of Melbourne at 07/12/2013 04:18:01AM
Let us now consider the fully capacity equilibrium. This is necessarilyunique, and implies an equilibrium profit share fixed at mÐ = z1 + z2. This kindof equilibrium can be maintained as long as firms do not reduce investment,that is, as long as gt
d ³ gt. The level of investment, however, is bounded fromabove by savings generated by the constant inflation share of profits.Therefore, firms are rationed and accumulation is determined by the condition:
[11.30]
All of the possible full capacity equilibria and corresponding parametercombinations are given in Table 11.2.
Numerous post-Keynesian authors assume that sp > d, a stability require-ment which turns the model into an unmistakable stagnationist or undercon-sumptionist version of the Kaleckian model. In an excess capacityequilibrium, any increase in real wages will stimulate the economy and lead togreater output and growth. From Table 11.1 it is clear that for the model devel-oped above to be stable, the same hypothesis is necessary, together with thecondition b +g > 0. The antithetical assumption, sp < d, which gives rise to theexhilarationist regime of the model,10 leads to an unstable excess capacityequilibrium both in the FS case and in the WS case. It is only with the GWScase, coupled with b + g < 0, that the exhilarationist version yields a stableexcess capacity equilibrium. The dynamics of the stagnationist case are illus-trated in Appendix 11.A.
Full capacity stable equilibria exist in both regimes (as illustrated in Table11.2) as a result of a permanent pressure to accumulate. But note, again, thatin the exhilarationist regime, an equilibrium does not exist for half of thepossible parameter combinations.
Following the Kaleckian tradition, we next examine the main implicationsof the stagnationist model, in the case where both sp > d and b + g > 0.
THE COMPARATIVE DYNAMICS OF THE MODEL
We now turn to the effects on equilibrium of changes in the various parametersof our model. In Figure 11.2 panels (a) and (b) depict the relationships betweengd, g and r (the realized rate of profit), and the rate of capacity utilization.Panels (c) and (d), meanwhile, plot mf , mw , mÐ and pö against u. In panel (a), wefind the FS and GFS case, which are similar when b + g > 0. In panel (b), theGWS case is depicted. The WS case is similar to the GWS case illustrated inpanel (b), but with the full capacity vertical line lying between points A and B.
Note that, in the FS/GFS case, as u increases, the strength of firms also
gs
kz z bt
p= + -( )1 2
Conflict, inflation, distribution and terms of trade 199
Downloaded from Elgar Online by University of Melbourne at 07/12/2013 04:18:01AM

increases, making the share of profits (see panel (c)), and thus savings, grow.This explains why the ÔeffectiveÕ as well as the desired rate of growth curvesare upward-sloping. In view of [11.20], the same is true for the realized rate ofprofit curve. In the other case (see panel (b)), where the bargaining power ofthe workers is strong, all of the schedules slope upward as long as the positiveeffect of an increase in the capacity utilization rate prevails over the negativeeffect of the fall in the profit share. After a maximum is reached, the curvesstart sloping downwards, as the capacity effect is insufficient to compensatefor the decline in the profit share (see panel (d)).
At point A in panel (a) and (b), the economy is in a stable equilibrium.Points C are full capacity equilibria. C is an unstable point in the FS/GFS/WScase, and stable in the GWS case. Point B in panel (b) is an unstable equilib-rium position. Here, u¢ = z1y(2 êz2ê)Ð eky(2 êz2ê(sp Ð d )) is the maximumpossible excess capacity equilibrium rate of capacity utilization. Any changethat pushes the utilization rate beyond u¢ leads to a full capacity, stable equi-librium, and to a decline in the rates of growth and profit.
Let us now consider how changes in the various parameters affect theequilibrium position of the economy. We shall consider only stable equilibria.
200 Kaleckian models of demand-led growth
r
u
g
m, p
FirmsÕ strength
pö
mf
g, r
u
gd
mf
mø
m, p
Great workersÕ strength
u
pömw
A
g, r
gd
C
1
Ðmw
mø
u
(d)
(b)
1
gC
r
1
A
u'
B
(a)
(c)
Figure 11.2 Equilibrium positions in the FS/GFS and GWS cases
Downloaded from Elgar Online by University of Melbourne at 07/12/2013 04:18:01AM
In our model, two crucial features of the Kaleckian model, the paradox ofthrift and the paradox of costs (emphasized by Rowthorn (1981) and Lavoie(1992, chapter 6)) are confirmed, provided the rate of capacity utilization staysbelow unity. The paradox of thrift can be shown by considering the impact ofa change in sp on the utilization rate:
[11.31]
That is, an increase in the propensity to save out of profits leads to a lower rateof utilization of capacity. Since, in the case of stable excess capacity equilib-ria, there exist linear and positive relationships between the equilibrium profitand utilization rates, and between the equilibrium growth and utilization rates,an increase in sp also leads to a lower rate of profit and a lower rate of growth.
As an illustration of the paradox of costs, consider an increase in costs, thatis, in the parameter k. Its impact on the rate of utilization is given by:
In other words, a rise in costs initially reduces profits, and hence savings, andcreates an excess demand. As firms respond by increasing utilization andoutput, investment will also rise because of the accelerator effect (as e > 0), sothat, finally, profits, the rate of profit, and the rate of growth, will recover andexceed their previous levels. This is the Ôeffective demandÕ mechanism of themodel: whatever increases (reduces) the amount of savings, for a givenincome, creates an excess supply (demand) which induces less (more) outputand income.11
As for the inflation rate, except for changes in the bargaining position para-meters, any change that increases the utilization rate also increases the infla-tion rate. Inflation is fuelled by any expansionary pressure because of thepositive incentive that an increase in u transmits to both wage and profit aspi-rations.
Consider now changes in the parameters qw , qf , and in the target shares mwand mf . Let us first examine the impact of changes in workersÕ bargainingposition in terms of the parameters v0 and v1 of the function mw. Here, adecrease in v0 or an increase in v1 imply a decrease in the share of profits thatworkers are willing to leave to firms. The resulting decrease in the actual profitshare raises consumption spending, the degree of capacity utilization, and therates of profit and accumulation. An increase in the inflation rate will follow.
By contrast, an increase in m0 or m1 depresses the rates of growth andutilization, as it tends to push upwards the equilibrium profit share through a
¶¶
=+ +
D>
u
k
b ug e *
0
¶¶
= -+ +
- D<
u
s
k b u
sp p
[( ) ]
( )
*g ed
0
Conflict, inflation, distribution and terms of trade 201
Downloaded from Elgar Online by University of Melbourne at 07/12/2013 04:18:01AM

change in the mÐ curve. The impact on the inflation rate of an increase in firmsÕprofit share target is, however, ambiguous. This can be seen by considering,for example, the impact on pö of an increase in m0. We see that:
[11.32]
It is possible that a high qw combined with a low v1 and low m1 may maintainthe inflationary process even if the economy falls into a recession. Under theseconditions, therefore, an upward revision of firmsÕ profit targets may give riseto stagflation, whereas a downward revision may stimulate both an expansionand a decrease in the inflation rate. In this particular case, a decrease in thetarget profit share is the only change that has an expansionary effect whilereducing inflation.
Finally, consider the effects of changes in the bargaining strength parame-ters qw and qf . Remember that u0 = (v0 Ð m0)y(m1 + v1) is the value of thecapacity utilization rate when mf = mw , and pö = 0. It is useful to distinguishbetween a change in qw or qf when u* > u0, and a change in qw or qf whenu* < u0. We confine our attention to the first case. Not surprisingly, an increasein workersÕ bargaining power increases the inflation rate. Since the wage shareincreases, the utilization rate will also go up. However, an increase in qf has anegative impact on the capacity utilization rate, due to an increase in the profitshare, but an uncertain effect on the inflation rate. The positive impulse on theinflation rate resulting directly from the rise in qf may be offset by the nega-tive effect of the decreasing utilization rate.
To conclude this section, we can show that the multipliers differ under thetwo bargaining regimes. Consider for example:
[11.33]
The multiplier is higher when z2 < 0, that is, when workers are stronger. In thiscase, the resulting reduction in the share of profits, Ð2êz2êu*, implies largerincreases in the capacity utilization rate in any round of the multiplier process.The multiplier will be lower when the bargaining position of firms is stronger.
CONFLICTING-CLAIMS, INFLATION AND INTERNATIONAL COMPETITIVENESS
The aim of this section is to extend the model to an open economy with flex-ible exchange rates and competitive imports and exports. We will show that
¶¶
=- + -
u
b
k
s m z u kp( )( )* *d e2 2
¶¶ +
+D
-mv m
s uf
f w p01 10_ +if
q
q q d( )
( ) *
202 Kaleckian models of demand-led growth
pö
Downloaded from Elgar Online by University of Melbourne at 07/12/2013 04:18:01AM
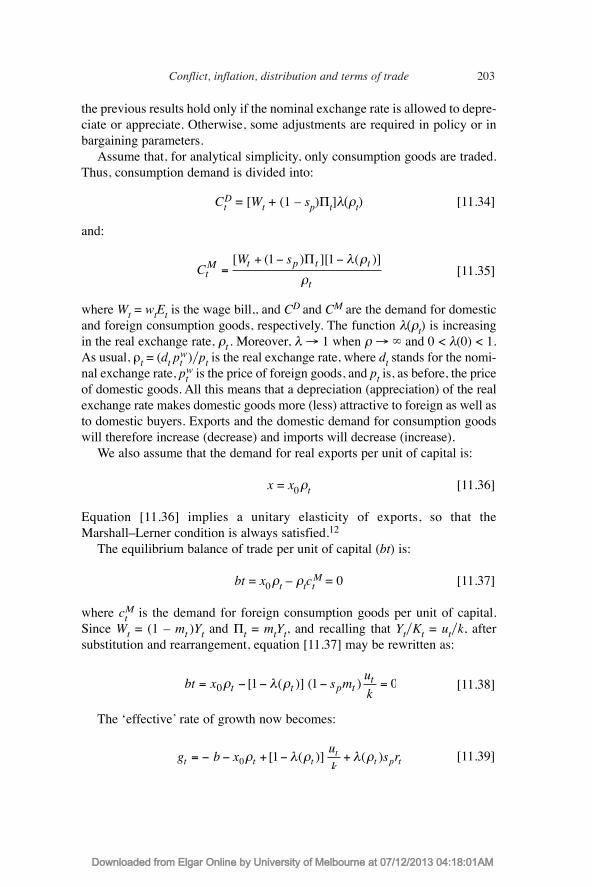
the previous results hold only if the nominal exchange rate is allowed to depre-ciate or appreciate. Otherwise, some adjustments are required in policy or inbargaining parameters.
Assume that, for analytical simplicity, only consumption goods are traded.Thus, consumption demand is divided into:
CtD = [Wt + (1 Ð sp)Pt]l(rt) [11.34]
and:
[11.35]
where Wt = wtEt is the wage bill,, and CD and CM are the demand for domesticand foreign consumption goods, respectively. The function l(rt) is increasingin the real exchange rate, rt . Moreover, l ® 1 when r ® ° and 0 < l(0) < 1.As usual, rt = (dt pt
w)ypt is the real exchange rate, where dt stands for the nomi-nal exchange rate, pt
w is the price of foreign goods, and pt is, as before, the priceof domestic goods. All this means that a depreciation (appreciation) of the realexchange rate makes domestic goods more (less) attractive to foreign as well asto domestic buyers. Exports and the domestic demand for consumption goodswill therefore increase (decrease) and imports will decrease (increase).
We also assume that the demand for real exports per unit of capital is:
x = x0rt [11.36]
Equation [11.36] implies a unitary elasticity of exports, so that theMarshallÐLerner condition is always satisfied.12
The equilibrium balance of trade per unit of capital (bt) is:
bt = x0rt Ð rtctM = 0 [11.37]
where ctM is the demand for foreign consumption goods per unit of capital.
Since Wt = (1 Ð mt )Yt and Pt = mtYt, and recalling that YtyKt = utyk, aftersubstitution and rearrangement, equation [11.37] may be rewritten as:
[11.38]
The ÔeffectiveÕ rate of growth now becomes:
[11.39]g b xu
ks rt t t
tt p t= - - + - +0 1r l r l r[ ( )] ( )
bt x s mu
kt t p tt= - - - =0 1 1 0r l r[ ( )] ( )
CW s
tM t p t t
t=
+ - -[ ( ) ][ ( )]1 1P l r
r
Conflict, inflation, distribution and terms of trade 203
Downloaded from Elgar Online by University of Melbourne at 07/12/2013 04:18:01AM

By substitution from [11.38], equation [11.39] reduces to equation [11.1]for the closed economy, whereas the function gt
d remains unchanged. Thuswhen bt = 0, we have the same solutions for u, g, m and r as in the closedmodel. Given these solutions, equation [11.38] determines r.
The dynamics of the model, after eliminating rt, are now represented by thefollowing three-equation system:
gùt = a{gd[u(gt , rt , mt ), rt] Ð g[u(gt , rt , mt), rt]}
= F1(gt , rt , mt ) a > 0
mù = (qw + qf )[z1 Ð mt + z2ut (gt , rt , mt)](1 Ð mt )
= F2 (gt , rt , mt) [11.40]
r ùt = b{cM[u(gt, rt , mt ), rt] Ð x(rt)}= F3 (gt , rt , mt) b > 0
In order to analyse local stability, consider the Jacobian matrix, J, of thefunctions Fi of the system [11.40], linearized in the neighbourhood of the equi-librium solution. A necessary stability condition is that the trace of J is nega-tive. It can be shown that the following condition:
[l(rt )sp Ð d](z1 + 2z2u*) > ke Ð [1 Ð l(rt )] [11.41]
implies that both J11 and J22 are negative. This condition is more stringent thanthat in the closed economy model (see [11.29]), but coincides with this earliercondition when l(rt ) ® 1.
Finally, J33 is also negative because:
[11.42]
a condition which is always true. Thus, if [11.41] and [11.42] hold true,J11 + J22 + J33 < 0.
The central problem of the open Kaleckian model is that the equilibriuminflation rate, pö, that originates from the conflicting claims of workers andfirms, may differ from that prevailing in the rest of the world, pöw. Since, inequilibrium:
[11.43]rù
Ñ = pöw Ð pö + dö = 0r
x s mu
kp0 1 0+ -¶¶
>( )** l
r
204 Kaleckian models of demand-led growth
Downloaded from Elgar Online by University of Melbourne at 07/12/2013 04:18:01AM

the equilibrium inflation rate is compatible with foreign inflation only if thenominal exchange rate matches the gap between pö and pöw through steadydepreciation or appreciation. If this adjustment of the exchange rate is notpossible, it must be true that pö = pöw and dö = 0. But then, from equation [11.17],it follows that:
[11.44]
where uF* is the capacity utilization rate imposed by foreign price competition.
Thus, there exists a tension between uF* and the equilibrium rate of capac-
ity utilization in the domestic market, uD* . When uF
* < uD* , an adjustment must
take place, through a decrease in the budget deficit or through an attenuationof social groupsÕ income claims. This can be seen by recalling, from equation[11.19], that uF
* < uD* implies:
At this point, one choice is to depress aggregate demand to reduce mf andincrease mw through a contraction in economic activity. This option recalls theanti-inflationary policies of the 1980s, often interpreted as an attempt toweaken labour power.13 The other, less costly, way to reduce inflationary pres-sure involves a voluntary incomes policy that reduces the income targets ofboth firms and workers, and mitigates the indexation parameters qf and qw.
INSTABILITY PROBLEMS IN THE VERY LONG RUN
There are two problems, in the long run, with the model presented in this chap-ter. The first arises when the labour force grows at an exogenous rate, thesecond when the equilibrium capacity utilization rate differs from that desiredby entrepreneurs. Both problems can lead to instability.
We assumed earlier that labour in the capitalistic sector expands (orcontracts) according to this sectorÕs rate of expansion. Workers are recruitedfrom elsewhere to fill the gap between labour required and labour alreadyengaged in production. In the event that the growth of capitalistic productionis slow, employment outside the capitalistic sector prevents long-run overtunemployment. For this reason we consider v1 to be constant, subject onlyto exogenous changes. If, however, in the very long run, the labour forcegrows at a different rate than the capital stock, the equilibrium rate of growthg* is no longer a steady rate since it changes with the KyL ratio. To see this,
=+
- >q q
q qf w
f wf wm m( )
uh
hF*
=- 1
2
Conflict, inflation, distribution and terms of trade 205
pöw
pö pöw
Downloaded from Elgar Online by University of Melbourne at 07/12/2013 04:18:01AM

differentiate v1 with respect to a, K and L. Recalling that v1 = v¢1 (KykaL), andwriting aùya = l, we obtain:
In the very long period, the steady-state condition is g* = n + l, where n + lis HarrodÕs natural rate of growth. If g* > n + l, v1 increases causing anincrease in g*. If g* < n + l, v1 decreases and g* will fall further.
As regards the second problem mentioned above, the equilibrium capital-capacity ratio may not be judged satisfactory by entrepreneurs. They can try toadjust it by changing the term g in their investment function. Thus, the econ-omy will slip off the Harrodian knife-edge. Obviously, a symmetric unstableupward movement will take place when producers find themselves short ofcapital. Only when actual and normal rates of capacity utilization are equalwill firms be in a final steady-state equilibrium. This latter argument is basedon the notion of a unique desired (or normal) utilization rate which is inde-pendent, in the long period, from the process that generates u*, and g*.
The meaning of a normal rate of capacity utilization, as well as that of anormal rate of profit, is the subject of a debate between neo-Ricardians andneo-Marxian authors, on one side, and Kaleckian authors, on the other. As adiscussion on these methodological issues is beyond the purpose of the presentexposition, we refer the reader to Lavoie (1995) for an account of this debate,and especially to Lavoie (1996, 2002) where a solution to this problem, basedon hysteresis effects, is advanced.
CONCLUSION
The Kaleckian growth model developed in this chapter endogenizes the distri-bution of income. This combination of effective demand and conflict inflationtheories seems to be a natural completion of the post-Keynesian view of thedynamics of capitalism, that is, the simultaneous achievement of full employ-ment and low rates of inflation is not automatic.
All of the typical results of the standard Kaleckian model (the paradox ofthrift, the paradox of costs and the direct relationship between wages and accu-mulation) are confirmed, at least for the closed economy. However, economicgrowth may suffer from an inflationary bias. The larger is the aspiration gapbetween workers and firms, the greater this bias will be.
It has also been shown that, when international competition is introduced,countries which experience inflation rates higher than that of competitors areforced to adopt adjustment policies. Three alternative policies become relevant
vg n
1
= - - l
206 Kaleckian models of demand-led growth
vù1
Downloaded from Elgar Online by University of Melbourne at 07/12/2013 04:18:01AM

at this point. The first and the most painful is the implementation of contrac-tionary measures, since these create higher unemployment. The second is toallow continuous depreciation in order to maintain the competitiveness ofdomestic industries. The third policy, traditionally recommended by post-Keynesians, is to reform the institutions that give rise to the inflationary bias.This involves introducing a higher degree of cooperation into the system ofindustrial relations through voluntary income policies. According to well-established literature on the subject, the countries best equipped for this taskare those with highly centralized collective bargaining systems.
The distribution of income also depends on a number of non-economicfactors, such as demographic, institutional and historical factors. Taking theseinto account is a challenging task. The classical and post-Keynesian schemesof analysis, which do not reduce distribution to a mere technological issue,would seem to offer the most promising starting point for future research inthis direction.
ACKNOWLEDGEMENT
I would like to thank Marc Lavoie for his helpful comments. Errors and omis-sions are, of course, solely my responsibility.
NOTES
1. The Kaleckian model has been discussed at length by Lavoie (see, for instance, Lavoie,1992, 1995, 2002). Previous insights into the Kaleckian model are found in Rowthorn (1977,1981).
2. In DuttÕs model, the long-run dynamics of capital accumulation are determined by thesavings function only, while in the present model, the equilibrium rates of growth and capac-ity utilization are determined simultaneously both by saving and investment decisions, onthe one hand, and by the conflicting claims of workers and firms on the other. In DuttÕs arti-cle, the two processes are separated: the former is modelled in the short run, and the latterin the long run. Moreover, Dutt assumes that the labour force grows through time at aconstant rate.
3. A version of this model that includes the effects of technical progress can be found inCassetti (2000).
4. This is the classical savings hypothesis. It is well known that workers savings do not alterthe conclusions of the model, as demonstrated in Cassetti (2000).
5. See Steindl (1952) and Kaldor (1957). This investment function has been fully discussed by,among others, Lavoie (1992, 1995). In equation [11.2], g assumes the meaning of a rate ofgrowth independent from profitability and capacity conditions. A discussion over possibleinterpretations of g, for instance as the expected trend of future sales, can be found in Lavoie(1995). For our purposes, g can assume positive or negative values, or even a value of zero,without compromising our results.
6. See Rowthorn (1977), Skott (1989, chapter 8), Dutt (1992) and Lavoie (1992, chapter 7).7. See Marglin (1984, pp. 349Ð50).8. Æ is the discriminant of the solutions for g*, m* and u*. In order to have real roots, Æ must
be non-negative.
Conflict, inflation, distribution and terms of trade 207
Downloaded from Elgar Online by University of Melbourne at 07/12/2013 04:18:01AM

9. The system represented by the equations [11.24] and [11.25] can be written as follows:
g×t = F1(gt , mt)
m×t = F2(gt, mt )
Let J be the Jacobian matrix of the functions obtained through expansion of the right-handside of this system in TaylorÕs series about the equilibrium solution. A necessary conditionfor local stability is that the trace of J must be negative. It can be demonstrated that condi-tion [11.29] implies that both J11 and J22 are negative, so that J11 + J22 < 0.
10. Along with all of the authors cited above, we use the terms ÔstagnationistÕ (or Ôundercon-sumptionistÕ) to characterize an economy in which the response of savings to income (here,total profits) is stronger than the response of investment to profitability (that is, sp > d). Inthis case, consumption necessarily dominates effective demand and a higher real wage leadsto higher aggregate demand as well as capacity utilization. In our model, as far as excesscapacity equilibria are concerned, it leads also to a higher rate of growth. In the oppositesituation, when sp > d, an exhilarationist regime obtains, where investment plays the domi-nant role in expanding aggregate demand. That is, a reduction in consumption due to a lowerreal wage is more than offset by the increase in investment. On this point, see Bhaduri andMarglin (1990).
11. Expressions for the effects of all possible shifts in the parameters of the model can be foundin Cassetti (2000, Appendices A and B).
12. As also noted by Blecker (2000, this volume), the assumption that changes in relative priceshave an important effect on international trade flows in Kaleckian open-economy modelscontrasts with the assumption made about their unimportance in balance-of-payments-constrained growth models of demand-led growth. See, for example, the papers by Atesogluand McCombie and Roberts in this volume.
13. See, for instance, Cornwall (1989).
APPENDIX 11.A
The dynamic behaviour of the stagnationist model is shown in the (g, m) plane inFigures A.11.3 and A.11.4. Figure A.11.3(a) shows the FS case, with sp > d andb + g > 0. Point A is a locally stable equilibrium. Point C is an unstable, full capacity
208 Kaleckian models of demand-led growth
Figure A.11.3 The stagnationist case: one stable excess capacity equilibrium
g
m
Agút = 0
mú t = 0 u = 1C
(a) FirmsÕ strength
Downloaded from Elgar Online by University of Melbourne at 07/12/2013 04:18:01AM

equilibrium. In Figure A.11.3(b) we have the WS case with sp > d , and b + g > 0. Again,we have a stable equilibrium point at A and an unstable, full capacity equilibrium C.
In Figure A.11.4(a) we illustrate the GFS case with sp > d and b + g < 0. Here, pointsA and B are excess capacity equilibria: A is locally stable, B is unstable. C is a locallystable full capacity equilibrium. Figure A.11.4(b) shows the GWS case with sp > d and
Conflict, inflation, distribution and terms of trade 209
g
m
gú t = 0
mú t = 0
u = 1C
(b) WorkersÕ strength
A
Figure A.11.3 (continued)
Figure A.11.4 The stagnationist case: multiple equilibria
g
m
B
gú t = 0 mú t = 0u = 1
C
g
m
gút = 0
mú t = 0
u = 1
(a) Great firmsÕ strength
(b) Great workersÕ strength
A
A
BC
Downloaded from Elgar Online by University of Melbourne at 07/12/2013 04:18:01AM

b + g > 0. Again, there are three equilibrium points. A (which is locally stable) and B(which is unstable) are excess capacity equilibria. Finally, C is a stable, full capacityequilibrium.
REFERENCES
Bhaduri A. and S. Marglin (1990) ÔUnemployment and the real wage: the economic basisfor contesting political ideologies,Õ Cambridge Journal of Economics, 14, 375Ð93.
Cassetti, M. (2000) ÔEndogenizing the conflict over income distribution in theKaleckian model,Õ Dipartimento di Scienze Economiche, Universit� di Brescia,Discussion Paper no. 0002.
Cornwall, J. (1989) ÔInflation as a cause of economic stagnation: a dual model,Õ in J.A.Kregel (ed.) Inflation and Income Distribution in Capitalist Crisis: Essays inMemory of Sidney Weintraub, New York, New York University Press, 99Ð122.
Del Monte, A. (1975) ÔGrado di monopolio e sviluppo economico,Õ RivistaInternazionale di Scienze Sociali, 83, 231Ð63.
Dutt, A.K. (1984) ÔStagnation, income distribution and monopoly power,Õ CambridgeJournal of Economics, 8, 25Ð40.
Dutt, A.K. (1990) Growth, Distribution, and Uneven Development, Cambridge,Cambridge University Press.
Dutt, A.K. (1992) ÔConflict inflation, distribution, cyclical accumulation and crises,ÕEuropean Journal of Political Economy, 8, 579Ð97.
Kaldor, N. (1957) ÔA model of economic growth,Õ Economic Journal, 67, 591Ð624.Kaldor, N. (1961) ÔCapital accumulation and economic growth,Õ in F.A. Lutz and D.C.
Hague (eds) The Theory of Capital, New York, St. MartinÕs Press, 177Ð228.Kalecki, M. (1943) ÔPolitical aspects of full employment,Õ Political Quarterly, 4,
322Ð31.Kalecki, M. (1971) Selected Essays in the Dynamics of the Capitalist Economy,
Cambridge, Cambridge University Press.Lavoie, M. (1992) Foundations of Post-Keynesian Economic Analysis, Aldershot,
Edward Elgar.Lavoie, M. (1995) ÔThe Kaleckian model of growth and distribution and its neo-
Ricardian and neo-Marxian critiques,Õ Cambridge Journal of Economics, 19,789Ð818.
Lavoie, M. (1996) ÔTraverse, hysteresis, and normal rates of capacity utilization inKaleckian models of growth and distribution,Õ Review of Radical PoliticalEconomics, 28, 113Ð47.
Lavoie, M. (2002) ÔThe Kaleckian growth model with target return pricing and conflictinflation,Õ this volume.
Marglin, S. (1984) Growth, Distribution and Prices, Cambridge, MA, HarvardUniversity Press.
Robinson, J. (1962) Essays in the Theory of Economic Growth, London, MacmillanRowthorn, R.E. (1977) ÔConflict, inflation and money,Õ Cambridge Journal of
Economics, 1, 215Ð39.Rowthorn, R.E. (1981) ÔDemand, real wages and economic growth,Õ Thames Papers in
Political Economy, Autumn, 1Ð39.Sarantis, N. (1990Ð1) ÔDistribution and terms of trade dynamics, inflation and growth,Õ
Journal of Post-Keynesian Economics, 13, 175Ð98.
210 Kaleckian models of demand-led growth
Downloaded from Elgar Online by University of Melbourne at 07/12/2013 04:18:01AM

Skott, P. (1989) Conflict and Effective Demand in Economic Growth, Cambridge,Cambridge University Press.
Steindl, J. (1952) Maturity and Stagnation in American Capitalism, Oxford, BasilBlackwell.
Taylor, L. (1985) ÔA stagnationist model of economic growth,Õ Cambridge Journal ofEconomics, 9, 383Ð403.
Conflict, inflation, distribution and terms of trade 211
Downloaded from Elgar Online by University of Melbourne at 07/12/2013 04:18:01AM

Downloaded from Elgar Online by University of Melbourne at 07/12/2013 04:18:01AM

12. A model of Kaldorian traverse: cumulative causation, structuralchange and evolutionary hysteresis
Mark Setterfield
INTRODUCTION
In his celebrated critique of equilibrium economics,1 Nicholas Kaldor arguedthat history rather than equilibrium should be the central organizing concepton which economic analysis is based. This methodological contributionemerged in the context of KaldorÕs rethinking of the economics of long-rungrowth. Kaldor favoured the VeblenÐMyrdal notion of cumulative causation asa vehicle for analysing growth, not least because it eschewed the conventionalnotion of equilibrium as a strong attractor defined and reached independentlyof the path taken towards it. Instead, models of cumulative causation providea recursive analysis of growth as a self-reinforcing process, indelibly influ-enced by its own past history.
However, not all commentators have shared KaldorÕs enthusiasm foranalysing growth in terms of cumulative causation. If growth is inherentlyself-reinforcing, then this suggests that once Ôinitial conditionsÕ are specified,and in the absence of unexplained shocks, so is the subsequent growth trajec-tory of the economy.2 As Hargreaves Heap (1989, p. 142) argues, cumulativecausation is, at its core, a model of historical continuity, not one of historicalchange. On this basis, Gordon (1991) has argued that models of cumulativecausation display Ôtoo much cumulationÕ in order for them to successfullyexplain the comparative historical growth record of capitalist economies Ðdespite the conclusion of authors such as Amable (1993) that cumulative anddivergent forces are of the greatest general relevance for the description ofrealized growth outcomes over the post-war period.
Building on Setterfield (1997a, 1997b), the purpose of this chapter is tocarry forward the spirit of KaldorÕs growth analysis and attendant methodolog-ical emphasis on history. Importance is attached to the presence of self-rein-forcing, cumulative processes in macrodynamics, but the problem, inherent inmodels of cumulative causation, of there being Ôtoo much cumulationÕ, is
215
Downloaded from Elgar Online by University of Melbourne at 07/12/2013 04:24:19AM

avoided. This is achieved by retaining rather than dispensing with the notion ofequilibrium, and therefore allowing for the existence of point attractors orÔcentres of gravityÕ in the economy.3 Furthermore, KaldorÕs cumulative growthschema, central to which is a positive feedback from output growth to produc-tivity growth, is treated as only one source of path dependency in the growthprocess; others, including sources of negative feedback from output growth toproductivity growth, are also postulated.4 What emerges from all this is ulti-mately an exercise in traverse analysis: specifically, a model of Kaldoriantraverse. The spirit (if not the letter) of KaldorÕs cumulative growth schemaemerges as the predominant influence on growth in the medium run, but thiscumulative causation is couched in the context of growth ÔregimesÕ which may,themselves, be influenced by an economyÕs past growth trajectory. This resultsin a model in which medium-term growth Ð itself described as ÔweaklyÕ pathdependent Ð affects the centre of gravity towards which the economy is tending,thus redefining the conditions and position of this centre of gravity and hencethe economyÕs subsequent medium-term growth trajectory, and so on. Growth isthus characterized as a process of traverse towards path dependent, provisionalequilibria in what is ultimately described as a model of evolutionary hysteresis.5
It is argued that evolutionary hysteresis provides a better approximation ofhistorical process than either equilibrium or cumulative causation, and thusprovides a more satisfactory basis for modelling Kaldorian dynamics.
The remainder of the chapter is organized as follows. The next sectiondiscusses the potential of traverse analysis as a general method for all macro-dynamic analysis. In the third section, a model of Kaldorian traverse isconstructed, in which cumulative causation is ÔnestedÕ within an encompass-ing, evolutionary hysteretic vision of growth. The methodological significanceof this analysis for Kaldorian macrodynamics is next discussed, while the finalsection offers some conclusions.
THE TRAVERSE AND MACRODYNAMIC ANALYSIS
As originally conceived by Hicks (1965), the traverse describes the passageof an economy between two steady states. More generally, following Henryand Lavoie (1997, p. 158) and Kriesler (1999, pp. 401Ð2), the traverse can bedefined as the transition of an economic system between any two states,regardless of whether or not either of these states are equilibria. Traverseanalyses usually take initial conditions as given, conjecture the end state ofthe traverse and are then concerned with the question as to how (if at all) it ispossible to get ÔthereÕ from ÔhereÕ Ð that is, whether or not it is possible forthe economy to effect the conjectured transition between beginning and endstates, and if so, how. It is important to realize that this transition may not be
216 Traverse analysis and demand-led growth
Downloaded from Elgar Online by University of Melbourne at 07/12/2013 04:24:19AM

possible at all Ð much depends on the precise sequence of adjustments that theeconomy must undertake over time in order to complete the conjectured trans-formation between states. What this means, of course, is that the economyÕsrealized traverse path may lead it elsewhere, towards an ÔendÕ or ÔfinalÕ state(to the extent that such end or final states exist in any but the arbitrary senseof their being attained by some specific date in calendar time) that differs fromthe end state originally conjectured. In this sense, there is a distinct affinitybetween traverse analysis and the Robinsonian notion of historical time, inwhich events take place in a unidirectional sequence such that activities in thepresent are shaped and constrained by those undertaken in a given andimmutable past, and will in turn shape and constrain behaviour in the future(Halevi and Kriesler, 1992, p. 225; Henry and Lavoie, 1997, p. 157; Kriesler,1999, p. 402).6
According to Kriesler (1999, p. 401), Ôthe traverse is at the same time oneof the most important concepts in economic theory, and also one of the mostneglectedÕ. It has failed to find its way into economics textbooks that areotherwise laden with Hicksian concepts and contributions (Henry and Lavoie,1995, p. 157). Meanwhile, BlissÕs (1987, p. 645) biography of Hicksdismisses Capital and Growth, in which Hicks first introduced the concept ofthe traverse, as being uninfluential because Ô. . . equilibrium theory and itssister economic dynamics had moved on a great deal since Value and Capital[and] Hicks . . . was no longer talking a language that most economic theo-rists found congenialÕ. And yet, any idiosyncracies of HicksÕs originaltraverse analysis aside, no amount of Ômoving onÕ can be allowed to obscurethe central importance of the principle of the traverse for economic analysisÐ no matter how ÔuncongenialÕ economic theorists might find the issues thatit raises. As Setterfield (1997a, chapter 2) argues, no economic analysis cancompletely escape the need to consider the sequential adjustment processesthat are the essence of traverse analysis. First, even if equilibria defined inde-pendently of the adjustment path taken towards them exist, it is necessary toaccount for how the economy might Ôget intoÕ these equilibria Ð if, indeed, itcan Ð if they are to serve as useful descriptions of the realized configurationsof the economy.7 Second, consideration of adjustment processes raises thespectre of path dependence. Even equilibria that act as ÔattractorsÕ or Ôcentresof gravityÕ may be such that their conditions and hence positions are prone torevision in response to the sequential adjustments taken towards them. Assuch, rather than being an anachronism, the general notion of the traverse is(or should be) central to economic analysis, the subject matter of which isalways ultimately concerned with adjustments through time. A central featureof this chapter, then, is that it takes the traverse seriously, positing the rele-vance of traverse analysis as a general methodology for all dynamiceconomic analysis.
A model of Kaldorian traverse 217
Downloaded from Elgar Online by University of Melbourne at 07/12/2013 04:24:19AM

A MODEL OF KALDORIAN TRAVERSE
A Stylized Model of Cumulative Causation
Following the work of Dixon and Thirlwall (1975) and McCombie andThirlwall (1994), we begin by characterizing KaldorÕs cumulative growthschema in terms of the following structural equations:
qjt = r + ajt yjtÐ1, ajt > 0 [12.1]
pjt = wjt Ð qjt [12.2]
xjt = b(pwt Ð pjt ) + gyw t , b, g > 0 [12.3]
yjt = lxjt , l > 0 [12.4]
where for any region j, q is the rate of productivity growth, r denotes exoge-nous influences on q, y is the rate of growth of output, p and w are the rates ofprice and wage inflation, respectively, and x is the rate of growth of exports.The variables pw and yw denote, respectively, price inflation and growth in theÔrest of the worldÕ, and t-subscripts denote time periods.8
Equations [12.1]Ð[12.4] capture the joint interaction between demand andsupply that is typical of KaldorÕs growth schema. Beginning with equation[12.1], output growth in the previous period impacts current productivitygrowth through the realization of dynamic increasing returns (the VerdoornLaw). Productivity growth then affects inflation, thanks to its negative impacton the growth of unit labour costs (equation [12.2]). These supply-side devel-opments then impact the growth of aggregate demand in equation [12.3], inwhich export growth responds positively to any increase in the differencebetween foreign and domestic inflation. Finally, the rate of growth of demandis described as the proximate source of output growth in equation [12.4].Hence the demand side will subsequently feed back to influence the supplyside as demand and hence output growth (equation [12.4]) influence futureproductivity growth via the Verdoorn Law (equation [12.1]). The recursiveinteraction of these structural equations, in which productivity growth anddemand-led output growth are mutually self-reinforcing, is the essence ofKaldorÕs cumulative growth schema.
In order to emphasize the self-reinforcing nature of growth outcomes in themodel described above, we can substitute equations [12.3], [12.2] and then[12.1] into equation [12.4] to arrive at:
yjt = ajtlbyjtÐ1 + lb(pwt Ð wjt + r) + lgywt [12.5]
218 Traverse analysis and demand-led growth
Downloaded from Elgar Online by University of Melbourne at 07/12/2013 04:24:19AM
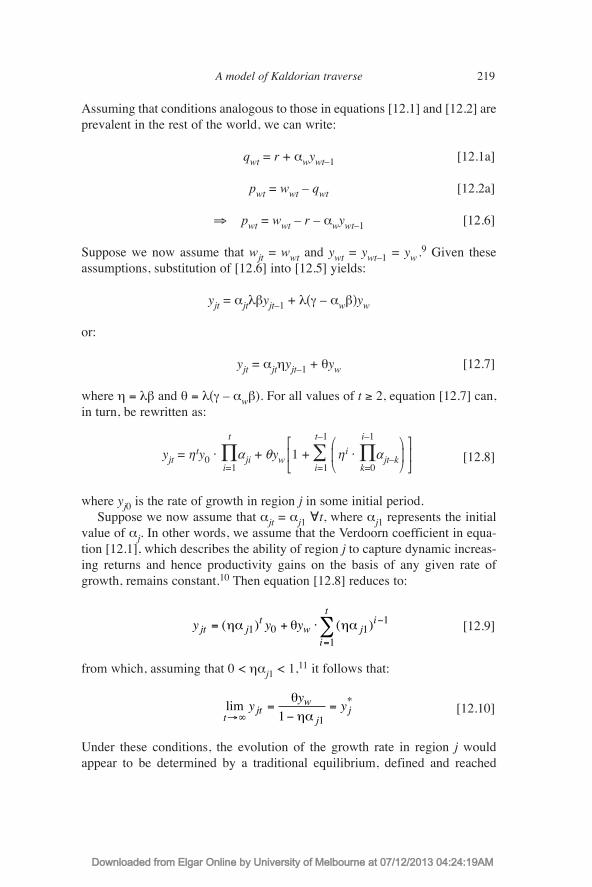
Assuming that conditions analogous to those in equations [12.1] and [12.2] areprevalent in the rest of the world, we can write:
qwt = r + awywtÐ1 [12.1a]
pwt = wwt Ð qwt [12.2a]
Þ pwt = wwt Ð r Ð awywtÐ1 [12.6]
Suppose we now assume that wjt = wwt and ywt = ywtÐ1 = yw .9 Given theseassumptions, substitution of [12.6] into [12.5] yields:
yjt = ajtlbyjtÐ1 + l(g Ð awb)yw
or:
yjt = ajthyjtÐ1 + qyw [12.7]
where h = lb and q = l(g Ð awb). For all values of t ³ 2, equation [12.7] can,in turn, be rewritten as:
[12.8]
where yj0 is the rate of growth in region j in some initial period.Suppose we now assume that ajt = aj1 "t, where aj1 represents the initial
value of aj. In other words, we assume that the Verdoorn coefficient in equa-tion [12.1], which describes the ability of region j to capture dynamic increas-ing returns and hence productivity gains on the basis of any given rate ofgrowth, remains constant.10 Then equation [12.8] reduces to:
[12.9]
from which, assuming that 0 < haj1 < 1,11 it follows that:
[12.10]
Under these conditions, the evolution of the growth rate in region j wouldappear to be determined by a traditional equilibrium, defined and reached
lim *
tjt
w
jjy
yy
®¥=
-=
qha1 1
y y yjt jt
w ji
i
t
= + × -
=å( ) ( )ha q ha1 0 1
1
1
t é tÐ1 æ iÐ1 ö ùyjt = hty0 á ¸aji + qyw ê1 + · ç hi á ¸ajtÐk÷ ú
i=1 ë i=1 è k=0 ø û
A model of Kaldorian traverse 219
Downloaded from Elgar Online by University of Melbourne at 07/12/2013 04:24:19AM

without reference to the path taken towards it. In some respects, this is a veryun-Kaldorian result. In his descriptions of cumulative causation (see, forexample, Kaldor, 1985, pp. 61Ð3), Kaldor emphasizes the lasting influence ofinitial growth outcomes on long-run growth rates in a system that does notgravitate towards an equilibrium defined independently of these initial condi-tions.12 At this point, however, we can begin to introduce the first vestiges oftraverse analysis in order to reconcile the model developed thus far with theprinciple of cumulative causation as described by Kaldor. According to thebasic principles of traverse analysis, unless we begin from an initial positionof equilibrium (yj0 = yj
*), it is necessary to contemplate whether or not thelatter can, in fact, be reached. Note, for example, that even if 0 < haj1 < 1 sothat the equilibrium in [12.10] exists and is (in principle) stable, it will not bepossible to Ôget intoÕ this equilibrium if the speed of adjustment towards it isslow, relative to the speed at which the ÔdataÕ defining the equilibrium are,themselves, changing over time (Harcourt, 1981, p. 218; Fisher, 1983, p. 3;Cornwall, 1991, p. 107; Halevi and Kriesler, 1992, p. 229).
What all this means is that in the model developed above, there may existan equilibrium such as that in [12.10] which influences the dynamics of themodel (and hence the evolution of the growth rate) in its capacity as a pointattractor. But this equilibrium need never be relevant as a description of theactual growth rate prevailing in the economy at any point in time. Instead, forany era during which the ÔdataÕ defining the expression in [12.10] are, indeed,constant, the actual rate of growth in any period t will be described by equa-tion [12.9], in which initial conditions have precisely the self-reinforcingimpact on subsequent growth outcomes accorded to them by Kaldor.13 Wethus have a model of ÔweakÕ path-dependent growth, in which initial condi-tions, but no other feature of the economyÕs growth trajectory, influence subse-quent growth outcomes in a purely self-reinforcing manner.14 Thisdemonstrates that a disequilibrium or traverse interpretation of theDixonÐThirlwall model captures the spirit of KaldorÕs cumulative growthschema Ð by restoring initial conditions to their role as a self-reinforcing deter-minant of subsequent growth outcomes Ð if not the letter of this schema (sincethe model does allow for the existence of a growth equilibrium defined inde-pendently of initial conditions, and for this equilibrium to impact on the evolu-tion of realized growth outcomes in its capacity as an attractor).
Technical Progress and Growth: Positive and Negative Feedbacks
In the previous section, in order to justify a disequilibrium or traverse inter-pretation of the DixonÐThirlwall model as an approximation of KaldorÕscumulative growth schema, we alluded to the notion that the ÔdataÕ definingthe position of an equilibrium need not be immutable, and that structural
220 Traverse analysis and demand-led growth
Downloaded from Elgar Online by University of Melbourne at 07/12/2013 04:24:19AM

changes in these conditions of equilibrium may accompany disequilibriumgrowth. We now turn to consider this possibility more explicitly, in an effortto show how and to what effect such structural change may, in fact, be endemicto the growth process.
The traverse path described in equation [12.9] may be accompanied byvarious, qualitatively different, types of structural change. One example isinstitutional change Ð that is, changes in conventions, norms, rules, etc., andhence the internal structure of and relationships between the organizations andindividuals of which these institutions are constituent parts. Other examplesinclude technological change and changes in the composition of demand andhence output. Of these sources of structural change, one Ð technologicalchange Ð is already an important feature of the model developed in the previ-ous section. Equation [12.1], the Verdoorn law, models productivity growth asan increasing function of past output growth, on the basis that the latterinduces technological progress. This arises through such channels as learning-by-doing and, given that firms face indivisibilities in the capital stock andassuming that they are demand-constrained and form expectations of futuremarket expansion that are influenced by past realized growth, the adoption ofmore capital-intensive techniques of production.15
However, while the Verdoorn law as described thus far embodies importantsources of positive feedback from output growth to technological progress, itmay be useful to think of this law itself as being subject to growth-inducedstructural change. Recall that ajt Ð the Verdoorn coefficient Ð measures theability of an economy to realize productivity gains on the basis of any givenrate of growth. It may be the case that ajt itself is the subject of feedbackeffects in the course of growth. This would cause the Verdoorn law to experi-ence structural change over time, giving rise to a discrete succession of histor-ically contingent Ôproductivity regimesÕ which condition and, in turn, areconditioned by, the growth rate.16 For example, as growth yields an ever-largersurplus over subsistence needs and ever-increasing specialization in theprocess of production, so processes associated with learning may becomemore formally organized, thus raising the value of ajt. This would provideanother example of positive feedback from output growth to productivitygrowth, operating this time, however, not through a given productivity regime,but through the transformation of the productivity regime itself.
Such positive feedback would, of course, only serve to enhance the cumula-tive growth dynamics already inherent in KaldorÕs growth schema. However,the productivity regime may also be subject to negative feedback: faster growthin the past may ultimately impair the ability of a region to realize induced tech-nological progress. One way in which this can occur is if fast growth causes aregion to become Ôlocked-inÕ to a particular technological base that becomesdifficult to transform in the pursuit of subsequent technological progress.
A model of Kaldorian traverse 221
Downloaded from Elgar Online by University of Melbourne at 07/12/2013 04:24:19AM

Lock-in occurs when a system gets stuck in a ÔrutÕ or ÔgrooveÕ from whichit is subsequently difficult to deviate, even if change is, in principle, demon-strably desirable (see, for example, Arthur, 1994). This can happen if theextent to which an activity (such as accumulating specific types of fixed capi-tal) has been practised in the past makes it difficult to change behaviour in thepresent, by virtue of the prohibitive costs associated with change and/or diffi-culties associated with coordinating change in an environment of decentral-ized decision making. In the case of embodied technological progress, suchdependence of current decisions on those made in the past can arise becauseof interrelatedness Ð interconnections between components of the productionprocess (including plant, equipment, human capital and organizational struc-tures) that proliferate as the scale of economic activity increases (Frankel,1955).17 Interrelatedness demands that capital accumulated in the presentconform to technical and social standards inherited from the past, unless moreradical (non-marginal) changes in the production process are to be contem-plated.18 Lock-in results if interrelatedness has advanced to such a degree thatthese non-marginal changes appear infeasible, with the result that technologi-cal progress is inhibited.
The problems of interrelatedness and lock-in suggest a potential source ofnegative feedback from output growth to a regionÕs productivity regime thatwould effect structural change in the model developed earlier. This, in turn,would alter the conditions and hence position of the regionÕs growth equilib-rium (and hence the subsequent evolution of its growth rate) Ð all as a resultof the regionÕs having previously followed a particular traverse path towardsits former equilibrium position. To see this, consider the example of a regionthat has experienced a virtuous circle of self-reinforcing high growth. In equa-tion [12.9], this would be represented by a ÔhighÕ initial rate of growth(yj0 > yj
* = yw) fostering ÔhighÕ growth rates in all subsequent periods(yjt > yj
* = yw "t > 0, ceteris paribus).19 Now it is self-evident that:
Yjt = Y(Yj0; yj1, . . ., yjt), Y ¢Y , Y ¢y > 0 [12.11]
where Y denotes the level of output. In view of what has just been said aboutinterrelatedness and lock-in, however, equation [12.11] may be of some signif-icance for a virtuous circle region. This is because it follows from [12.11] thatas the result of a virtuous circle, Yjn in any period t = n will be higher than itwould otherwise have been in the absence of a virtuous circle (that is, had weobserved yj0 £ yj
*). Furthermore, following Frankel (1955), we have:
ijt = i(Yjt), i¢ > 0 [12.12]
where i denotes the level of interrelatedness. We can also write:
222 Traverse analysis and demand-led growth
Downloaded from Elgar Online by University of Melbourne at 07/12/2013 04:24:19AM

kjt = k(ijt), k¢ > 0 [12.13]
where k denotes the costs Ð including direct costs of scrapping and removal,and indirect costs associated with the writing-down or writing-off of exist-ing assets Ð associated solely with the act of changing components of theproduction process. Now consider a single regional decision maker contem-plating investment in a new component that embodies technologicalprogress when compared to similar components of an earlier vintage.Suppose that:
[12.14]
where R represents revenues, C total costs, p denotes profit flows, T is thedecision makerÕs time horizon and r its rate of time preference, and A and Bdenote, respectively, the new component of the production process and the oldcomponent that it is designed to replace. Considered in isolation, then, the newcomponent is unambiguously more profitable.20 However, the spectre of inter-relatedness means that other changes to the production process may berequired in order to accommodate the new component, which thus begs thequestion as to whether:
pA Ð kjn _ pB [12.15]
Suppose, in fact, that Yjn ³ YjL, so that inj ³ ijL and hence kjn ³ kjL, where kjLis the minimum value of kj necessary to satisfy the inequality:
pA Ð kjn < pB [12.16]
If, by period n, region jÕs virtuous circle of growth has raised its level of devel-opment to the point where Yjn ³ YjL, then the flow of induced technologicalprogress on which this virtuous circle is based will be adversely affected. Byvirtue of the proliferation of interrelatedness, the inequality in [12.16] suggeststhat region j will be locked-in to the inferior technology inherent in componentB by virtue of it being prohibitively costly to make the variety of changeswithin an interrelated production process necessary to accommodate compo-nent A. This impact of interrelatedness and lock-in on the productivity regimeof region j can be captured by the expression:
[12.17]a a kfa k k k
ajt jtjt jt jL jt
jt= =
³ >ìíï
îï
- -
-( )
1 1
1
if
otherwise
p pA Ai Aii
Bi Bii n
n T
i n
n T
BR C r R C r= - × + > - × + =-
=
+
=
+-åå ( ) ( ) ( ) ( )1 1 1
A model of Kaldorian traverse 223
Downloaded from Elgar Online by University of Melbourne at 07/12/2013 04:24:19AM

where 0 < f < 1 is a constant that captures the impairment of region jÕs abilityto realize induced technological progress brought about by lock-in. In the situ-ation that we are contemplating, equation [12.17] implies that:21
The discontinuous adjustments in the Verdoorn coefficient, aj, described heremirror the discontinuous impact of interrelatedness on the productivity regimeof region j, which turns on the threshold or boundary condition captured bykjL.
All that now remains is to spell out the implications of the change inproductivity regime modelled above for the evolution of the growth rate inregion j. Recall that, in general, the evolution of the growth rate is given by:
[12.8]
Given the solution to [12.17] described above, for all t ³ n, equation [12.8] canbe evaluated as:
or:
[12.18]
Furthermore, note that it follows from [12.18] that:
[12.19]
Comparison of equations [12.18] and [12.19] with equations [12.9] and[12.10] (which describe the benchmark case where ajt = aj1 "t) reveals how
lim**
t jtw
jj
yy
y®¥
=-
=qhfa1 1
yjt = ftÐn+1(haj1)t á yj0
é t nÐ1 ù+qyw á ê · (hfaj1)tÐi + ftÐn+1 á ·(haj1)k+(tÐn+1)ú
ë i=nÐ1 k=1 û
yjt = htaj1nÐ1(faj1)tÐn+1 á yj0
é t nÐ1 ù+qyw á ê · (hfaj1)tÐi + (hfaj1)tÐn+1 á ·(haj1)kú
ë i=nÐ1 k=1 û
t é tÐ1 æ iÐ1 ö ùyjt = hty0 á ¸aji + qyw ê1 + · ç hi á ¸ajtÐk÷ ú
i=1 ë i=1 è k=0 ø û
a fajt j t n= " ³1
a ajt j
t n= " = ¼ -1
1 1 , ,
224 Traverse analysis and demand-led growth
Downloaded from Elgar Online by University of Melbourne at 07/12/2013 04:24:19AM

the evolution of the growth rate and the position of the equilibrium implicit inthe model are affected by the change in region jÕs productivity regime that ispostulated to have arisen as a consequence of its prior virtuous circle.Specifically, since 0 < f < 1 by hypothesis, it is clear on inspection that thelock-in induced decay in region jÕs productivity regime adversely affects theregionÕs medium-and long-run growth rates. Indeed, region jÕs declininggrowth fortunes will also have an important qualitative impact on its relativegrowth performance. Recall that region j was initially identified as experienc-ing a virtuous circle of growth, because yj0 > yj
* = yw. Other things being equal,this implied yjt > yw for all finite values of t. However, the structural changesin region jÕs productivity regime described above mean that the limit value ofthe regionÕs growth rate is now given by yj
** < yj* = yw. In its capacity as an
attractor, and in the absence of further, growth-enhancing, structural changesinduced by the traverse towards this attractor in the intervening period, yj
**
will eventually draw the value of yt below yj* = yw in some period n + s.22 As
a result, region j will find itself transformed from a growth leader into agrowth laggard, its original virtuous circle of relatively high growth nowreplaced with a vicious circle of self-reinforcing slow growth(yjt < yw "t ³ n + s). Note, then, that the model developed here solves the Ôtoomuch cumulationÕ problem associated with KaldorÕs growth schema, as iden-tified earlier. It retains the essential self-reinforcing components of thisschema, but places them in the context of structural ÔregimesÕ that are them-selves endogenous to a regionÕs past growth history. This allows for the possi-bility that a period of self-reinforcing fast or slow growth may inducestructural change in the regime within which it is contextualized, thus alteringa regionÕs relative growth performance.
METHODOLOGICAL CONSIDERATIONS
As emphasized above, the central result of the model developed in this chapteris that a virtuous circle of self-reinforcing growth need not be indefinitely self-perpetuating. As such, the model avoids the Ôtoo much cumulationÕ problemassociated with KaldorÕs original growth schema without eschewing KaldorÕscentral insights regarding positive feedback and cumulative causation in thegrowth process. What remains is for us to emphasize the methodologicalaspects of this exercise and their lessons for Kaldorian macrodynamic analysis.
On the Role of the Traverse in Macrodynamic Analysis
Kriesler (1999, pp. 402Ð4) identifies three approaches to the role of thetraverse in economics, two of which suggest that the traverse matters. First, he
A model of Kaldorian traverse 225
Downloaded from Elgar Online by University of Melbourne at 07/12/2013 04:24:19AM

identifies a Ôlife is a traverseÕ approach in the works of Kalecki, Robinson andLowe. According to this view, the economy is never in equilibrium and doesnot Ôtend towardsÕ equilibrium Ð so that dynamic analysis without reference toequilibrium is of the Ôutmost analytical valueÕ (p. 403). This position isreflected in KaleckiÕs claim that Ôthe long-run trend is but a slowly changingcomponent of a chain of short-period situations; it has no independent iden-tityÕ (Kalecki, 1971, p. 165). The fact that the long-run trend (read Ôequilib-riumÕ) has no identity independent of the series of short-run outcomes ofwhich it is ultimately just an average means that it (long-run equilibrium) isnot something Ôout thereÕ, acting as a centre of gravity towards which theeconomy inexorably ÔtendsÕ. Nor is it a state that the economy can everusefully be described as having Ôgot intoÕ. In this situation, non-equilibriumanalysis is all that remains.
Kriesler contrasts this Ôlife is a traverseÕ approach with an Ôequilibrium andtraverseÕ position, in which the concept of equilibrium is retained, but the needto study the path towards equilibrium is taken seriously. This approachincludes models of hysteresis in which the path towards equilibrium affects theconditions and hence position of equilibrium, so that the final equilibriumachieved is path dependent. A wide range of models fit into this category,including non-taö tonnement general equilibrium models (Fisher, 1983) andmodels that have a KaleckiÐRobinson pedigree (Lavoie, 1996).
At first sight, the model of Kaldorian traverse developed above seems to fitsquarely into the second of these approaches. A steady-state growth equilib-rium is postulated as existing at any point in time, and is accredited with therole of a weak attractor in the systemÕs dynamics.23
Further reflection reveals that this categorization may not be compelling,however. This is because the conditions necessary for the existence andstability of equilibrium in the model developed above are inessential. Theycan be dispensed with, and the model will continue to behave as describedearlier (periods of cumulative causation in the medium term being punctu-ated by structural changes, themselves induced by past growth outcomes, inthe long term), but without equilibrium existing or acting as a centre of grav-ity.24 What this draws to attention is that in the model of Kaldorian traverse,equilibrium is being used as a reference point or organizing concept Ð it isnot essential to the vision of macrodynamics that the model expounds.Instead, equilibrium plays a role similar to that of the point of effectivedemand in KeynesÕs General Theory (Kregel, 1976; Setterfield, 1997c).This, in turn, suggests that the distinction between the Ôlife is a traverseÕ andÔequilibrium and traverseÕ approaches to the role of the traverse, althoughuseful for taxonomic purposes, may not always involve the concretemethodological differences with respect to the role of equilibrium that itappears to.
226 Traverse analysis and demand-led growth
Downloaded from Elgar Online by University of Melbourne at 07/12/2013 04:24:19AM

From Cumulative Causation to Evolutionary Hysteresis
The model developed above suggests that Kaldorian analysis, in its pursuit ofa historical theory of growth, need not abandon the notion of equilibrium perse. Cumulative causation can be represented as a traverse path within a systemthat has a Ôcentre of gravityÕ acting as a weak attractor, and in which the traversepath itself affects the conditions and hence the position of this attractor.
Note that this latter property imbues the model with the property of strongpath dependence (involving structural change within a model in response to itsprior trajectory) or hysteresis.25 Furthermore, this hysteresis is ultimately bothendogenous and non-deterministic. It is properly conceived as non-determin-istic since lock-in is not inevitable. This is not so much because a region maynot reach the critical level of development YjL before being required to effectnon-marginal changes in the production process (although this is quite possi-ble), but because YjL itself is partly a product of factors such as decisionmakersÕ time horizons and rates of time preference, and hence ultimately thenature of entrepreneurship within a region.26 If entrepreneurial activity is bestconceived as an open rather than a foreclosed and determinate process, thenthe hysteretic change we are currently contemplating is necessarily non-deter-ministic. It will arise over time as an emergent property of the system Ð thatis, as an outcome that cannot be reduced to foreclosed explanation in terms ofthe more ÔprimitiveÕ causes that are purported to have brought it about.27 Thisis not a denial of cause and effect relationships in growth analysis. Instead,what it effectively means is that the same regional decision maker confrontedwith the same non-marginal change in the production process at the same levelof development Yn may not make uniform choices in a hypothetical series ofrepeated trials. This is ultimately an assertion that growth and development arenot closed, mechanical processes but rather open, social processes involvingcreative or effective choice Ð that is, an ability on the part of decision makersto always have acted differently.28
That hysteretic change in the model of Kaldorian traverse is also endogenousis obvious from the fact that the regimes within which cumulative causationoccurs are prone to either reinforcement or decay in response to positive and/ornegative feedbacks arising from the legacy of the growth outcomes associatedwith the process of cumulative causation itself. In other words, structural changeis modelled as an intrinsic feature of the very adjustments of the economicsystem through time, rather than being the product of extraneous shocks.
A process may be defined as evolutionary if it is characterized by endoge-nously generated structural change involving novelty.29 Given this definition,and in view of what has been said above, the model of Kaldorian traverse maybe described as displaying evolutionary hysteresis Ð that is, strong path depen-dence arising from endogenous but non-deterministic structural change.
A model of Kaldorian traverse 227
Downloaded from Elgar Online by University of Melbourne at 07/12/2013 04:24:19AM

In sum, the model developed in this chapter reinterprets KaldorÕs cumula-tive growth schema as a traverse path within a system that has a centre of grav-ity, while simultaneously extending traditional Kaldorian analysis byinterpreting this weak attractor (and hence, to an extent, the traverse pathitself) as the product of a growth ÔregimeÕ which is historically specific andmay be affected by the traverse path.30 Note that this extension resolves thetension identified earlier, between the model of Kaldorian traverse and theletter (as opposed to just the spirit) of KaldorÕs growth schema. This is becausethe attractor in the model is now, itself, a historical construct. It is not inde-pendent of the path that the economy takes towards it in the manner in whichit was first made to appear. What all this suggests is that in Kaldorian growthanalysis, importance ultimately attaches not to the non-existence of equilibria,but to the absence of the mechanical stability properties that are convention-ally associated with these equilibria. Kaldorians can thus appeal to the traversemethod, coupled with the notion of evolutionary hysteresis, in order to strikea middle ground between abandoning the concept of equilibrium (whichKaldorÕs (1972) claims about the Ôirrelevance of equilibrium economicsÕ mayappear, upon first sight, to demand) and acceptance of the economy as beingessentially ahistorical. Ultimately, it is traditional equilibrium or equilibristmethodology, which conceives economic outcomes as equilibria defined andreached independently of the path taken towards them, rather than the notionof equilibrium per se that Kaldorians and other researchers interested in thehistorical dynamics of capitalism must abandon.31 A central purpose of themodel developed in this chapter has been to suggest how macrodynamicanalysis can proceed in such non-equilibrist terms.
CONCLUSIONS
This chapter both reinterprets and extends Kaldorian growth analysis, castingKaldorÕs cumulative growth schema as a process of traverse towards a weakpoint attractor, the conditions and hence position of which can be altered bythe traverse path itself. What emerges is a model in which growth is subject toevolutionary hysteresis. Self-reinforcing growth outcomes, the product ofcumulative causation, are the norm in the medium term. But this self-rein-forcing growth can affect the very ÔregimeÕ of which it is, in part, a product,and which also defines the (unrealized) equilibrium of the system. An episodeof cumulative, non-equilibrium growth in the medium term can, therefore,affect the conditions and hence the position of the systemÕs equilibrium which,in its capacity as a weak attractor, will then draw the economy onto a newmedium-term growth path that may be both quantitatively and qualitativelydifferent from its predecessor. The economy is thus in a state of permanent
228 Traverse analysis and demand-led growth
Downloaded from Elgar Online by University of Melbourne at 07/12/2013 04:24:19AM

traverse towards provisional, path-dependent equilibria, its evolution charac-terized by a series of transitions between different growth regimes, each ofwhich supports a medium-term episode of cumulative causation manifestingitself (in comparative terms) as either a vicious or a virtuous circle.
The importance of this analysis is twofold. First, at a theoretical level, bynesting KaldorÕs cumulative growth schema as a subset of the feedbacks thatoccur in the course of growth, the evolutionary hysteretic growth schemadeveloped above permits an appreciation of the growth process as beinggenerally subject to self-reinforcing tendencies (which, as noted by studiessuch as Amable (1993), appears to be empirically appropriate), while simulta-neously avoiding the Ôtoo much cumulationÕ problem that authors such asGordon (1991) identify. Second, at a methodological level, the model devel-oped above reconciles the belief that growth and development are essentiallyhistorical processes (and that they should therefore be analysed as such) withthe concept of equilibrium. This is done by harnessing the dynamic propertiesof equilibrium as a point attractor, without conceiving the latter as a determi-nate outcome that is defined and reached independently of the path takentowards it. A central feature of this framework is its treatment of the traverseas a general property of economic life. This, coupled with the notion of evolu-tionary hysteresis, is suggestive of a general approach to macrodynamics thatis consistent with KaldorÕs own desire to use history as the central organizingconcept in economic analysis.
NOTES
1. See, for example, Kaldor (1972, 1985).2. See also the discussion of methodological aspects of Kaldorian growth modelling in
McCombie and RobertÕs chapter in this volume.3. This may appear to flatly contradict KaldorÕs own preferred methodology, as briefly
described above. See, however, Thirlwall (1987), Setterfield (1998a) and the discussionbelow.
4. These negative feedbacks, which are associated with the problem of lock-in along a partic-ular cumulative growth path, are more explicitly modelled than in the earlier papers citedabove.
5. See Chick and Caserta (1997) on the notion of provisional equilibrium, and Setterfield(1997c) on the related concept of conditional equilibrium.
6. See, for example, Setterfield (1995) for discussion of Robinson on historical time.7. This even applies to models based on strong form rational expectations, in which the econ-
omy appears to jump instantaneously from one equilibrium state to another. These modelsneed to explain where knowledge of the Ôtrue modelÕ comes from. They usually posit learn-ing in order to do so Ð something that is, of course, a type of adjustment process.
8. We assume that yit > 0 "t, i = j, w, based on the stylized facts of long-run growth in advancedcapitalist economies.
9. The relative merits of these assumptions are discussed in greater detail in Setterfield (1997a,p. 369). The first assumption, which essentially claims that wage relativities are constantacross regions, is one of KaldorÕs stylized facts of growth.
A model of Kaldorian traverse 229
Downloaded from Elgar Online by University of Melbourne at 07/12/2013 04:24:19AM

10. The potential importance of treating aj as non-constant over time will become clear in thefollowing section.
11. According to Dixon and Thirlwall (1978), this assumption is consistent with the stylizedfacts concerning the size of the coefficients a, l and b.
12. In fact, it is far from obvious that there is any place at all for equilibrium in KaldorÕs growthschema.
13. It is straightforward to verify that ¶yjt y¶yj 0 = (haj 1)t > 0 "t in [12.9], since haj 1 > 0 byhypothesis.
14. Weak path dependence, in which initial conditions influence subsequent outcomes but with-out affecting the structure (or data) of a system (as, for example, in conventional models ofmultiple equilibrium), can be contrasted with strong path dependence or hysteresis, in whichthe adjustment path of a system does affect its structure (and hence its subsequentoutcomes). We return to this distinction below Ð see also Halevi and Kriesler (1992, p. 228).
15. For further discussion of the channels through which these dynamic increasing returnsaccrue, see Boyer and Petit (1991) and Setterfield (1997a, chapter 3).
16. That this succession is discrete implies that each productivity regime Ð captured by a specificvalue of ajt "t = 1, . . ., n, where the value of n is free to vary between regimes Ð is rela-tively enduring and subject only to discontinuous change. While this is, in general, anassumption, it is certainly justified in the formal example of a regime change modelledbelow. See also the chapter by Setterfield and Cornwall in this volume.
17. These interconnections may proliferate both within and between productive units, including,of course, those under different ownership.
18. That these Ôcommon standardsÕ are both technical and social in nature is due to the fact thatinterrelatedness as described above involves not just physical and human capital (which maybe conceived in purely technical terms), but also the organizational structures within whichproductive activity occurs, and in which the roles of and relationships between a firmÕsworkers, managers and owners are manifest. For example, Fordism is characterized not justby dedicated assembly line capital but also by specific, hierarchical organizational structuresthat define the location of knowledge about and hence control over the production processwithin the enterprise (see, for example, Lazonick, 1990).
19. We assume that yj* = yw in order to simplify both the initial identification of region j as a virtu-
ous circle region, and subsequent discussion of the regionÕs relative growth rate (on which,see below). Note, however, that we must have yj
* ³ yw in order to avoid difficulties in inter-preting the model developed earlier in Kaldorian terms, since otherwise, we will observeyj 0 > yw initially but yjt < yw for sufficiently large t ceteris paribus, which would not allowsus to unambiguously interpret region jÕs initial disequilibrium growth path as a virtuous circleof sustained relatively high growth. This restriction points to an obvious limitation of themodel developed earlier as an interpretation of KaldorÕs cumulative growth schema.
20. Strictly speaking, of course, these are expected profitability comparisons. Here and in whatfollows, we assume a uniform state of long-run expectations in order to abstract from anypotential differences in the confidence of the decision maker in its forecasts of the returns todifferent assets. This allows us to focus solely on the impact of interrelatedness and lock-inon the investment decision.
21. Note that since yjt > 0 by hypothesis, Yjt and hence ijt and kjt are strictly increasing in t. Onlyin period n, then, will we observe kjt ³ kjL > kjtÐ1. Note that this also implies that once it islocked-in to the technology inherent in component B, region j will remain locked-in Ð evenif, as discussed below, its growth performance is adversely affected. If absolute decline werepossible, however, even Ð in a less aggregative setting Ð in certain key industries affected bylock-in, then the problem posed above need not persist indefinitely. This does not, of course,mean that the regionÕs subsequent growth and development will necessarily benefit fromsuch absolute decline, owing to the many other effects on the region, which lie beyond thescope of this chapter, that the latter may have.
Note also that changes in the value of aj other than those resulting from lock-in asdescribed above may, of course, occur after period t = n. We abstract from these here,however, in order to focus on the impact on region j of a single episode of lock-in, ceertisparibus.
230 Traverse analysis and demand-led growth
Downloaded from Elgar Online by University of Melbourne at 07/12/2013 04:24:19AM
22. The precise value of s will depend on the speed of adjustment towards yj**, something which
will, of course, vary directly with the size of f.23. The equilibrium in the model developed above is a weak attractor in the sense that it affects
the dynamic adjustment path of the system, without the latter ever Ôgetting intoÕ equilibrium.The fact that it never Ôgets intoÕ a position of equilibrium may appear to distinguish the
model of Kaldorian traverse from Ôequilibrium and traverseÕ models. But in truth, this maybe a common property of models of hysteresis, which can require restrictive conditions ifthey are to eventually converge to a (path dependent) equilibrium (see, for example, Fisher,1983). Whether or not sufficient attention is generally paid to these problems of convergencein the Ôequilibrium and traverseÕ approach is, however, a different matter.
24. For example, it can be assumed that hajt > 1, so that no (positive) equilibrium exists, andthe growth rate increases over time in the course of any episode of cumulative causation.
25. On the central role of structural change in the process of hysteresis, see Amable et al. (1995)and Setterfield (1998b).
26. The lock in threshold, YjL, is also endogenous to the technique of production employed. SeeSetterfield (2001, p. 110).
27. The term ÔemergenceÕ is usually used to denote a situation in which a system possesses prop-erties that cannot be inferred from the properties of its constituent parts at a lower level ofaggregation. The term is used here, however, in a dynamic context to denote a situation inwhich there are properties of a period/event in historical time that cannot be inferred fromthe properties of earlier periods/events that, in the context of path dependence, are under-stood to have influenced its constitution. Note also that the term is being used in a mannerthat connotes an absence of foreclosure in this dynamic process.
28. Note that this does not mean that the model degenerates into nihilism. In practice Ð that is,in concrete historical circumstances Ð decision makers can be expected to develop conven-tions to guide behaviour in the open environment we are not contemplating. These conven-tions lend conditional closure to the macroeconomic system, the conditionality arising fromthe fact that system closure is historically specific and contingent on the reproduction ofconventions which are, themselves, ultimately arbitrary and subject to effective choice. Partof the art of macrodynamic analysis is thus the identification of relatively enduring institu-tions that define conditionally closed macroeconomic epochs, which in turn permit concretehistorical explanation and even (within a particular epoch) conditional prediction. SeeSetterfield (1997c).
29. This does not mean that change within an evolutionary system cannot arise from without Ðonly that exogenous events are not the source of all change.
30. The traverse path is only partly determined by the structure of the growth regime because,of course, it also depends on the rate of growth achieved in the initial period.
31. See also Setterfield (1997c). This view is arguably compatible with KaldorÕs own on thesubject (see, for example, Thirlwall (1987, p. 316; 1991, p. 41) and Setterfield (1998a)).
REFERENCES
Amable, B. (1993) ÔCatch-up and convergence: a model of cumulative growth,ÕInternational Review of Applied Economics, 7, 1Ð25.
Amable, B. et al. (1995) ÔHysteresis revisited: a methodological approach,Õ in R. Cross(ed.) The Natural Rate of Unemployment: Reflections on 25 Years of theHypothesis, Cambridge, Cambridge University Press, 153Ð80.
Arthur, W.B. (1994) Increasing Returns and Path Dependence in the Economy, AnnArbor, University of Michigan Press.
Bliss, C. (1987) ÔHicks, John Richard (born 1904),Õ in J. Eatwell, M. Milgate and P.Newman (eds) The New Palgrave: A Dictionary of Economics, London, Macmillan,641Ð6.
A model of Kaldorian traverse 231
Downloaded from Elgar Online by University of Melbourne at 07/12/2013 04:24:19AM
Boyer, R. and P. Petit (1991) ÔKaldorÕs growth theories: past, present and prospects forthe future,Õ in E.J. Nell and W. Semmler (eds) op. cit., 485Ð517.
Chick, V. and M. Caserta (1997) ÔProvisional equilibrium in macroeconomic theory,Õin P. Arestis, G. Palma and M. Sawyer (eds) Markets, Unemployment and EconomicPolicy: Essays in Honour of Geoff Harcourt, vol. II, London, Routledge.
Cornwall, J. (1991) ÔProspects for unemployment in the 1990s with hysteresis,Õ in J.Cornwall (ed.) The Capitalist Economies: Prospects for the 1990s, Aldershot,Edward Elgar, 107Ð24.
Dixon, R. and A.P. Thirlwall (1975) ÔA model of regional growth rate differences alongKaldorian lines,Õ Oxford Economic Papers, 27, 201Ð14.
Dixon, R. and A.P. Thirlwall (1978) ÔGrowth rate stability in the Kaldorian regionalmodel,Õ Scottish Journal of Political Economy, 25, 97Ð9.
Fisher, F.M. (1983) Disequilibrium Foundations of Equilibrium Economics,Cambridge, Cambridge University Press.
Frankel, M. (1955) ÔObsolescence and technological change in a maturing economy,ÕAmerican Economic Review, 45, 296Ð319.
Gordon, D. (1991) ÔKaldorÕs macro system: too much cumulation, too few contradic-tions,Õ in Nell, E.J. and W. Semmler (eds) op. cit., 518Ð48.
Halevi, J. and P. Kriesler (1992) ÔAn introduction to the traverse in economic theory,Õin J. Halevi, D. Laibman and E.J. Nell (eds) Beyond the Steady State: A Revival ofGrowth Theory, New York, St. MartinÕs Press, 225Ð34.
Harcourt, G.C. (1981) ÔMarshall, Sraffa and Keynes: incompatible bedfellows?Õreprinted in P. Kerr (ed.) (1982) The Social Science Imperialists: Selected Essays ofG.C. Harcourt, London, Routledge, 205Ð21.
Hargreaves Heap, S.P. (1989) Rationality in Economics, Oxford, Basil Blackwell.Henry, J. and M. Lavoie (1997) ÔThe Hicksian traverse as a process of reproportioning:
some structural dynamics,Õ Structural Change and Economic Dynamics, 8, 157Ð75Hicks, J.R. (1965) Capital and Growth, Oxford, Oxford University Press.Kaldor, N. (1972) ÔThe irrelevance of equilibrium economics,Õ The Economic Journal,
82, 1237Ð55.Kaldor, N. (1985) Economics Without Equilibrium, Cardiff, University College of
Cardiff Press.Kalecki, M. (1971) Selected Essays on the Dynamics of the Capitalist Economy,
Cambridge, Cambridge University Press.Kregel, J. (1976) ÔEconomic methodology in the face of uncertainty: The modelling
methods of Keynes and the post-Keynesians,Õ Economic Journal, 86, 209-25.Kriesler, P. (1999) ÔHarcourt, Hicks and Lowe: incompatible bedfellows?Õ in C.
Sardoni and P. Kriesler (eds) Themes in Political Economy: Essays in Honour ofGeoff Harcourt, London, Routledge, 400Ð17.
Lavoie, M. (1996) ÔTraverse, hysteresis and normal rates of capacity utilization inKaleckian models of growth and distribution,Õ Review of Radical PoliticalEconomics, 28, 113Ð47.
Lazonick, W. (1990) Competitive Advantage on the Shopfloor, Cambridge, MA,Harvard University Press.
McCombie, J.S.L. and A.P. Thirlwall (1994) Economic Growth and the Balance ofPayments Constraint, London, Macmillan.
Nell, E.J. and W. Semmler (eds) (1991) Nicholas Kaldor and Mainstream Economics:Confrontation or Convergence? New York, St. MartinÕs Press.
Setterfield, M.A. (1995) ÔHistorical time and economic theory,Õ Review of PoliticalEconomy, 7, 1Ð27.
232 Traverse analysis and demand-led growth
Downloaded from Elgar Online by University of Melbourne at 07/12/2013 04:24:19AM
Setterfield, M.A. (1997a) Rapid Growth and Relative Decline: ModellingMacroeconomic Dynamics with Hysteresis, London, Macmillan.
Setterfield, M.A. (1997b) ÔHistory versus equilibrium and the theory of economicgrowth,Õ Cambridge Journal of Economics, 21, 365Ð78.
Setterfield, M.A. (1997c) ÔShould economists dispense with the notion of equilib-rium?Õ Journal of Post Keynesian Economics, 20, 47Ð76.
Setterfield, M.A. (1998a) ÔHistory versus equilibrium: Nicholas Kaldor on historicaltime and economic theory,Õ Cambridge Journal of Economics, 22, 521Ð37.
Setterfield, M.A. (1998b) ÔAdjustment asymmetries and hysteresis in simple dynamicmodels,Õ The Manchester School, 66, 283Ð301.
Setterfield, M.A. (2001) ÔCumulative causation, interrelatedness and the theory ofeconomic growth: a reply to Argyrous and Toner,Õ Cambridge Journal ofEconomics, 25, 107Ð12.
Thirlwall, A.P. (1987) Nicholas Kaldor, Brighton, Wheatsheaf.Thirlwall, A.P. (1991) ÔNicholas Kaldor, 1908Ð86,Õ in E.J. Nell and W. Semmler (eds)
op. cit., 13Ð47.
A model of Kaldorian traverse 233
Downloaded from Elgar Online by University of Melbourne at 07/12/2013 04:24:19AM

Downloaded from Elgar Online by University of Melbourne at 07/12/2013 04:24:19AM

13. Endogenous demand in the theory of transformational growth
George Argyrous
INTRODUCTION
Neoclassical economics takes as given the tastes and preferences ofconsumers, and seeks to determine the set of relative prices that will reconcilethese given tastes and preferences with the limited resources and technologi-cal capacity available to satisfy them. At the micro-level, demand is exoge-nous since the tastes and preferences of consumers are given from the outset.At the macro-level, the sum of these preferences Ð aggregate consumerdemand Ð adjusts passively to changes in prices at the micro-level, so thataggregate demand equals aggregate supply. The focus is thereby shifted ontoaggregate supply and its components, as in both the Solow growth model andthe neoclassical endogenous growth theory. Demand is essentially exogenous.
Post-Keynesian theory, on the other hand, treats aggregate effectivedemand as a variable that determines the growth part of the economy. Yetwithin the post-Keynesian literature there remains a lacuna in the explanationof effective demand: what determines its evolution? This is particularly worri-some given the often-stated desire to use history rather than equilibrium as themethodological guidepost for analysis. Despite this desire, a historically basedtheory of the growth of markets has not been fully developed.
The theory of transformational growth (TG), on the other hand, providessuch a historically based theory of the growth of demand. Moreover, the forcesit identifies to explain the growth of demand are endogenous to the growthprocess itself. TG identifies feedback loops between the growth of individualmarkets and aggregate expansion in general, and these feedbacks provide anendogenous theory of qualitative change; hence the adjective in the termÔtransformational growthÕ. The natural tendency of the system is change anddevelopment.1
The theory of TG juxtaposes two distinct periods of capitalist development.The first period, which characterized the pre-First World War era, is a systemin which craft technology was the dominant method of production. The secondperiod, corresponding with the post-Second World War era, features mass
237
Downloaded from Elgar Online by University of Melbourne at 07/12/2013 04:48:23AM

production technology, or what has elsewhere been termed a Fordist regime.These are very much idealized types; mass production technology was evidentin some industries during the nineteenth century, and similarly craft technol-ogy persisted beyond the end of the Second World War. The dominance of onetechnology over the other in each period is nevertheless clear.
This chapter discusses the way in which the growth of demand is endoge-nous to the system itself, and that this endogenous process is an essentialelement in explaining the transition from craft to mass production. Marketexpansion is inherently endogenous: supply and demand do not seek an equi-librium, but rather induce feedback effects on each other resulting in perpetualchange.
THE EMERGENCE OF WAGE LABOUR AND THEORIGINS OF MASS MARKETS
The theory of TG emphasizes the role of mass production technology in alter-ing the fundamental operations of a capitalist economy (Nell, 1998b). Of equalimportance, though, is the rise of mass markets that make such a technologyviable. TG therefore also seeks to explain the rise of mass markets and theconsumer behaviour that underpins them. In particular, the theory of TGargues that the rise of mass markets is a historical process involving complexchanges in the way household production and consumption are related toindustrial production.
Three distinct processes are involved in the rise of mass markets; each ofvarying importance at different stages of development. The first is the forma-tion of an industrial working class that purchases subsistence goods in themarket rather than producing them within a largely self-sufficient household.The second process by which mass markets form is through the productivity-enhancing effects of mass production technology on the aggregate incomes ofworkers, once this technology becomes established as a result of the formationof an industrial working class. The third is changes in the composition ofdemand resulting from income growth.
The theory of TG draws a distinction between pre-industrial, predomi-nantly agrarian, societies and modern mass production economies. The familyunit in traditional society produced for itself the goods its members consumed.Each family had access to the raw materials it needed, such as cotton, wool,and grains, and applied domestic labour to transform these raw inputs intousable goods, often drawing on the extended family when labour was requiredfor major tasks such as homebuilding. ÔOur forefathers in colonial Americalived on their own farms, built their own houses, raised their own food, andmade their own clothes. Each family was a little world in itself, capable of
238 Structural change and demand-led growth
Downloaded from Elgar Online by University of Melbourne at 07/12/2013 04:48:23AM

meeting most of the needs of its existence. Today, an individual produces fewof the commodities he consumesÕ (Andrews and Michels, 1937, p. 44).Households within a village community interacted with each other, exchang-ing goods that each may have produced in surplus, but the pattern ofexchanges between households was regulated by custom and tradition (Nell,1992, pp. 364Ð6).
Thus, for the bulk of the population, consumption was satisfied throughdirect production by the consuming household. Alongside this system ofhousehold production, there existed commercial producers who soldcommodities in a market. But these markets were based largely on the discre-tionary needs of aristocratic households or the occasional needs of villagehouseholds for specialized goods they could not make for themselves. Thus,these firms were characterized by craft technology that could be adapted tomeet the discretionary needs of such expenditure. The need to literally tailor-make goods to the specific demands of individual consumers restrictedproduction technology to small-scale craft technology using very simpleequipment. Producers knew who would consume their product and weregeared towards adapting production to the particular needs of theseconsumers.
The basis of this system was the access of the peasantry to land, from whichthey could obtain raw material inputs into domestic production, and the avail-ability to the household of the labour time of its members. The breakdown ofthis system can therefore be found in the alienation of the peasantry from land,or the removal of members of the household so that their labour time was nolonger available (as when male members were conscripted into the army).Without access to land and the raw materials it provides, or the domesticlabour to produce subsistence goods, previously self-sufficient peasants areforced to purchase the inputs to domestic production on the market. And theironly means for doing this is to offer their labour power for sale in return forwages.
Thus the process of alienating the peasantry from the material inputs todomestic production, as in the enclosure movement in the UK, creates marketsfor goods that were previously produced by the household. As Marx cogentlysummarized, Ôin fact, the events that transformed the small peasants intowage-labourers, and their means of subsistence and of labour into materialelements of capital, created, at the same time, a home market for capitalÕ(1886, p. 910).
As workers are created out of this breakdown of the traditional system, theyhave to spend their wages on the materials or finished goods that they onceproduced for themselves. With the market for such goods expanding, morelabour is drawn away from the countryside and into industrial production.These additional workers, in turn, can no longer devote their time to domestic
Endogenous demand in theory of transformational growth 239
Downloaded from Elgar Online by University of Melbourne at 07/12/2013 04:48:23AM
production, and therefore add to the demand for industrially produced goods.Workers are pulled off the land as new industries spring up and require abun-dant supplies of cheap labour, and these workers themselves then add to thegrowth of markets. Thus when a critical mass of wage labourers forms, theprocess becomes cumulative and draws more of the peasantry into its orbit.
Moreover, this mechanism by which market demand expands through thebreakdown of the household system carries forward even into later stages ofcapitalist development and provides a means by which crises of undercon-sumption may endogenously create the conditions for future market expan-sion. In periods of recession, the decline in household wage income upsets thebalance between labour supplied to the market and labour devoted to domes-tic production. With less money income from wage labor, the inputs neededfor domestic production will be more difficult to purchase. And without theirown land to cultivate, the family will not be able to maintain its standard ofliving by opting out of industrial production. More members of the family willhave to offer their labour power in the market, or existing workers will put inovertime in order to maintain the flow of money income. But this means thatthere is less labour available for household production. Households willthereby use their income to purchase final commodities, or labour-savinginputs to domestic production, which embody a higher degree of industrialproduction. These changes imply a rearrangement of the entire lifestyle of thehousehold and its operation.
The impact of all of this on consumer demand is not due to an increase intotal household income: in fact, the process has come about precisely becauseincomes have declined to a level that undermine the normal standard of living.A familyÕs response to this through the reallocation of labour between indus-try and the household, however, alters the pattern of demand so that the natureof the things purchased changes. Households no longer purchase raw materi-als to be used as inputs to household production. Instead, they require finishedconsumer goods and appliances that are complementary to the consumption ofthese goods, especially consumer durables.
It is important to note that the rise in money income as a means for satis-fying demand is not necessarily equated with an improvement in the livingstandards of the working class. Indeed, it is sometimes the impoverishment ofhouseholds brought about by their alienation from the means of householdproduction that forces them to seek wage labour, thereby simultaneously creat-ing and expanding consumer markets. Bernstein (1987), for example, hasargued that the mass unemployment of the 1930s in the USA lowered themoney wage level of many working-classes households. In order to maintainthe money income of the family, other members of the household, especiallyhousewives, had to seek employment. With less time available to devote tohousehold production, activities such as the preparation and storage of food
240 Structural change and demand-led growth
Downloaded from Elgar Online by University of Melbourne at 07/12/2013 04:48:23AM

could no longer be undertaken domestically. This created a market forconsumer durables and for packaged food, which, in turn, fostered expansionof the canning and bottling industries. Bernstein argues that with sufficienttime, these processes may have allowed the economy to move out of depres-sion, albeit very slowly.
THE DEMAND EFFECTS OF PRODUCTIVITY GROWTH
With the formation of an industrial working class, the consumption goodsmarket can continue to grow by cheapening the commodities that make up theconsumption basket, thereby raising the real incomes of consumers. This hasbeen a focal point of the cumulative causation literature, particularly that ofAllyn Young and Nicholas Kaldor. The division of labour raises productivityand allows a cheapening of commodities, which leads to an expansion of themarket for that commodity, which then induces further division of labour andthe extension of the mass production system. This mutually reinforcing feed-back between technology and market demand led Young (1928) to amendAdam SmithÕs famous dictum such that Ôthe division of labor is limited by thedivision of laborÕ. He could alternatively have stated this apparent tautologyby arguing that the extent of the market is limited by the extent of the market.In fact, neither statement is a tautology, since they are backed by a theory thatexplains the self-reinforcing feedbacks between productivity growth andmarket demand.
It is important though to identify the precise ways in which productivitygrowth induces an expansion of demand. The first and most obvious channelis the way in which new consumers are able to enter the market for a commod-ity whose production is undergoing transformational growth. As a commoditycheapens, more consumers are able to include it in their consumption bundles;the emergence of the mass market for home computers and the constant reduc-tions in computer prices is a classic example of this process.
A second channel through which productivity growth expands demand insuch a way as to induce further productivity growth is the increase in the realincomes of those people who already purchase the commodity whose relativeprice is declining. No longer needing to devote as much of their real incometo purchasing a given commodity, these consumers redirect their demand toother commodities that they could previously not afford. This extends the divi-sion of labour in these other industries that raises the real of income of theirconsumers, and so on.
A third channel that is especially important in the early stages of capitalismis the way in which the cheaper (and sometimes better) goods produced in thefactories destroy small-scale cottage production of similar goods. This forces
Endogenous demand in theory of transformational growth 241
Downloaded from Elgar Online by University of Melbourne at 07/12/2013 04:48:23AM

more people to enter the wage labour class, who then add to the demand forindustrially produced goods as they spend their money wages. The fall in theprice of a commodity means that small-scale producers are competed out ofthe market. An example of this process is the rapid decline of domestic spin-ning in the face of the mechanization of the cotton industry in England in thelate 1700s. ÔThe mechanical advantage of even the earliest jennies and waterframes over handspinning was enormous: anywhere from six up to twenty-four to one for the jenny; several hundred to one for the frame. The spinningwheel, which had taken some centuries to displace the rock, became anantique in the space of a decadeÕ (Landes, 1972, p. 85).
A fourth channel is the increase in the labour directly required to produce acommodity under mass production conditions. This follows from the sheerincrease in the scale of production induced by the growth of mass markets.The employment of large pools of unskilled and semi-skilled labour, and also(in its advanced stages) the formation of a bureaucratic class of corporatemanagers and supervisors, buttresses mass markets for other commodities, theproduction of which employs large pools of labour that may, in turn, feed intothe demand for the original commodity.
GROWTH THROUGH CHANGES IN THE COMPOSITIONOF DEMAND
We have noted that households begin as production units, with the inputs toproduction consisting largely of home-grown raw materials, to which domes-tic labour is applied to transform these raw materials into consumption goods.As industrialization takes hold and mass production spreads from industry toindustry, drawing workers into its orbit, less labour can be devoted to domes-tic production. The household remains a production unit (usually through asexual division of labour), but the inputs are no longer raw; they have alreadybeen transformed in the industrial sphere, and are transformed further in thehousehold sphere with the aid of labour-saving devices such as washingmachines and microwave ovens. Eventually, very little production is under-taken in the household, which becomes almost a pure consumption unit. Thehistory of the sewing machine illustrates this evolution. Without the raw mate-rials or the labour time required to spin cotton and wool into yarn and then intocloth, households purchase cloth ready-made and produce clothing with theaid of sewing machines. This creates a mass market for sewing machines, theproduction of which requires a large labour force, which adds to overall effec-tive demand and the growth of markets for consumption goods in general.Eventually, though, households purchase industrially produced finished cloth-ing, rather than transforming semi-finished inputs through domestic labour.
242 Structural change and demand-led growth
Downloaded from Elgar Online by University of Melbourne at 07/12/2013 04:48:23AM

The entire manufacture of finished clothing in the process is eventually trans-ferred to industry.
This (albeit simplistic) story of the growth of consumer demand helpsexplain one of the most significant regularities in economics, the Engel curve.The Engel curve was originally developed to explain the decline in the rela-tive importance of food in the consumption bundle of households as theirincomes rise, an observation consistent with the discussion above. It has sincebeen expanded into a statement of the gradual diversification of consumerdemand as income grows, and in particular the increasing share of incomespent on manufactured items, and then service items (Houthakker, 1957). Theimportance feature of the Engel curve is that households do not spend reason-ably permanent increases in income on commodities in the same proportionsas they have in the past. There is a distinct hierarchy of needs and wants(Cornwall, 1977, pp. 100Ð2), so that Ôas per capita real income increases eachincrement of consumersÕ demand tends to concentrate on a particular group ofgoods and services. This group of goods and services gradually changes fromone level of income to another. Hence, as income increases, the tendency is notto increase proportionately the consumption of already bought goods andservices, but rather to buy new goods and services or to satisfy old needs withdifferent (and hopefully better) goodsÕ (Pasinetti, 1981: 77).
This clustering of goods and services, in a hierarchical fashion with respectto income, essentially revolves around the complementarities between thegoods that together form a particular ÔlifestyleÕ. As income increases there isa point where households feel that can alter their existing patterns of consump-tion and ÔinvestÕ in a new lifestyle (provided this income growth can be confi-dently projected into the future). An addition can be made to the family homethat requires a new furnishing, a second TV and so on. This disproportionategrowth in the bundle of commodities that dominate a householdÕs demand iscrucial to the endogenous evolution of markets, since it will allow new indus-tries to spring up, replacing as an engine of growth those industries in whichdemand has reached saturation levels given their ÔearlierÕ position along theaggregate Engle curve.
This theory of consumption, based on the evolution of demand along theEngel curve, allows for a more sociological theory of consumer behaviour. Itprovides a role for consumer learning in the formation of tastes and prefer-ences through emulation and trial and error, and through the pervasive effectsof advertising in ÔhelpingÕ to determine the commodities that make up thelifestyles that define the points that make up the Engle curve.2 The generalpoint about this discussion of social structure and the growth of markets is thatexpansion depends on constant and far-reaching changes in the way society isorganized. The ability of large groups of consumers to move into markets fromwhich they were formerly excluded, the creation of new urban centres as more
Endogenous demand in theory of transformational growth 243
Downloaded from Elgar Online by University of Melbourne at 07/12/2013 04:48:23AM

people leave traditional forms of production to engage in wage labour, thereplacement of family ownership and control with managerial hierarchiespopulated by entirely new classes of people Ð such phenomena imply newlifestyles defined by an ensemble of goods and services that must be produced.As long as social stratification is fluid and new or existing markets continue tofind pockets of expansion, demand will grow. But as soon as social positionsbegin to ossify and mobility is reduced, then stagnation sets in. This will thendiscourage further investment and innovation which, in turn, reduces theforces that could potentially Ôchurn upÕ the social order and cause markets toexpand again. Social change, and especially social improvement on a largescale, are an essential, but not guaranteed, part of transformational growth.
THE DEVELOPMENT OF A CAPITAL GOODS SECTOR
The growth of mass markets that we have just described has implications forthe other major element of demand: investment. For traditional craft firms,increases in the size of the market had normally been met by creating newproduction units; investment was extensive, involving a multiplication ofsmall shops based on the optimal size of the work team. The self-reinforcingexpansion of consumer demand we have just discussed places pressure onpreviously small-scale craft producers to alter their production methods. Withthe level of demand growing rapidly and its pattern shifting from discretionaryexpenditure to homogeneous demand, producers extend the division of labourto meet the growing mass market. With working-class families increasinglysourcing their needs through the expenditure of wage income, the craft systemis pushed to its limits. Craft methods cannot meet the needs of expandinghome markets, since there are diminishing returns to scale for this technology.Firms can no longer carry the fixed current costs of a skilled work team duringslack periods, nor can these work teams take advantage of expansions ofdemand, since they usually involve rising marginal cost curves after a defin-able point of production. Production beyond this point is constrained by thephysical limits of key personnel who can neither pass work on to the next shift,nor produce larger quantities without quality deteriorating.
Investment, therefore, becomes intensive, involving a dramatic increase inthe size of the production unit and a demand for specialized capital goods. Thedivision of labour is synonymous with the introduction of increasingly special-ized equipment that is durable and capable of long production runs turning outinterchangeable parts. The supply of such specialized machinery and equip-ment becomes the function of an emergent class of capital goods producersdedicated to the task. But how do such specialized capital goods producersemerge? A distinct capital goods sector does not lie dormant, awaiting the
244 Structural change and demand-led growth
Downloaded from Elgar Online by University of Melbourne at 07/12/2013 04:48:23AM
needs of consumer goods producers for machinery and equipment to activateits capabilities. It emerges endogenously through an evolutionary process asthe growing domestic market presses against the limits to production set bycraft technology, which forces small-scale producers to look for technologicalsolutions to these limits. The key element to this is a learning process that canbe described as learning-by-self-using.
Firms using craft methods of production normally create simple tools andequipment in-house for individual job lots. Under the craft system, capitalgoods are simple. Just as the traditional family farm produced the goodsneeded to satisfy its own consumption needs, traditional craft shops producedtheir own tools and equipment. Tools were made of non-durable materials thatcould be easily fashioned for specific jobs or batches of production, and thendisposed of. However, the need to raise output and meet longer productionruns requires tools made of more durable material and equipment increasinglyspecialized to an individual task. Meeting these needs forms a technologicalpuzzle that initially engages a firmÕs own engineering or repair department.Thus the external demand for consumption goods becomes an internal demandfor capital goods. The engineering department begins to develop the necessaryequipment, which finds its way onto the shop floor. This equipment is thenprogressively refined and improved through trial and error (that is, learning-by-self-using). Such equipment may move through several generations, adapt-ing to the growing demand for consumer goods for whose production it has,itself, been produced. This is often an invisible process to the outside observerbecause the source of demand is endogenous to the firm itself: the producerand consumer are one and the same.
This process of learning thereby creates within the womb of a producer ofconsumer goods a nascent capital goods producer. Such producers then matureinto separate and distinct entities in one of two ways. The engineering or repairdivision of the firm takes on an increasingly independent existence as it real-izes that the equipment it initially manufactures for in-house use has acommercial potential. Thus it no longer exists as an incidental service depart-ment, but becomes an autonomous unit. Alternatively, key personnel such as aforeman or master toolmaker may leave the parent firm and set up an inde-pendent operation (although often relying on a close relationship with theparent firm for continuing orders) (Argyrous, 1996). Thus vertical specializa-tion of industry works backwards, beginning with the growth of consumerdemand that feeds back as demand for machinery and equipment, which even-tually induces the development of specialized producers of such machineryand equipment.3
For countries that develop relatively late this learning-by-self-using maytake a slightly different form. In such countries, manufacturers of consumergoods can always import their needs for capital goods from countries that have
Endogenous demand in theory of transformational growth 245
Downloaded from Elgar Online by University of Melbourne at 07/12/2013 04:48:23AM
already industrialized. However, the specific requirements of machinery andequipment render proximity between producer and user a distinct advantage,so that importing machinery is not always desirable. When a piece of machin-ery breaks down, firms often engage their engineering departments to reverseengineer the previously imported item and build anew a machine more closelysuited to their own needs. Once a serviceable model is developed through thefirmÕs own use of it, the capacity then exists for a separate firm to spin off anddedicate itself to the production of this item for sale to other firms.
The formation of a distinct layer of firms dedicated to capital goods produc-tion gives an economy new sources of endogenous demand creation. One suchsource is the mutual demand by capital goods producers for each otherÕs prod-ucts. Capital goods are required for the production of capital goods, and thisinteraction within the sector can improve the productivity of all capital goods.This then lowers costs in those consumer goods industries that purchasecheaper and better equipment, fuelling the processes we have describedearlier, which then feedback as a further expansion in the demand for capitalgoods.
Another source of endogenous demand that arises with the development ofa specialized machine building sector is the learning-by-using processdiscussed by Rosenberg (1982). Small capital producers sell their equipmentto large mass production firms who, in using the equipment, identify methodsof improvement that they make known to the producers of the equipment.Thus the demand for a particular piece of equipment today leads to a demandfor an improved version of that equipment in the future. Moreover, as anygiven piece of equipment is adapted and improved through this process, ademand is created for complementary improvements in other pieces of equip-ment with which it forms a complete production system. A faster packagingmachine requires a faster conveying machine, which then calls forth improve-ments further down the line.
LIMITATIONS ON ENDOGENOUS GROWTH
Transformational growth is a theory about the operation of two distinctsystems of production; the craft system, which dominated before the FirstWorld War, and the mass production system of the post-Second World Warperiod. The recognition that demand expands endogenously helps explain theprocesses by which an economy moves from one system to another. The riskfor any theory of endogenous change, though, is that it may be very mecha-nistic, presenting industrialization as an inexorable process, resistant to limi-tations.
The emphasis on various learning processes in the discussion above,
246 Structural change and demand-led growth
Downloaded from Elgar Online by University of Melbourne at 07/12/2013 04:48:23AM

however, helps the TG story avoid any mechanistic overtones, and indicateswhy the transition from craft to mass production was so staggered and drawnout over time. While TG refers to system-wide changes in production tech-nology, these system-wide outcomes only eventuate through incrementaladaptations at the micro-level by individual firms and industries to the evolu-tion of demand. Moreover, we can identify specific limiting factors that canundermine the endogenous forces of expansion.
One such limiting factor is the particular relationship between the capital-using and capital-producing sectors. TG does not completely eliminate craftmethods of production from an economy, but rather concentrates them in thecapital goods industry. As mass markets for consumer goods develop, as wehave argued above, this translates into demand for specialized, often custom-made pieces of capital equipment, which encourages the adoption of crafttechnology in those firms making the equipment. A piece of capital such as ahigh-speed lathe may be used in a mass production process, but may itselfhave been produced under craft conditions. This means that the capital goodsindustry, particularly its core sector of machine tool producers, cannot easilyexpand production in the short run beyond its existing productive capacity.Over time, as the capital goods sector produces more equipment and raisescapacity throughout the economy (including the capital goods sector itself),such limits can be overcome. But at any given point in time, an economy isconstrained by the productive capacity of this core sector, and the craft-liketechnology it employs.
Another limiting factor on self-sustaining growth involves the hierarchy ofgoods in the Engle curve. In particular, manufactured commodities are notevenly spread throughout the curveÕs range. As income grows, consumptiondemand is increasingly directed to services, which are not susceptible tosupply through mass production technology and division of labour. For anygiven household, the increasing importance of services in the consumptionbundle reduces the possible feedbacks that may eventuate through the divisionof labour and the cumulative spread of mass production technology.Manufacturing loses its power as an engine of growth with the relative declineof manufactured goods as components of consumption. Thus the growth ofmarkets, due to changes in the pattern of consumption over time, has an inbuilttendency to lose its motive force.4
Industrialization can also slow down through changes in the way thatproductivity is distributed. In the competitive phase of capitalist development,productivity gains obtained through the gradual encroachment of massproduction are distributed through price reductions. This spreads the benefitsacross a wide number of consumers, including people on fixed incomes. In theoligopoly phase of mature capitalism when economies of scale have been real-ized in a wide number of industries, firms increasingly use productivity gains
Endogenous demand in theory of transformational growth 247
Downloaded from Elgar Online by University of Melbourne at 07/12/2013 04:48:23AM

to raise the real wages of their own workers to ÔpurchaseÕ industrial peace,5 orelse to engage in oligopolistic competition Ð marketing, after sales service,product differentiation and so on Ð rather than directing them to productivity-enhancing activities per se. This concentrates the income (and therebyconsumption) effects of productivity growth in the hands of a smaller numberof individuals who are largely well-paid unionized workers, so that the poten-tial demand effect may not be as great as when productivity growth was passedon to all consumers.
If these contractionary factors come into play, the endogenous demand rela-tionships, which were a positive force generating cumulative expansion in thegrowth phase, become a negative force generating a vicious cycle of decline.Endogenous demand is a two-edged sword. Under the craft system, the levelof employment, in terms of the number of workers employed, did not vary,since the integrity of work teams had to be maintained. Producers wouldrespond to a downturn in demand by cutting prices and reducing the effort ofwork teams. With employment relatively stable and real wages rising, the craftsystem thus had an in-built mechanism for restoring demand. In the era ofmass production, however, downturns are met through a decline in totalemployment, with work effort relatively stable and prices inflexible down-wards. At the aggregate level this only exacerbates the problem of demanddeficiency, leading to further reductions in employment so that downturns canlead to chronic stagnation (Nell and Phillips, 1995). This obviously providesscope for government intervention to act as a Ôcircuit breakerÕ when such adownward spiral takes hold. The automatic stabilizers built into a system withBig Government can arrest the decline and restore the conditions for self-sustaining growth (Minsky, 1986).
CONCLUSION
There has been a growing interest in theories that seek to explain capitalistexpansion through recourse to internal Ôengines of growthÕ, rather than exoge-nous forces such as population expansion or autonomous technical change.The popularity of RomerÕs (1986, 1994) neoclassical endogenous growththeory is testament to this. Yet such theories have tended to concentrate on thesupply side, and especially on technical change and productivity. But tech-nologies that raise productivity are only viable if they have expanding marketsin which to sell, and therefore a theory of the growth of markets needs to bedeveloped to give a complete picture of endogenous growth. This is providedby the theory of TG, which locates the growth of markets in the dynamic inter-action between household and industrial production and consumption. Whenthis relationship is examined, we discover endogenous processes on the
248 Structural change and demand-led growth
Downloaded from Elgar Online by University of Melbourne at 07/12/2013 04:48:23AM

demand side that explain the emergence of mass markets that complement theemergence of mass production in a mutually self-reinforcing manner.
NOTES
1. A comprehensive account of TG is provided in Nell (1998a). A more schematic introductionto the theory of TG is provided by Pressman (1994).
2. Ironmonger (1972) provides an interesting model, incorporating some of these sociologicalfeatures, for analysing the diffusion of new commodities based on Engel curves.
3. It would be interesting to investigate the extent to which this process also applies to the devel-opment of information technology Ð that is, the extent to which such technology is originallydeveloped to service the in-house needs of existing firms as the demand for their productschanges and grows.
4. See Cornwall and Cornwall (1994) for a growth model that incorporates these features ofconsumption patterns and investigates their implications for economic expansion and statepolicies.
5. Henry FordÕs Ô$5 a dayÕ was an early example of this strategy (Ford, 1922, p. 126).
REFERENCES
Andrews, J.N. and R. Michels (1937) Economic Problems of Modern Society, NewYork, Ronald Press.
Argyrous, G. (1996) ÔCumulative causation and industrial evolution: KaldorÕs fourstages of industrialization as an evolutionary model,Õ Journal of Economic Issues,30, 97Ð119.
Bernstein, P. (1987) The Great Depression, Cambridge, Cambridge University Press.Cornwall, J. (1977) Modern Capitalism, Oxford, Martin Robertson.Cornwall, J. and W. Cornwall (1994) ÔGrowth theory and economic structure,Õ
Economica, 61, 237Ð51.Ford, H. (1922) My Life and Work, Sydney, Doubleday & Page.Houthakker, H. (1957) ÔAn international comparison of household expenditure patterns
commemorating the centennial of EngelÕs Law,Õ Econometrica, 25A, 532Ð51.Ironmonger, D.S. (1972) New Commodities and Consumer Behavior, Cambridge,
Cambridge University Press.Kaldor, N. (1966) Causes of the Slow Rate of Growth of the United Kingdom,
Cambridge, Cambridge University Press.Landes, D.S. (1972) The Unbound Prometheus, Cambridge, Cambridge University
Press.Marx, K. (1886) Capital 1, translated by Ben Fowkes, London, Penguin.Nell, E.J. (1992) Transformational Growth and Effective Demand, London, Macmillan.Nell, E.J. (1998a) The General Theory of Transformational Growth, Cambridge,
Cambridge University Press.Nell, E.J. (ed.) (1998b) Transformational Growth and the Business Cycle, London,
Routledge.Nell, E.J. and T. Phillips (1995) ÔTransformational growth and the business cycle,Õ
Eastern Economic Journal, 21, 125Ð42.Minsky, H. (1986) Stabilizing an Unstable Economy, New Haven, Yale University
Press.
Endogenous demand in theory of transformational growth 249
Downloaded from Elgar Online by University of Melbourne at 07/12/2013 04:48:23AM

Pasinetti, L. (1981) Structural Change and Economic Growth, Cambridge, CambridgeUniversity Press.
Pressman, S. (1994) ÔOn transformational growth,Õ Review of Political Economy, 6,107Ð32.
Romer, P.M. (1986) ÔIncreasing returns and long-run growth,Õ Journal of PoliticalEconomy, 94, 1002Ð37.
Romer, P.M. (1994) ÔThe origins of endogenous growth,Õ Journal of EconomicPerspectives, 8A, 3Ð22.
Rosenberg, N. (1982) Inside the Black Box, Cambridge, Cambridge University PressYoung, A. (1928) ÔIncreasing returns and economic progress,Õ Economic Journal, 38,
527Ð42.
250 Structural change and demand-led growth
Downloaded from Elgar Online by University of Melbourne at 07/12/2013 04:48:23AM

14. Notes on the transformational growth of demand
Edward J. Nell
INTRODUCTION
Understanding the Growth of Demand
At present, neither conventional nor alternative approaches to economictheory provide much help in understanding the growth of demand, either in theaggregate, or for specific markets and sectors. ÔGrowth of demandÕ refers hereto repeated, continuing expansion of demand (either at a steady rate or at afluctuating rate with a persistent average), where the expansion is not offset bycontraction elsewhere. Such growth of markets, and expected growth ofmarkets, are important in making business decisions, and are an object ofstudy by marketing divisions.
Yet explaining such growth has not been an objective of economic theo-rists. Indeed, from a Ôreal-economyÕ (or barter exchange) perspective, it mightseem that any growth of demand has to be based on a corresponding growthof supply. For if a new demand for a certain set of goods is to be effective inreal terms, there must be an expanded supply of some other goods with whichto pay for the newly demanded set. Explaining the growth of supply has there-fore seemed adequate.
But this is a way of thinking that overlooks the role of finance. Financebreaks the link between demanding one set of goods and paying for them withanother; once finance is in the picture, goods can be demanded even if theother goods needed to pay for them have not yet been produced. With finance,growth of demand can be separated from the growth of supply.
For the most part, however, growth models have been held in thrall by theÔreal-economyÕ perspective, and so have tended to focus on the supply side,assuming implicitly or explicitly that the growth will generate an equivalentgrowth of demand Ð a sort of long-run SayÕs Law. Both Solow and Kaldor,for example, assumed that in the long run investment would reflect theÔnatural rate of growthÕ. Their models differed in that Solow assumed thatthe warranted rate would adjust to the natural rate through a process of
251
Downloaded from Elgar Online by University of Melbourne at 07/12/2013 04:49:51AM
substitution between capital and labour, whereas Kaldor assumed that theadjustment would come about through changes in income distribution result-ing from variations in demand pressure. In both, however, the natural rate Ð asupply-side variable Ð determines the long-run course of investment, aKeynesian expenditure variable.
Yet this has to be considered implausible. Surely plans to spend on theexpansion of productive capacity will not be developed without a prior expec-tation of an appropriate growth in demand? The Keynesian separation ofinvestment from savings holds once finance is available, so that the growth ofdemand will not be constrained by the growth of supply and cannot be inferredfrom supply-side considerations. Instead, a separate account of the demandside is required.
It is often thought that, at the macroeconomic level, the growth of demandis explained by the HarrodÐDomar model. The Ôwarranted rate of growthÕ isthat rate at which the growth of demand just equals the growth of capacity. Butin fact this model equates the current level of expenditure, as determined bythe multiplier, with the current capacity output of the capital stock, in accor-dance with the productivity of capital (the inverse of the capitalÐoutput ratio).There is no necessary connection with growth.
To see this, consider an example that substitutes government spending forinvestment (Nell 1998, pp. 599Ð600). Let G be government spending, K be thecapital stock, and v the capitalÐoutput ratio, K/Y. Assume that all profits, P, aresaved and all wages are consumed. Then z = l Ð wn = P/Y, where w is the wagerate, and n = N/Y. G/z = K/v tells us that aggregate demand equals capacityoutput, and this implies G/K = z/v = r where r is the rate of profit.
This formula, analogous to the HarrodÐDomar condition, states that theratio of government spending to capital must equal the ratio of the profits shareto the capitalÐoutput ratio in order for capacity to be fully utilized. But thelatter ratio reduces to the rate of profit; the condition is analogous to theGolden Rule.
Now let the productivity of capital depend on the level of G. Suppose thathigher levels of G lead to higher productivity (lower v.) Then if G/z > K/v, itwould appear that capacity is too low, so l/v should be increased. The way todo this is to increase G. Similarly, if G/z < K/v, it would appear that the appro-priate move would be to reduce G. The HarrodÐDomar Ôknife-edgeÕ results arereproduced Ð there is only one level of G at which there will be equilibrium,and it is unstable.1 Any movement away from it will be reinforced. Althoughthis model is static and makes no reference to growth, the HarrodÐDomarresults have been reproduced. The HarrodÐDomar relationships do not, there-fore, offer an account of the growth of demand.
The multiplierÐaccelerator model suffers from a similar problem.2 Theaccelerator comes into play because output, responding to demand, is pressing
252 Structural change and demand-led growth
Downloaded from Elgar Online by University of Melbourne at 07/12/2013 04:49:51AM

on capacity. So more capacity should be built. But the multiplier only worksif there is some flexibility in employment; then additional workers can behired, and their spending will increase demand. But if there is flexibility inemployment, there is unused capacity. So why should more capacity be built?The answer that is usually given is that there is a ÔnormalÕ or ÔdesiredÕ level ofcapacity, which can be exceeded, but only at a higher cost. As it is exceeded,demand will increase, but so will costs. To keep the latter down, additionalcapacity will be built. But this just pushes the problem back one step Ð how isdesired or normal capacity determined?3 And it is still the case that when themultiplier works best, the accelerator will not be in play, and when accelera-tor effects are most obviously called for, the multiplier is questionable,because capacity is limited and costs are rising. In short, the multiplierÐaccel-erator may have a role to play at points in the business cycle, but it is difficultto see how this relationships can give a reliable and long-term account of thegrowth of demand.
The problems of the HarrodÐDomar account of the growth of demandsurely cannot be found in the ÔCambridgeÕ growth model in the form devel-oped by Robinson (Robinson, 1956, 1962; also see Kaldor, 1957, 1961 andKaldor and Mirrlees, 1962). But in fact, a related difficulty emerges. Thisapproach determines growth by balancing the saving and investment that areinduced by the rate of profits.4 A simple version of this model (modifying thetreatment in Foley and Michl, 2000, chapter 10) can be illustrated on adiagram with the growth rate on the vertical axis and the profit rate on the hori-zontal axis. Two functions are then defined. The first shows the growth ratemade possible by the saving out of various rates of profit. This starts from theorigin and rises with a slope that represents the propensity to save out of prof-its. The second function shows the growth rate determined by the investmentcalled forth by the expected rate of profit. This will normally have a positiveintercept, indicating that some investment (and therefore growth) would takeplace even if profits were expected to be zero (due to competition, especiallyfor innovations). Higher expected profit rates stimulate investment, but notexcessively, so this line will rise with a flatter slope than that of the savingfunction. The two lines will intersect, as shown in Figure 14.1, determining therates of growth and profit in any period simultaneously.
The first of the relationships is based on the classical saving function.While this has well-known limitations, it provides a reasonable first approxi-mation. But the second relationship is more problematical. Profits Ð businessearnings Ð are a withdrawal from the circular flow of income.5 But how caninvestment depend on a ÔwithdrawalÕ variable? This is akin to saying thatsaving determines investment. Put differently: why should firms build morecapital for tomorrowÕs markets in proportion to the rate of earnings on todayÕscapital? The current rate of profit tells us how well capital is doing today, but
Notes on the transformational growth of demand 253
Downloaded from Elgar Online by University of Melbourne at 07/12/2013 04:49:51AM
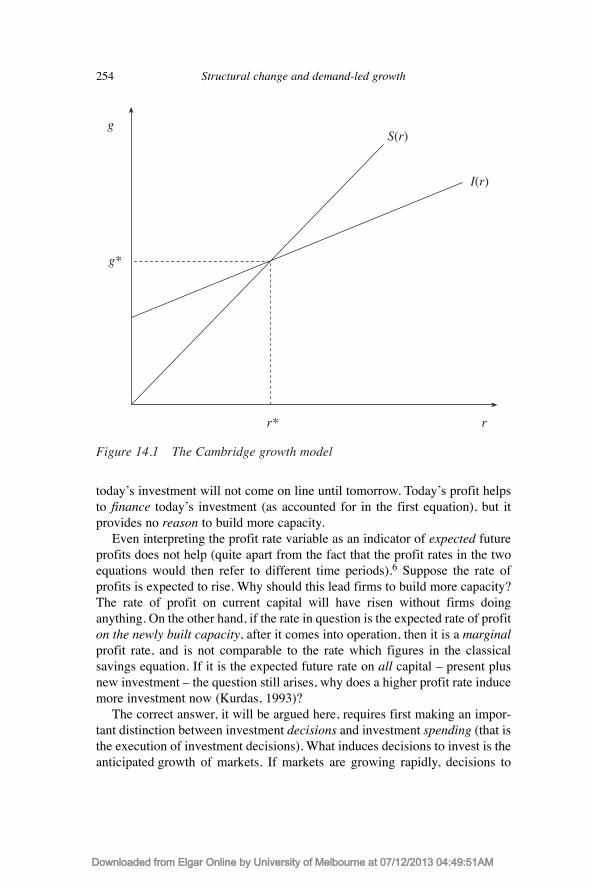
todayÕs investment will not come on line until tomorrow. TodayÕs profit helpsto finance todayÕs investment (as accounted for in the first equation), but itprovides no reason to build more capacity.
Even interpreting the profit rate variable as an indicator of expected futureprofits does not help (quite apart from the fact that the profit rates in the twoequations would then refer to different time periods).6 Suppose the rate ofprofits is expected to rise. Why should this lead firms to build more capacity?The rate of profit on current capital will have risen without firms doinganything. On the other hand, if the rate in question is the expected rate of profiton the newly built capacity, after it comes into operation, then it is a marginalprofit rate, and is not comparable to the rate which figures in the classicalsavings equation. If it is the expected future rate on all capital Ð present plusnew investment Ð the question still arises, why does a higher profit rate inducemore investment now (Kurdas, 1993)?
The correct answer, it will be argued here, requires first making an impor-tant distinction between investment decisions and investment spending (that isthe execution of investment decisions). What induces decisions to invest is theanticipated growth of markets. If markets are growing rapidly, decisions to
254 Structural change and demand-led growth
g*
gS(r)
I(r)
r* r
Figure 14.1 The Cambridge growth model
Downloaded from Elgar Online by University of Melbourne at 07/12/2013 04:49:51AM
invest will be made readily, even if expected profitability is low. If markets aresluggish, however, even though profitable, there will be little reason to buildmore capacity, and decisions to invest will be few. In sum, capacity is plannedto service demand. Spending on capacity construction, however, requiresconsidering another variable Ð the cost and availability of funds. But thisaffects the timing of capital construction, not the decision as to whether or notthe capacity should be built.7
Demand, Supply and Pricing
Neither equilibrium Ð determinateness Ð nor stability can be established forprices (in mass production markets) unless the growth of demand equals thegrowth of supply. Suppose current supply and demand are equal, but whilenew markets are opening up, firms are not building new capacity (for what-ever reason). Future prices will start to rise, and this will lead to an increase incurrent demand for stockpiling, upsetting the current equilibrium. (Even iffuture prices were sluggish, or the futures market undeveloped, stockpiling inthe light of anticipated shortages would be a good idea.) The same resultsfollow in reverse if supply is expanding with no growth of markets in sight.8
By contrast, suppose current demand lies below current normal capacity, butnew markets are opening up at the same rate that new capacity is being built.Current demand and supply can be brought into line by raising the scrapping orlowering the replacement rate. The same holds if current demand is abovecurrent normal capacity; scrapping can be postponed, or replacements enhanced.These are one-shot adjustments. But when current demand and supply are equalbut the growth rates are out of line, no one-shot adjustment can restore thebalance. If the growth of demand and supply are not equal, the market cannotreach equilibrium, but if growth is in balance and current levels of supply anddemand are not, capacity is easily adjusted to bring them into line.
The significance for theory lies in the fact that prices are important long-term factors influencing the growth of supply, on the one hand, and the growthof demand on the other. Given unit costs, higher prices (relative to moneywages) increase profit margins, and thus provide both internal finance andborrowing power, making it possible to underwrite the construction of addi-tional capacity (Wood, 1975; Eichner, 1976; Milberg and Elmslie, 1992;Harcourt and Kenyon, 1976). On the other hand, higher prices (relative tomoney wages) make it harder to break into and develop new markets (Nell,1992, 1998, chapter 10). So we can define a positive or rising relationshipbetween long-term or ÔtargetÕ prices and the planned growth of capacity, and aninverse or falling relationship between such prices and the growth of demand.9
However, while this approach will help in understanding the practice ofmodern corporations in managing their mark-ups, it sheds little light on why
Notes on the transformational growth of demand 255
Downloaded from Elgar Online by University of Melbourne at 07/12/2013 04:49:51AM

new markets open up in the first place. Corporations can lower their prices,and attract more business; this is simply a static demand effect. It becomesdynamic only in a limited sense, when conjoined to the income distribution. Ina class society with a hierarchical income distribution, as the price of a goodfalls relative to the wage, new groups can progressively incorporate the goodinto their budgets. Such Ôincorporation effectsÕ are fully accounted for in theÔlifestyleÕ approach to the household, as discussed below. A function can bederived showing the expansion of markets with each lowering of the price.This is an important step. Yet it is no more than the expansion of an alreadyexisting good into new areas; innovation and social change are not involved,suggesting that more fundamental forces remain to be explored.
Demand in Mainstream Theory
Utility theory, and the principal versions of the mainstream theory ofconsumer behaviour, seek to determine choices in static terms. Not only arepreferences given, but agents are assumed to know their preferences withouthaving to learn or experiment. Skills and information are likewise given with-out regard to learning. And, of course, endowments of resources, includinglabour, are assumed to be known and available. The theory then determinescurrent levels of household expenditure, but contributes nothing to explaininghow this level might change or grow in a systemic way.
Household budgets do present serious choice problems, but these must beconsidered in a programming format, as, for example, in the work of Lancaster(1996). Here, consumers are understood not to want goods for their own sake,but for what they offer Ð their ÔcharacteristicsÕ, that is, we want apples fortaste, nutrition or to complement other foods. Bananas also offer taste, nutri-tion and (different) complementarities. We choose the bundle of goods (applesand bananas) that offers us the best deal for the desired characteristics (taste,nutrition and so) that we wish to consume Ð for example, the minimum costbundle that provides a given level of the characteristics, or the highest fulfil-ment of desire for a given cost.
But LancasterÕs ÔcharacteristicsÕ are, themselves, unexplained. They needto be fitted into a larger picture, in which certain ÔcharacteristicsÕ will bedesired because they are part of a ÔlifestyleÕ, which in turn reflects class andsocial pressures (Nell, 1998, pp. 470Ð3). This will then allow for choices ofgoods and services to achieve the standards imposed by a lifestyle (Nell, 1998,chapter 10). Demand functions can be developed; they will show stretches ofunresponsiveness to price changes alternating with large rapid responses.ÔCompositionÕ effects Ð changing the proportions of categories of goods in thebudget Ð and ÔincorporationÕ effects Ð including new goods, dropping others Ðcan be distinguished and their causes studied (Nell, 1998, pp. 474Ð5).
256 Structural change and demand-led growth
Downloaded from Elgar Online by University of Melbourne at 07/12/2013 04:49:51AM

Certain lifestyles will call for self-improvement, and for competition to risein social status. Self-improvement and rising in status will also tend to increaseproductivity. The social pressures generating this kind of competitive careerand social climbing are likely to be class-related. Responding to these pres-sures will lead to the setting aside of part of the household budget for invest-ment in education, training and other efforts directed at achieving promotionsand raising social status. It will also call for labour-saving innovation in house-hold tasks, since more time will be needed for household members to engagein new activities. This will open the door for new products.
Setting out on such a path of self-improvement might be associated withreaching a certain level of real wages, a level associated with lifestyles inwhich achievement is measured in terms of income and status; that is, a certainlevel of real wages might be associated with investment in self-improvement,and so with increases in productivity and growth in incomes. Investment inself-improvement is likely to lead to changes in the composition of demand,while the growth of productivity and income, of course, will lead to demandgrowth. Let us now explore all this in greater detail.
THE EMERGENCE OF NEW MARKETS
We saw previously that a price-expansion-of-demand function could bederived on the basis of a given class structure and income distribution. But thisdoes not take into account or explain innovation. It examines the growth ofdemand in terms of the expansion of existing (more or less mature) markets,leaving to one side the emergence and development of new ones.
New markets must first be created, in some process of innovation. Thismight result from the development of a new product, or, the route exploredhere, it could be part of a larger movement, the effort of a fraction of the work-ing class to rise in the world, through a competitive process of self-improve-ment. Self-improvement requires the restructuring of household budgetswhich, in turn, requires finance.
Once they have established a foothold, new markets will develop followinga more or less sigmoid-shaped path, starting slowly, then expanding at anaccelerating pace, then slowing down and finally stagnating. The latter stages,of course, are the stages of expansion for mature products.
Existing markets tend to expand in line with Engel curves, so increases in theincomes of existing customers will not be spent in the same proportions. Instead,households will typically introduce new goods into the household budget, so thatexisting markets, depending on a set of regular customers, are likely to expandat a slower pace than the incomes of their customers, unless these markets arestimulated by some major innovation. An obvious implication is that, ceteris
Notes on the transformational growth of demand 257
Downloaded from Elgar Online by University of Melbourne at 07/12/2013 04:49:51AM
paribus, growth will slow down as markets mature; sustaining a growth raterequires the development of new markets.
But existing markets can be stimulated very simply. A cost-cutting innova-tion may allow a drop in price that will bring the product into the affordableregion for a whole new class of potential customers. This will set off a newcompetitive sales drive and result in the expansion of firms in the industry.This suggests a regular relationship between prices and the expansion of amarket. Similarly, a product innovation may make a product useful or moreuseful, or simply more attractive, thereby creating a new pool of customers.
Cost-cutting and product improvement, and specialization of productdesign, will continually bring new groups of consumers into the market, untilall potential customers have been attracted. At this point, the market will havebecome mature, and will normally begin to stagnate.
The expansion of existing markets therefore largely reflects aspects of thelife cycle that each market passes through, from its small-scale, early begin-nings through a phase of rapid expansion, to maturity and stagnation (Penrose,1956).
The growth of demand, then, can be broken down into two parts: the studyof the emergence of new markets on the one hand, and the life cycle of theirdevelopment on the other. As noted above, without the emergence of newmarkets, existing markets Ð and hence the economy as a whole Ð would even-tually stagnate.
What has to be explained at the outset, therefore, is the emergence of newmarkets. New markets develop when a number of households change thecomposition of their budgets, add new products to their consumptionpatterns/lifestyles and, in particular, come to Ôinvest in human capitalÕ. Newmarkets emerge as a result of households reconfiguring their budgets. Demandgrows because of a certain kind of change in its composition Ð a characteris-tic feature of TG. This may take place as follows.
First, a certain culturally or socially determined fraction of householdsdevelop the desire to rise in station. The reasons for this are complex, andgrounded in the changes in culture as the social system develops from a oneof tradition and Ônatural orderÕ to one of Ôregular progressÕ (Nell, 1998, pp.9Ð19). A precondition for the widespread development of a desire to rise instation is that employment in agriculture should decline, and families movefrom the countryside to the city. This breaks the traditional bonds that tie fami-lies to their social station. It also puts people in direct contact with opportuni-ties and alternative ways of life and work.
A second fundamental precondition is that the workplace and home livingspace be separated. If they are not, then the whole family will tend to be fullyinvolved with the family trade, and children will not be able to learn a differ-ent or better way of life. This separation of living space from working space
258 Structural change and demand-led growth
Downloaded from Elgar Online by University of Melbourne at 07/12/2013 04:49:51AM

will take place as energy is brought into play to drive machinery. Steam poweris dirty, dangerous and loud, and children cannot be near it. Electricity isdangerous, and electric power equipment needs to be treated with circum-spection. So as equipment comes to be driven by steam and electricity, thehome and the workplace must be separated. These processes of de-ruralizationand the separation of work and home have been characteristic of capitalistdevelopment, as illustrated by Figure 14.2.
Households seeking to rise in station will typically seek to do this byproviding a better education and better opportunities for their children. Thesehouseholds will invest in self-improvement, more for their children than forthemselves, but very often in order to provide better conditions for their chil-dren, they will have to improve themselves. (We might call this the ÔHoratioAlger EffectÕ.) Funds formerly spent on entertainment and drink will now beused for education and self-improvement, and preparing children for a betterlife.
An important element in the drive for self-improvement is time-saving inthe household. Households should be considered production units, producing
Notes on the transformational growth of demand 259
1840
1870
1900
1910
1920
1930
1940
1950
1960
1970
1980
1995
Year
Occupations as a percentage of the labour force120.0%
100.0%
80.0%
60.0%
40.0%
20.0%
0.0%
Perc
enta
ge o
f th
e la
bour
for
ce
Farmers Service Blue collar White collar
Figure 14.2 The changing composition of employment in the US, 1840Ð1995
Downloaded from Elgar Online by University of Melbourne at 07/12/2013 04:49:51AM

the family lifestyle by preparing food, making and mending clothing,performing daily tasks of washing, ironing, cleaning and so on. Innovationssuch as detergents, improved cleaning fluids, vacuum cleaners, washers anddryers, and gas and electrical heating and lighting, cut down on the timerequired to run the household, and thereby provide time that can be spent onself-improvement. Looked at from the other side of the market, the drive forself-improvement opens the door to labour-saving innovations in the house-hold.
When a household decides to rise in the world, it adopts an investmentstrategy. It begins to invest in human capital development, especially educa-tion and training, and the development of communication skills. It will cometo require more flexible transportation, and it will have to rearrange its livingquarters, to provide space for the new activities of learning and acquiring newskills. For any of this to happen, banks and financial companies willing tounderwrite such investment must develop. The household can then commit aportion of its income to debt servicing, enabling it to borrow the capital neces-sary to reorient itself and develop the skills of its members.
When a sizable number of households adopts this strategy of self-improve-ment, they will begin to benefit from interacting with one another. Eventhough they are competing, they will also provide support for each other.These Ônetwork effectsÕ will increase the effectiveness of individual house-holdsÕ efforts at self-improvement.
Finally, as more and more households seek to rise in the world, newmarkets are created for products that contribute to self-improvement. Many ofthe new demands will be for education Ð courses, classes, night schools and soforth Ð and communications, such as books, newspapers, and other media.Producing these goods will, in turn, require inputs, which will be supplied bycapital goods industries.10
Processes of Demand Growth
Here we have the development of a process, a set of linkages running fromhouseholds changing their understanding of their social position and lifeoptions, to the redesign of their budgets to allow for investment in self-improvement, leading finally to the emergence of new markets. To make thiseffective on a large scale requires finance, so it also offers opportunities forfinancial institutions to develop. These changes in household spendingpatterns then lead to additional demand for the capital goods necessary tosupply emerging markets, with the effects then feeding back to the productiv-ity of households. So, first the composition of demand changes, leading to theemergence of a new market. This new market has to be supplied, leading tonew investment. (The shift in demand, of course, also leads to a reduction in
260 Structural change and demand-led growth
Downloaded from Elgar Online by University of Melbourne at 07/12/2013 04:49:51AM

demand for some traditional products, resulting in falling prices and profits inthose industries. But this frees up resources to shift capacity into productionfor new markets.) The new investment will embody the latest technology, so itis likely to be more productive than the old. This will provide the first increasein income, leading to increased demand, which, in turn, will lead to furtherincreases in investment.
A direct consequence of successful self-improvement will therefore be arise in the productivity of labour, especially of supervisory and manageriallabour. Hence there will be a second increase in income, also resulting in anincrease in demand, in turn calling for additional investment. (Some familieswho seek self-improvement and to rise in the world may fail. But this failurewill not affect the development of the market in the aggregate. It merely meansthat their own productivity and income will not increase.)
As is evident, this develops into a cumulative process, each round of self-improvement expanding the new markets, leading to new investment, whichraises industrial productivity, while self-improvement raises labour-productiv-ity. Both give rise to higher incomes, which lead to further investments in self-improvement and so on.
As the new group of successful families emerges, it will become aware ofitself, and increasingly develop a new lifestyle. This will be partly functional(that is, it will help to consolidate household productivity gains) but it will alsopartly be a display of class position and privilege. Either way, it will result inthe further development of new markets, for products especially designed toplay a role in this new lifestyle. Once again, as these further or subsidiarymarkets develop, there will be a need for investment, and so for new capitalgoods, to build up the capacity to produce for these markets.
It is important now to link this cumulative process to the economy as awhole. To do this, we combine a relationship between the real wage and thegrowth of demand with the well-established real wage Ð rate of profit tradeoff(Nell, 1998 pp. 477Ð8). The model contains four variables: the growth ofdemand, the growth of output, productivity growth and the real wage.Equilibrium requires that the growth of demand equal the growth of output.We can define three behavioural relationships.
First, there is what Joan Robinson called the Ôwage-accumulationÕ curve,the wageÐprofit tradeoff adjusted by the saving ratio. This relationship isinverse, and following Nell (1998), it is likely to be linear. It will shift withchanges in productivity.
Second, there is the wage rate Ð growth of demand relationship discussedabove, which includes an effect on productivity. This will be an increasingfunction, with a sigmoid shape. At low levels of the wage, there will be somegrowth of demand, but it will be low, and increase only slowly. At higherlevels, growth will accelerate, only to level off at still higher wage rates.
Notes on the transformational growth of demand 261
Downloaded from Elgar Online by University of Melbourne at 07/12/2013 04:49:51AM
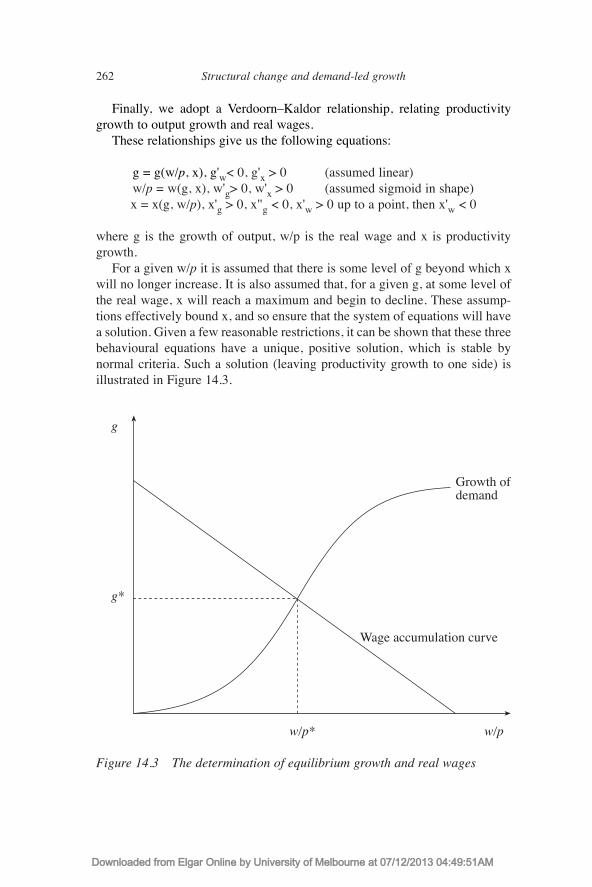
Finally, we adopt a VerdoornÐKaldor relationship, relating productivitygrowth to output growth and real wages.
These relationships give us the following equations:
g = g(w/p, x), g¾w< 0, g¾x > 0 (assumed linear)w/p = w(g, x), w¾g> 0, w¾x > 0 (assumed sigmoid in shape)x = x(g, w/p), x¾g > 0, x®g < 0, x¾w > 0 up to a point, then x¾w < 0
where g is the growth of output, w/p is the real wage and x is productivitygrowth.
For a given w/p it is assumed that there is some level of g beyond which xwill no longer increase. It is also assumed that, for a given g, at some level ofthe real wage, x will reach a maximum and begin to decline. These assump-tions effectively bound x, and so ensure that the system of equations will havea solution. Given a few reasonable restrictions, it can be shown that these threebehavioural equations have a unique, positive solution, which is stable bynormal criteria. Such a solution (leaving productivity growth to one side) isillustrated in Figure 14.3.
262 Structural change and demand-led growth
Figure 14.3 The determination of equilibrium growth and real wages
g*
Wage accumulation curve
w/pw/p*
g
Growth ofdemand
Downloaded from Elgar Online by University of Melbourne at 07/12/2013 04:49:51AM

But this needs some explaining. How can a level of the real wage support agrowing demand? This should not be considered so surprising. Note the anal-ogy with businesses, where each level of earnings is associated with a rate ofgrowth of spending on capital goods. Higher earnings mean higher profits, soresulting in a higher rate of profits, giving rise to a higher rate of growth. Thesame holds here. The real wage Ð growth of demand function tells us that foreach level of the real wage there will be a corresponding level of investmentin self-improvement leading to a corresponding rate of growth of demand byhouseholds. (Note that in constructing this function, we are holding capitaltechnology constant Ð only improvements in worker skills are considered Ð soa higher wage rate will normally imply a higher wage share.) Householdsinvest in self-improvement, and because they are doing so, they are eligible forcredit and can increase their spending, particularly their spending on self-improvement. The function is economy-wide. Ultimately, then, at higherlevels of the real wage there will be higher rates of growth of demand for tworeasons. First, demand growth will be higher because each household may beable to sustain a larger investment in self-improvement. Second, as wages rise,more households will be drawn into the effort to rise in the world.
We must be careful about the interpretation of the model above: its solutionis not a long-period equilibrium. Far from it; the reason that demand is grow-ing is that families are trying to improve themselves. Innovation is takingplace. On the other hand, it is not a short-run model; it covers a long enoughinterval for training and education to result in higher levels of productivity. Sothe time period to which the model corresponds might be thought of as a fullbusiness cycle.
The model developed above can be used to explore an important questionin the history of growth and technology. If new innovations have been intro-duced simply because they reduce costs, we would expect them sometimes tobe labour-saving, and sometimes to save on equipment and capital goods.Overall, there would seem to be no reason to expect any particular bias. Infact, there has been a very pronounced bias: technical change has been over-whelmingly labour-saving, but capital-using, that is, machinery and equipmenthas been substituted for labour. The model above can be used to suggestwhy.11
Consider Figure 14.4 below. As household investment takes place andwages rise, lifestyles will develop and the basic wage and expected standardof living will increase. So the wage growth of demand curve will shift out tothe right. The wage will rise; but the effect will be to lower the growth rate.That is, when the wage rate increases, consumption increases pari passu andthis leaves less available for investment. From the point of view of the indi-vidual firm, the rise in wages means lower profits. But this can be offset byreplacing workers with machinery, if the technology is available or can be
Notes on the transformational growth of demand 263
Downloaded from Elgar Online by University of Melbourne at 07/12/2013 04:49:51AM
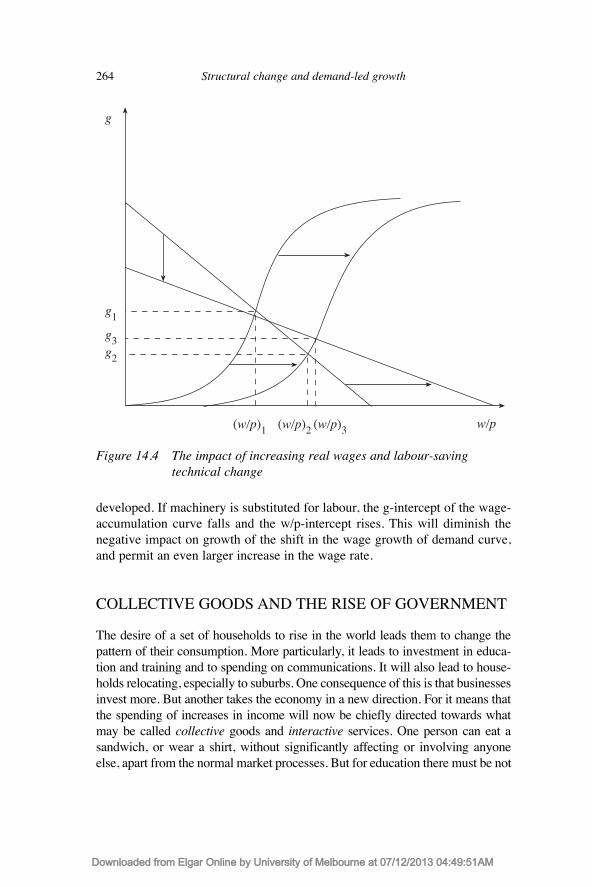
developed. If machinery is substituted for labour, the g-intercept of the wage-accumulation curve falls and the w/p-intercept rises. This will diminish thenegative impact on growth of the shift in the wage growth of demand curve,and permit an even larger increase in the wage rate.
COLLECTIVE GOODS AND THE RISE OF GOVERNMENT
The desire of a set of households to rise in the world leads them to change thepattern of their consumption. More particularly, it leads to investment in educa-tion and training and to spending on communications. It will also lead to house-holds relocating, especially to suburbs. One consequence of this is that businessesinvest more. But another takes the economy in a new direction. For it means thatthe spending of increases in income will now be chiefly directed towards whatmay be called collective goods and interactive services. One person can eat asandwich, or wear a shirt, without significantly affecting or involving anyoneelse, apart from the normal market processes. But for education there must be not
264 Structural change and demand-led growth
g1
w/p(w/p)1
g
g3g2
(w/p)2 (w/p)3
Figure 14.4 The impact of increasing real wages and labour-saving technical change
Downloaded from Elgar Online by University of Melbourne at 07/12/2013 04:49:51AM

only teachers and students, but subjects and disciplines. Indeed, there must beright and wrong answers and that implies a collectivity of minds. For a writerthere have to be readers Ð and vice versa Ð but also there must be subjects andstyles. No one can make a telephone call unless someone else answers. No onecan travel without a destination. My health and yours are interconnected inregard to communicable diseases. Normal market processes, for these goods,involve multiple consumers acting in coordination, or even organized intonetworks, and there may also be networks of suppliers. As a result these goodstend to call for more intensive government regulation, and draw more inten-sively on government services.
Collective goods should not be confused with the familiar idea of publicgoods. The latter are defined as goods or services that are non-rivalrous,(and/or non-depletable, not quite the same thing), and non-excludable.12 Alighthouse is a good example. If one ship uses it, this does not prevent anotherfrom doing so. Nor does it use up the lighthouse, leaving less for later ships.And once put in place and working, no ships can be excluded, that is,prevented from using the lighthouse. A bridge or a roadway is non-rivalrous(at least within limits) and non-depletable, but toll barriers can be erected,permitting exclusion.
But collective or interactive goods often do not meet these criteria. If I usethe telephone line or access to the Internet, you cannot; if I use up the allottedtime, others cannot. And access can easily be denied, so that fees can becharged. Education is similar: access to the class can be denied; and at acertain point the classroom is full, so that if this person is in the class, anotherone cannot be. (It is not true that the more one person gets from the class theless there will be for the others, however. On the contrary, the more somestudents get, the more the rest are likely to benefit.) One ship can use a light-house, whether or not any others do; one person can cross a bridge alone. Butno one can make a telephone call alone, or travel without going somewhere.Commuter travel, in particular, moves people between home and work, whichare socially defined places. No one can take a class or learn a subject withoutparticipating in an enterprise of many minds. No one can use money withoutothers also doing so. No one can take out insurance unless others do so.Education, communications, transportation, FIRE13 and entertainment Ð andeven aspects of health Ð are collective experiences.
Collective goods, as these examples show, are often cooperative. But theycan also be competitive, as with what Hirsch (1976) called Ôpositional goodsÕ.Seats at a sports game, or in the theatre are positional; those with a better vieware more desirable and command a higher price. The same is true of rooms ina hotel, travel packages and desirable real estate. Location is everything, andthese goods are therefore rivalrous, maybe depletable Ð this yearÕs WorldSeries will never happen again Ð and are certainly excludable. Positional
Notes on the transformational growth of demand 265
Downloaded from Elgar Online by University of Melbourne at 07/12/2013 04:49:51AM
goods meet none of the criteria for being public goods, but they are clearlycollective goods, and, as we shall see, like cooperative collective goods, callfor more intensive government regulation, and interact strongly with othercollective goods and with government services. Let us now consider some ofthe implications of all this.
Food, clothing and shelter, and many forms of energy are goods that can beconsumed privately, by individuals or households, That is to say, the act ofconsuming these goods need not necessarily involve or require the cooperationof other individuals or households. (This is also true of some traditional publicgoods.) When per capita incomes are low, the greater part of householdbudgets will be devoted to these goods. But education, entertainment, commu-nications, transportation and most forms of modern health care do necessarilyinvolve or require the cooperation of others (Nell and Majewski, forthcoming,chapter 4). When per capita incomes increase, household spending will tend toshift towards these goods.
These kinds of goods often Ð perhaps usually Ð create network externali-ties, that is, the more members who join a network, the greater will be thebenefits to each. A typical case is a telephone exchange. Service stations areanother. Governments may need to supply or at least regulate such goods, inorder to make sure that pricing for private profit does not result in an inade-quate supply.
Collective goods also typically require regulation. They involve coordi-nated action by numbers of people, and regulation may be needed to ensurecoordination. Moreover, the technology may be complicated or dangerous.Government oversight may be necessary. For all these reasons, collectivegoods call for more government spending.
Government economic activity in general responds to, or provides a foun-dation for, private economic activity. Private activity rests on public infra-structure Ð roads, bridges, harbors, sewers Ð and on basic collective services(usually with network externalities) like public health, police, justice, defenceand education. The government may provide these services and infrastructuredirectly, or it might simply underwrite them and contract out their provision.
In either case, the amount of government spending required will vary inproportion to the amount and nature of private activity. Define a coefficient ofgovernment spending as the amount of government spending (G) called forper unit private economic activity. Then the general claim here is that collec-tive goods have a higher coefficient of government spending than privategoods, so that the shift from craft production to mass production has resultedin a rise in the ratio of G to income (Y) (Nell and Majewski, forthcoming,chapter 4). That is, as private businesses and households shift to collectivegoods and interactive services, government will not only do likewise, but itwill in general be called on to spend more in a variety of ways.
266 Structural change and demand-led growth
Downloaded from Elgar Online by University of Melbourne at 07/12/2013 04:49:51AM

There is a second feature of collective goods that contributes to the rise inG/Y. Among the major categories of government activity affected by increaseddemand for collective goods are education, defence, police and justice,medical services, pensions and social security and transportation. These tendto interact strongly with private sector collective goods and with each other.The analytical point here is that interactions increase with the square of thenumber of actors. For example, mass production leads to urban concentration.This increases interactions between people and requires increased policing andcourts, and also increased attention to public health. If there are ten additionalurban workers, potential interactions increase by one hundred (actual interac-tions will normally be fewer). The costs of policing and public health thusincrease in proportion to the number of interactions, rather than the number ofactors.
Meanwhile, more travel both requires and facilitates better communica-tions, and both requires and contributes to better education. Better communi-cations lead to better education and vice versa, and both stimulate the desireto travel. Better communications and better transport increases the choice ofplaces to live and work, so that the real estate market develops.
Better education leads to higher productivity and to more rapid technicalchange, which, in turn, reduces the ability of the family to provide education,and so requires a further increase in public education. As people live longerand learn more, they demand better health and medical services; they alsoneed pensions and social security, especially as they leave the land and moveto the cities. All of these collective goods interact with government services.Increased transportation requires more and better traffic control, communica-tions and education require regulation; urbanization requires public healthmeasures and so on.
During the era of craft production, the ratio of private sector collectivegoods to all goods was low. As this ratio increased, interactions increasedfaster, but the initial impact on government was not large. As the craft econ-omy developed into mass production, however, the ratio of collective goodsincreased greatly. The interactions between private sector collective goods,and between such goods and government services, increased exponentially, sothat G/Y rose dramatically. This is portrayed in Figure 14.5. In the early stagesof development, even a large rise in the ratio of collective goods to all goodsleads to only a small increase in G/Y. But later, as the mass production eraunfolds, even a modest increase in the collective goods ratio results in a largerise in G/Y.
The growth of government described above provides a significant contri-bution to the growth in demand.14 As we have seen, the same process thatleads to growth in household demand Ð competition among households to risein the world through investment in self-improvement Ð leads to a shift in the
Notes on the transformational growth of demand 267
Downloaded from Elgar Online by University of Melbourne at 07/12/2013 04:49:51AM

composition of expenditure towards collective goods. Activities requiringcollective goods interact, which means that an increase in the number of suchactivities implies an increase in demand that is proportional to the square ofthe increase in activities. Also, activities requiring collective goods interactwith government services, likewise implying a multiplicative increase indemand. Together, these changes require a larger size of government in rela-tion to total output. The relative increase in government spending then raisesthe overall growth of demand.
CONCLUSIONS
Neither conventional nor alternative approaches offer much help in under-standing the growth of demand. Indeed, most contemporary thinking does noteven recognize the phenomenon or the need for an explanation. In the longrun, it is held, supply determines demand. This is why growth theory has sostrongly emphasized the supply side.
268 Structural change and demand-led growth
G/Y(G/Y)1
CollectiveGoods:All goods
(G/Y)2
Massproduction
Craft
Figure 14.5 Economic development and its impact on the ratio of government spending to income
Downloaded from Elgar Online by University of Melbourne at 07/12/2013 04:49:51AM

But when finance is available, demand can develop separately from supply.Moreover, as households identify possibilities for self-improvement, they willdevelop their skills and innovate. This will both change the composition ofdemand, and lead to the formation of new markets and to the expansion ofdemand generally. This growth needs explaining.
There are two parts to an explanation of the growth of demand. The easiestis the explanation of the growth of demand that follows the introduction of anew product. This follows a sigmoid path, tracing out the product cycle as thegood diffuses through the income distribution. But more important is the intro-duction of new products, resulting from changes in the composition ofdemand. New products that service existing desires are easily explained, draw-ing on the programming approach to household budgets. Explaining changesin the composition of demand is more challenging.
Here, the clue comes from understanding changes in household budgets.the most important of these changes occur when a fraction of households triesto rise in the world. These would-be Horatio Algers invest in self-improve-ment and thereby change the composition of demand. Since the change incomposition stimulates investment, this in itself leads to demand growth. Butthe effect of self-improvement is to increase productivity, and so incomes,leading to further demand growth.
As these Horatio Algers develop, they shift their demand more and more tocollective goods, as these are the goods that will help them to rise in the world.Collective goods, in turn, interact; network externalities become prevalent.But these goods, in turn, require more and more government services; theyhave a higher government service coefficient than purely private goods.Furthermore, they interact with government services, which further intensifiesthe demand for government. Hence as the ratio of collective goods to privategoods rises, the ratio of government spending to income (G/Y) will rise evenfaster. But the growth of G/Y, in turn, tends to raise the rate of growth. A higherrate of growth can be expected to increase real wages, leading to still furtherchanges in household budgets, as households seek even greater self-improve-ment. This is a long-term cumulative process, leading both to perpetualdemand growth, and to ongoing increases in productivity.
NOTES
1. Rather than being an account of growth, the HarrodÐDomar formula might be considered adividing line between two divergent modes of operation of a mass production economy(Nell, 1990; Nell, 1998). One is an excess capacity regime, in which demand always has atendency to fall short of capacity, or rather, in which capacity is always running ahead ofdemand. The other is an excess demand regime, in which capacity is always running short.The first is typical of modern capitalism, the second of Soviet-style socialism.
Notes on the transformational growth of demand 269
Downloaded from Elgar Online by University of Melbourne at 07/12/2013 04:49:51AM

2. The multiplierÐaccelerator model is very close to the HarrodÐDomar, but differs in that itincludes time-lags in formulating its investment and saving functions (Allen, 1965,Matthews, 1959).
3. Normal capacity will be built to service the expected normal level of demand; so new capac-ity will be added in the light of expected demand growth. It is the latter that calls for expla-nation. The crucially important implication of the multiplierÐaccelerator analysis, however,is that the aggregate demand aggregate capacity balance tends to generate an unstable cumu-lative process. That is, given the normal growth of demand to which normal capacity isadapting, a deviation from this in either direction will tend to set up a self-sustaining processthat will continue moving in that direction. Expansion of capacity will generate even greaterexpansion of demand; contraction of investment will further contract demand. This is centralto understanding macroeconomics, but it offers no help in explaining the normal growth ofdemand.
4. In the Cambridge view, short-run models of effective demand have investment-determiningprofits and so that the level of activity is demand-determined. But in the long run, they allowthat profits may determine investment, so that supply determines demand. (New Keynesianswould agree, substituting ÔsavingÕ for ÔprofitsÕ.) The argument here suggests that the direc-tion of causality assumed in the short run is also correct for the long run.
5. Strictly speaking, there can be no Ôconsumption out of profitsÕ. Consumption is spending byhouseholds, whereas profits are the income of business. Business must distribute a portionof profits to households, for example, as dividends; then households may consume all or afraction of that dividend income. In the case of the self-employed, a portion of the apparentprofits must be designed as salary. Unusually large drawings must be considered on a parwith dividend payments.
6. This would restrict the model to consideration of steady growth, in which variables wereunchanged from period to period.
7. Of course the two interact, but separating them makes it possible to isolate the influence ofdemand growth, clearly a long-run question, while showing at the same time that interestcosts are a short-run matter (Kalecki, 1939; Nell, 1988, 1998, chapters 10, 11).
8. For a related argument see Hicks (1989, pp. 10Ð11, et passim). HicksÕs point is thatMarshallÕs flow equilibrium for a particular period is inadequate; in most markets bothsuppliers and demanders may be interested in stocks, which requires admitting speculationover a sequence of periods. The point here is that the anticipated balance over time has to beconsidered in determining the best course of action at any given time. But the argument hereconcerns the growth of capacity, which is different from the holding of stocks. Currentsupply and demand are flows, and growth of supply and growth of demand refer to rates ofchange of flows. Stock-flow arguments may be superficially similar, but should be keptseparate.
9. It does not follow that the long run will be characterized by steady proportional growth. On thecontrary, in a class society there is good reason to think that, in general, steady proportionalgrowth will not be attainable (Nell, 1986, 1992, 1998). A very simple argument shows this.Suppose there are only two classes, a wealthy class and a poor class, but both work and bothown property. (The first group would be Ôowner-operatorsÕ in early capitalism, receivingÔwages of superintendenceÕ as well as profits; in a later era they would be professionalmanagers owning stock. The second would be workers with pensions and savings.) The rate ofinterest on capital will be the same whoever owns it. But the possession of wealth will conferadvantages in the earning of salaries; the wealthier will be in a better position to acquire skillsand influence. So salaries will be higher than wages, in proportion to the difference in percapita wealth. The wealthy will be in a better position to save and to invest in human capital.Under these conditions the wealth of the richer class will tend to grow faster that the wealth ofthe poorer, thereby ensuring that the gap between the salaries of the managerial class and theworkers also widens. Given that the consumption patterns of the rich and the poor will differ,the markets serving the rich will be expanding faster than those serving the poor.
10. Think of the increase in education at all levels in the early years of the twentieth century, theemergence of night schools (like the New School), the popularity of books on self-improve-ment, the development of guidance and vocational education in the public schools, and the
270 Structural change and demand-led growth
Downloaded from Elgar Online by University of Melbourne at 07/12/2013 04:49:51AM
rise of new professions like personnel management. All of this was part of the emergence ofa new middle class.
11. This analysis should be thought of as a study of incentives to innovate, not as an examina-tion of the choice of technique (Nell, 1998, chapter 8). The wage-accumulation functions areassumed to be linear, in keeping with the results of inputÐoutput studies. But it would notmatter were they to have some curvature, as long as it was not excessive.
12. ÕNon-rivalrousÕ and Ônon-depletableÕ tend to be considered the same, since both imply thatthe marginal cost of serving an additional customer is zero. But zero marginal cost is asupply-side criterion, whereas rivalry is a matter of demand. The neoclassical concern is thatpublic goods lead to market failures; the exact nature of the goods is not significant. Bycontrast, the issue for TG is that an increase in collective goods changes the proportions andcharacter of the economy.
13. FIRE stands for finance, insurance and real estate, all of which are collective, the latterinvolving Ôpositional goodsÕ.
14. Government growth proceeded at a higher rate than gross national product (GNP) growthduring the first half of the post-war period, tending to boost the economy. All governmentpurchases of goods and services grew at 4.24 per cent from 1948Ð73, compared to GNPgrowth of 3.67 per cent, and all government employment grew at 3.62 per cent, comparedto civilian labour force growth of 1.57 per cent. This was the Ôgolden ageÕ of the moderneconomy. By contrast, in the second half of the post-war era, up until the Clinton boom,government growth was slower than that of GNP, measuring 1.80 per cent from 1973Ð93,compared to GNP growth of 2.36 per cent. The government labour force grew at 1.8 per centduring this period, slower than the approximately 2 per cent growth of the civilian labourforce. So after 1973, the government tended to act as a drag on the economyÕs growth(Walker and Vetter, 1997, pp. 80Ð1, table, p. 170).
REFERENCES
Allen, R.G.D. (1965) Macroeconomic Theory, London, Macmillan.Eichner, A. (1976) The Mega-corp and Oligopoly, Cambridge, Cambridge University
Press.Foley, D. and T. Michl (2000) Theory of Economic Growth, Cambridge, MA, Harvard
University Press.Halevi, J., D. Laibman and E.J. Nell (eds) (1992) Beyond the Steady State, London,
Macmillan.Harcourt, G.C. and P. Kenyon (1976), ÔPricing and the investment decision,Õ Kyklos,
29, 449Ð77.Hicks, J. (1989) A Market Theory of Money, Oxford, Clarendon Press.Hirsch, F. (1976) Social Limits to Growth, New York, Pantheon.Kaldor, N. (1957) ÔA model of economic growth,Õ Economic Journal, 67, 591Ð624.Kaldor, N. (1961) ÔCapital accumulation and economic growth,Õ in F. Lutz (ed.) The
Theory of Capital, London, Macmillan, 177Ð222.Kaldor, N. and J. Mirrlees (1962) ÔA new model of economic growth,Õ Review of
Economic Studies, 29, 174Ð92.Kalecki, M. (1939) Essays in the Theory of Economic Fluctuations, London, Allen and
Unwin.Kurdas, C. (1993) ÔA classical perspective on investment: exegesis of behavioral
assumptions,Õ in R. Blackwell, J. Chatha and E.J. Nell (eds) Economics as WorldlyPhilosophy, London, Macmillan, 335Ð55.
Lancaster, K. (1966) ÔA new approach to consumer theory,Õ Journal of PoliticalEconomy, 74, 132Ð57.
Notes on the transformational growth of demand 271
Downloaded from Elgar Online by University of Melbourne at 07/12/2013 04:49:51AM

Matthews, R.C.O. (1959) The Trade Cycle, Cambridge, Cambridge University Press.Milberg, W. and B. Elmslie (1992) ÔTechnical change in the corporate economy: a
vertically integrated approach,Õ in W. Milberg (ed.) The Megacorp andMacrodynamics: Essays in Memory of Alfred Eichner, Armonk, N.Y., M.E. Sharpe.
Nell, E.J. (1988) Prosperity and Public Spending, London and New York, UnwinHyman.
Nell, G.J. (1992) Transformational Growth and Effective Demand, New York, NewYork University Press.
Nell, E.J. (1998) The General Theory of Transformational Growth, Cambridge,Cambridge University Press.
Nell, E.J. and R. Majewski (forthcoming) LeviathanÕs Wallet: Prosperity, PublicSpending and Transformational Growth.
Penrose, E. (1956) The Theory of the Growth of the Firm, Oxford, Basil Blackwell.Robinson, J. (1956) The Accumulation of Capital, London, Macmillan.Robinson, J. (1962) Essays in the Theory of Economic Growth, London, Macmillan.Walker, H. and J.G. Vetter (1997) The Rise of Big Government in the United States,
Armonk, N.Y., M.E. Sharpe.Wood, A. (1975) a Theory of Profits, Cambridge, Cambridge University Press.
272 Structural change and demand-led growth
Downloaded from Elgar Online by University of Melbourne at 07/12/2013 04:49:51AM

15. Is a biased technological changefuelling dualism?1
Pascal Petit and Luc Soete
A PERIOD OF ÔTRANSITIONÕ WITH LASTING EFFECTS?
Over the past two decades, major structural changes have affected the growthprocess in developed economies. A cluster of radically new information andcommunication technologies (ICTs) has emerged, accompanied by the inter-nationalization of markets, financial capital and production processes, and thetransformation of work in general and the structure of the labour force inparticular. Such changes have both transitory and longer-lasting effects, andonly through experience and learning will economic agents ultimately adjusttheir behaviours to the demands of the new environment.
Learning processes exist at various levels: within the technology-adoptingfirm, where efficient use of new technologies is heavily dependent on otherusers (subcontractors, customers or other firms and partners); among technol-ogy producers, who must adjust equipment to meet different user needs andconfront different national technical standards; and among consumers, wherecultural barriers slow the diffusion of new ÔpracticesÕ in some cases, and erectbarriers to access in others. This nexus of only loosely related learningprocesses lends credence to the assumption made by Freeman and Soete(1987) and David (1991) that transitions from one technological system toanother may be long drawn out.2
But we should also be aware that all transitional periods have historicallyspecific features that can condition final outcomes (Amendola and Gaffard,1988). Schumpeterian evolutionary theory (Nelson and Winter, 1982, Dosi etal., 1988; Arthur, 1989) stresses that adjustment paths may be irreversible, andthat the evolutionary nature of long-run development can completely trans-form choice sets and policy options following a so-called Ôperiod of transi-tionÕ, This path dependency is all the more important if there exists someinterplay between the various learning processes described above that resultsin a self-reinforcing growth process of the sort identified (in other contexts) byMyrdal (1957) and Kaldor (1972).3 Three stylized facts suggest that such agrowth process currently exists Ð one that could further divide societies and
273
Downloaded from Elgar Online by University of Melbourne at 07/12/2013 04:52:38AM
limit their ability to offer fair conditions of personal and collective develop-ment to their citizens in the future.
Growing Income Inequalities
Inequality has increased in nearly all Organization for Economic Cooperationand Development (OECD) economies over the last two decades. While thesituation differs among countries and the type of income one considers(family or personal, before or after taxes and specific allowances and so on),there is a clear general trend within the industrialized world towardsincreased dispersion in wage incomes.4 As economic growth has sloweddown, some post-war trends in income distribution have been maintained(such as the life-cycle earning patterns of salaried professionals), some havebeen dampened (such as income growth among middle-income groups) andothers have been reversed (such as income growth among low-wage earnersand people on welfare).
These developments reveal differences in the tactical and strategic abilitiesof public and private agents. Some private agents have taken advantage of thenew labour market, accessing new jobs and new sources of income, whileothers have struggled to follow suit for both economic and cultural reasons.Meanwhile, governments in most countries have been forced to reduce themagnitude and scope of income redistribution by a fiscal revolt, examples ofwhich include the California balanced budget amendment and the fiscal crisisof the Swedish welfare model.
Skill-Biased Technological Change
Technological change, which has a broad systemic dimension and involves thereorganization of many tasks and activities, appears to display a strong skillbias. This bias will tend to cumulatively reduce the share of unskilled jobs,decrease the relative wages of unskilled workers and downgrade the workingconditions of the unskilled.5
There may be numerous reasons for skill bias that are not technologicallydetermined. Employment of skilled workers can help firms to face increaseduncertainty, for example. Furthermore, innovators are increasingly prepared topay for skilled workers as the costs associated with tangible investments (forexample, in machinery) fall. The development of trade with low-wage coun-tries also contributes to skill bias, by increasing the specialization of devel-oped economies in production activities that require more skilled labourand/or advanced technologies. Finally, the growing supply of more educatedworkers may also promote increases in skilled work. It should also be notedthat there are counter-trends at work. Shifts in the composition of demand that
274 Structural change and demand-led growth
Downloaded from Elgar Online by University of Melbourne at 07/12/2013 04:52:38AM
have increased the size of the service sector, for example, have enlarged theoverall number of unqualified jobs.
A Biased Intangible Consumer Surplus
Products and services have undergone large and interrelated quality changesin terms of their content and conditions of use. Not all consumers are posi-tioned to fully appreciate and benefit from these changes, especially when theyare intangible. The debate over the mismeasurement of price indices demon-strates the magnitude of this phenomenon (see, for example, Boskin, 1996).While there are good reasons to doubt whether all of the biases in USconsumer price index (CPI) measurement are important in other countries,6
there is little doubt that the omission of quality improvements and poormeasurement of new products and services is a world-wide phenomenon.
Quality improvements may be perceived in different ways by differentconsumers. This claim is consistent with analyses of consumption that stressthe importance of social differences in attitudes towards new technologies.Consumers are in very different positions to organize their time and consump-tion when this requires specific competencies and information. Moreover,quality changes require users to spend time in learning processes beforeadjusting their choices. Finally, different capacities for interaction will affectthe design and provision of ÔnetworkedÕ goods and services, in the develop-ment of which user-producer relationships are decisive.
Transitory or Lasting Cumulative Processes of Segmentation . . . andSlow Growth?
Our contention is that the dynamics of the three trends discussed above arelinked in ways that are mutually reinforcing. Technologically driven skill biasputs downward pressure on the wages of the less qualified, limits the scopeof their on-the-job training and hence reinforces rising income (wage)inequality. This, in turn, limits the capacities of these groups to develop newpatterns of consumption, and induces producers to design their products andservices in accordance with this market segmentation (even if such adjust-ment reduces the mass-market potential of their innovations). This processfuels dualism and specialization in consumption patterns. At the same time,differences in consumption patterns influence the structure of the labourforcesÕ qualifications. Hence learning takes place through consumptionpatterns and lifestyles, so much so that some processes (such as informationand communication technology (ICT) use) can be considered a form of train-ing. Meanwhile, work practices influence lifestyles and consumption choices.These interrelated learning processes increase inequality by allowing those
Is a biased technological change fuelling dualism? 275
Downloaded from Elgar Online by University of Melbourne at 07/12/2013 04:52:38AM
already well positioned in the labour market to reap the advantages of tech-nology-intensive consumption goods.
An important question is whether these developments are transitory or last-ing. They may represent a transitory phase during which the diffusion of newlifestyles and new work practices necessarily begins among those who areinitially best able to adopt them. Increases in inequality will thus be confinedto a temporary phase of innovation diffusion that will ultimately benefit allmembers of society. However, increased inequality may represent a durablecharacteristic of a new growth regime, in which the segmented developmentof production and consumption hinder the growth potential of the new tech-nological system and lock economies into slow growth paths. There arereasons to believe that actual growth trajectories will fall somewhere betweenthese extremes. For example, the diversity of individual learning trajectoriesmay create a new form of social mobility that refashions the boundariesbetween traditional social groups. How large this effect is likely to be in prac-tice remains, of course, an important and open question.
These complex issues cannot be resolved within the confines of this chap-ter. They can be clarified, however, by drawing attention to some ongoingdebates and empirical findings that reflect on the workings of certain relation-ships and the magnitudes of some of the effects discussed above. In section 2,then, we begin by showing how the learning processes inherent in bothproduction and consumption activities are linked and interact cumulatively.We then investigate in more detail the complex nature of these learningprocesses, and their relationship to skill-biased technical change on one hand(in section 3); the underestimation of the consumer surplus on the other (insection 4); and section 5 concludes.
INTERRELATED LEARNING PROCESSES ANDECONOMIC GROWTH
When studying the effects of a change in the technological system, analystsoften invoke organizational problems in order to account for unexpectedoutcomes. The debate surrounding the productivity paradox in the 1980s and1990s (a large-scale technological change, manifest in the omnipresence ofcomputers, which had relatively little impact on productivity growth)provides a good example of this. For most analysts, the productivity paradoxresulted from problems of organization on the supply side. We believe thatthis explanation has merit, but that it would be more comprehensive (and lessof a black box) if it referred explicitly to the role of ÔbroadÕ learning processesoperating simultaneously and interdependently in production and on thedemand side. We suggest, moreover, that these learning processes are linked
276 Structural change and demand-led growth
Downloaded from Elgar Online by University of Melbourne at 07/12/2013 04:52:38AM

(much as learning-by-doing and learning-by-using are linked in some activi-ties) and have a strong sectoral dimension. As much is obvious, if only in thefact that the productivity slowdown is more marked in certain service sectoractivities where productivity is difficult to measure.7
We take a broad approach to what we call the learning processes in produc-tion and on the demand side.8 Numerous studies have looked at the dynamicsof production. One could begin with Adam SmithÕs claim that the division oflabour responds to the extension of markets. Some Marshallian notions of theindustrial district are also good illustrations of ÔmesoÕ learning processes, as isAllyn YoungÕs (1928) notion that the extension of markets promotes a divisionof labour stimulated by the dynamics of product and process innovations.SolowÕs (1957) work constitutes an explicit step towards accounting forincreasing efficiency in production, even though his schematizaton of techni-cal change is an entirely exogenous Ôlearning processÕ. Contemporary endoge-nous growth theory overcomes this, by combining the insights above. Itcentres its approach on the learning process taking place in production throughthe creation of externalities, whereby an activity, internal or external to thefirm, has an impact on the dynamics of all firms. Many factors have been citedas generating these externalities. The accumulation of various forms of humancapital (or research) is the factor referred to most frequently. It underlies theaccumulation of on-the-job experience (which varies directly with the netcapital stock, as in Romer, 1986), efforts to develop research activities (as inRomer, 1990) and the positive effects on labour efficiency of the general levelof training (identified by Lucas, 1988).
Another related aspect of the literature on endogenous growth focuses onthe positive externalities brought about by the successful development ofcertain activities, such as intermediary services (for example, baking, trans-portation, telecommunication and distribution). Ashauer (1989, 1994) andBarro (1990) study the positive impact on growth of public expenditures,Berndt and Hanson (1992), Munell (1992) and Morrison and Schwartz (1996)that of public infrastructure, R�ller and Waverman (1996) that of telecommu-nications, and Amable et al. (1997) that of the financial system. Theories ofendogenous growth focusing on the role of equipment investment (as in DeLong and Summers, 1991) should also be included in this group.
These two branches of development in endogenous growth theory presenta two-sided view of the global learning process in production. One focuses onthe role of human capital, while the other focuses on the benefits of varioustypes of infrastructure (including public infrastructures and intermediationservices) that support productive activities. Notice also that the first branchtends to look at characteristics incorporated in individuals, while the otherfocuses more on organizational issues (if only because large public and privatenetwork services are central to this last approach). This distinction is not clear
Is a biased technological change fuelling dualism? 277
Downloaded from Elgar Online by University of Melbourne at 07/12/2013 04:52:38AM
cut, however, since the first branch includes discussion of research and devel-opment (R&D) (an organizational issue) while the second discusses the effectsof general equipment investment (a decision of individual firms).
Similar schemas exist on the demand side, although they are treated lessfrequently in terms of learning or adjustment processes. But to describeconsumption in terms of levels of experience, income or capital is similar todescribing it in terms of learning processes. Analytical studies of the diffusionprocess of new products present just such a perspective, whether they invokeimitation effects in the epidemiologic model, or changes in purchasing poweras in the probit model of diffusion. More generally, analyses that show howthe consumption patterns of particular social groups either imitate or becomemore differentiated from the consumption patterns of other social groups overtime as prices and/or the distribution of wealth change) invoke precisely thesort of Ôbroad learning processesÕ on the demand side that were alluded toearlier in the case of production. Again, one may distinguish the process ofindividuals learning from reference groups (an individualistic process) fromlearning processes in which consumers respond to changes in the structure ofmarket intermediation (an organizational issue).
Let us now consider the interdependence between the learning processes inproduction and on the demand side as discussed above. Both dynamics arebound to be functionally linked, if only because of the Smithian observationthat the extent of the market influences the organization of production. Butconversely, institutions (including those at the point of production) conditiondistribution in ways that determine the growth of various components ofdemand. This two-way interaction, which can be thought of as a process ofcumulative causation � la Kaldor, is at the core of the interdependencebetween the two broad learning schemes that we wish to emphasize. The rela-tionships linking these learning processes can be understood to operate at threelevels: functional, institutional and ethical.
Functional links follow directly from the very structure of the productionand consumption processes, as exemplified by the development of massproduction and mass consumption in the past. This implied that patterns ofconsumption of final durable goods developed in lagged but similar waysamong social groups with different incomes. Part of this development ofconsumption patterns relied on the fact that consumer durables freed somelabour time from domestic activities, so that this labour time could thencontribute to the development of organized lines of mass production andgenerate new sources of income. These linkages also had a strong institutionaldimension, as evidenced by the wage-setting and welfare institutions thathelped to stabilize demand. One could add an ethical value dimension, mean-ing that attitudes towards work, family and consumption all contributed to theoverall interdependence of consumption and production.
278 Structural change and demand-led growth
Downloaded from Elgar Online by University of Melbourne at 07/12/2013 04:52:38AM

A variety of linkages accounted for the self-reinforcing development ofmass consumption and mass production, then. But this model of mass produc-tion and mass consumption is largely pass�, and we now need to describe theequivalent features of the Ônew economyÕ. Our understanding is that learningprocesses in production and consumption (intermediate or final) are now inter-acting on a new scale (and in ways that may either reinforce or hinder oneanother), at two levels: that of personal qualifications (individual human capi-tal) and that of intermediation infrastructures (physical capital at the level oflarge organizations). In other words, the two perspectives on endogenousgrowth described earlier can help us to assess the specific linkages at work inthe present mode of development. We shall try to clarify these linkages byreviewing the debates on skill-biased technology and on the intangibleconsumer surplus.
It may also help to present a preliminary model of the various relations wehave so far described. Part of the complexity of this exercise stems from thefact that we must deal with at least two productive sectors, two types of work-ers and two types of consumers.
Let i = 1, 2 be the two sectors of the economy, where sector 1 broadly corre-sponds to manufacturing, and sector 2 to intermediation services broadlydefined to include most business services and social services. Sector 2 thuscomprises activities with strong external effects.
Following the Smithian tradition as elaborated by Kaldor, wherein produc-tivity gains are stimulated by the expansion of markets, and adding some ofthe insights developed in endogenous growth theory, we begin with thefollowing general expression for productivity gains in each sector:
zi = fi(xi, Ipj, Ihi) [15.1]
where zi and xi represent, respectively, the growth rates of productivity andproduction in sector i over the medium run, and Ipj is an indicator of the exter-nal effects of production in sector j on productivity in sector i. We postulatethat Ip2 >> Ip1 = 0, since sector 2 encompasses large network services that aremore likely to influence growth in sector 1 (according to the second line ofthought in endogenous growth theory). Finally, Ihi is an indicator of the qual-ity of the human resources employed in sector i. This indicator of human capi-tal formation (which corresponds to the first line of thought in endogenousgrowth theory) could be proxied by the ratio of qualified to unqualified labourin each sector.9 Ih would thus reflect the rise in the demand for qualified labourthat has been observed during the last decade. Conversely, this effect seems tohave been more important in sector 1 (manufacturing) than in sector 2(services).
Assumptions about the dynamics of demand must now be added to the
Is a biased technological change fuelling dualism? 279
Downloaded from Elgar Online by University of Melbourne at 07/12/2013 04:52:38AM
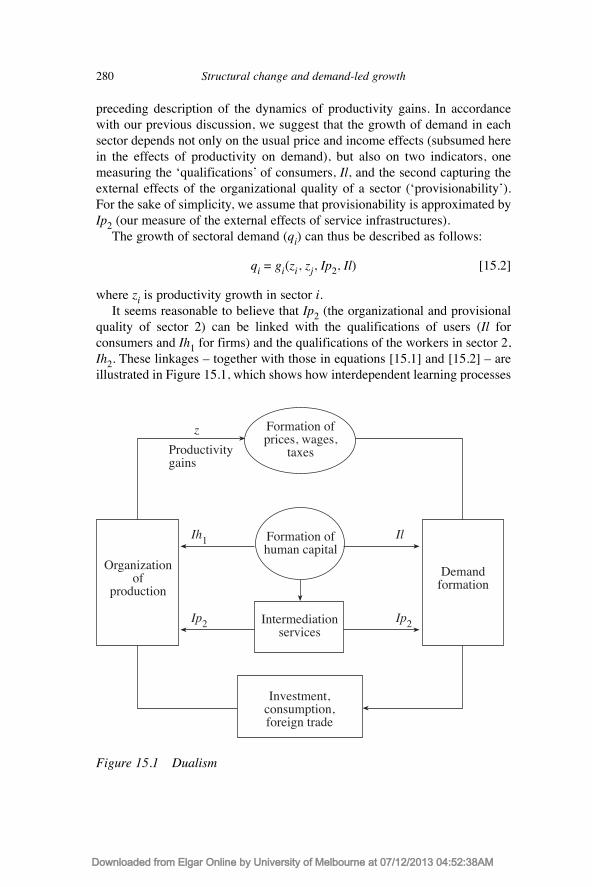
preceding description of the dynamics of productivity gains. In accordancewith our previous discussion, we suggest that the growth of demand in eachsector depends not only on the usual price and income effects (subsumed herein the effects of productivity on demand), but also on two indicators, onemeasuring the ÔqualificationsÕ of consumers, Il, and the second capturing theexternal effects of the organizational quality of a sector (ÔprovisionabilityÕ).For the sake of simplicity, we assume that provisionability is approximated byIp2 (our measure of the external effects of service infrastructures).
The growth of sectoral demand (qi) can thus be described as follows:
qi = gi(zi, zj, Ip2, Il) [15.2]
where zi is productivity growth in sector i.It seems reasonable to believe that Ip2 (the organizational and provisional
quality of sector 2) can be linked with the qualifications of users (Il forconsumers and Ih1 for firms) and the qualifications of the workers in sector 2,Ih2. These linkages Ð together with those in equations [15.1] and [15.2] Ð areillustrated in Figure 15.1, which shows how interdependent learning processes
280 Structural change and demand-led growth
Figure 15.1 Dualism
Formation ofprices, wages,
taxes
Organizationof
production
Demandformation
Formation ofhuman capital
Intermediationservices
Investment,consumption,foreign trade
Productivitygains
z
Ih1
Ip2
Il
Ip2
Downloaded from Elgar Online by University of Melbourne at 07/12/2013 04:52:38AM
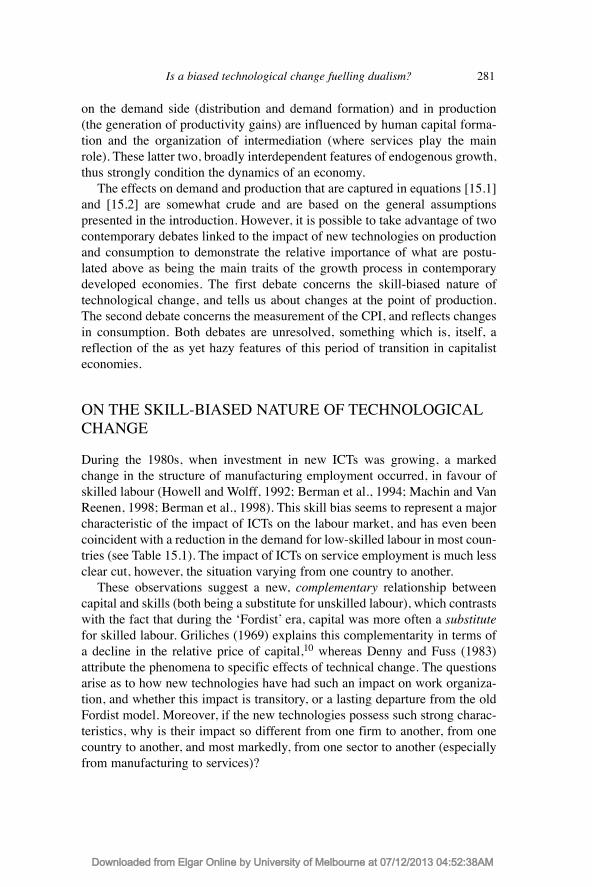
on the demand side (distribution and demand formation) and in production(the generation of productivity gains) are influenced by human capital forma-tion and the organization of intermediation (where services play the mainrole). These latter two, broadly interdependent features of endogenous growth,thus strongly condition the dynamics of an economy.
The effects on demand and production that are captured in equations [15.1]and [15.2] are somewhat crude and are based on the general assumptionspresented in the introduction. However, it is possible to take advantage of twocontemporary debates linked to the impact of new technologies on productionand consumption to demonstrate the relative importance of what are postu-lated above as being the main traits of the growth process in contemporarydeveloped economies. The first debate concerns the skill-biased nature oftechnological change, and tells us about changes at the point of production.The second debate concerns the measurement of the CPI, and reflects changesin consumption. Both debates are unresolved, something which is, itself, areflection of the as yet hazy features of this period of transition in capitalisteconomies.
ON THE SKILL-BIASED NATURE OF TECHNOLOGICALCHANGE
During the 1980s, when investment in new ICTs was growing, a markedchange in the structure of manufacturing employment occurred, in favour ofskilled labour (Howell and Wolff, 1992; Berman et al., 1994; Machin and VanReenen, 1998; Berman et al., 1998). This skill bias seems to represent a majorcharacteristic of the impact of ICTs on the labour market, and has even beencoincident with a reduction in the demand for low-skilled labour in most coun-tries (see Table 15.1). The impact of ICTs on service employment is much lessclear cut, however, the situation varying from one country to another.
These observations suggest a new, complementary relationship betweencapital and skills (both being a substitute for unskilled labour), which contrastswith the fact that during the ÔFordistÕ era, capital was more often a substitutefor skilled labour. Griliches (1969) explains this complementarity in terms ofa decline in the relative price of capital,10 whereas Denny and Fuss (1983)attribute the phenomena to specific effects of technical change. The questionsarise as to how new technologies have had such an impact on work organiza-tion, and whether this impact is transitory, or a lasting departure from the oldFordist model. Moreover, if the new technologies possess such strong charac-teristics, why is their impact so different from one firm to another, from onecountry to another, and most markedly, from one sector to another (especiallyfrom manufacturing to services)?
Is a biased technological change fuelling dualism? 281
Downloaded from Elgar Online by University of Melbourne at 07/12/2013 04:52:38AM
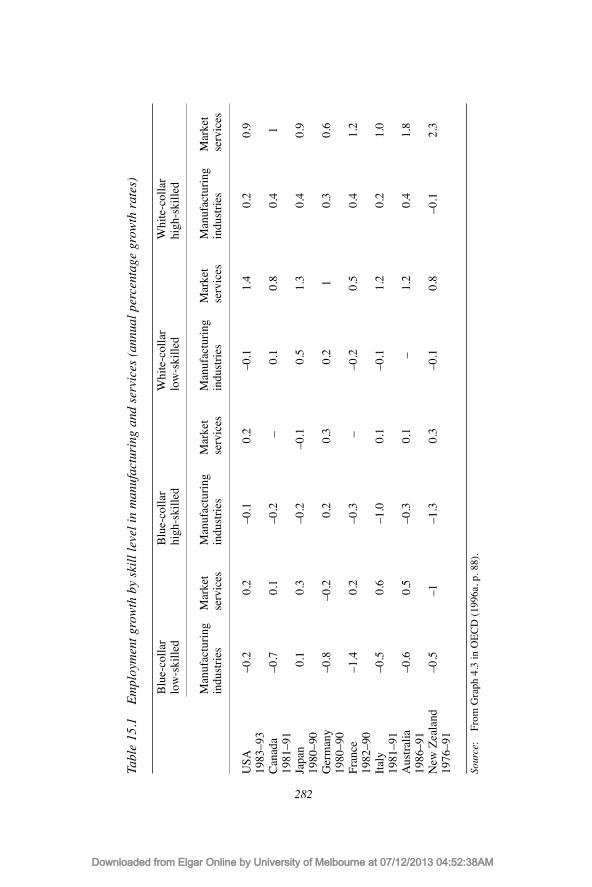
282
Tabl
e 15
.1E
mpl
oym
ent
grow
th b
y sk
ill
leve
l in
man
ufac
turi
ng a
nd s
ervi
ces
(ann
ual
perc
enta
ge g
row
th r
ates
)
Blu
e-co
llar
Blu
e-co
llar
Whi
te-c
olla
r W
hite
-col
lar
low
-ski
lled
high
-ski
lled
low
-ski
lled
high
-ski
lled
Man
ufac
turi
ngM
arke
tM
anuf
actu
ring
Mar
ket
Man
ufac
turi
ngM
arke
tM
anuf
actu
ring
Mar
ket
indu
stri
esse
rvic
esin
dust
ries
serv
ices
indu
stri
esse
rvic
esin
dust
ries
serv
ices
USA
Ð0.2
0.2
Ð0.1
0.2
Ð0.1
1.4
0.2
0.9
1983
Ð93
Can
ada
Ð0.7
0.1
Ð0.2
Ð0.
10.
80.
41
1981
Ð91
Japa
n0.
10.
3Ð0
.2Ð0
.10.
51.
30.
40.
919
80Ð9
0G
erm
any
Ð0.8
Ð0.2
0.2
0.3
0.2
10.
30.
619
80Ð9
0Fr
ance
Ð1.4
0.2
Ð0.3
ÐÐ0
.20.
50.
41.
219
82Ð9
0It
aly
Ð0.5
0.6
Ð1.0
0.1
Ð0.1
1.2
0.2
1.0
1981
Ð91
Aus
tral
iaÐ0
.60.
5Ð0
.30.
1Ð
1.2
0.4
1.8
1986
Ð91
New
Zea
land
Ð0.5
Ð1Ð1
.30.
3Ð0
.10.
8Ð0
.12.
319
76Ð9
1
Sour
ce:
From
Gra
ph 4
.3 in
OE
CD
(19
96a,
p. 8
8).
Downloaded from Elgar Online by University of Melbourne at 07/12/2013 04:52:38AM
Before investigating these questions further, we first examine whetherchanges in the composition of employment may not have resulted from factorsother than technological change, such as increased competition from low-wage countries (the trade effect) or an excess supply of qualified labour(resulting from a rise in the average level of education).
A Trade Effect?
Skill-biased technological change (SBTC) may be an indirect effect of tradespecialization, whereby developed countries with high wages are forced tospecialize in activities that are more skill-intensive. Although trade effectscertainly explain part of the changing composition of employment, however,they cannot account entirely for the phenomenon. Most sectors are affected bytechnological change regardless of their exposure to trade (Berman et al.,1994; Machin, 1996). Berman et al. (1998) estimate that SBTC accounts for70 per cent of the bias in labour demand by skill, whereas trade accounts forjust 9 per cent.
Moreover, the trade effect argument can be broadened to include anychange in demand, be it internal or external. Some studies insist that changesin competition, which have given more weight to non-price factors (such asproduct innovations, delivery and after sales servicing improvements and soon), have upgraded production processes towards more sophisticated productsthat make more use of qualified labour (see, for example, Goux and Maurin,1995). At this stage, it is difficult to distinguish between labour marketchanges due specifically to technology and those due to a general change inproduct demand.11 However, the narrow view that a mainly external tradeeffect accounts for the changing composition of employment can be discarded,because skill bias impacts across all sectors, including non-tradables.
The Effect of an Excess Supply of Skilled Labour?
Part of the skill bias may be the result of an increase in the demand for educa-tion in developed economies. This increased demand could be stimulated byslack in labour markets, which induces longer stays in initial formal educationdesigned to delay entry into the labour market, and by individuals trying toimprove their chances of finding employment. Such an effect has been under-lined by, among others, Howell and Wolff (1992) for the USA and by Gouxand Maurin (1995) for France. The increased demand for education, which hasled to an increase in the average level of education in the labour force, iscertainly part of the explanation for the skill bias in contemporary labourmarkets. Acemoglu (1998) suggests that skill bias can result from a largesupply of skilled labour which, in turn, influences the organization of the work
Is a biased technological change fuelling dualism? 283
Downloaded from Elgar Online by University of Melbourne at 07/12/2013 04:52:38AM
process and the choice of equipment (an endogenous change from thisperspective).
Such effects should not, however, be exaggerated. In Europe, the unem-ployment rates of those with diplomas have increased along with those ofother groups, so that schooling Ð even at high levels Ð does not provide fullprotection against unemployment or poor jobs. Conversely, the average yieldon educational investments for college graduates has risen in the USA and theUK (Mishel et al., 1997). If the supply effect described above had been themain cause of skill bias, one would expect the yields on educational invest-ment to have fallen.
The discussion above suggests that the effect of the large supply of skilledlabour on labour demand was mixed with other changes in the functioning oflabour markets, particularly with regard to wage formation. Analyses of theimpact of investment in and the use of new technologies on wages have beencarried out at firm and sectoral levels, both for specific types of workers andfor the work force as a whole. This last distinction is crucial for the skill biasissue. In the first case we are examining the premium to users of new tech-nologies, and in the second, the shared benefits of new technologies among allworkers. We can expect that investment in new technologies, when it substi-tutes capital for labour, will increase the average wage rate. At the individuallevel, however, the expected effects are less clear.
Krueger (1993) shows that in the USA, the use of computers bestows uponworkers a wage premium of some 15 per cent. This premium could be attrib-uted either to an increase in productivity, or to the personal characteristics ofcomputer users, which would have led to them receiving higher wages regard-less. Recent studies tend to counter KruegerÕs view (which favoured the firstexplanation). In France, for example, Entorf and Kramarz (1994, 1996a,1996b) show that workers using computers are paid more, but that they werealso paid more before the introduction of the new technologies.12
For the most part, these empirical findings suggest that the use of acomputer does not necessarily lead to an ÔextraordinaryÕ increase in personalwages. Individuals mainly receive a higher wage based on their personal char-acteristics. New technologies appear to be used by workers who alreadypossess the personal characteristics that, according to conventional criteria,would result in their receiving higher wages.
But the introduction of computers is not the only change that occurred inlabour markets at about the same time as the supply of educated labourincreased. Changes in the economic environment coupled with adjustment tonew technology and freer trade weakened the bargaining power of workers, asevidenced by the decline of unions and the reduction in minimum wagesduring the 1980s. This certainly helps to account for the relative decline in thewages of unskilled workers in the Anglo-Saxon countries at a time when those
284 Structural change and demand-led growth
Downloaded from Elgar Online by University of Melbourne at 07/12/2013 04:52:38AM

of skilled labour seemed to remain more or less constant in real terms. Moreprecisely, as stressed by Storper (1999), the real wages of a small group ofhighly skilled professionals have increased on average, while the wages of thesemi-skilled were losing ground and those of low-skilled workers declinedsignificantly.
SBTC is therefore part of a large-scale reorganization of work and labourmarkets, in which the supply of educated workers, trade technology and thedynamics of work organization (within firms and intra-firms) and labourmarket relations all play a role. Examining the content of skills and theirsectoral dimensions assists further investigation of these transformations.
What is the Content of Skills?
The empirical findings reported above show that firms tend to select potentialusers of ICTs based on individual criteria that pre-date the introduction of thenew technologies. Preferences for skilled workers per se (as opposed to thosewith job or firm specific skills) characterize a technological environment thatrequires more general knowledge and competencies that can be applied invarious contexts. The content of these skills seems to be, to a greater extentthan before, knowledge geared towards transversal problem solving (Gibbons,1994) and personal experiences that demonstrate awareness and responsive-ness. Firms do not seem to pay specifically for a skill bias (since they do notupgrade the jobs of those using ICTs) but do seem to attach importance tocertain personal characteristics and to ensure that ICT users possess specificindividual competencies. This focus on the abilities of individuals seems to bemore important than any collective reorganization of work designed to servicethe new technologies.
The notion of skill used in many of the studies referred to above makes onlya crude distinction between production and non-production workers.13
Moreover, jobs require a multitude of different skills. By considering threemajor dimensions of skill Ð cognitive (analytic and synthetic reasoning,numerical and verbal facilities), motor (physical abilities, coordination,dexterity) and interpersonal skills (supervisory skills, leadership) Ð Howelland Wolff (1992) and Wolff (1995) construct three skill scales on which basisthey grade occupations by sector, and document changes in these gradesduring the 1980s. The more sophisticated picture given by these studiesconfirms the general decline in the demand for unskilled labour, but associatesit with a drop in the demand for motor skills.14 Meanwhile, the demand forhigher cognitive and interactive skills is shown to increase. These studies alsosuggest that the effects of investment on the skill structure may differ depend-ing on whether investment is in general equipment or ICTs. As the latter repre-sents only a small fraction of total investment (Oliner and Sichel, 1994; Sichel,
Is a biased technological change fuelling dualism? 285
Downloaded from Elgar Online by University of Melbourne at 07/12/2013 04:52:38AM
1997), the specific effects of ICTs on skills may sometimes be obscured byconventional capitalÐlabour substitution effects.
Are there Sector-specific Biases in Skill-bias Trends?
Most of the studies referred to above concentrate on manufacturing industries.But as two-thirds of employment and ICTs are found in service industries, itis not appropriate to draw conclusions about skill bias without verifying thatmost of the arguments apply to services.
The evolution of low-skilled employment in Table 15.1 shows just howdifferent the experiences of the manufacturing and service sectors have been.Looking in more detail at the evolution of employment by skill level in Frenchservice industries from 1982 to 1991, we observe that in activities like socialservices, public administration and household services, the growth ofunskilled employment outpaced the growth of skilled employment (OECD,1994).15 In most services, the number of unskilled workers continually rose,though at a lower rate than for skilled workers. Only in finance and commu-nication do we observe a net decrease of the unskilled labour force as observedin all manufacturing industries (as well as in agriculture, mining and construc-tion). As these industries have also invested more in ICT equipment than theothers, this observation provides some support for the SBTC thesis. The diffu-sion of ICTs may also increase the relative demand for skilled labour in otherservice industries, but the demand for unskilled labour in absolute terms islikely to remain important as these activities continue to grow. And because ofthe absolute amount of employment in these activities, the way in which theyuse the new technologies is a crucial issue.
A Reorganisation of the Supply Side
Most of the studies discussed so far analyse the skill bias of new technologyas if it were an individual issue, disregading the fact that the primary concernof a firm is with work organization as a whole. These organizational issues arecertainly difficult to typify in times of structural change, where diverse reac-tions by firms are frequently observed (Attewell, 1994). This explains the lackof statistics on organizational structures in general and, in particular, the lackof studies exploring skill bias and the productivity paradox as extensively asthese issues have been examined in the context of more individual aspects ofemployment.
Questions about work organization can be addressed by referring to AokiÕs(1988) distinction between the information structures embodied in the differ-ent forms of work organization in Japan (horizontal structure of decentralizeddecision-making processes) and the USA (vertical structure of centralized
286 Structural change and demand-led growth
Downloaded from Elgar Online by University of Melbourne at 07/12/2013 04:52:38AM

decision processes).16 Hence Piore (1988) suggests that the US model hasused the new technological context to change towards more horizontal chan-nels of communication, with less hierarchy and reduced specialization (thusmoving closer to AokiÕs Japanese model of organization). However, even ifthis is true, the ÔtacitÕ channels of horizontal communication typical in Japancannot be perfectly replicated by communication based on information tech-nologies, which is bound to be more codified. In the new systems created bythese latter organizational changes, there may be more communicationbetween units, but fewer ways to control the instability at lower levels of theorganization that this creates. The factors that inhibit the strengthening of link-ages between individual and organizational productivities, as discussed byGoodman et al. (1994), are effectively universal: the permanence of slack, thehierarchy between core and peripheral activities, compatibility between prob-lem-solving methods and so forth. The question, then, is why are ICTs diffus-ing in all sectors and countries if their uses are so problematic?
The most fundamental reason concerns firmsÕ need to respond to marketpressures, to differentiate and enrich products and to provide commodities innew ways. Such responsiveness to product market forces necessitates greaterinterdependency within productive systems. A second reason is that ÔcodifiedÕhorizontal communication is much more open to central control that the tacithorizontal coordination of information, and therefore permits greater respon-siveness to radical process or product innovations. This is vital for firms oper-ating in global markets and organizing their production on an internationalbasis as well. Both of these reasons are compatible with the increased demandfor cognitive skills and interactive/supervisory skills noted earlier.
These comments on qualifications of organizational change remain highlytentative, but their spirit is broadly in accordance with studies that insist on thediversity of work organization responses to technical change. These studiesconfront us with two hypotheses. First, that firms undergo a standard processof trial and error before one best practice of work organization imposes itselfand diffuses to a majority of firms.17 And second, that the new technologicalenvironment of the firm is such that there is no dominant model, only specificapplications that are relevant in particular competitive/cooperative contexts. Itfollows that the work reorganization process becomes chronic (Attewell,1994). In such a rapidly changing work organization environment, skills arebound to become obsolete more quickly than before. The relative instability ofthis environment, which leads firms to opt for organizations that can be contin-uously transformed and adapted, is also related to the increasing number oflinkages that have developed between firms (see the contributions to Harris,1994).
If a significant change in firmsÕ perspectives on work organization has, infact, occurred, and if work reorganization has become a chronic issue with
Is a biased technological change fuelling dualism? 287
Downloaded from Elgar Online by University of Melbourne at 07/12/2013 04:52:38AM

diverse solutions (as illustrated by the continuous spread of new organiza-tional forms, such as re-engineering, merging, networking, externalizing,work-flow processes, groupware and so on), then it is likely that the relation-ship between the spheres of work activities and household activities will betransformed as well. The fact that skills are becoming obsolete more quicklywill be an important factor in the evolution of this relationship. The conclu-sions drawn from this brief survey of the skill-bias issue lead us now to reviewhow the new technical system can be viewed from the ÔotherÕ sphere, that is,from the perspective of the consumer and worker.
NEW CONSUMERS AND THE DISTRIBUTION OF THECONSUMER SURPLUS
Our main claim here is that the divisions occurring in society in terms of thedesire and ability of individuals or families to use new technologies are closelyrelated to what is happening within work organizations. This broad learningprocess occurring outside the firm concerns not only the composition of thebaskets of consumption goods and services that consumers buy, but also theway in which the provision of these commodities, together with the processesthrough which they are consumed, incorporate new technologies and theknow-how associated with them. This is especially relevant for those servicesorganized in networks. Linkages between the two broad learning processes(within and outside the workplace) may be transitory, and may correspond toa classic sequencing in the access to new lifestyles, as a result of which every-one will eventually converge to some general standard. But they may involvea more lasting and structural drift with detrimental long-term effects on socialcohesion that could, in turn, hinder the process of economic growth. We returnto this possibility below, but begin by discussing some of the stylized factsabout changes in consumption patterns that have been highlighted by thedebate about the Ôconsumer surplusÕ.18
Lessons from the Debate over the CPI
The current debate over the CPI helps illustrate some of our concerns.Questioning the accuracy of the CPI raises questions about measurement tech-niques and about how well consumers are able to appreciate changes in thecontent of goods and services and in the way they are provided. In what follows,we do not discuss the techniques of CPI measurement employed by nationalstatistical agencies. This issue is important, due to the role that price indexingplays in fixing wages, public transfers and contracts in most countries, but it isnot directly linked to our topic. However, those aspects of the CPI measurement
288 Structural change and demand-led growth
Downloaded from Elgar Online by University of Melbourne at 07/12/2013 04:52:38AM

debate, which are concerned with the difficulties involved in comparing the realvalues of two baskets of goods and services at different points in time when alarge, systemic technological change has occurred, are central to our topic.
The debate over the CPI has drawn attention to those areas where diversetechnological changes are most difficult to appreciate, and attempted to attachan order of magnitude to the underassessment of quality change. In the USA,the Boskin report (Boskin, 1996) provides a detailed account of the Ôguessti-mationsÕ that the commission arrived at for measuring various components ofCPI mismeasurement, on the basis of a large body of pre-existing econometricwork. The report concludes that the underestimation of quality change mayhave led to an upwards bias in the CPI of 0.6 per cent per year. The impact ofan increasing ability to substitute one type of retail outlet accounts for a further0.1 per cent upward bias.19 Overall, the unmeasured consumer surplus, net ofthe technical drawbacks due to measurement procedures, amounts to 0.7 percent a year.20 This net bias is quite sizeable if one compares it with the averagegrowth rate of large OECD economies (1.6 per cent per annum from 1989Ð93).
Most critics of the Boskin report have emphasized two points: theinevitability of delays when taking account of innovations, and the reportÕsbiases in selecting information on quality changes.
Delays when taking into account innovations present a dilemma fornational institutions measuring the CPI. If, in order to keep pace with thebehaviour of the average consumer, they wait until a sizeable share ofconsumers have adopted a new product, then its price will already have fallensignificantly and the quality improvement may go unnoticed. If, however, theyinclude the product in the CPI at too early a stage, it concerns too fewconsumers and carries little weight. The introduction of new product or servicethus necessitates a careful choice as to when to include the product in the CPIbasket, and an appreciation of the quality improvement it involves. Neither iseasy. It seems that institutions measuring the CPI tend to include new productswith some sight delay.21 Meanwhile, estimates of quality improvementsrequire detailed information and are all the more open to criticism of whetherthe innovation in question is radical.
The second line of criticism also bears on the quality of information oninnovation. The Boskin report has been criticized for relying on limitedsources of pre-existing information (specifically, the hedonic pricing of inno-vations) that are biased towards suggesting that price inflation is overesti-mated. Indeed, the argument that, in some instances, price inflation may havebeen underestimated is hard to deny. But even if the overestimation of priceinflation suggested by the Boskin report is, itself, overestimated, the CPImeasurement debate has drawn attention to important sources of uncertaintysurrounding the quantification of goods and services, and the increased impor-tance of product innovation.
Is a biased technological change fuelling dualism? 289
Downloaded from Elgar Online by University of Melbourne at 07/12/2013 04:52:38AM

At this point, it must be acknowledged that, when changes are as far reach-ing as those induced by ICTs, the very meaning of a cost of living index istransformed. Moreover, many of these changes are taking place in domainswhere change has always been difficult to measure. The housing category, forinstance, encompasses various issues that are not given much weight in thecorrection of the CPI in the Boskin report, such as housekeeping services(where an ever-increasing variety of services is on offer). Medical care isaccorded a relatively high unmeasured rate of technical change, but entertain-ment and educational services are not, despite the profound structural changesin these activities brought about by ICTs.
In sum, those areas where the magnitude of unmeasured technical changeis uncertain remain important. These are mainly service activities. Nakamura(1995), who performed an exercise similar to that of the Boskin Commissionon the Bureau of Economic Analysis (BEA) national accounts, estimates thatthe net unmeasured technical change in personal consumption is as high as 2.5per cent per year over the period 1984Ð93. The differences betweenNakamuraÕs and the Boskin reportÕs findings arise from the recreationservices, education and housing industries.
This leads us to stress that, in addition to the way in which products andservices are provided, the context in which consumption occurs matters. Ifproducts are more differentiated, then it follows that their utility is morecontext-specific. It becomes ever more difficult to appreciate a consumptionbasket as a collection of separate items. The welfare effects of the consump-tion of these products are more interdependent, because the temporal andpersonal dimensions are becoming more closely tied to consumption. Thefacts that people are faced with a time budget constraint and that consumptionis becoming more time consuming (if only because of its increasing servicecontent) implies, when technologies are transforming these time constraints,that changes in the management of time constraints will take place. The factthat products are becoming ever more customized also implies changes inconsumer behaviour. These transformations, which are bound to be highlydependent on individual characteristics, generate a consumer surplus that islargely hidden and very likely unevenly distributed.
The next step is to consider how this hidden consumer surplus affectsdifferent social groups, and what it tells us about the dynamics of consumptionand the learning process that is shaping consumer behaviour.
The Distribution of the Consumer Surplus: the Role of Large ServiceNetworks
The debate over the unmeasured consumer surplus is motivated by two issues.One is a fiscal issue; many public transfers, pensions and revenues are indexed
290 Structural change and demand-led growth
Downloaded from Elgar Online by University of Melbourne at 07/12/2013 04:52:38AM
on the basis of a CPI, and overestimation of this index has a sizeable effect onthe public budget deficit. The second issue relates to the distribution ofincome; income inequalities have been growing in most developed countriesover the last two decades.
It is relatively easy to get a rough estimate of the impact of mismeasure-ment of the consumer surplus on the budget deficit or on the balance of taxesand transfers to various social groups. It is much harder to get an idea of itseffect on the distribution of welfare, however. One can argue that gains andlosses to different groups balance out. Groups with less income, education andculture will certainly miss out on some of the advantages of unmeasured qual-ity changes, but will gain by having improved access to, and facing lowerprices for, goods and services. But this hypothesis underestimates the facts thatwe begin with very unequal distributions of income and education, and that theexistence of an unmeasured quality change underscores the opacity andinequality that exists in access to and the diffusion of new commodities.People will differ as to how they access new goods and services, and withregard to what they get out of them.
The large variety of goods (see Gordon, 1990), together with the increase inthe range of services at our disposal, has been accompanied by proliferation of theways these goods and services are bought and sold, and financed. Consumptionin this environment has become more complex, and has broadened the opportu-nities for ÔsmartÕ consumer behaviour. Indeed, the pressure of smart consumers(either individually or organized in associations and through the media) is play-ing a major role in increasing competition and shaping more demand-orientedmarket economies Ð although conversely, large numbers of people in the lowerreaches of the income distribution find it hard to escape quality changes theycannot avoid, varieties they cannot afford or improvements that are of no use.
We have chosen to analyse two dimensions of consumer ÔskillsÕ: thoselinked with appropriate and efficient use of intermediation services, and thoseembodied in personal skills. We begin by focusing on the intermediationprovided by large (public or private) services.
The provision of services via large network systems is one area in whichsocial discrimination is both effective and structuring. Particularly importantin this respect are financial services, which have greatly increased in varietyand have led to a wide spectrum of results, from rapid fortunes built on spec-ulation to the unbearable indebtedness of some low-income households.Similar increases in the range of consumersÕ capabilities to use new servicesefficiently can be observed in education, health, communication, transport andpublic services. This social differentiation in patterns of use can originate fromtwo factors: the differing abilities of users to take advantage of modern inter-mediation systems, and the tendencies for large systems to develop their orga-nizations while taking this differentiation for granted.
Is a biased technological change fuelling dualism? 291
Downloaded from Elgar Online by University of Melbourne at 07/12/2013 04:52:38AM

Education is a classic case, even if it has not yet been thoroughly trans-formed by ICTs. The fact that an increase in the average number of years ofschooling years has been accompanied by rising illiteracy and other poorresults (such as the increasing incidence of dropouts, of unqualified school-leavers, of poor scores on general and specialized tests Ð see OECD, 1998)suffices to illustrate the widening of the range of achievements.
The development of telecommunications between the various agents andphases of treatment in health systems is still at an early stage, but alreadyraises some of the main issues regarding the path of contemporary technolog-ical change. These developments imply an active interface between healthsystem professionals and their patients. The design of this interface presents astandard trade-off: the larger its scope, the more useful and beneficial will beits operation in terms of the range of interventions covered. Conversely, themore complex the interface, the higher will be the barriers to access, depend-ing on the general Ôskill levelÕ of the population. Modern treatment systems Ðsuch as HMOs Ð have improved the quality of care, but have also been accom-panied by some ordering of access which, in the context of large inequalitiesin education or income, may result in the exclusion of some patients from care(see Boulier, 1994).
Financial services, and especially retail banking, have already experiencedvarious phases of computerization of their network facilities. Increasedcompetition and improvements in the quality of equipment fuelled the reorga-nization of financial networks and organizations, which has, in turn, resultedin some exclusion of access to services. For example, banks in the USA andthe UK have closed local branches, replacing them with the limited services ofautomated tellers (see Pratt et al., 1996 for the UK and Dymski and Veitch,1993 for the USA). This has had detrimental effects on local communities.
When examining these developments, we must distinguish betweenpersonal services (such as education and health) and intermediation services,which are offered to both firms and individuals and where technologicaland/or organizational transformations are interdependent. While in the firstcase the potential created by ICTs is being realized only slowly, and dependsextensively on public policy interventions, the dynamics of market competi-tion have resulted in a rapid transformation of the ways in which most inter-mediation services (distribution, transportation, communication, banking andso on) operate. This pressure to restructure has been both a cause and conse-quence of recent deregulation and re-regulation initiatives, an institutionalcontext that is crucial to the provision of these intermediation services.
The development of large network services, as stimulated by the new tech-nologies, can thus perpetuate segregation in the provision of the sort ofconsumer services that are crucially important in the new economy. Moreover,these developments possess a strong path-dependent dimension that may
292 Structural change and demand-led growth
Downloaded from Elgar Online by University of Melbourne at 07/12/2013 04:52:38AM

hinder the development of new personal skills. In this respect, universal accessto such services does not guarantee that there exists equal opportunity to useservice networks with the same efficacy.
The Distribution of the Consumer Surplus: the Role of Personal Skills
Consumer behaviour is supposed to be determined by income, education andsocial background. These social roots have been very important in shaping thepreferences of consumers in the post-war period, making all consumptionprojects in a given society more or less commensurable (see, for example,Galbraith, 1958 or Packard, 1957). A characteristic of the current period maybe a loosening of these social ties, transforming societies of classes into soci-eties of individuals or transient small groups.22 In these more atomistic soci-eties, what do Ôconsumer skillsÕ consist of? Their generation is moreevolutionary, meaning that they are more dependent on individual experiencewithin the universes of markets, law and public (welfare) interventions(universes that are, themselves, evolutionary). The use of ICTs, at work or athome, contributes to these interfactes. It is in this sense that we can speak of abroad learning process for the building-up of consumer skills. Beyond somecommon hedonic principle, social links have become more uncertain or differ-entiated and casual personal networks more important. Paradoxically, this lackof social cohesion, because it means the absence of centripetal forces, leads tomore risky dynamics, where failures will be more difficult to overcome andwill tend to cumulate over oneÕs lifetime.
Atomistic societies may therefore lead not to more egalitarian societies butto more divided societies. Such will be the case if the level of individual riskhas increased. Such may be the case if one considers the relative erosion of themeans of social promotion or of self-achievement brought about by educationand work. We have already discussed this development, which may be due toexcess supply of educated people as well as to rapidly changing markets andproduction processes. If ICTs play a role in this evolution of the labour market,however, then they can also confer new abilities on individuals, helping themto overcome some of the drawbacks of labour market developments.
But the private use of ICTs has its limits. It may be complex and requiremuch coordination, while opportunities for misuse proliferate (see Landauer,1995). Personal ITC use may also be too specific and hence ultimately irrele-vant in terms of skill development and personal autonomy, while the overlapbetween cognitive skills developed at work and in the home may vary consid-erably. And yet, the development of skills in the home, where the learningprocess may last longer, is especially important when the learning process atwork is limited or constrained. Ultimately, the interplay of skill developmentat home and at work is bound to be very different across groups with different
Is a biased technological change fuelling dualism? 293
Downloaded from Elgar Online by University of Melbourne at 07/12/2013 04:52:38AM

experiences and backgrounds. Cultural and financial barriers to the access tonew facilities or the use of new equipment has led experts to express fears thata two-tier Information Society could develop. Policy statements have empha-sized the important role that domestic ICT use can play in curtailing this devel-opment (see, among others, the Group of Prominent Persons, 1994 and theEUÕs High Level Expert Group on the Social Aspects of the InformationSociety, 1996.
Elites and professional classes will have more opportunities to benefit fromwhat ICTs can offer, while those at the margins, with low income, little educa-tion and limited social connections, will find it increasingly difficult to keepÔin touchÕ with the capabilities bestowed on consumers by ICTs. The shifttowards services in consumption patterns is increasing the challenges thisdilemma presents. Time becomes a binding constraint in producing oneÕs ownwelfare (Petit and Soete, 1996), a problem that consumers can solve withdiffering efficiencies depending on their ability to use ICTs.23
Parallels can be drawn between the personal requirements for a skilledconsumer and the requirements for a skilled worker. In both cases, a skilledperson will be expected to respond positively to external challenges inducedby ongoing structural changes, and to constantly find ways to improve theinternal efficiency of their actions (the ability to develop a learning-by-doingprocess). In a world of bounded rationality and limited information, one wayto balance these internal and external learning processes is to have access tovarious groups or networks (either more or less formal) from which informa-tion and support can be obtained. Two illustrations of this are instructive.Gollac (1996), looking at how computer users at work manage their work,finds that those using their computers in the most innovative ways (program-ming or using several software programs) typically form a reference groupbased on relations outside the firm. Referring to colleagues in remote positionswithin their own firm is listed second in importance, and close colleaguesthird. By contrast, for people using computers in limited ways (for example,always using the same software for definite operations), the order of impor-tance was the opposite.
Similar signs emerge from investigations of the best means of protectingindividuals against unemployment: those with a large range of diverse connec-tions enjoy the most effective protection. It follows that having strong linkswithin a particular network or community may not be as valuable as a portfo-lio of connections.24 Having numerous weak ties (in the sense of Granovetter,1995) markedly increases an individualÕs reach, the scope of their action andtheir ability to respond rapidly to changes in the labour market.
The similarity between the abilities and skills required of individuals at workand in the home seems to be a key feature of the new environment. Similarcapacities to learn and to adapt to new contexts are required in production and
294 Structural change and demand-led growth
Downloaded from Elgar Online by University of Melbourne at 07/12/2013 04:52:38AM

consumption. Learning processes at work and home are therefore broadlycomplementary at an individual level. Nevertheless, these processes areaffected by the intermediation structures that provide education and the vari-ous logistics of services that we discussed earlier. Moreover, it does not followthat the two processes are spontaneously self-reinforcing. There are manyreasons to believe that this cumulative interaction involves risks, and that partof the learning process concerns how best to monitor these risks. For instance,the fabric of weak ties and the logistic support systems mentioned above havea high rate of obsolescence. Individuals may then be exposed to hazards thatresult in lasting or irreversible consequences (ÔaccidentalÕ poverty and unem-ployment can act as traps in some cases). There is also uncertainty as to thebest portfolio of connections. Moreover, as Attewell (1994) suggests, the useof ICTs may have considerably increased risks by multiplying the number ofcases that involve asymmetric information, as schematized in principal-agentsproblems. Finally, it is a general property of systems to become more unstablewhen the number of internal linkages they involve increases.
CONCLUSIONS: ON UNBALANCED AND UNEQUALGROWTH
Both the productivity paradox and the difficulties most economies haveencountered when trying to turn the diffusion of contemporary technologicalchange into steady and evenly distributed rates of economic growth havelargely been attributed to the length of the learning processes involved. On theproduction side, these learning processes seem to require intricate coordina-tion, which is largely decentralized and therefore difficult to implement(Freeman and Soete, 1994; David, 1991). Our survey of the Ôskill-biasÕ issuestressed some of the characteristics of this learning process. It conveyed theimpression of a rather atomistic approach to the reorganization of work, whichputs a new emphasis on personal characteristics. From this perspective, thechanges occurring in the workplace and in consumption activities appear simi-lar: ÔsmartÕ consumers seem capable of improving their share of a Ôrecon-structed total welfareÕ, while many others find that their situation hasdeteriorated.25 A review of the debate over the unmeasured consumer surpluslent support to this view, and emphasized the fact that consumer learningprocesses now appear more casual and less dependent on a pre-existing classstructure, even if both education and the infrastructure of service provisionplay a major structuring role. Moreover the development of a sizeable set ofskilled or ÔsmartÕ consumers, which, together with globalization, accounts forthe more competitive nature of markets, is related to the development of agroup of skilled workers who suceed in tying together the learning processes
Is a biased technological change fuelling dualism? 295
Downloaded from Elgar Online by University of Melbourne at 07/12/2013 04:52:38AM

in which they are engaged at work and in the home. Meanwhile, no sign wasfound of any significant catch-up mechanisms, which would ensure that thosecurrently lagging behind will do so only temporarily. On the contrary, thesystem seems to have generated new risks and instabilities which, thus far,policies have not learned to cope with.
The prospects for economic growth are thus related to two interdependentÔmacroÕ-learning processes, which, in turn, provide an important perspectiveon the relationship between inequality and growth. Inequality of access toeducation and service infrastructures hinders developments that utilize ICTs tobest advantage, as they limit the positive network externalities that wouldotherwise occur. That some groups are able to take increasing advantage ofnetworks and even adjust them in order to do so does not seem to counterbal-ance the negative effects of exclusivity.
Mechanisms capable of countering this dualist trend are few in number.Income redistribution can help, but cannot by itself fill an access gap thatincludes non-monetary barriers. Education and the services, which provide theintermediation necessary to reduce access inequalities, certainly contain thesolutions, but effecting these solutions, in turn, poses a variety of quantitativeand qualitative problems. In particular, it is difficult to set up the idiosyncraticformulae that will help countries to take advantage of their specificities, designthe proper learning schemes that will develop the mechanisms enabling themto strengthen social cohesion, and thereby make the best use of contemporarytechnological change.
The aim of this chapter has been to summarize the architecture of the link-ages between technical change, inequality and growth. In short, we havestressed that inequalities in welfare hinder growth prospects as never before.They impede economic growth without developing any self-correcting mech-anisms, while simultaneously limiting the efficacy of old remedies, such asincome redistribution. The sooner these issues are understood and renderedmanageable, the better able society will be to benefit from the current histori-cal turn.
NOTES
1. Earlier versions of this chapter were presented at the meetings of the AEA, Chicago, January1998, and at the conference on the Service Sector, Productivity and the Productivity Paradoxorganized by the Centre for the Study of Living Standards in Ottawa in April 1997. We aregrateful to Ellen Dulberger, Mike McCracken and Andrew Sharpe for helpful comments andsuggestions.
2. The diffusion of electrical power and the dynamo, for example, took 50 years.3. Neoclassical endogenous growth theory, stressing the external effects of increasing returns,
has been inspired by this tradition.4. See Atkinson et al. (1995), Gottshalk (1993), Freeman and Katz (1993), Sharpe and Zyblock
(1997) and Mishel et al. (1997).
296 Structural change and demand-led growth
Downloaded from Elgar Online by University of Melbourne at 07/12/2013 04:52:38AM

5. See Howell and Wolff (1992), Berman et al. (1994), Card et al. (1995), Machin (1996) andNickel (1996).
6. See Lequillier (1997), Fenwick (1997) and the OECD survey of the measurement of CPIspresented at the Economic Policy Committee meeting, December 1997. The Boskin Reportis, itself, much debated of course (see Moulton et al. 1997).
7. According to Griliches (1994), three-quarters of the output of the computer industry goes toactivities where real output cannot be measured.
8. The use of the term Ôlearning processÕ is somewhat metaphorical, as it combines various time-dependent processes, only some of which constitute real microeconomic learning processes.This ÔglobalÕ use of the term Ôlearning processÕ will become clearer as we proceed.
9. Note that this is a restrictive measure given the assumption in endogenous growth theory thatthe entire stock of human capital impacts the efficiency of production.
10. The sharp reduction in the price of microprocessors is an important feature of ICTs.11. See Nickel (1996) and Cotis et al. (1995).12. Similarly for Germany, Di Nardo and Pischke (1997) show that the use of computers results
in positive returns for individuals . . . but so does the use of pencils. Only Bell (1996), usinga sample of 1000 individuals, born in 1958 and surveyed in 1981 and 1991, found a netincreasing effect on wages for those using computers at work in 1991, thus supportingKruegerÕs view (assuming that no one used computers in 1981).
13. This distinction is correlated with a number of alternative distinctions based on broad char-acteristics of educational attainment or occupational category, as Berman et al. (1995) haveshown for the USA.
14. The shift towards service activities is a major cause of the decrease in demand for motorskills.
15. A similar result is observed in most large OECD countries (see OECD 1996b).16. These structures display different capacities for facing and organizing technological change,
with the Japanese horizontal structure of information (in its work organization) being morefit to diffuse and implement incremental innovations in products or processes, whereas USfirms, with their more vertical structures of information (as characterized by their hierarchi-cal work organization) would be better at facing radical technical changes.
17. This hypothesis would explain the current period as a standard period of transition.18. This debate seems more active in other social science disciplines, such as sociology, politi-
cal science, geography or business and management sciences. Most economic studies of theconsumer surplus deal with very narrowly defined products (see, for example, Fischer andGrilichesÕ (1995) study of two prescription drugs, TrajtenbergÕs (1990) discussion of CATscanners or HausmanÕs (1994) analysis of a new breakfast cereal.
19. This is based on Reinsdorf (1993).20. The total bias in CPI measurement in the USA amounts to 1.10 per cent a year when all of
the technical improvements in measurement made by the BLS (Bureau of Labor Statistics)since 1996 are taken into account.
21. The Boskin report gives some examples of this delayed inclusion (p. 39), mentioning thatcellular phones (with over 36 million users in the USA) were not included in the CPI basketat the time of the reportÕs writing, despite being used by over 36 million people.
22. Forse (1998), for instance, stresses this weakening of class ties.23. These problems are compounded by the fact that low-skilled workers are subject to rigid
work schedules, while skilled workers and professionals have more flexible workingarrangements, even if their hours are longer (see Schor, 1999).
24. We are the word ÔportfolioÕ in reference to studies in industrial organization that stress thatnew large firms are engaging in a series of alliances, joint ventures and the like, which theyattempt to manage in an optimal fashion so as to deal with rapid changes in competition andtechnologies in various markets.
25. There are absolute and relative dimensions to this dissatisfaction. Some have increasingdifficulty coping with the contemporary challenges of more demanding labour markets andconsumer know-how (a euphemism for those with low incomes), while others (as stressedby Storper, 1999) resent the growing range of consumer outcomes, based on the fact thatindividual satisfaction may depend on the position of others as well as oneself.
Is a biased technological change fuelling dualism? 297
Downloaded from Elgar Online by University of Melbourne at 07/12/2013 04:52:38AM
REFERENCES
Acemoglu, D. (1998), ÔWhy do new technologies complement skills? Directed techni-cal change and wage inequality,Õ Quarterly Journal of Economics, 113, 1055Ð89.
Amable, B., J.B. Chatelain and O. De Bandt (1997) ÔStability and efficiency of thebanking sector and economic growth,Õ paper presented at the Royal EconomicSociety Meeting, University of Stoke on Trent, UK, March.
Amendola, M. and J.L. Gaffard (1988) The Innovative Choice. An Economic Analysisof the Dynamics of Technology, Oxford, Basil Blackwell.
Aoki, M. (1988) Information, Incentives and Bargaining in the Japanese Economy,Cambridge, Cambridge University Press.
Arthur, B.W. (1989) ÔCompeting technologies, increasing returns and locks-in byhistorical events,Õ Economic Journal, 99, 116Ð131.
Ashauer, D.A. (1989) ÔIs public expenditure productive?Õ Journal of MonetaryEconomics, 23, 177Ð200.
Ashauer, D.A. (1994) ÔPublic capital, productivity, and macroeconomic performance:a literature review in infrastructure in the 21st century economy,Õ FederalInfrastructure Strategy Program, Washington DC.
Atkinson, A., L. Rainwater and T. Smeeding (1995) ÔLa distribution des revenus dansles pays de lÕOCDE: documentation tir�e du Luxembourg Income StudyÕ in Ladistribution des revenus dans les pays de lÕOCDE, Etudes de Politique Sociale, 18,32Ð65.
Attewell, P. (1994) ÔInformation technology and the productivity paradox,Õ in D. Harris(ed.) Organizational Linkages: Understanding the Productivity Paradox,Washington, National Research Council, National Academy Press, 13Ð53.
Barro, R. (1990) ÔGovernment spending in a simple model of endogenous growth,ÕJournal of Political Economy, 23, 103Ð25.
Bell, B.D. (1996) ÔSkill biased technical change and wages: evidence from a longitu-dinal data set,Õ mimeo, Institute of Economics and Statistics, University of Oxford.
Berman, E., J. Bound and Z. Griliches (1994) ÔChanges in the demand for skilled laborwithin US manufacturing: evidence from the annual survey of manufactures,ÕQuarterly Journal of Economics, 109, 367Ð97.
Berman, E., J. Bound and S. Machin (1995) ÔImplications of skill biased technologicalchange: international evidence,Õ paper presented at the Expert Workshop onTechnology, Productivity and Employment: Macroeconomic and SectoralEvidenceÕ, OECD, Paris, 19Ð20 June.
Berman, E., J. Bound and S. Machin (1998) ÔImplications of skill-biased technologicalchange: international evidence,Õ The Quarterly Journal of Economics.
Berndt, E.R. and B. Hanson (1992) ÔMeasuring the contribution of public infrastruc-ture capital in Sweden,Õ Scandinavian Journal of Economics, Supplement, 94,S151Ð72.
Boskin, M. (ed.) (1966) Towards a More Accurate Measure of the Cost of Living, FinalReport to the Senate Finance Committee, December.
Boulier, D. (1994) ÔLÕacc�s aux soinsÕ in P. Musso (ed.), Communiquer Demain, Paris,Datar/Editions de lÕAube.
Card, D., F. Kramarz and T. Lemieux (1995) ÔChanges in the relative structure of wagesand employment: a comparison of the US, Canada and France,Õ Working Paper,Princeton University.
Cotis, J.P., J.M. Germain and A. Quinet (1995) ÔProgr�s technique, commerce interna-tional et travail peu qualifi�,Õ mimeo, Direction de la Pr�vision, Paris.
298 Structural change and demand-led growth
Downloaded from Elgar Online by University of Melbourne at 07/12/2013 04:52:38AM
David, P. (1991) Computer and Dynamo: The Modern Productivity Paradox in a NotToo Distant Mirror, Paris, OECD.
De Long, B. and L. Summers (1991) ÔEquipment investment and economic growth,ÕQuarterly Journal of Economics, 106.
Denny, M. and M. Fuss (1983) ÔThe effects of factor prices and technological changeon the occupational demand for labour: evidence from Canadian telecommunica-tions,Õ Journal of Human Resources, 18, 161Ð76.
Di Nardo, J.E. and J.S. Pischke (1997) ÔThe returns to computer use revisited: havepencils changed the wage structure too?Õ The Quarterly Journal of Economics, 112,291Ð303.
Dosi, G., C. Freeman, R. Nelson, G. Silverberg and L. Soete (eds) (1988) TechnicalChange and Economic Theory, London, Pinter Publishers.
Dymski, G. and J. Veitch (1993) ÔRace and the financial dynamics of urban growth: LAas Fay Wray,Õ Working Paper 92Ð21, Dept. of Economics, University of California,Riverside.
Entorf, H. and F. Kramarz (1997) ÔDoes unmeasured ability explain the higher wagesof new technology workers?Õ European Economic Review, 41, 1489Ð1510.
Entorf, H. and F. Kramarz (1998) ÔThe impact of new technologies on wages: lessonsfrom matching panels of firms and individuals,Õ Economics of Innovation and NewTechnology, 5, 165Ð97.
Entorf, H., M. Gollac and F. Kramarz (1996) ÔNew technologies, wages and workerselection,Õ Journal of Labour Economics.
Fenwick, D. (1997) ÔDoes the UK retail prices index exaggerate inflation?Õ mimeo.,Congr�s AFSE, Paris.
Fischer, F.M. and Z. Griliches (1995) ÔAggregate price indices, new goods and gener-ics,Õ Quarterly Journal of Economics, 110, 229Ð44.
Fors�, M. (1998) ÔDiminution de la conscience de classe,Õ in L. Dirn (ed.) La soci�t�fran�aise en tendances 1975Ð1995, Paris, coll. Sociologie dÕaujourdÕhui, PUF.
Freeman, C. and L. Soete (1987) ÔInformation, technology and change in techno-economic paradigm,Õ in C. Freeman and L. Soete (eds) op. cit., 49Ð69.
Freeman, C. and L. Soete (eds) (1987) Technical Change and Full Employment, NewYork, Basil Blackwell.
Freeman, C. and L. Soete (1994) Work for All or Mass Unemployment, London, PinterPublishers.
Freeman, R. and L. Katz (1993) ÔRising wage inequality: the United States vs otheradvanced countries,Õ in R. Freeman (ed.) Working Under Different Rules, NewYork, Russell Sage Foundation, 29Ð62.
Galbraith, J.K. (1958) The Affluent Society, Boston, Houghton Mifflin.Gibbons, M. et al. (1994) The New Production of Knowledge, Sage, London.Gollac, M. (1996) ÔLe capital est dans le r�seau: la cooperation dans lÕusage de lÕin-
formatique,Õ Travail et Emploi, 68, 39Ð60.Goodman, P., J. Lerch and T. Mukhopakhyay (1994) ÔIndividual and organizational
productivity: linkages and processes,Õ in D. Harris (ed.) Organizational Linkages:Understanding the Productivity Paradox, Washington, National Research Council,National Academy Press, 54Ð80.
Gordon, R. (1990) ÔThe measurement of durable goods prices,Õ NBER Studies inIncome and Wealth, Chicago, University of Chicago Press.
Gottschalk, P. (1993) ÔChanges in inequality of family income in seven industrializedcountries,Õ American Economic Review, 83, 132Ð42.
Goux, D. and E. Maurin (1995) ÔLes transformations de la demande de travail en
Is a biased technological change fuelling dualism? 299
Downloaded from Elgar Online by University of Melbourne at 07/12/2013 04:52:38AM

France. Une �tude sur la p�riode 1970Ð1993,Õ Document de travail INSEE.Translated as ÔChanges in the demand for labour in France: a study for the period1970Ð93,Õ paper presented at the Expert Workshop on Technology, Productivity andEmployment: Macroeconomic and Sectoral EvidenceÕ, OECD, Paris, 19Ð20 June.
Granovetter, M. (1995) ÔEconomic action and social structure: the problem of embed-dedness,Õ American Journal of Sociology, 91, 481Ð510.
Griliches, Z. (1969) ÔCapital-skill complementary,Õ Review of Economics andStatistics, 51, 465Ð468.
Griliches, Z. (1994) ÔProductivity, R&D, and the data constraint,Õ American EconomicReview 84, 1Ð23.
Group of Prominent Persons (1994) ÔEurope and the Global Information Society:Recommendations to the European Council,Õ Industrial Group of ProminentPersons, Brussels, European Community.
Harris, D. (1994) Organizational Linkages: Understanding the Productivity Paradox,Washington, National Research Council, National Academy Press.
Hausman, J. (1994) ÔValuation of new goods under perfect and imperfect competition,ÕNBER Working Paper no. 4970, December.
High Level Expert Group (1996) Building the European Information Society for Us All,Report by the High Level Expert Group for the European Commission, January.
Howell, D. and E. Wolff (1992) ÔTechnical change and the demand for skills by USindustries,Õ Cambridge Journal of Economics, 16, 128Ð46.
Kaldor, N. (1972) ÔThe irrelevance of equilibrium economics,Õ Economic Journal, 82,1237Ð55.
Kremer, M. and E. Maskin (1996) ÔWage inequality and segregation by skill,Õ NBERWorking Paper no. 5718.
Krueger, A. (1993) ÔHow computers have changed the wage structure: evidence frommicro data 1984Ð1989,Õ Quarterly Journal of Economics, 108, 33Ð60.
Landauer, T.K. (1995) The Trouble with Computers: Usefulness, Usability andProductivity, Cambridge, MA, The MIT Press.
Lequillier, F. (1997) ÔDoes the French consumer price index overstate inflation?ÕWorking paper no. G9714, Direction des Etudes et Synth�ses Economiques,INSEE, Paris.
Lucas, R. (1988) ÔOn the mechanics of economic development,Õ Journal of MonetaryEconomics, 22, 3Ð42.
Lundvall, B.A. (1988) ÔInnovation as an interactive process: from user-producer inter-action to the national system of innovation,Õ in G. Dosi et al., op. cit., 3Ð42.
Machin, S. (1996) ÔChanges in the relative demand for skill in the UK,Õ in A. Booth andD. Snower (eds) Acquiring Skills, Cambridge, Cambridge University Press, 127Ð46.
Machin, S. and J. Van Reenen (1998) ÔTechnology and changes in skill structure: evidencefrom seven OECD countries,Õ Quarterly Journal of Economics, 113, 1215Ð44.
Mishel, L., J. Bernstein and J. Schmitt (1997) The State of Working America1996Ð1997, Washington, Economic Policy Institute.
Morrison, C.J. and A.E. Schwartz (1996) ÔState infrastructure and productive perfor-mance,Õ American Economic Review, 86, 1095Ð111.
Moulton, B. and K. Moses (1997) ÔAddressing the quality change issue in theconsumer price index,Õ Brookings Papers on Economic Activity, 1.
Munell, A. (1992) ÔInfrastructure investment and economic growth,Õ Journal ofEconomic Perspectives, 6, 189Ð98.
Myrdal, G. (1957) Economic Theory and Underdeveloped Regions, London,Duckworth.
300 Structural change and demand-led growth
Downloaded from Elgar Online by University of Melbourne at 07/12/2013 04:52:38AM

Nakamura, L. (1995) ÔIs US performance really that bad?Õ Working paper, FederalReserve Bank of Philadelphia, October.
Nelson, R. and S. Winter (1982) An Evolutionary Theory of Economic Change,Cambridge, MA, Harvard University Press.
Nickel, S. (1996) ÔUnemployment and wages in Europe and North America,Õ mimeo,Institute of Economics and Statistics, University of Oxford.
OECD (1994) The OECD Jobs Study: Evidence and Explanations; Part 1: LabourMarket Trends and Underlying Forces of Change, Paris, OECD.
OECD (1996a) Technology, Productivity and Job Creation, vol. 2, Paris, OECD.OECD (1996b) Technology and Industrial Performance, Paris, OECD.OECD (1998) Science, Technology and Industry Outlook, Paris, OECD.Oliner, S. and D. Sichel (1994) ÔComputers and output growth revisited: how big is the
puzzle?Õ Brookings Papers on Economic Activity, 2, 273Ð317.Packard, V. (1957) The Hidden Persuaders, London, Longman.Petit, P. and L. Soete (1996) ÔTechnical change and employment growth in services:
analytical and policy challenges,Õ paper presented at the conference on Technology,Employment and Labour Markets, Athens University of Economics and Business,16Ð18 May.
Piore, M. (1988) ÔCorporate reform in American manufacturing and the challenge toeconomic theory,Õ MIT Working Paper no. 533.
Pratt, J., A. Leyshon and N. Thrift (1996) ÔFinancial exclusion in the 1990s: the chang-ing geography of UK retail financial services,Õ Working Paper no. 34, Departmentof Geography, University of Bristol.
Reinsdorf, M. (1993) ÔThe effect of outlet price differentials on the U.S. consumerprice index,Õ in M.F. Foss et al. (eds) Price Measurements and their Uses: NBERStudies in Income and Wealth, no. 57, Chicago, University of Chicago, 227Ð54.
R�ller, L. and L. Waverman (1996) ÔLes r�percussions de lÕinfrastructure des t�l�com-munications sur le d�veloppement �conomique,Õ in P. Howit (ed.) (1996), 425Ð45.
Romer, P. (1986) ÔIncreasing returns and long-run growth,Õ Journal of PoliticalEconomy, 94, 1002Ð37.
Romer, P. (1990) ÔEndogenous technical change,Õ Journal of Political Economy, 98,71Ð102.
Schor, J. (1999) The Overspent American: Upscaling, Downshifting and the NewConsumer, New York, Harper Collins.
Sharpe, A. and M. Zyblock (1997) ÔMacroeconomic performance and income distrib-ution in Canada,Õ paper presented at the meetings of the American Economics andFinance Association, New Orleans, Louisiana, January.
Sichel, D. (1997) The Computer Revolution: An Economic Perspective, Washington,Brookings Institution Press.
Solow, R. (1957) ÔTechnical change and the aggregate production function,Õ Review ofEconomics and Statistics, 39, 312Ð20.
Storper, M. (1999) ÔLived effects of the contemporary economy: globalization,inequality, and consumer society,Õ Public Culture, forthcoming.
Trajtenberg, M. (1990) Economic Analysis of Product Innovation: The Case of CTScanners, Cambridge, MA, Harvard University Press.
Wolff, E. (1995) ÔTechnology and the demand for skills,Õ paper presented at the ExpertWorkshop on Technology, Productivity and Employment: Macroeconomic andSectoral Evidence,Õ OECD, Paris, 19Ð20 June.
Young, A. (1928) ÔIncreasing returns and technical progress,Õ Economic Journal, 38,527Ð42.
Is a biased technological change fuelling dualism? 301
Downloaded from Elgar Online by University of Melbourne at 07/12/2013 04:52:38AM

302
Tabl
e 15
.2P
rodu
ctiv
ity
grow
th b
y se
ctor
for
the
USA
, Can
ada,
Jap
an, G
erm
any
and
Fra
nce,
196
0Ð73
(pe
riod
1))
and
1984
Ð93
(per
iod
(2))
USA
Can
ada
Japa
nG
erm
any
Fran
cew
ZP
wZ
Pw
ZP
wZ
Pw
ZP
Agr
icul
ture
(1)
3.1
2.4
Ð0.1
3.1
0.2
Ð0.1
3.1
1.7
Ð0.1
2.7
7.0
0.0
7.8
8.4
0.1
(2)
1.9
3.6
0.0
3.3
0.7
0.0
3.2
0.7
Ð0.1
2.0
1.8
0.0
4.1
2.0
0.0
Min
ing
(1)
5.0
3.5
0.0
5.0
13.1
0.0
5.0
11.2
0.0
4.0
3.3
Ð0.1
2.9
Ð0.6
Ð0.1
(2)
3.3
5.8
0.0
6.3
4.1
0.1
0.3
4.0
0.0
0.9
1.4
0.0
0.9
6.3
0.0
Man
ufac
turi
ng(1
)19
.93.
30.
519
.95.
00.
519
.97.
30.
533
.34.
51.
320
.34.
71.
0(2
)19
.63.
20.
218
.82.
20.
027
.92.
90.
632
.20.
9Ð0
.123
.62.
40.
0U
tiliti
es(1
)2.
84.
70.
12.
85.
90.
12.
80.
80.
11.
65.
50.
11.
28.
90.
1(2
)3.
12.
70.
13.
30.
00.
03.
03.
60.
12.
82.
50.
02.
53.
70.
1C
onst
ruct
ion
(1)
8.5
Ð2.4
Ð0.2
8.5
Ð1.1
Ð0.2
8.5
1.3
Ð0.2
8.6
2.5
0.2
7.8
2.8
0.1
(2)
4.1
0.2
0.0
5.9
Ð1.0
0.0
7.8
2.2
0.2
5.8
0.6
0.0
5.6
1.9
0.0
Dis
trib
utio
n(1
)13
.21.
70.
313
.22.
70.
313
.22.
70.
311
.52.
30.
3n.
a.n.
a.n.
a.(2
)16
.51.
20.
213
.11.
20.
214
.31.
20.
210
.31.
30.
215
.30.
70.
1T
rans
port
and
(1)
4.8
3.7
0.1
4.8
3.1
0.1
4.8
1.1
0.1
5.0
4.0
0.2
n.a.
n.a.
n.a.
Com
mun
icat
ion
(2)
6.3
2.5
0.1
7.0
2.7
0.1
6.3
1.7
0.1
5.8
3.1
0.2
6.3
4.2
0.3
Fina
ncia
l and
(1)
17.2
0.1
0.4
17.2
2.8
0.4
17.2
7.8
0.4
9.3
7.8
0.4
13.3
1.8
0.7
Bus
ines
s Se
rvic
es(2
)23
.1Ð1
.00.
218
.00.
80.
414
.61.
80.
312
.91.
80.
318
.8Ð0
.50.
5So
cial
Ser
vice
s(1
)8.
21.
10.
18.
2Ð4
.80.
18.
21.
20.
19.
81.
20.
3n.
a.n.
a.n.
a.(2
)8.
9Ð0
.90.
15.
41.
30.
113
.51.
20.
213
.02.
10.
75.
11.
10.
2To
tal I
ndus
try
(1)
85.5
1.7
1.4
85.5
3.0
1.4
85.5
4.8
1.4
85.9
3.7
2.9
77.6
4.3
3.3
(2)
88.2
1.0
0.9
81.2
1.3
0.9
90.0
1.5
1.5
85.8
1.7
1.4
82.2
1.9
1.2
Tota
l all
sect
ors
(1)
100.
01.
51.
510
0.0
2.2
2.2
100.
04.
44.
410
0.0
3.3
3.3
100.
03.
63.
6(2
)10
0.0
0.9
0.9
100.
00.
90.
910
0.0
1.5
1.5
100.
01.
51.
510
0.0
1.4
1.4
Not
es:
w d
enot
es s
hare
in v
alue
add
ed, Z
is la
bour
pro
duct
ivity
gro
wth
(an
nual
per
cent
age
rate
) an
d P
deno
tes
cont
ribu
tion
to to
tal p
rodu
ctiv
ity g
row
th.
Sour
ce:
OE
CD
ISD
B.
Downloaded from Elgar Online by University of Melbourne at 07/12/2013 04:52:38AM

Age of Decline 8, 67, 68Ð9, 74Ð7, 79,80, 81
balance of payments see exports; growththeory, balance-of-payments-constrained
capacity utilization, rate of 3Ð4, 9Ð10,11, 26, 31, 32, 33, 34, 38, 44Ð5, 47,115, 116, 121, 123, 124, 103, 131,132, 133, 134Ð5, 136, 137, 138,139, 141, 143Ð4, 145, 146, 155,156, 161, 162, 172, 173, 174, 175,176, 177, 178, 179, 180, 181, 182,184, 185, 186, 189, 190, 191, 193,194, 195, 196, 199, 200, 201, 202,205, 206, 252
see also stagnationism, exhilarationism
collective goods 13, 264Ð8see also network services
commodity hierarchy 2, 100, 243, 247see also growth theory,
transformationalconditional equilibrium 67, 71, 72, 73,
76, 82see also growth theory and the use of
equilibrium; provisional equilibrium
Cornwell, J. 1Ð2, 4, 6, 8, 9, 35, 36, 61,68, 69, 70, 75, 88, 118Ð19, 220,243
cumulative causation 2, 6, 8, 14, 28Ð9,67, 71Ð3, 89, 99Ð100, 215Ð16,218Ð20, 225, 226, 227Ð8, 229, 241,273, 278, 279Ð81
distribution 2, 5, 7, 9Ð10, 11, 13, 43, 46,51, 68Ð9, 71, 74, 77, 154, 155, 156,158, 159, 160, 164, 191, 192, 207,247Ð8, 274, 278, 288Ð95
and growth see economic growth anddistribution
dualism 14, 273Ð6, 280, 296
economic growthand the balance of payments 141Ð5,
202Ð5see also growth theory, balance-of-
payments-constrainedand capital mobility 141Ð5
see also economic growth andfinancial flows
and demand 1Ð5, 6, 7, 8, 9, 12Ð13,22, 24Ð6, 30Ð8, 44Ð6, 58Ð61,70Ð71, 72Ð3, 74Ð5, 76, 77Ð8, 79,87Ð8, 90, 91, 108, 115Ð24, 129Ð47,172, 218, 237Ð49, 251Ð69, 277,278Ð81
and distribution 2, 5, 9Ð10, 11, 13,43, 51, 129Ð47, 189, 190, 196Ð9,201Ð2, 252, 256, 263, 278, 280Ð81,296
see also economic growth, profit-led;economic growth, wage-led; exhilarationism; paradox of costs;stagnationism
and fiscal policy 7Ð8, 10, 13, 24Ð5,140Ð41, 161Ð3, 252, 267Ð8, 269
and financial flows 8, 10, 88, 90, 91,93Ð6, 97, 98, 104, 108
and inflation 2, 10Ð12, 72, 73, 90,144, 158, 172, 181Ð5, 189Ð90,199Ð205, 206Ð7, 218
and institutions 8, 10, 12, 27, 28, 67,70, 72, 74Ð5, 77Ð8, 80Ð81, 278
and money 22and prices 10, 11, 24, 88, 91, 104,
141Ð2, 241, 255Ð6, 258profit-led 2, 10, 129, 130, 134, 137,
138, 139, 140, 141, 142, 146, 147see also economic growth and
distribution; economic growth,wage-led
and structural change 2Ð3, 12Ð14,35Ð7, 70, 75, 237Ð49, 251Ð69,273Ð96
and the terms of trade 98, 190, 202Ð5
303
Index
Downloaded from Elgar Online by not authorized at 07/12/2013 03:11:14AM

economic growth (cont.):see also economic growth and the
balance of payments; growththeory, balance-of-payments-constrained
theory of see growth theorywage-led 2, 9, 10, 129, 130, 134,
139, 140, 141see also economic growth and
distribution; economic growth,profit-led
economies of scale see increasing returnsemployment
growth of 80, 88, 158and structural change see structural
change and employmentexports 2, 7, 8Ð9, 55, 56, 57, 59Ð61, 72,
87, 88Ð90, 91, 92, 97, 99, 103, 104,106Ð8, 119, 120, 122, 144, 145,154, 158, 159, 160, 202, 203, 218
see also economic growth and thebalance of payments; growththeory, balance-of-payments-constrained
expectations 9, 10, 24, 42, 47, 48Ð52,55, 71, 154, 156, 162, 179, 180,191, 192, 196, 221, 252, 253, 254,255, 263
exhilarationism 10, 131, 134, 136,137Ð8, 139, 140, 141, 142, 144,145, 146, 147, 198, 199
see also economic growth and distribution; economic growth,profit-led; paradox of costs; stagnationism
Fordism 237Ð8, 281see also markets, mass, development
of; mass production
Golden Age 8, 14, 67, 68Ð9, 73Ð7, 79,80, 81
government spending 7, 13, 55, 56, 57,59Ð61, 140, 154, 157, 158, 159,160, 266Ð8, 269
see also economic growth and fiscalpolicy
growth see economic growthgrowth theory
balance-of-payments-constrained 2,6, 8Ð9, 37Ð8, 87Ð108, 119Ð24
endogenous 1, 3Ð4, 5, 6, 19, 26Ð35,55, 87, 115, 116, 237, 248, 277Ð81
and historical time 5, 7, 8Ð9, 12,99Ð102, 215Ð16, 220, 224Ð5,227Ð8, 229see also growth theory and the use
of equilibrium; hysteresis; pathdependence; traverse
and Keynesian economics 1, 2, 6Ð7,19, 24Ð6, 30Ð5, 38, 117Ð19
Kaldorian 2, 6, 8Ð9, 12, 14, 28,67Ð82, 87Ð108, 119Ð24, 215Ð29,277Ð81
Kaleckian 2, 9Ð12, 129Ð47, 153Ð64,172Ð87, 189Ð207, 253Ð4
Marxian 7, 42Ð4, 129, 172, 176, 186,206
neoclassical 1, 3Ð4, 19Ð26, 27, 28,55, 67, 87, 91, 99, 103, 115, 116,156, 158, 237, 248, 277Ð8
and Sraffian themes 172, 176Ð8,181Ð5, 186, 206
transformational 2Ð3, 12Ð13, 237Ð49,251Ð69
and the use of equilibrium 2, 4, 8Ð9,67, 71, 72Ð3, 131, 172, 176Ð7,184Ð5, 216, 220, 227Ð9see also conditional equilibrium;
growth theory and historicaltime; hysteresis; path dependence; provisional equilibrium
Harrod, R. 1, 3, 13, 88, 89, 104, 158,164, 206, 252, 253
Hicks, J.R. 12, 88, 90, 104, 216, 217human capital 3, 14, 27, 116, 222, 258,
260, 277, 279, 281hysteresis 12, 35, 36, 186, 206, 216,
226, 227Ð8, 229see also growth theory and historical
time; growth theory and the use ofequilibrium; path dependence;traverse
inflationand growth see economic growth and
inflationconflict theory of 2, 10Ð12, 69, 74,
77, 158, 178Ð81, 190, 192Ð5
304 Index
Downloaded from Elgar Online by not authorized at 07/12/2013 03:11:14AM
see also prices, theory ofmismeasurement of 14, 288Ð90
increasing returns 87, 164, 218, 219,247
see also technical change; Verdoornlaw
information and communication technology 14, 78Ð9, 273, 275,281, 285, 286, 287, 290, 292,293Ð4, 295, 296
innovation 5, 28, 70, 91, 92, 103, 105,163Ð4, 244, 253, 256, 257, 258,260, 263, 275, 276, 277, 283, 287,289
institutions 68Ð9, 71, 207, 221, 292and growth see economic growth and
institutionsinterrelatedness 222, 223Ð4investment 2, 3, 5, 6, 7Ð8, 9, 10, 12Ð13,
22, 23, 25, 26, 27Ð8, 29, 30, 31,32, 35, 46Ð52, 55, 56, 59Ð61, 68,75, 77Ð8, 88, 89, 91, 104, 116, 129,130, 131, 132Ð3, 135-8, 139, 140,141, 142, 143, 145, 146, 154, 155,156, 157, 158, 159, 160, 161, 162,163, 175, 176, 189, 190, 191, 196,197, 199, 206, 223, 244, 252,253Ð5, 257, 260, 261, 263, 264,268, 269, 274, 277, 278, 281, 284,285Ð6
Kaldor, N. 1, 2, 5, 6, 8, 12, 27, 28, 43,52, 61, 71, 87Ð8, 90, 99, 100, 102,107, 160, 172, 186, 189, 191, 215,216, 218, 220, 221, 225, 228, 229,241, 251Ð2, 253, 262, 274, 278,279
Kalecki, M. 2, 5, 6Ð7, 9, 10, 41, 46Ð8,51, 52, 129, 130, 132, 142, 154,155, 159, 161, 163, 164, 178, 191,226
Keynes, J.M. 1, 3, 6Ð7, 10, 25, 26, 42,48Ð52, 88, 153, 154, 155, 159, 176,189, 226
lock-in 100, 101, 221Ð2, 223Ð4, 225,227
Macroeconomic Regimes 67, 71, 80manufacturing sector 2, 36, 78Ð9, 247,
279, 281, 286
see also structural change; growththeory, transformational markets
mass, development of 3, 12Ð13,237Ð49
new, emergence of 13, 238Ð41,242Ð3, 244Ð6
mass production 237Ð8, 241, 242, 246,247, 248, 249, 255, 266, 267, 278,279
money 7Ð8, 26, 29, 45, 55, 56, 58,59Ð61, 153, 190
and growth see economic growth andmoney
neoliberalism 68, 77Ð81, 146Ð7see also economic growth and capital
mobility; economic growth andfinancial flows
network externalities 13, 260, 266, 269,296
network services 277, 279, 288, 290Ð93see also collective goods
paradox of costs 11, 44Ð5, 176, 177,178, 184Ð5, 186Ð7, 201, 206
see also economic growth and distribution; economic growth,wage-led; exhilarationism; stagnationism
paradox of thrift 11, 172, 177Ð8, 184,186, 201, 206
path dependence 5, 12, 88, 99, 102, 216,217, 220, 226, 227Ð8, 274, 292
see also growth theory and historicaltime; growth theory and the use ofequilibrium; hysteresis; traverse
pricesand competition 72, 91, 92Ð3, 105,
141Ð2, 145, 156, 162, 163, 202Ð5,242
and growth see economic growth andpricing
theory of 25, 91, 132, 142Ð3, 154,159, 174Ð5, 178Ð80, 191, 192, 237see also inflation, conflict theory of
productivitygrowth of 6, 8, 12, 13, 21, 37, 38, 67,
68, 71, 72Ð3, 75, 76, 78-80, 81,120, 156Ð7, 158, 162, 216, 218,221, 241Ð2, 257, 260Ð61, 262, 263,267, 269, 279, 281
Index 305
Downloaded from Elgar Online by not authorized at 07/12/2013 03:11:14AM
productivity (cont.):see also technical progress;
Verdoorn Lawparadox 276Ð7, 286, 295and structural change see structural
change and productivity growthprofit, rate of 9, 10, 11, 41, 42, 43, 44,
45, 51, 129, 130, 132, 133, 135,136, 138, 146, 172, 173, 174, 175,176Ð7, 178, 179Ð85, 186, 191, 196,199, 200, 201, 206, 252, 253Ð4,261, 263
profit share see distribution; economicgrowth and distribution
provisional equilibrium 4, 131, 172,177, 184Ð5, 216, 229
see also conditional equilibrium;growth theory and the use of equilibrium
Robinson, J. 2, 9, 172, 178, 186, 189,226, 253, 261
service sector 2, 14, 36, 75, 79, 247,275, 277, 279, 280, 281, 286, 290
see also growth theory, transformational; network services;structural change
Solow, R. 3, 6, 19, 20, 21, 22, 23, 25,26, 79, 91, 99, 115, 116, 237,251Ð2, 277
stagnation 130, 156Ð7, 158, 163Ð4, 244,248
stagnationism 9, 10, 44Ð5, 129, 130,133Ð4, 136Ð7, 138, 139, 140, 141,142, 144, 145, 146, 147, 158, 160,198, 199, 208Ð10
see also economic growth and distribution; economic growth,wage-led; exhilarationism; paradoxof costs
Steindl, J. 10, 130, 156Ð7, 161, 162,163Ð4, 191
structural changeand employment 4, 79, 258Ð9, 274Ð5,
281Ð8, 295Ð6and growth see economic growth and
structural changeand productivity growth 12, 75, 79,
260Ð61see also productivity, growth of
technical progress 5, 6, 20, 21, 22, 27,28, 29, 30, 31, 32, 38, 43, 47, 75,87, 105, 161, 220Ð4, 263Ð4, 267,277, 290, 296
skill-biased 14, 276, 281Ð8see also productivity, growth of;
Verdoorn LawThirlwall, A.P. 2, 6, 37, 71, 87, 90, 91,
92, 93, 94, 96, 97, 99, 100, 101,103, 115, 119, 121, 218, 220
ThirlwallÕs Law 2, 8, 9, 91, 92, 96, 97,98, 99, 101, 102, 104, 105, 108
traverse 4, 12, 216Ð17, 220, 221, 222,225Ð6, 227, 228, 229
see also growth theory and historicaltime; growth theory and the use ofequilibrium; hysteresis; path dependence
underconsumption see paradox of costs;stagnationism
unemployment 34, 37, 43, 44, 45, 51,68, 69, 75, 77, 81, 100, 121, 124,153, 155, 161, 163, 193, 205, 207,240Ð41, 284, 294, 295
Verdoorn Law 5, 9, 38, 71, 72, 73, 75,78, 115, 120, 123, 218, 219, 221,223Ð4, 262
see also productivity, growth of; technical progress
wage share see distribution; economicgrowth and distribution
306 Index
Downloaded from Elgar Online by not authorized at 07/12/2013 03:11:14AM