Golden Age of Philanthropy R3S1-1 - bc.edu Golden Age o… · Technical Report John J. Havens Paul...
68
A Golden Age of Philanthropy Still Beckons: National Wealth Transfer and Potential for Philanthropy Technical Report John J. Havens Paul G. Schervish Center on Wealth and Philanthropy Boston College Released May 28, 2014 Estimates Compiled December 2011 ___________ We are grateful to the sponsors of this study (the Impact Foundation of North Dakota, the Dakota Medical Foundation, the Alex Stern Family Foundation, and SEI Investments Company) for their support of our work on wealth transfer and especially to J. Patrick Traynor, Julie Haugen, and Scott Holdman of the Impact Foundation for their considerable assistance in producing presentation materials and disseminating of the report. We are also thankful to Elizabeth LaJeunesse, Shelby Garber, Katie Duthaler, and Jessica Carrico of the Center on Wealth and Philanthropy for their assistance in developing the estimates presented in this report. In addition we appreciate the efforts of Lisa Kaloostian, James Gu, and Laura Kligler in the production of this report.
Transcript of Golden Age of Philanthropy R3S1-1 - bc.edu Golden Age o… · Technical Report John J. Havens Paul...

A Golden Age of Philanthropy Still Beckons: National Wealth Transfer and Potential for Philanthropy
Technical Report
John J. Havens Paul G. Schervish
Center on Wealth and Philanthropy Boston College
Released May 28, 2014 Estimates Compiled December 2011
___________ We are grateful to the sponsors of this study (the Impact Foundation of North Dakota, the Dakota Medical Foundation, the Alex Stern Family Foundation, and SEI Investments Company) for their support of our work on wealth transfer and especially to J. Patrick Traynor, Julie Haugen, and Scott Holdman of the Impact Foundation for their considerable assistance in producing presentation materials and disseminating of the report. We are also thankful to Elizabeth LaJeunesse, Shelby Garber, Katie Duthaler, and Jessica Carrico of the Center on Wealth and Philanthropy for their assistance in developing the estimates presented in this report. In addition we appreciate the efforts of Lisa Kaloostian, James Gu, and Laura Kligler in the production of this report.

2
Introduction This technical report documents work performed at the Center on Wealth and Philanthropy at Boston College during the summer and fall of 2011. The work was sponsored by the Impact Foundation of North Dakota, the Dakota Medical Foundation, the Alex Stern Family Foundation, and SEI Investments Company. The authors are grateful for the support of the sponsors as well as to the principals and staff of the Impact Foundation who contributed their time and skills as well as their funds in support of this work. There were two studies in this project. Both studies focused on estimates of wealth transfer and philanthropic giving by households during the period from 2007 through 2061. One study focused on the households in North Dakota. It portrays the remarkable story of a state that avoided the worst ravages of the recession as its economy grew in real terms by18% and the average wealth of its population increased from 13 percent below the national average in 2007 to 21 percent above the national average in 2010. This extraordinary growth portends significantly high levels of wealth transfer and charitable giving especially over the long term of 55 years. The report containing these estimates for the state of North Dakota and its 53 counties was released in Fargo on November 7, 2011, and is available from the Impact Foundation. The second study focused on household wealth transfer and charitable giving at the national level. Most of these households suffered and continue to suffer from the effects of the recession. This study produced its own set of unanticipated consequences with respect to wealth transfer and charitable giving. This report presents these new wealth transfer findings as well as projections of individual charitable giving during the next half century. Executive Summary In 1999 the Center on Wealth and Philanthropy (CWP) released “Millionaires and the Millennium: New Estimates of the Forthcoming Wealth Transfer and the Prospect for a Golden Age of Philanthropy”. In it we conservatively estimated that national wealth transfer in the 55-years from 1998 to 2052 would amount to $40.6 trillion in 1998 dollars, which translates into $52.0 trillion in 2007 dollars. During the summer of 2011 the Center on Wealth and Philanthropy updated and extended our Wealth Transfer Microsimulation Model (WTMM) and used it to produce new estimates of wealth transfer and household charitable giving for the 20-year period of 2007 through 2026 and also for the 55-year period from 2007 through 2061.

3
This study begins in the days immediately preceding the recession and the concomitant loss of wealth, jobs, financial security, and consumer confidence that affected most households throughout the county. The back story that provides the context for the focus of the current study (wealth transfer and charitable giving) is the abrupt transition from robust growth of household wealth, employment, and income1 in 2007 to the precipitous decline in household wealth, employment, and earned and unearned income (including capital gains) of the Great Recession of 2007. Since this is a study of wealth transfer, we will focus on household wealth. Assets owned by households fall into four categories: real estate, unincorporated business equity, financial assets, and other (e.g., vehicles, fine art, precious metals, options, and derivatives). The recession produced a steep decline in real estate, business equity, major components of financial assets, and contribution defined retirement funds. Some bonds (e.g., mortgage backed securities, issues of government sponsored enterprises) also declined in value. Lack of credit and reduced consumer demand resulted in lower market values for small, non-farm, unincorporated businesses and even S-corporations. Some bonds, used cars, and selected other tangible assets (excluding real estate) maintained or increased their value but not nearly enough to offset the decline in the other categories of assets. On average, the aggregate value of household assets declined slightly more than 20 percent. At the same time, household debt increased, on average, by about 2 percent. Consequently, household wealth (as measured by net worth) declined by about 25 percent both on average and in aggregate during the recession. Moreover, loss of wealth was pervasive: greater than 90 percent of households suffered a decline in their net worth; but some households lost more than others. In terms of the dollar value of the decline, households with $1 million or more in wealth in 2007 lost $916 thousand per household, on average, or almost $10 trillion in aggregate during the recession. In contrast, households with less than $100 thousand net worth in 2007 lost an average of $12 thousand per household ($977 billion in aggregate) during the recession. In terms of dollar loss, therefore, the roughly 10 percent of households at the upper end of the wealth distribution lost substantially more than the roughly 50 percent of households in the lower half of the wealth distribution. However, the impact of the loss was reversed if measured in terms of percentage of wealth. In this metric, the roughly 10 percent of households with net worth of $1 million or more in 2007 lost slightly more than 21 percent of their wealth on average and in
1 Wealth is different than income. We measure wealth as net worth: the market value of all assets of members of a household less all debt at a point in time. The value of a home, a 401k plan, a vehicle, or a mutual fund is examples of assets. Mortgages, credit card balances, and student loans are examples of debt. Income, on the other hand, is the flow of funds over a period of time. Examples of income include wages and salaries, interest, dividends, rents received, unemployment compensation, and Social Security income, among others.

4
aggregate during the recession. In contrast, the roughly 50 percent of households with net worth less than $100 thousand in 2007 lost slightly more than 81 percent of their wealth on average and in aggregate during the recession. It’s worth repeating this important finding: half the households in the country lost more than 80 percent of their aggregate wealth during the recession A major reason for this disparity involves the debt to asset ratios of each of these groups. In 2007 the ratio was below 1 percent for the group of households at the upper tenth of the distribution but greater than 70 percent for the group of households in the lower half of the distribution. As the value of assets declined, the value of debt did not. As a result, those households in the lower half of the distribution lost a much larger fraction of their wealth as compared with those at the upper end of the distribution – although households throughout the distribution lost wealth. Through its effect on wealth and the distribution of wealth, the recession had a major impact on wealth transfer and on the financial capacity of households to make charitable donations. Since the proportional reduction of wealth was smaller among the wealthy households that donate the most to charitable causes and that account for the majority of wealth transfer as compared with households at the lower end of the distribution, the recession’s impact on wealth transfer and charitable giving was somewhat attenuated. In our analysis of wealth transfer, we tracked the value of assets and debt of all households in 2007, in 2008, in 2009, and in 2010 based on asset valuations and portfolio composition. In this way we adjusted for the impact of the recession. Another part of the story concerning wealth transfer involves the increase in transfers of assets during lifetime in conjunction with estate planning and transfers to heirs and other entities. Based on analysis of successive independent samples of affluent and wealthy individuals from the Federal Reserve, there is an increasing amount of assets transferred out of the household portfolios of affluent and wealthy households headed by people age 65 to 79. This transfer was not evident before the millennium. This pattern of transfer is increasing in frequency over time since then and also increasing in amount at successively higher levels of household wealth. Anecdotal evidence supports the growth in this pattern. From wealth advisors and financial planners we are told that more assets are being transferred via trusts, partnerships, direct gifts, and other vehicles of transfer during the lifetime of wealth holders than was the case 10 to 15 years ago. In addition, statistics indicate a major increase in the asset values of private foundations, donor advised funds, split-interest trusts, and living trusts from 1997 through 2007. We do not have good data on the final destination of these assets because they are not publicly available. We do have Federal Reserve data that indicates that inheritances received in recent years are consistently higher than implied by estate tax data from the IRS. This fact supports the proposition that some assets are being transferred to heirs by means other than estates during the lifetime of wealth holders.

5
Although we cannot identify the recipients with precision, we can estimate the value of total lifetime transfers and we can also estimate the amount of this value that is donated to charitable causes. In our current analysis, we expanded the concept of wealth transfer to include these lifetime transfer of assets and we have expanded our wealth transfer model to include such transfers made in conjunction with major changes in the composition of the portfolios of wealth holders near traditional retirement age. The main point of the wealth transfer story is that wealth transfer adjusted for the recession (as indicated above) exceeds our 1999 estimates. In 1999 we estimated that 2% growth would result in a transfer of wealth amounting to $52.0 trillion in 2007 dollars ($40.6 trillion in 1998 dollars) for the 55-year period from 1998 through 2052. Our current estimate of wealth transfer for the 2% growth scenario is $58.1 trillion in 2007 dollars for the 55-year period from 2007 through 2061 – 12% greater than our original estimate. This estimate assumes that estate taxes would revert to 2001 taxation levels with a $1 million exemption after 2012. If the estate taxes remain at the 2011 levels with a $5 million exemption after 2012 our estimate increases to $59.0 trillion. The above estimates take into account the massive decline in wealth during the recession. If there were no recession, we estimate that the corresponding estimates would be roughly 25%greater: in the case of the 2% growth scenario they would be $72.2 trillion and $73.3 trillion, respectively. Lifetime transfer of assets accounts for about 17% of the transfer; final estates (estates of never married, divorced, or widowed decedents) account for the remaining 83% of the transfer. We estimate the value of final estates to be $48.2 trillion if estate taxes revert to 2001 levels and $49.0 trillion if estate taxes remain at their 2011 levels. The value of final estates is thus 7.3% lower than our original estimates for final estates. The value of final estates is distributed to estate taxes, charitable bequests, bequests to heirs, and estate closing costs. The estate tax provisions have a large impact on this distribution. In the 2 percent scenario, the distributed amounts are: $9.8 trillion to estate taxes, $5.4 trillion to charity, $32.0 trillion to heirs, and $1.1 trillion to estate closing costs – if estate taxes revert to 2001 levels after 2012. The distributed amounts are: $5.6 trillion to estate taxes, $6.3 trillion to charity, $36.0 trillion to heirs, and $1.1 trillion to estate closing costs – if estate taxes remain at their 2011 levels after 2012. It should be noted that the current levels of taxation lead to less transfer to the government and more to charity and heirs than is the case if estate taxes revert to their 2001 levels. Assuming that both income and wealth grew at 2%, we estimated the potential charitable giving during the 55-year period. There are three components to these estimates, one of which (baseline estimate along trend) was independent of the wealth transfer analysis and two of which (accelerated lifetime transfers to charity and charitable bequests) derived from the wealth transfer projections. The sum of the three components amounts to $26.0 trillion if estate taxes revert to their 2001 levels after 2012 and $26.9 trillion if estate taxes remain at their 2011 levels.

6
In addition to the 2% growth scenario, we derived wealth transfer estimates for three other real rates of growth: 1%, 3%, and 4%. Within each growth rate, we derived estimates for two scenarios: one in which the estate taxes reverted to 2001 levels with $1 million exemption after 2012 and the other in which estate taxes remained at 2011 levels with $5 million exemption after 2012. Wealth transfer estimates range from $34.5 trillion to $188.5 trillion for the 55-year period, depending on the growth rate and estate tax provisions. During the same 55 years, our estimate of giving to charity ranges from $18.1 trillion to $72.7 trillion, again depending on the growth rate and estate tax provisions. In all scenarios, the value of lifetime transfers is approximately 17% of the total wealth transfer; the remaining 83% is transferred via final estates. Table 5, presented below, summarizes the results of these analyses for the 55-year period from 2007 through 2061, inclusive. It is important for the reader to note that in all scenarios the wealth transfer is wealth-dependent in the sense that most of the transfer is made by a small percentage of households whose wealth was $1 million or more at the time of the transfer or at the death of the wealth holder. In terms of final estates, 5 percent to 20 percent of these affluent or wealthy households account for roughly 63 percent to 88 percent of the wealth transfer through final estates in the 55-year time frame. Although wealth transfer will affect all households, most households will transfer a modest amount. With respect to charitable bequests, in all scenarios final estates valued at $20 million or more bequeath the largest amounts and the largest percentages of their estates to charitable causes in comparison with final estates of lesser value. In general the greater the wealth of the decedent the greater the proportion of their wealth, on average, is transferred to charity, both during their lifetime and through their estates at death. Not surprisingly, the study found thatlower estate taxes mostly affects the distribution of the value of estates and results in less of the transfer going to government through taxes and more to charity and heirs. The analysis assumes that fundraisers and charitable causes continue their current level of effort to obtain charitable donations and bequests. If their approach to fundraising becomes more effective, they have an opportunity to increase the amount that goes to charity well above our estimates. Households at all levels of income and wealth give to charitable causes. Roughly half the donations to charitable causes each year are made from households with less than $1 million in wealth; the other half are made from households with $1 million or more. The majority of charitable bequests and almost all the gifts made through split-interest trusts or similar vehicles of charitable giving are made by affluent or wealthy households. Americans at every income and wealth level tend to identify with the needs of others in society and try to help in ways that are appropriate to their circumstances.
7
Current Wealth Transfer Study The current research study, conducted by the Center on Wealth and Philanthropy at Boston College for the Impact Foundation of Fargo, North Dakota, uses a new and expanded version of its Wealth Transfer Microsimulation Model (WTMM). One of the major objectives of this study was to update and expand the national model. The second objective was to use the revised model to provide new estimates of wealth transfer. The wealth transfer model was updated and expanded during the spring and early summer of 2011. Some of the updates also included laying the groundwork for expanding future capabilities. For example, mortality rates were updated andthe number of categories was extended to include Latino as well as Caucasian, Black, and Other (Native American, Pacific Islander, and Asian). Major Updates of the WTMM There were four major areas for which the WTMM was updated:
1. Base Year Microdata File The WTMM microdata file contains the representative sample of households and all relevant information for the base year (2007) of the analysis. The file contains a national sample of households, weighted to be representative of the population in the base year. Each record in the file contains data on household wealth, relevant components of that wealth, selected demographic characteristics, other household financial data, and selected family characteristics. The WTMM relies on this file for the distribution of wealth in the base year and the distribution of wealth by age also in the base year. The first version of the file was based on the Survey of Consumer Finances (SCF) for 1998. We updated this file to the Survey of Consumer Finances for 2007, the most recent year for which the survey is available. In updating the file, we also updated the base year to 2007. Sponsored by the Board of Governors of the Federal Reserve, the Survey of Consumer Finances is a triennial detailed survey of household wealth and components of wealth, household income and components of income, work history, employment status, inheritance, charitable donations, and demographic characteristics. The 2007 survey is based on a sample of 4,418 households consisting of a nationally representative sample of 2,915 households and a second oversample of 1,503 wealthy and very wealthy households. The Federal Reserve carefully weights the two parts of the sample to be representative of the full population of the country. We calibrated the wealth in the SCF to match the aggregate estimate of household

8
wealth published by the Federal Reserve. We also expanded the WTMM to adjust the wealth of each household in the microdata file in 2008, 2009, and 2010 to reflect the recession’s impact on wealth – as described in the section, “Recent History of Household Wealth and the Recession”.
2. Mortality Rates The WTMM uses mortality rates by age, race, and gender to actuarially determine the timing and number of final estates. The most recently available mortality rates (2007 Vital Statistics Report from the Centers for Disease Control and Prevention) by age, gender, and race were installed in the WTMM. The race variable was extended to include Latino along with Caucasian, Black, and Other (Native American, Pacific Islander, and Asian).
3. Lifecycle Saving Rates The WTMM relies on lifecycle savings rates to augment the growth of wealth above the secular rate or to decrement the growth of wealth below the secular rate depending on lifecycle state and wealth of the household. These rates measure the average change in wealth for households at different periods of their lifecycle as captured by age of head. Based on data from successive SCF surveys we re-estimated the lifecycle savings rates by wealth of household and age of head. These rates were then installed in the WTMM.
4. Estate Tax Distribution Parameters
The WTMM uses the estate tax distribution parameters to distribute the value of final estates to estate taxes, charitable bequests, bequests to heirs, and estate closing costs in the base year of the study. Thereafter, it modifies these values based on an estate tax microsimulation sub-model. The estate tax distribution parameters were updated to reflect the base year distribution based on data from the Statistics of Income Division of the Internal Revenue Service.
Major Expansions of the WTMM The 2011 version of the WTMM contained five major expansions compared with the prior version of the model:
1. Asset Groupings Assets were grouped into four categories: real estate, other tangible assets (mostly vehicles), business equity, and financial assets. In the expanded WTMM each asset category can be assigned its own secular growth rate that permits, for

9
example, real estate to grow more slowly than business equity and business equity to grow more slowly than financial assets. At some future date, the secular rates in each category could be made time-dependent so that each asset category can be represented as a time-dependent profile of annual growth rates.
2. Wealth Adjustments for Recession
The WTMM was expanded to adjust the values of household assets and debt to historical values based primarily on changes in valuation of assets in each household portfolio. These adjusted values supersede the secular growth rates for the years in question. Thus the expanded model adjusts the valuation of each household’s portfolio in 2008, 2009, and 2010 for the effects of the recession on both the value and distribution of household wealth. This modification permits the WTMM with a base year of 2007 to estimate wealth transfer during and after the recession. After 2010 the model uses its original secular growth rates to estimate household wealth.
3. Lifetime Transfers of Assets
The concept of wealth transfer was extended in the expanded version of the WTMM to include transfers made to heirs and other entities through trusts and other vehicles of asset transfer in conjunction with estate planning done during lifetime. Similarly the model itself was expanded to calculate the amount of asset transfers during lifetime in addition to the amount of asset transfers at death. The sum of these two components constitutes the WTMM estimate of wealth transfer. The asset transfers during lifetime were estimated from portfolio analysis of successive triennial Surveys of Consumer Finances. These transfers were further divided into known transfers to charitable organizations (including family foundations, charitable trusts, and donor advised funds) and transfers to other entities that may also have entailed gifts to charitable organizations2 in addition to transfers to financial vehicles such as trusts and limited family partnerships.
4. Estate Tax Simulation Sub-Model
An estate tax simulation sub-model was developed, tested, and installed in the WTMM. This sub-model estimates tax liability for final estates (estates with no surviving spouse) and also distributes the estate value among taxes, charitable bequests, bequests to heirs, and estate closing costs. The estimates and the distribution vary depending on the asset value of the estate.
2 The IRS data indicate that these trusts make charitable donations of several billion dollars per year and that some of them are reorganized as charitable trusts each year. The lifetime charitable estimate is therefore a conservative estimate.
10
This sub-model replaces the prior distribution algorithm that was based on historical patterns of tax liability and distribution in the base year. The new sub-model incorporates the base year distribution but modifies tax liability depending on provisions of the estate tax law in effect at the time of death. Under current law, the estate taxes will revert to a $1 million exemption, higher tax rates, and no portability at the end of 2012. The new sub-model takes these changes into account; the previous module did not.
5. Portfolio Reorganization A portfolio reorganization module was developed, tested, and installed in the WTMM. Major changes in the composition of portfolios take place typically at ages 65 to 75 and mostly among affluent households. During this time, households divest themselves of substantial amounts of real estate and business equity and to a lesser extent financial assets as well. They also make major lifetime transfers during this period of portfolio reorganization. The portfolio reorganization module captures changes in portfolio composition as well as estimating lifetime transfers of assets.
. Scenarios of Wealth Transfer The WTMM is a bottom up model: it generates its estimates on a household-by-household basis and adds the results together to obtain its aggregate estimates. In addition to expanding the model, we also added a 1% growth scenario to our analysis repertoire. We thus estimated and analyzed wealth transfer for growth scenarios of 1%, 2%, 3%, and 4% real rates of growth. There are separate sets of estimates for each scenario in the analysis. Within each of the four growth scenarios there are two tax sub-scenarios: the $1 million estate tax exemption after 2012 when, under current law, the estate tax code expires and reverts to the prior 2001 tax code (with $1 million exemption), and second a tax sub-scenario in which the 2011 tax provisions (with $5 million tax exemption) remains in effect after 2012. Altogether we developed national wealth transfer estimates for 8 scenarios, 4 growth rate scenarios times two sub-scenarios of estate tax codes. It is not clear which scenario best portrays the future. We therefore present all estimates for all 8 scenarios. We note that since 1950 the average annual real rate of growth in household wealth has been 3.1 percent. This period has includes 9 recessions in addition to the most recent one. However, since 2000 the average annual real rate of growth in household wealth has been only 0.49% - although there have sporadic years with rates at or above 2% and, of course, the period since 2000 included the recession. Nevertheless, it is not clear when the economy will return to a sustained rate of growth exceeding 2% in real terms.

11
The new WTMM runs in real (inflation-adjusted) 2007 dollars. The rates of growth are real rates and the estimates are in real (2007) dollars. The expanded and updated WTMM estimates the transfer of wealth during lifetime and through estates at death. The more wealth transferred during lifetime implies less wealth transferred through estates at death. Our portfolio analysis of successive Surveys of Consumer Finances indicates that the greater the wealth of a household the greater amounts of wealth are transferred during lifetime and thus less wealth is transferred through estates at death. In the following sections we report our findings for the 20-year period from 2007 through 2026, inclusive, and also for the 55-year period from 2007 through 2061, inclusive. Assumptions of the WTMM The WTMM assumes that in the base year the distribution of wealth is represented in its micro data file. It further assumes that this wealth will grow at a constant secular rate as stated in the scenario but that this rate will be adjusted for life cycle savings depending on the age of the head of household. There are no marriages or new businesses founded in the model; however, there are deaths of householders and limited divestiture of business assets in the new WTMM through portfolio reorganization and lifetime transfers of assets. The model assumes that assets of a married decedent pass to their spouse and are only distributed to government, charitable causes, heirs, and estate closing costs when the surviving spouse dies. The original model assumed that estates would be distributed to estate taxes, charitable bequests, bequests to heirs, and estate closing fees based on IRS base year statistics by asset class. The expanded model starts with this same distribution for the base year but adjusts the values based on a new estate tax simulation sub-model, as described above. Running the WTMM in Context of the Recession In 2007, 116 million households in the United States owned $58 trillion in wealth-about 45% in tangible assets (mostly real estate), about 19% in business equity and 36% in financial assets. The $58 trillion represented an all-time peak in aggregate real household wealth in the United States and it was growing at real annual rate of 4 percent prior to October 2007. However, even though wealth was growing robustly in 2007, there were signs of the looming recession: the housing market was already in decline and housing prices were falling. However, offsetting the real estate market, financial markets were rising for most of the year. The DOW reached a peak of 14,164 on October 9, 2007. Thereafter the
12
financial markets began their rapid slide down to a DOW floor of 6,547 on March 9, 2009. In addition, the housing market continued to deteriorate through this period and has yet to reach bottom. Trends in household wealth mirrored the real estate and financial markets. Federal Reserve data indicates that the amount of wealth was fairly steady at $58 trillion through the first three quarters of 2007 and then began sliding rapidly to a low of $43 trillion (2007 dollars) in the first quarter of 2009 – a reduction of roughly 25 percent. Thereafter, household wealth began to climb slowly to a value of $48.6 trillion (2007 dollars) in the second quarter of 2011. At that time, it was still 17% lower than its 2007 peak. The recession and its slow recovery was the major financial event affecting household wealth and wealth transfer since 2007. It reduced aggregate wealth transfer by an average of 20 percent from what it would have been without the recession -- although the values vary from 17% to 23%, depending on the scenario. Our new wealth transfer analysis is based on the distribution of wealth from the most recent Survey of Consumer Finances, sponsored by the Board of Governors of the Federal Reserve, which happens to be for 2007—the peak year for household wealth. To account for the impact of the recession we adjusted the wealth of each household in the survey based on historical valuations of components of wealth during the recessionary years of 2008 through 2010. We began with a baseline value of $58 trillion of household wealth in 2007, according to data from the Federal Reserve. In all growth scenarios, we modified its annual value to match the historical record. In 2008, our adjustments reduced household wealth to $50 trillion; in 2009, to $46 trillion; and in 2010 increased it to $48.5 trillion. Thereafter, we applied the growth rate designated by the scenario in question. Through these adjustments, we account for the impact of the recession on household wealth3. We did not adjust wealth at the aggregate level. Instead, we adjusted it by revaluating the asset structure of each household in our micro-data file and then adjusting the composition of household portfolios to match control totals from Federal Reserve data. For the years from 2007 through 2010, this yields annual distributions of wealth that vary depending on the initial level and composition of wealth in 2007, annual asset valuations, and compositional variations in portfolios. It is important to emphasize that this reduction in wealth is accomplished for each household based on the composition of its portfolio. Thus a household with its entire portfolio in bonds would have had little reduction in wealth from 2007 through 2008. Those with all their assets in agricultural land actually saw an increase in their assets
3 The aggregate figures in this paragraph are based on annual values from the Federal Reserve; the aggregate figures in the prior paragraph are quarterly figures from the Federal Reserve.
13
during this time. In contrast, households with their assets in housing and mutual funds generally suffered a substantial decline in their wealth. Household debt was similarly adjusted on a household basis. Again we used historical data and control totals from Federal Reserve and Bureau of Economic Analysis to adjust household debt. It should be noted that in the first year of the recession many households increased their credit card debt in response to losing income. Thereafter, households shed debt through a variety of mechanisms. These adjustments were also made to each household in the analysis. National Findings There are two types of findings in this study. The first finding depicts the distribution of household wealth, its relationship to age, and how the recession affected it. These issues are important because the distribution of wealth and its relationship to age affect the amount and timing of wealth transfer. The recession reduced wealth of more than 90 percent of all households – in dollar terms more among wealthy households than among households in the lower half of the wealth distribution; but in percentage terms more among households in the lower half of the wealth distribution than among wealthy households. The second type of finding projects the level and distribution of wealth transfer and charitable giving for the 20-year period from 2007 through 2026 and also for the 55-year period from 2007 through 2061. We will see that the recession reduces the transfer by a substantial amount in all scenarios. Lifetime transfers move some of the transfer 15 to 20 years closer to current time. More than 60 percent of wealth transfer is made by households that have $1 million or more at the time of the transfer. The pattern is similar for charitable giving. The first set of findings involves the distribution of household wealth. I. The National Distribution of Wealth The amount of wealth and its distribution are important because they are major determining factors in the magnitude of national wealth transfer. The distribution of wealth by age is equally important because it is the major factor determining the timing of wealth transfer. In 2007, the aggregate household wealth (net worth) of the 116 million households in the United States amounted to just over $58 trillion (in 2007 constant dollars). Net worth is the market value of all assets owned by members of a household minus the values of all debt. On average the household net worth was $500,549 per household. The median value was $114,380. Based on changes in prices from a variety of professional sources (e.g., Case-Schiller and the National Association of Realtors for housing values; the Wilshire 5000 for stock
14
valuations, Lehman Brothers bond indices now maintained by Barclays Bank of London) and household portfolio compositional data from the Federal Reserve, the micro data file was adjusted for the recession for 2008, 2009, and 2010, as has been presented in a previous section of the report. At the low point of the recession (2009), aggregate net worth amounted to $46 trillion (2007 dollars) with an average value of $398,203 per household and a median of $73,067. The mean declined by 20%, the median by 36% - reflecting the fact that household wealth at the lower end of the wealth distribution suffered more in the recession than household wealth at the upper end. By 2010, the economy was slowly starting to recover. Aggregate wealth grew to $49 trillion (2007 dollars) with an average value of $417,963 per household and a median of $79,873. The mean increased by 5% and the median by 9% from their 2009 low values. However, they both remained significantly lower than their high values in 2007. The mean was 16% and the median 30% below their 2007 values. Table 1 portrays the distribution of household wealth in constant 2007 dollars in the base year of 2007 (when household wealth was at its peak before the recession) as well as in 2009 (when household wealth was at its nadir during the recession), and 2010 (when household wealth had started to recover but was still well below its peak level). In Panel A of Table 1, household wealth categories are constant across years but households may fall into different wealth categories in successive years as compared with previous years because their wealth is different in these successive years. Panel A shows how the distribution of wealth shifted during the recession. From Panel A we see that in 2007 there were 9.4 million households with $1 million or more in net worth. They comprised 8% of all households and owned 66% of aggregate household wealth. At the lower end of the distribution there were 12.2 million households whose debt was at least as large as their assets. In addition, there were another 58.8 million households whose wealth was positive but less than $200 thousand. Combined, these groups comprised 61% of the households and owned 6% of household wealth. The recession shifted the entire distribution of wealth downward. In Panel A, this is reflected mostly in the number and percentage of households in different wealth levels for 2007, 2009, and 2010. The number and percentages of households in all categories above $200 thousand declined from 2007 through 2009 and recovered only slightly between 2009 and 2010. For example, the number of millionaires fell 25% from 9.4 million in 2007 to 7.0 million in 2009 and recovered 7% to 7.4 million in 2010. The upper end of the wealth distribution shifted substantially lower as the result of the recession, but the lower end of the distribution was affected even more. Although there were 25% fewer millionaires in 2009 as compared with 2007, there were 6.5 million (53%) more households with negative or zero net worth during this same timeframe.
15
Table 1 panel B presents the same data from a different perspective. This panel categorizes all households by their wealth in 2007 and provides a profile of how their wealth changed from 2007 to 2009 and then to 2010. Panel B depicts how households at different wealth levels in 2007 fared during the recession – how their average and aggregate wealth changed during the recession and early recovery. The data for 2007 are identical in panels A and B. However, the data for 2009 indicates that on average, households at the upper end of the distribution lost more wealth in dollar terms than those at the lower end but that in percentage terms, they lost much less. In dollar terms, households with $20 million or more in net worth lost an average of $8 million by 2009 as compared with a dollar loss of $25 thousand per household for households in the $1 to $199,999 wealth category. However, in percentage terms the $8 million loss at the upper end of the distribution represented a 17% loss in wealth while in the lower category it represented, on average, a 41% loss and among households with negative or zero wealth in 2007 the recession increased the shortfall between their debt and the value of their assets by 46%. Panel B also indicates that by 2010 household wealth had barely recovered from its losses in 2009, either in dollar terms or in percentage terms. It remained the case that households in the upper end of the wealth distribution in 2007 were $7 million less wealthy, on average, in 2010 than they had been in 2007 and that households at the lower end remained $21 thousand less wealthy. In percentage terms households at the upper end recovered only 2% of their wealth as compared with a recovery of 6% of their wealth by households at the lower end. However, in 2010 the wealth of households at the lower end remained 35% below their 2007 level while households at the upper end remained 15% below their 2007 level, on average. Table 1 portrays how the distribution of wealth was affected by the recession – what historically happened to the distribution. But if the recession had not occurred, household wealth would have grown larger during this period. The impact of the recession on household wealth is not just the decline but also the foregone growth in wealth that would have occurred. Table 1 indicates that household wealth declined 16.5% in real terms between 2007 and 2010. If it had grown at 2% household wealth would have increased by roughly 6.1%. The total decline of 22.6% provides a rough estimate of the impact of the recession on both wealth and wealth transfer if wealth hasgrown at 2%. Of course, with 1% growth the impact of recession would be a reduction of 19.5% in wealth transfer; with 3% growth the impact would be 25.8%; and with 4% growth the impact would be 29.0%. II. The Distribution of Wealth by Age The recession decreased the potential amount of wealth that will be transferred during the next several decades and even beyond. Given this reduction, the timing of the transfer is affected mostly by the age distribution of wealth.
16
Table 2 presents the distribution of average wealth per household (2007 dollars) by age of head of household for 2007, 2009, and 2010. As classified in 10-year age categories, the largest number of households (25 million in 2007) involves heads whose age is between 40 and 49 years. The average wealth per household increases as age increases to its high value ($949,369 in 2007) at age 60 to 69 years and declines as age increases beyond age 70. It is important to note that young households are concentrated at the low end of the wealth distribution and often have significant amounts of installment loans on vehicles, student loans, and/or mortgage debt. The recession lowered average wealth per household in all age brackets; however, in percentage terms the impact of the recession was nearly twice as much at the youngest end of the age distribution in comparison to the oldest end. In 2009, for example, the average wealth per household declined 32% among households whose head was under age 30 as compared with a decline of 15% among households whose head was age 80 or older. Table 3 presents the distribution of aggregate household wealth (2007 dollars) by age of head of household for 2007, 2009, and 2010. This data is the most relevant for the timing of wealth transfer. It indicates that the largest amount of aggregate wealth ($16 trillion in 2007) occurs among households whose head is in the 50 to 59 year range. This lies between the age with the largest number of households and the age with the highest average wealth per household. The impact of the recession again reduced the aggregate households wealth in all age categories but affected the younger households nearly twice as much as the older households. This asymmetry in impact is a silver lining to the recession as far as it impacts wealth transfer. The older households will be transferring wealth near term and their aggregate wealth has declined less than average. Most of the wealth of younger households will not be transferred for decades. This delay in transfer allows younger households to recoup much of their wealth that was disproportionately diminished by the recession. They will have to increase their savings, consume less, invest more, work harder or otherwise arrange their finances to grow to do so. In fact there is evidence of higher levels of savings, paying down of debt, and slow growth of consumption since the recession, according to personal income tabulations from the Bureau of Economic Analysis. III. National Estimates of Wealth Transfer and Charitable Giving Scenarios The WTMM was run under four growth scenarios (1%, 2%, 3%, and 4% secular growth). The secular growth rates in all scenarios are activated in 2011. Between 2007 and 2011 the historical growth of wealth is used in each of the scenarios. The historical rates reflect the recession and generally result in substantially less wealth transfer than had wealth grown at the assumed rates rather than the secular rates.

17
Within each growth scenario the model was run for two estate tax scenarios - $1 million exemption and $5 million exemption. The $1 million exception is based on provisions of the current law throughout the period of the analysis. The current law consists of the provisions of the Economic Growth and Tax Relief Reconciliation Act of 2001 as subsequently amended by the Tax Relief, Unemployment Insurance Reauthorization and Job Creation Act of 2010. In particular the law sunsets at the end of 2012 and reverts to the estate tax provisions in effect in 2001, except that the exemption level is set at $1 million thereafter. The $5 million exemption is based on the same provisions prior to 2012 but keeps the $5 million exemption and other provisions at their 2011 levels thereafter. In total, there were eight scenarios: 4 growth models x 2 tax models=8 scenarios. Summary of Results The summary of findings for all scenarios are presented in Table 4 for the 20-year time frame from 2007 through 2026 and in Table 5 for the 55-year period from 2007 through 2061. Each column in these tables presents estimates for the scenario listed at the top of the column. The scenarios are defined in terms of both a rate of growth and an estate tax policy that is identified by its exemption level (either $1 million after 2012 for current law with its sunset provision or $5 million after 2012 if the provisions in effect in 2012 are extended). Tables 4 and 5 are formatted identically. The first row in the tables contains an estimate of the magnitude of wealth transfer for the period in question if there had been no recession. The second row contains our estimate of wealth transfer given that the recession occurred. The next three rows break the total transfer into three components: accelerated lifetime giving (i.e. transfers of assets) to charitable causes; other lifetime transfers of assets usually to trusts, limited partnerships, or directly to heirs; and assets of final estates at death. It should be noted that other lifetime transfers of assets might also involve some transfers to charitable under certain contingencies. The next four rows list estimates for the four distributional components of the value of final estates: estate taxes, bequests to charitable causes, bequests to heirs, and estate closing costs. The next five rows define the potential funds allocated to charity during the period in question for each scenario and is demarcated by the sub-heading entitled, “Potential for Charity”. The first row under this heading is an aggregate household giving along trend for the scenario in question. The second row lists additional accelerated giving estimated from
18
the model as part of wealth transfer. The next row is the sum of the prior two and is labeled, “Total Lifetime Giving”. The fourth row is the estimate of charitable bequests for the given scenario. The final row is the sum of Total Lifetime Giving and Charitable Bequests and is labeled, “Potential Total to Charity”. Wealth Transfer for 20-Year Time Frame Table 4 summarizes the national wealth transfer estimates as well as the potential giving to charity for all scenarios in the 20-‐year period from 2007 through 2026, inclusive. In the upper left corner, it indicates that in the 20-‐year period there will be 23.4 million final estates generated by the 2007 population of households. The amount of wealth transfer, its distribution, and the potential charitable giving depends on the secular rate of growth and on the provisions of the estate tax laws. The growth rate has the largest impact on these estimates. The estate tax provisions mainly affect distribution of final estates among taxes, charitable bequests, bequests to heirs, and estate closing costs. Through charitable bequests, the estate tax laws also affect the total potential for charity during the period in question. Table 4 indicates that from 2007 through 2026 there will be 23.4 million final estates. Between $13.0 trillion and $22.3 trillion of household wealth will be transferred during this period, depending on the scenario. Between $3.4 trillion and $6.6 trillion will be transferred during the lifetime of the householders. The remaining $9.6 trillion to $15.7 trillion will be transferred through the 23.4 million final estates of deceased householders. The value of final estates will be distributed to estates taxes, charitable bequests, bequests to heirs, and estate closing costs. Depending on the scenario, estate taxes will vary from $.8 trillion to $3.1 trillion; charitable bequests will vary from $.9 trillion to $2.1 trillion; bequests to heirs, from $7.0 trillion to $11.3 trillion; and estate closing costs, from $.2 trillion to $.4 trillion. The total potential for charity during this 20-year span will be a considerable $5.6 trillion to $8.3 trillion, again depending on the scenario. In all scenarios, however, much more than half the total (75% to 84%) will come from lifetime giving rather than charitable bequests. The remainder of this section presents the 20-year findings in more detail than above. There are parallel sections for each growth scenario. 1% Growth 2007-‐2026 In the 1% growth scenario with sunset provisions taking place after 2012 and the $1 million exemption reinstated, there will be $12.96 trillion of total wealth transfer from 2007 through 2026. There would have been $14.56 trillion had there been no

19
recession. The $12.96 trillion is divided among accelerated lifetime giving ($0.38 trillion); other lifetime transfers ($3.00 trillion), and the value of final estates ($9.58 trillion). (Recall a final estate is the value of the estate when the surviving spouse dies – that is, when there is no surviving spouse). The value of the final estate does not all go to heirs. It will be distributed to estate taxes ($1.39 trillion), charitable bequests ($.92 trillion), bequests to heirs ($7.04 trillion), and estate closing costs ($.23 trillion). The bottom rows of Table 4 list the potential charitable giving for the period from 2007 through 2026, inclusive. We performed an independent estimate of baseline lifetime charitable giving using a trend analysis. For the 1% growth scenario the estimate was $4.34 trillion. To this we add the $0.38 trillion of accelerated giving for a total lifetime giving amount of $4.72 trillion. We then add the charitable bequests through estates to the charitable lifetime giving to obtain a potential total to charity of $5.64 trillion in this 20-‐year 1% growth scenario with $1 million estate tax exemption level after 2012. Within the 1% growth scenario, the main difference in findings between the $1 million exemption scenario and the $5 million exemption scenario lies in the amount of estate taxes paid upon death and the distribution of the value of final estates to charitable causes, to heirs, and to estate closing costs. Table 4 indicates that within the 1% scenario, maintaining the estate tax exemption at $5 million after 2012 will result in $0.61 trillion less tax revenue, $0.10 trillion more charitable bequests, and $0.52 trillion more bequests to heirs and negligible changes in estate closing costs during the period from 2007 through 2026. Mostly through charitable bequests it also affects the potential amount allocated to charity during the period. 2% Growth 2007-‐2026 In the 2% growth scenario with sunset provisions taking place after 2012 and the $1 million exemption reinstated, there will be $15.52 trillion of total wealth transfer from 2007 through 2026. There would have been $17.52 trillion had there been no recession. The $15.92 trillion is divided among accelerated lifetime giving ($0.50 trillion); other lifetime transfers ($3.71 trillion), and the value of final estates ($13.05 trillion). The value of the final estate will be distributed to estate taxes ($1.84 trillion), charitable bequests ($1.16 trillion), bequests to heirs ($8.05 trillion), and estate closing costs ($.27 trillion). The bottom rows of Table 4 again list the potential charitable giving for the period from 2007 through 2026, inclusive. For the 2% growth scenario the independent estimate of baseline lifetime charitable giving was $4.63 trillion. To this we add the $0.50 trillion of accelerated giving for a total lifetime giving amount of $5.13 trillion. We then add the charitable bequests through estates to the charitable lifetime giving

20
to obtain a potential total to charity of $6.29 trillion in this 20-‐year 2% growth scenario with $1 million estate tax exemption level after 2012. Within the 2% growth scenario, the main difference in findings between the $1 million exemption scenario and the $5 million exemption scenario lies in the amount of estate taxes paid upon death and the distribution of the value of final estates to charitable causes, to heirs, and to estate closing costs. Table 4 indicates that within the 2% scenario, maintaining the estate tax exemption at $5 million after 2012 will result in $0.78 trillion less tax revenue, $0.13 trillion more charitable bequests, and $0.66 trillion more bequests to heirs and negligible changes in estate closing costs during the period from 2007 through 2026. Mostly through charitable bequests it also results in $0.13 trillion more in the potential amount allocated to charity during the period. 3% Growth 2007-‐2026 In the 3% growth scenario with sunset provisions taking place after 2012 and the $1 million exemption reinstated, there will be $18.18 trillion of total wealth transfer from 2007 through 2026. There would have been $20.80 trillion had there been no recession. The $18.18 trillion is divided among accelerated lifetime giving ($0.65 trillion); other lifetime transfers ($4.48 trillion), and the value of final estates ($13.05 trillion). The value of the final estate will be distributed to estate taxes ($2.36 trillion), charitable bequests ($1.45 trillion), bequests to heirs ($8.95 trillion), and estate closing costs ($.30 trillion). The bottom rows of Table 4 again list the potential charitable giving for the period from 2007 through 2026, inclusive. For the 3% growth scenario the independent estimate of baseline lifetime charitable giving was $4.95 trillion. To this we add the $0.65 trillion of accelerated giving for a total lifetime giving amount of $5.60 trillion. We then add the charitable bequests through estates to the charitable lifetime giving to obtain a potential total to charity of $7.04 trillion in this 20-‐year 3% growth scenario with $1 million estate tax exemption level after 2012. Within the 3% growth scenario, the main difference in findings between the $1 million exemption scenario and the $5 million exemption scenario lies in the amount of estate taxes paid upon death and the distribution of the value of final estates to charitable causes, to heirs, and to estate closing costs. Table 4 indicates that within the 3% scenario, maintaining the estate tax exemption at $5 million after 2012 will result in $0.94 trillion less tax revenue, $0.17 trillion more charitable bequests, and $0.78 trillion more bequests to heirs and negligible changes in estate closing costs during the period from 2007 through 2026. Mostly through charitable bequests it also results in $0.17 trillion more in the potential amount allocated to charity during the period.
21
4% Growth 2007-‐2026 In the 4% growth scenario with sunset provisions taking place after 2012 and the $1 million exemption reinstated, there will be $22.24 trillion of total wealth transfer from 2007 through 2026. There would have been $25.95 trillion had there been no recession. The $22.24 trillion is divided among accelerated lifetime giving ($0.87 trillion); other lifetime transfers ($5.74 trillion), and the value of final estates ($15.63 trillion). The value of the final estate will be distributed to estate taxes ($3.10 trillion), charitable bequests ($1.88 trillion), bequests to heirs ($10.30 trillion), and estate closing costs ($.35 trillion). The bottom rows of Table 4 again list the potential charitable giving for the period from 2007 through 2026, inclusive. For the 4% growth scenario the independent estimate of baseline lifetime charitable giving was $5.30 trillion. To this we add the $0.87 trillion of accelerated giving for a total lifetime giving amount of $6.17 trillion. We then add the charitable bequests through estates to the charitable lifetime giving to obtain a potential total to charity of $8.05 trillion in this 20-‐year 4% growth scenario with $1 million estate tax exemption level after 2012. Within the 4% growth scenario, the main difference in findings between the $1 million exemption scenario and the $5 million exemption scenario lies in the amount of estate taxes paid upon death and the distribution of the value of final estates to charitable causes, to heirs, and to estate closing costs. Table 4 indicates that within the 4% scenario, maintaining the estate tax exemption at $5 million after 2012 will result in $1.16 trillion less tax revenue, $0.22 trillion more charitable bequests, and $0.96 trillion more bequests to heirs and negligible changes in estate closing costs during the period from 2007 through 2026. Mostly through charitable bequests it also results in $0.22 trillion more in the potential amount allocated to charity during the period. Wealth Transfer for 55-Year Time Frame Table 5 summarizes our new national wealth transfer estimates as well as the potential giving to charity for all scenarios in the 55-‐year period from 2007 through 2061, inclusive. The format of the table is the same as the format of Table 4. In the upper left corner it indicates that in the 55-‐year period there will be 93.6 million final estates generated by the 2007 population of households. The amount of wealth transfer, its distribution, and the potential charitable giving depends on the secular rate of growth and on the provisions of the estate tax laws. The growth rate has the largest impact on these estimates. The estate tax provisions mainly affect distribution of final estates among taxes, charitable bequests, bequests to heirs, and estate closing costs. Through charitable bequests, the estate tax laws also affect the total potential for charity during the period in question.
22
The magnitude of the wealth transfer and of charitable giving will be more than proportionately larger in the 55-year period from 2007 through 2061 than in the first 20 years of this period due to two factors: (1) the magic of compound rates of growth will have more time to operate, and (2) inheritors will also grow their wealth and some of them will also transfer their wealth during this period. Table 5 indicates that from 2007 through 2061 there will be 93.6 million final estates. Between $34.5 trillion and $188.5 trillion of household wealth will be transferred during this period, depending on the scenario. Between $5.9 trillion and $32.6 trillion will be transferred during the lifetime of the householders. The remaining $28.6 trillion to $155.8 trillion will be transferred through the final estates of deceased householders. The value of final estates will be divided among estate taxes, charitable bequests, bequests to heirs, and estate closing costs. Estate taxes will vary from $2.4 trillion to $45.0 trillion; charitable bequests will vary from $2.7 trillion to $32.3 trillion; bequests to heirs, from $20.7 trillion to $89.4 trillion; and estate closing costs, from $.7 trillion to $3.0 trillion. The total potential for charity during this 55-year span will be a considerable $18.1 trillion to $72.7 trillion, again depending on the scenario. In all scenarios, however, more than half the total (56% to 85%) will come from lifetime giving rather than charitable bequests. The remainder of this section presents the 55-year findings in more detail than the summary above. There are parallel sections for each growth scenario. 1% Growth 2007-‐2061 In the 1% growth scenario with sunset provisions taking place after 2012 and the $1 million exemption reinstated, there will be $34.53 trillion of total wealth transfer from 2007 through 2061. There would have been $42.10 trillion had there been no recession. The $34.53 trillion is divided among accelerated lifetime giving ($0.78 trillion); other lifetime transfers ($5.12 trillion), and the value of final estates ($28.63 trillion). The value of the final estate does not all go to heirs. It will be distributed to estate taxes ($4.60 trillion), charitable bequests ($2.65 trillion), bequests to heirs ($20.70 trillion), and estate closing costs ($.67 trillion). The bottom rows of Table 5 list the potential charitable giving for the period from 2007 through 2061, inclusive. We performed an independent estimate of baseline lifetime charitable giving using a trend analysis. For the 1% growth scenario the estimate was $14.69 trillion. To this we add the $0.78 trillion of accelerated giving for a total lifetime giving amount of $15.47 trillion. We then add the charitable bequests through estates to the charitable lifetime giving to obtain a potential total
23
to charity of $18.11 trillion in this 55-‐year 1% growth scenario with $1 million estate tax exemption level after 2012. Within the 1% growth scenario, the main difference in findings between the $1 million exemption scenario and the $5 million exemption scenario lies in the amount of estate taxes paid upon death and the distribution of the value of final estates to charitable causes, to heirs, and to estate closing costs. Table 5 indicates that within the 1% scenario, maintaining the estate tax exemption at $5 million after 2012 will result in $2.22 trillion less tax revenue, $0.39 trillion more charitable bequests, and $2.14 trillion more bequests to heirs and negligible changes in estate closing costs during the period from 2007 through 2061. Mostly through charitable bequests it also results in $0.41 trillion more in the potential amount allocated to charity during the period. 2% Growth 2007-‐2061 In the 2% growth scenario with sunset provisions taking place after 2012 and the $1 million exemption reinstated, there will be $58.08 trillion of total wealth transfer from 2007 through 2061. There would have been $72.20 trillion had there been no recession. The $58.08 trillion is divided among accelerated lifetime giving ($1.45 trillion); other lifetime transfers ($8.39 trillion), and the value of final estates ($48.23 trillion). The value of the final estate will be distributed to estate taxes ($9.80 trillion), charitable bequests ($5.38 trillion), bequests to heirs ($31.98 trillion), and estate closing costs ($1.08 trillion). The bottom rows of Table 5 again list the potential charitable giving for the period from 2007 through 2061, inclusive. For the 2% growth scenario the independent estimate of baseline lifetime charitable giving was $19.17 trillion. To this we add the $1.45 trillion of accelerated giving for a total lifetime giving amount of $20.63 trillion. We then add the charitable bequests through estates to the charitable lifetime giving to obtain a potential total to charity of $26.01 trillion in this 55-‐year 2% growth scenario with $1 million estate tax exemption level after 2012. Within the 2% growth scenario, the main difference in findings between the $1 million exemption scenario and the $5 million exemption scenario lies in the amount of estate taxes paid upon death and the distribution of the value of final estates to charitable causes, to heirs, and to estate closing costs. Table 5 indicates that within the 2% scenario, maintaining the estate tax exemption at $5 million after 2012 will result in $4.15 trillion less tax revenue, $0.87 trillion more charitable bequests, and $3.99 trillion more bequests to heirs and negligible changes in estate closing costs during the period from 2007 through 2061. Mostly through charitable bequests, it also results in $0.91 trillion more in the potential amount allocated to charity during the period.
24
3% Growth 2007-‐2061 In the 3% growth scenario with sunset provisions taking place after 2012 and the $1 million exemption reinstated, there will be $95.91 trillion of total wealth transfer from 2007 through 2061. There would have been $121.53 trillion had there been no recession. The $95.91 trillion is divided among accelerated lifetime giving ($2.73 trillion); other lifetime transfers ($13.50 trillion), and the value of final estates ($79.67 trillion). The value of the final estate will be distributed to estate taxes ($19.86 trillion), charitable bequests ($11.82 trillion), bequests to heirs ($46.35 trillion), and estate closing costs ($1.64 trillion). The bottom rows of Table 5 again list the potential charitable giving for the period from 2007 through 2061, inclusive. For the 3% growth scenario the independent estimate of baseline lifetime charitable giving was $25.51 trillion. To this we add the $2.73 trillion of accelerated giving for a total lifetime giving amount of $28.24 trillion. We then add the charitable bequests through estates to the charitable lifetime giving to obtain a potential total to charity of $40.07 trillion in this 55-‐year 3% growth scenario with $1 million estate tax exemption level after 2012. Within the 3% growth scenario, the main difference in findings between the $1 million exemption scenario and the $5 million exemption scenario lies in the amount of estate taxes paid upon death and the distribution of the value of final estates to charitable causes, to heirs, and to estate closing costs. Table 5 indicates that within the 3% scenario, maintaining the estate tax exemption at $5 million after 2012 will result in $7.18 trillion less tax revenue, $1.87 trillion more charitable bequests, and $6.68 trillion more bequests to heirs and negligible changes in estate closing costs during the period from 2007 through 2061. Mostly through charitable bequests it also results in $1.94 trillion more in the potential amount allocated to charity during the period. 4% Growth 2007-‐2061 In the 4% growth scenario with sunset provisions taking place after 2012 and the $1 million exemption reinstated, there will be $184.48 trillion of total wealth transfer from 2007 through 2061. There would have been $238.20 trillion had there been no recession. The $184.48 trillion is divided among accelerated lifetime giving ($5.61 trillion); other lifetime transfers ($26.11 trillion), and the value of final estates ($152.76 trillion). The value of the final estate will be distributed to estate taxes ($45.02 trillion), charitable bequests ($28.23 trillion), bequests to heirs ($76.61 trillion), and estate closing costs ($2.90 trillion).

25
The bottom rows of Table 5 again list the potential charitable giving for the period from 2007 through 2061, inclusive. For the 4% growth scenario the independent estimate of baseline lifetime charitable giving was $34.54 trillion. To this we add the $5.61 trillion of accelerated giving for a total lifetime giving amount of $40.15 trillion. We then add the charitable bequests through estates to the charitable lifetime giving to obtain a potential total to charity of $68.38 trillion in this 55-‐year 4% growth scenario with $1 million estate tax exemption level after 2012. Within the 4% growth scenario, the main difference in findings between the $1 million exemption scenario and the $5 million exemption scenario lies in the amount of estate taxes paid upon death and the distribution of the value of final estates to charitable causes, to heirs, and to estate closing costs. Table 5 indicates that within the 4% scenario, maintaining the estate tax exemption at $5 million after 2012 will result in $13.88 trillion less tax revenue, $4.10 trillion more charitable bequests, and $12.78 trillion more bequests to heirs and negligible changes in estate closing costs during the period from 2007 through 2061. Mostly through charitable bequests it also results in $4.28 trillion more in the potential amount allocated to charity during the period. Commentary on Wealth Transfer Findings In all the scenarios there are some general points that are worth comment:
1. The national wealth transfer would have been substantially greater had there been no recession. The recession led to negative growth in 2008 and again in 2009 due primarily to falling prices for equities and housing. In 2010 aggregate household wealth remained 17% below its 2007 peak although in aggregate households experienced positive annual growth for the year. In addition to a decline in wealth during the recession, wealth transfer suffered from the opportunity costs of not growing at the secular rates specified in each scenario. In other words if the recession had not occurred, not only would household wealth have avoided a downturn but it would have grown at a positive rate. The sum of these two components contribute to the difference between our estimates of wealth transfer had there been no recession and our estimates that are based on the realities of the recession.
2. The difference between our estimates of wealth transfer had there been no recession and those accounting for the recession increase both in the magnitude of the difference and in the percentage of difference with the secular rate of growth.
3. Within each secular growth rate there is a small positive impact in our estimates of wealth transfer between the $1 million estate tax exemption and the $5 million estate tax exemption scenarios. This small impact is due to the fact that the higher exemption level leaves more wealth in the hands of heirs whose wealth, on

26
average, also grows. Some of these heirs also transfer their wealth during the time frame of the scenario.
4. Within each secular growth scenario, the difference between the $1 million and
the $5 million estate tax exemption scenarios lies in the distribution of final estates to estate taxes, charitable bequests, and heirs. The sunsetting of the estate tax provisions leads to larger amounts of estate tax liabilities and smaller amounts to charitable bequests as well as bequests to heirs in comparison with the $5 million estate tax exemption currently in place.
5. The major impact on charitable giving is due to the different growth rates in wealth – which affect the overall capacity of households, especially wealthy households to contribute to charity.
6. Within each growth scenario, however, differences in total charitable giving are due primarily to the higher charitable bequests (about 15% higher) under the $5 million exemption as compared with the $1 million exemption.
7. In all scenarios, wealth transfer will be concentrated among households at the
upper end of the wealth distribution. The vast majority of the transfer will be made by the 5% to 20% of wealthy households that will have at least $1 million in net worth at the time of the transfer. These households will transfer between 63% and 89% of the total wealth transfer. For example, in the 2% growth scenario, 8% of the affluent households will transfer 72% of the total transfer. Some of the transfer will take place during the lifetime of the donors; the remainder will be transferred via their estates.
8. During the same time frame (2007 through 2061) these households will donate or bequeath $19 trillion to $78 trillion to charitable causes, depending on the rate of growth in their wealth. Most of the charitable giving will take place during the donor’s lifetime. However, both the amount and the proportion of the total potential giving bequeathed to charity through estates increase as the growth rate increases. At 1% growth, charitable bequests amount to $3 trillion (16% of total potential giving); at 4% they amount to $32 trillion (42% of total potential giving).
9. Of the 116 million households, 8% to 26% are or could become millionaires in the next 55 years. In 2007 there were more than 9 million households in the United States with at least a million dollars in net worth. In the 4% growth scenario, another 21 million households from the current adult population could become millionaires by 2061. This would be a total of 30 million households (26% of the current households) who would attain millionaire status in the 55-year period. In the 2% growth scenario, the corresponding figure is 5 million additional millionaires for a total of 14 million households (12% of current households) who would attain millionaire status.
27
10. The number of millionaire households will grow in the future even though the recent Great Recession devastated both the economy and household wealth. In terms of percentages, the recession affected those at the lower end of the wealth distribution more than those at the upper end. In 2007 about a third of all households had net worth between $0 and $50,000. By the end of 2009 these households had lost nearly 70% of their net worth. The main reason was that in 2007, on average, their debt was roughly 70% of the value of their assets. By the end of 2009 the value of their assets had fallen, on average, by 21%. Their debt had increased, on average, by 0.6%.
Comparison of Current $58 Trillion with the $41 Trillion Estimate Our $41 trillion estimate of wealth transfer released in 1999 was based on the 2% growth scenario over the 55-year period from 1998 through 2052, inclusive. The $41 trillion estimate is the most frequently cited figure from our work on wealth transfer. In our current analysis the closest scenario to our prior work is the 2% growth scenario with $1 million estate tax exemption in which household wealth reflects the recession in the 55-year time frame. The $41 trillion, more precisely $40.6 trillion, estimate was developed in 1999 dollars. The $40.6 trillion becomes $52.0 trillion adjusted for inflation to 2007 dollars. In Table 5 our new wealth transfer estimate for 2007 through 2061 is $58.1 trillion (2007 dollars)-an increase of 11.7% above our original estimates in real terms. Even accounting for the recession, we find that 2% growth yields a larger estimate of wealth transfer than we published in 1999. How can this be? We adjusted for the recession and the fact that the recession devastated the asset values of the majority of households throughout the range of wealth-from the lowest levels to the highest levels. We have previously stated that aggregate household wealth lost 17% of its value between 2007 and 2010. Even with this devastation, real household wealth in 2010 was still 10.2% higher that its value in 1998 (the base year of our original analysis) according to aggregate statistics from the Federal Reserve. While there were other factors influencing our estimates of wealth transfer, the increase in post recession wealth as compared with wealth in the boom year of 1998 has the largest impact on our current estimates and leads to our finding that wealth transfer will be even larger in future years than a simple extrapolation of our original estimates would suggest. Indeed a golden age of philanthropy still beckons as a shining beacon at the end of this long recession. Impact of Recession on Wealth Transfer There are four interesting aspects of the magnitude of wealth transfer estimates given the recession in contrast to the same estimates were there no recession:

28
1. The recession reduced the magnitude of wealth transfer in all the scenarios of both the 20-‐year time frame (Table 4) and the 55-‐year period (Table 5).
2. Without the recession wealth transfer would have been 11% to 17% greater in the 20-‐year time frame, depending on the growth rate, and would have been 22% to 29% greater in the 55-‐year time frame, again depending on the rate of growth.
3. These growth rates are due primarily to a combination of two factors: (i) the decline in wealth between 2008 and 2010, and (ii) the forgone secular growth during that period.
4. So why are the growth rates so much higher in the 55-‐year period? The main reason is that the wealth of younger people was reduced, on average, by a larger proportion than those of older people (see Table 2 and Table 3). This is mostly a matter of younger households carrying a larger proportion of debt to assets, on average, when the recession hit. The model indicates that their wealth will not rebound sufficiently to attain the higher levels of wealth transfer that older households will attain – unless they change their economic behavior. A realization of this fact may be driving them to save more while they are young in order to recoup more of the wealth they lost during the recession.
Impact of Estate Taxes on Wealth Transfer
In each growth scenario in Table 4 and Table 5, the estimates of wealth transfer are somewhat greater in the $5 million exemption scenario than in the $1 million exemption scenario, even though they share the same growth rate. This reflects the fact that heirs receive larger bequests in the $5 million exemption than in the $1 million exemption tax code – that is, less goes to the government. The larger amount of inheritance will contribute to the future wealth of the heirs. Some (a relatively small number) of these heirs will begin to transfer wealth in the timeframe of the study and this additional transfer results in higher estimates for the $5 million exemption relative to the $1 million exemption in each growth scenario. Although there is an effect of estate taxes on the magnitude of wealth transfer the major impact of the taxes are on the distribution of the value of final estates among taxes, charitable bequests, bequests to heirs, and estate closing fees. Other estimates change by very small amounts between the $1 million and $5 million scenario. Details of Distribution of Final Estates In prior sections of this report we presented a summary of findings about wealth transfer and its components. One of the components is final estates. These estates are also

29
distributed by the value of estate taxes, charitable bequests, bequests to heirs, and closing costs of the estate. They are also distributed by the net worth of the estate, itself. In this section we present the details of the distribution of final estates by the original net worth of the estate. The distribution, of course, depends on the secular rate of growth as well as the tax policy. All the tables demonstrate some common patterns and some idiosyncratic patterns. We will discuss some of the common patterns next, and then present the eight detailed tables. We assume the reader will understand that in the following “estate” means “final estate”. The first common pattern: the transfer of wealth by estates is top heavy. A relatively small proportion of estates with high net worth accounts for the majority of the aggregate wealth transferred through estates. The aggregate transferred and the percentages of estates involved vary by growth rate and tax policy, but the pattern remains top heavy. This means that most young folks will not receive a large inheritance during their lifetime from a secret treasure trove of their parents or grandparents. Second, value of the estates is not all transferred to heirs or to charity – the value is distributed to estate taxes, charitable bequests, heirs, and estate closing costs (mostly legal and burial costs). The multiplicity of beneficiaries of estates implies that wealth transfer diffuses the decedents’ wealth through a larger network than just their offspring. Like the transmission of electrical energy, wealth is lost in the process of propagation to heirs. Third, empirically, the percentage of the estate that is allocated to charity increases as the net worth of the estate increases; the percentage is above 30% for estates of $20 million or more. A grossly simplified explanation involves the fact that wealth holders with enormous wealth will already have transferred some of their wealth during their lifetime, but there will still be more than enough remaining in their estates to allocate comfortable amounts to their heirs with a surplus left for charitable allocations. Many of the wealthiest people have a strong commitment to their philanthropic endeavors, and their allocations to philanthropy may have higher precedence in the division of their estate. The point is that the distribution of the value of charitable bequests is even more top heavy than the value of the final estates. Detailed Distribution of Final Estates – 1% Secular Growth Table 6 presents the detailed results of the sluggish (1%) secular growth scenario with $1 million in estate tax exemption for the nation. The total transfer and its distribution are located in the total column, which is the rightmost column in each panel. Table 6 Panel 1 presents the estimates for the 20-‐year period from 2007 through 2026. Table 6 Panel 2 presents the corresponding estimates for the entire 55-‐year period from 2007 through 2061. Within each panel the columns define the value of the final estate, which is categorized by the net worth of the household when the
30
final householder dies. The rows of the table define the number of final estates, the value in terms of net worth of final estates, estate fees, federal and state estate taxes, bequests to charity, and bequests to heirs. In the upper right corner of each cell there is a small percentage that is distributed across the estate net worth categories. They add to 100 percent across the columns. In any given column the percentage indicates the percentage of the row total that is due to final estates in the given net worth category specified by the column. Similarly, at the bottom of each cell there is a percentage that is distributed across the recipient categories. They add to 100 percent down each column. In any given row, they indicate the percentage of the column total that is allocated to the recipient category specified by the row. For the nation, we estimate that 93.61 million final estates will occur during the 55-‐year period from 2007 through 2061. These final estates will be valued at $28.57 trillion (2007 dollars) at the time of death if national wealth grows at an average real annual secular rate of 1% and there is $1 million exemption in estate taxes. The model projects $0.67 trillion will be distributed to estate fees, $4.6 trillion to government, $2.57 trillion to charity, and $20.7 trillion to heirs. The $4.6 trillion of potential charitable bequests constitutes 9% of the $28.6 billion value of final estates. Somewhat less than half the potential charitable bequests (49%) are generated by the 0.09% of final estates with value of $20 million or more. On average, estates of $20 million or more give the largest fraction (33%) of their value to charity in this growth scenario as compared with estates of lesser value. The transfer of wealth is concentrated among wealthy final estates. Most (63%) of the $28.6 trillion of value of final estates in the 1% growth scenario occurs among the 5% of final estates with value of $1 million or more. These estates pay 54% of the aggregate estate fees, 100% of the aggregate estate taxes, 89% of the aggregate charitable bequests, but only 52% of the aggregate bequests to heirs. Panel 1 of Table 6 indicates that 33% ($9.6 trillion out of the 55 year total $28.6 trillion) value of final estates will occur before 2027. During the first 20 years from 2007 to 2026, 23.4 million final estates will occur. These 23.4 million final estates amount to 25% of the number of final estates generated during the entire 55-‐year period of the simulation. The aggregate value of these estates is $9.6 trillion (33% of the aggregate value during the entire 55 year period) with potential aggregate charitable bequests of $0.9 trillion (35% of the aggregate amount during the entire period). About two thirds of the wealth transfer will occur later than 2026. We have seen in Table 1 that in 2007 there were 9.4 million households in the nation with at least $1 million in net worth. During the 55 years of the 1% growth scenario, another 3.4 million households will become millionaires, for a total of 12.8

31
million households with net worth of at least a million dollars. Table 7 presents the detailed results of the sluggish (1%) secular growth scenario with $5 million in estate tax exemption for the nation. The total transfer and its distribution are located in the total column, which is the rightmost column in each panel. The major difference between Table 6 and Table 7 are in the distribution of the value of final estates to estate taxes, charitable bequests, bequests to heirs, and estate closing costs and fees. When the estate tax exemption is $5 million, it generates substantially less ($2.2 trillion) revenue for the government and more for charity ($0.4 trillion) and heirs ($2.1trillion) during the 55-‐year period. In this same time frame, the value of final estates is also $0.3 trillion more in the $5 million as compared with the $1 million tax exemption. Moderately Low (2%) Secular Growth Scenario Table 8 presents the detailed national results of the middle (2%) secular growth scenario with $1 million in estate tax exemption. It is formatted the same as Table 6. As in Table 6 the total transfer through final estates and its distribution are located in the total column, which is the rightmost column in each panel. Panel 1 presents the estimates for the 20-‐year period from 2007 through 2026. Panel 2 presents the corresponding estimates for the entire 55-‐year period from 2007 through 2061. Within each panel the columns define the value of the final estate, which is categorized by the net worth of the household when the final householder dies. The rows of the table define the number of final estates, the value in terms of net worth of final estates, estate fees, federal and state estate taxes, bequests to charity, and bequests to heirs. For the nation we estimate that 93.6 million final estates will occur during the 55-‐year period from 2007 through 2061. These final estates will be valued at $48.2 trillion (2007 dollars) at the time of death if wealth grows nationally at an average real annual secular rate of 2% and there is $1 million exemption in estate taxes after 2012. The model projects $1.1 trillion will be distributed to estate fees, $9.8 trillion to government, $5.4 trillion to charity, and $32.0 trillion to heirs. The $5.4 trillion of potential charitable bequests constitutes 11% of the $48.2 trillion value of final estates – slightly more than double the comparable figure for the 1% growth scenario. More than half the potential charitable bequests (55%) are generated by the 0.2% of final estates with value of $20 million or more. This proportion (55%) is large for two reasons: (1) final estates valued at $20 million or more account for 19% of the $48.2 trillion in total value of final estates in North Dakota; and (2) on average, estates of $20 million or more give the largest fraction (32%) of their value to charity as compared with estates of lesser value.
32
For the nation, the transfer of wealth is concentrated among wealthy final estates. Most (72%) of the $48.2 trillion value of final estates in the 2% growth scenario occurs among the 8% of final estates with value of $1 million or more. These estates pay 62% of the aggregate estate fees, 100% of the aggregate estate taxes, 93% of the aggregate charitable bequests, but only 60% of the aggregate bequests to heirs. Panel 1 of Table 8 indicates that 23% ($11.3 trillion out of the 55 year total $48.2 trillion) of value of final estates in the United States occur before 2027. During the first 20 years from 2007 to 2026, 23.4 million final estates will occur. These 23.4 million final estates amount to 25.0% of the number of final estates generated during the entire 55-‐year period of the simulation. The aggregate value of these estates is $11.3 trillion (23% of the aggregate value during the entire 55 year period) with potential aggregate charitable bequests of $1.2 trillion (21% of the aggregate amount during the entire period). About three quarters of the wealth transfer for the nation will occur later than 2026 in the 2% growth scenario. Regarding the number of millionaires, we have seen in Table 1 that in 2007 there were 9.4 million households in the nation with at least $1 million in net worth. During the 55 years of the 2% growth scenario, another 5.2 million households will become millionaires, for a total of 14.6 million households with net worth of at least a million dollars. Table 9 presents the detailed national results of the moderately low (2%) secular growth scenario with $5 million in estate tax exemption after 2012. The total transfer and its distribution are located in the total column, which is the rightmost column in each panel. The major difference between Table 8 and Table 9 are in the distribution of the value of final estates to estate taxes, charitable bequests, bequests to heirs, and estate closing costs and fees. When the estate tax exemption is $5 million, it generates substantially less ($4.2 trillion) revenue for the government and more for charity ($0.9 trillion) and heirs ($4.0) during the 55-‐year period. In this same time frame, the value of final estates is also $0.7 trillion more in the $5 million as compared with the $1 million tax exemption. Middle (3%) Secular Growth Scenario Table 10 presents the national detailed results of the middle (3%) secular growth scenario with $1 million in estate tax exemption. It is formatted the same as Table 6. As in Table 6 the total transfer and its distribution are located in the total column, which is the rightmost column in each panel. In the middle growth scenario for the nation we again estimate that 93.6 million final estates will occur among the 2007 population of households during the 55-‐year period from 2007 through 2061. These final estates will be valued at $79.7 trillion at the time of death if wealth grows nationally at an average annual secular rate of
33
3% and there is $1 million exemption in estate taxes after 2012. The model projects that $1.6 trillion will be distributed to estate fees, $19.9 trillion to government, $11.8 trillion to charity, and $46.4 trillion to heirs. The $11.8 trillion of potential charitable bequests constitutes 14% of the $79.7 trillion value of final estates – an additional 120% as compared with the 2% growth scenario. Once again, most of the potential charitable bequests (68%) are generated by the 0.5% of final estates valued at $20 million or more. This proportion (68%) is large for two reasons: (1) final estates with values of $20 million or more account for 31% of the $79.7 trillion in the national value of final estates; and (2) on average, estates of $20 million or more give the largest fraction (32%) of their value to charity as compared with estates of lesser value. The national transfer of wealth is concentrated among wealthy final estates. Most (79%) of the $79.7 trillion of wealth transfer in the middle (3%) growth scenario occurs among the 11% of final estates with value of $1 million or more. These estates pay 70% of the aggregate estate fees, 100% of the aggregate estate taxes, 96% of the aggregate charitable bequests, and contribute 66% of the aggregate bequests to heirs. From Panel 1 of Table 10 we find that approximately 16% ($13.1 trillion out of the 55 year total $279.7 trillion) of the national value of final estates will occur by the end of 2026. During the first 20 years from 2007 to 2026, we again estimate that 23.4 million final estates will occur. These 23.4 million final estates amount to 25% of final estates generated during the entire 55-‐year period of the simulation. The aggregate value of these estates is $13.1 trillion (16% of the aggregate value during the entire period) with potential aggregate charitable bequests of $1.4 trillion (12% of the aggregate amount during the entire period). Almost 85% of the wealth transfer will occur later than 2026 – a greater percentage in the middle (3%) secular growth scenario than in the 1% and 2% growth scenarios. Table 1 indicates that in 2007 there were 9.4 million households in the nation with at least $1 million in net worth. During the 55 years of the 3% growth scenario, another 9.7 million households will become millionaires, for a total of 19.1 million households with net worth of at least a million dollars. Table 11 presents the detailed national results of the middle (3%) secular growth scenario with $5 million in estate tax exemption after 2012. The total transfer and its distribution are located in the total column, which is the rightmost column in each panel. The major difference between Table 10 and Table 11 are in the distribution of the value of final estates to estate taxes, charitable bequests, bequests to heirs, and estate closing costs and fees. When the estate tax exemption is $5 million, it generates substantially less ($7.2 trillion) revenue for the government and more for charity ($1.9 trillion) and heirs ($6.7) during the 55-‐year period. In this same time frame, the value of final estates is also $1.4 trillion more in the $5 million as compared with the $1 million tax exemption.
34
High (4%) Secular Growth Scenario Table 12 presents the national detailed results of the high (4%) secular growth scenario with $1 million in estate tax exemption after 2012. It is formatted the same as Table 6. As in Table 6 the total transfer and its distribution are located in the total column, which is the rightmost column in each panel. In the high growth scenario for the nation we again estimate that 93.6 million final estates will occur among the 2007 population of households during the 55-‐year period from 2007 through 2061. These final estates will be valued at $152.8 trillion at the time of death if wealth grows in the nation at an average annual secular rate of 4% and there is $1 million exemption in estate taxes after 2012. The model projects $2.9 trillion will be distributed to estate fees, $45.0 trillion to government, $28.2 trillion to charity, and $76.6 trillion to heirs. The $28.2 trillion of potential charitable bequests constitutes 18% of the $152.8 trillion value of final estates – 2.5 times the comparable figure from the middle growth scenario. Once again, most of the potential charitable bequests (75%) are generated by the 1% of final estates valued at $20 million or more. This proportion (75%) is large for two reasons: (1) final estates with values of $20 million or more account for 43% of the $152.8 trillion in the value of final estates in the nation and (2) on average, estates of $20 million or more give the largest fraction (32%) of their value to charity as compared with estates of lesser value. The national transfer of wealth is concentrated among wealthy final estates. Most (88%) of the $152.8 trillion of wealth transfer in the high (4%) growth scenario occurs among the 20% of final estates with value of $1 million or more. These estates pay 88% of the aggregate estate fees, 100% of the aggregate estate taxes, 98% of the aggregate charitable bequests, and contribute 78% of the aggregate bequests to heirs. From Panel 1 of Table 12 we find that approximately 10.2% ($15.6 trillion out of the 55 year total $152.8 trillion) of the value of final estates in the nation will occur by the end of 2026. During the first 20 years from 2007 to 2026, we again estimate that 23.4 million final estates will occur. These 23.4 million final estates amount to 25% of final estates generated during the entire 55-‐year period of the simulation. The aggregate value of these estates is $15.6 trillion (10.2% of the aggregate value during the entire period) with potential aggregate charitable bequests of $1.9 trillion (6.7% of the aggregate amount during the entire period). About 90% of the wealth transfer will occur later than 2026 – a greater percentage in the high (4%) secular growth scenario than in the 1%, 2%, and 3% growth scenarios. Table 1 indicates that in 2007 there were 9.4 million households in the nation with at least $1 million in net worth. During the 55 years of the 4% growth scenario,

35
another 21.0 million households will become millionaires, for a total of 30.4 million households with net worth of at least a million dollars. Table 13 presents the detailed national results of the high (4%) secular growth scenario with $5 million in estate tax exemption after 2012. The total transfer and its distribution are located in the total column, which is the rightmost column in each panel. The major difference between Table 12 and Table 13 are in the distribution of the value of final estates to estate taxes, charitable bequests, bequests to heirs, and estate closing costs and fees. When the estate tax exemption is $5 million, it generates substantially less ($13.9 trillion) revenue for the government and more for charity ($4.1 trillion) and heirs ($12.8 trillion) during the 55-‐year period. In this same time frame, the value of final estates is also $3.0 trillion more in the $5 million as compared with the $1 million tax exemption. Concluding Comments There are several issues concerning household wealth and its allocation that have not yet been discussed or sufficiently emphasized in the report. They will briefly be presented in this concluding section.
1. This study reflects an increasing pattern among affluent and wealthy households to begin transferring assets from the household portfolio to other entities as part of a general estate/legacy plan while the wealth holders are still living. As previously discussed these transfers tend to be larger among very wealthy households, occur when the householder approaches retirement age and for the decade thereafter, and generally increase as wealth increases. There are three issues related to lifetime transfers that have not yet been discussed:
a. The transfers made during this period of life often involve donations to non-‐profit organizations, family foundations, donor advised funds, and charitable trusts and present an opportunity for the potential donor to allocate even more than usual amounts to a broad range of charitable causes and to experience the results of these gifts during their lifetime.
b. The wealthy donor usually plans these donations years in advance. It is during this planning period that the discernment process is most relevant to the donor and is when the donor is most appreciative for information and discussion with potential recipients – of course; many donors want to initiate the process on their own or through intermediaries.
c. From the non-‐profit viewpoint, the increasingly frequent shift of wealth transfer from giving through estates to transfers made during lifetime as part of an estate/legacy plan mean that an increasing amount of the wealth transfer will occur earlier than if all the transfer occurred through estates.
36
d. Wealth transferred from the wealth holder to charity, to heirs, and to other entities (e.g., trusts) during the donor’s lifetime reduces the value of the donor’s final estate and thus reduces transfers through bequests.
2. As the value of final estates increase – especially to levels beyond $20 million
– the proportion of the estate value bequeathed to charity increases dramatically in all scenarios. In the current model, however, there are smaller proportions of final estates in this category in comparison to our prior model because many high wealth households transfer a considerable part of their assets to charity, to heirs, and to other entities during their lifetimes. The lower number of final estates estimated by the current model is in closer agreement with federal estate tax statistics than the corresponding estimate produced by our previous model.
3. The exemption levels and for that matter the existence of the estate tax has a
major impact on potential for charitable giving, primarily from charitable bequests. In all scenarios a $5 million exemption after 2012 produces a major increase in the value of charitable bequests relative to the $1 million exemption after 2012. The estate tax also has an additional relatively small effect on the total amount of wealth transfer primarily through the amount of inheritance received by decedents while they are still living.
4. The rate of growth in Gross Domestic Product is closely related to the growth
of household wealth. The growth of household wealth, in turn, is closely related to the amount of wealth transfer and the potential for charitable giving. In the current study, the proportion of wealth transfer that goes to charity increases from 10% at 1% growth to 20% at 4% growth – the proportion allocated to charity keeps increasing with increasing growth rates.
As growth rates increase both the amount of wealth transfer and the amount going to charity also increase; but in addition to the increase in amounts, the proportion of the wealth transfer going to charity also increases. The growth rate of the economy is important to the strength of philanthropy in the nation by increasing the wealth and wealth transfer of its residents and also increasing the fraction of their wealth that they contribute to charity. One implication: policies that strengthen economic growth also strengthen the long-‐term prospects for philanthropy.
5. From the end of World War II through 2007 the economy has grown at a real
rate of more than 3.3 percent and during that time household wealth has grown at nearly the same rate. The current recession has raised issues of fairness of the distribution of financial resources and also of growth of financial resources. High unemployment, slow economic recovery, enormous government debt, deficits as far as the eye can see are among the

37
major dilemmas confronting the nation and its citizenry. Our study presents findings for growth scenarios that range from 1% to 4%. In the past we felt that 2% was a conservative assumption regarding growth. It appears less conservative at the current juncture but we still believe that in the long run real growth of at least 2% will likely be achieved during the next 55 years. Consequently we still emphasize the 2% scenarios.
6. The economy as well as household wealth grows at different rates in
different states and regions of the county. The GDP of North Dakota has grown the fastest during the recession, and, in fact, there was no recession in North Dakota. The economies and personal finances of other states, such as Rhode Island, suffered more economically from the recession. Extrapolation of the national results to states and regions is very complicated. The level and pattern of national transfers and philanthropy are very different from wealth transfer that is occurring in North Dakota or in Rhode Island, for example. Each geographic area of the nation is sufficiently idiosyncratic that it will likely deviate – often substantially -‐ from the national trend.
7. The estimates in this report are approximations that depend not only on
economic growth but also on the continued efforts of community foundations, non-‐profit organizations and other groups focused on supporting philanthropic efforts to work effectively to strengthen philanthropic initiatives. Our estimates will be too high if these efforts are not continued and our estimates will be too low if these efforts become even more effective and energetic.
8. In addition to the economy and organizations devoted to philanthropy, the
country depends on the skills, character, and moral compass of its residents to devote their time and treasure in responsible ways to care for themselves and for each other. The wise use of their physical, financial, mental, and spiritual resources to extend care to others says more about the state and its residents than does than the economy or even the charitable organizations.
A38
Methodological Appendix
This appendix documents the details of how the estimates were determined. It explains an expansion in the conceptualization and definition of wealth transfer and how this affects the overall design of the model. It describes the national microdata file. It then continues with a description of the model and how it works. It concludes with a description of the method used to estimate and project national charitable giving. Update Strategy The research objectives of this project are (1) to update and expand the Wealth Transfer Microsimulation Model (WTMM), (2) to estimate the wealth transfer from households residing in the United States in 2007 during the period from 2007 through 2061 and (3) to estimate the potential for household charitable contributions during the same time frame. Our strategy to update the model was to use the most recent data available from the sources used in our original model to update the current version of the model. When we conducted this work in the spring of 2011, the most recent data for wealth and mortality data was for the year 2007; and 2007 thus became the base year of the model. We updated the model’s microdata file based on data from the 2007 Survey of Consumer Finances, updated the model’s mortality rates based on 2007 data from the Center on Disease Control and Preventions, updated life cycle savings rates based on federal reserve data for 1992 through 2007, and updated historical parameters regarding estate tax distribution based on 2006, 2007, and 2008 estate tax data from the Statistics of Income Division of the IRS. Expansion Strategy Our strategy to expand the model was to develop and test the relevant modules and then install them in the model. We developed separate modules for each area of expansion: categorization of assets, transfers of assets during lifetime, estate tax liability, and portfolio reorganization. Because of the recession we also expanded the model to adjust for the impact of the recession on wealth. Wealth Transfer Estimation Strategy Our strategy to arrive at projections of wealth transfer was to apply the model to a representative sample of household wealth in 2007. However, household wealth fell precipitously in 2008 and 2009, and recovered only slightly in 2010. We therefore used data from reliable sources to revalue household assets and portfolio compositions in each of the recessionary years to reflect the impact of the recession
A39
on household wealth. Strategy for Projecting Charitable Giving Our research strategy to project charitable giving was to develop an estimate of household giving along trend and augment it by the lifetime accelerated charitable giving estimate and the charitable bequest estimate provided by the WTMM. Expanded Conceptualization of Wealth Transfer Since our original work on wealth transfer in 1998, we have found that as wealth holders planned for the eventual transfer of their assets their plans expanded from the confines of their will and their estate to include transfers during their own lifetime of some assets that would have been part of their estates in prior decades. This is reflected in the substantial growth in assets of foundations, donor advised funds, split-‐interest charitable trusts, non-‐charitable trusts, and limited partnerships – that we can track in statistics reported by organizations that focus on these entities as well as in federal tax statistics for selected entities. Anecdotal evidence by those advising wealth holders in issues of estate planning and wealth transfer also confirms the increase in lifetime transfers as part of the planning process. We have therefore expanded our concept of wealth transfer to include both lifetime transfers made as part of a plan focused on transfer of assets and bequests made through estates at death. This is a broader conceptualization than that used in our earlier work and reflects the realities of the time. We used this broader conceptualization in expanding, updating, and applying our wealth transfer model as well as in our methodology to more accurately estimate potential charitable giving. Survey of Consumer Finances The WTMM was designed to use a subset of data from the Survey of Consumer Finances (SCF) as its national microdata file. The SCF is conducted every three years for the Board of Governors of the Federal Reserve [National Opinion Research Center, 1992, 1995, 1998, 2001, 2004, and 2007]. The most recent available survey was conducted in 2007. Data from the 2010 survey is currently being processed and will not be released until early 2012. There are 4,418 households in the 2007 survey sample: 2,915 households selected in a representative sample and 1,503 in an oversample of wealthy households, selected from IRS income tax returns. The staff of the Federal Reserve calculates weights that permit the two samples to be combined to represent the population of all households. With respect to content, the SCF contains very detailed information concerning assets owned, income earned, debt owed, inheritance expected or received, employment history, and demographic characteristics. The SCF also contains a question concerning inter vivos giving of cash and in-‐kind charitable
A40
donations4 as well as questions concerning family foundations and their assets. The two most important characteristics of the SCF with respect to wealth transfer are: (1) it contains sufficient detail about the full portfolio of each household to support a reliable estimate of net worth at the household level, and (2) unlike most other surveys, it includes a large group of wealthy households that supports reliable estimates for this group, which gives disproportionately large amounts to charity. Adjustment for Recession The WTMM adjusts for the recession by adjusting the assets and debt of each household in its microdata file as it runs the simulation. It makes these valuations in a two step process: (1) adjust the individual assets in each household’s portfolio for changes in asset prices and (2) adjust the revalued assets from step 1 for changes in portfolio composition Independent price indices were used to adjust the prices. The indices included the Case-‐Shiller Housing Value Index, the National Association of Realtors Housing and Real Estate indices, the DOW Wilshire 5000 index, the former Lehman Brothers Bond and Note indices (now administered by Barclays Bank of London), the Manheim Used Car Index, the Bureau of Labor Statistics Vehicle Index, etc. The changes in portfolio composition were based on aggregate changes derived from Federal Reserve data. Areas of WTMM Expansion As indicated in the body of the report, the 2011 version of the WTMM contained enhancements and expansions in five major areas:
1. Asset Groupings Assets were grouped into four categories: real estate, other tangible assets (mostly vehicles), business equity, and financial assets. In the expanded WTMM each asset category can be assigned its own secular growth rate that permits, for example, real estate to grow more slowly than business equity and business equity to grow more slowly than financial assets. At some future date, the secular rates in each category could be made time-dependent so that each asset category can be represented as a time-dependent profile of annual growth rates.
2. Wealth Adjustments for Recession
4 The SCF ignores annual donations of less than $500 per household. At CWP we developed a method to approximate the value of contributions of less than $500 based on data from the General Social Survey conducted by the National Opinion Research Center.

A41
The WTMM was expanded to adjust the values of household assets and debt to historical values based primarily on changes in valuation of assets in each household portfolio. These adjusted values supersede the secular growth rates for the years in question. Thus the expanded model adjusts the valuation of each household’s portfolio in 2008, 2009, and 2010 for the effects of the recession on both the value and distribution of household wealth. This modification permits the WTMM with a base year of 2007 to estimate wealth transfer during and after the recession. After 2010 the model uses its original secular growth rates to estimate household wealth.
3. Lifetime Transfers of Assets
The concept of wealth transfer was extended in the expanded version of the WTMM to include transfers made to heirs and other entities through trusts and other vehicles of asset transfer in conjunction with estate planning during lifetime. Similarly the model itself was expanded to calculate the amount of asset transfers during lifetime in addition to the amount of asset transfers at death. The sum of these two components constitutes the WTMM estimate of wealth transfer. The asset transfers during lifetime were estimated from portfolio analysis of successive triennial Surveys of Consumer Finances. These transfers were further divided into known transfers to charitable organizations (including family foundations, charitable trusts, and donor advised funds) and transfers to other entities that may also have entailed gifts to charitable organizations5 in addition to transfers to financial vehicles such as trusts and limited family partnerships.
4. Estate Tax Simulation Sub-Model
An estate tax simulation sub-model was developed, tested, and installed in the WTMM. This sub-model estimates tax liability for final estates (estates with no surviving spouse) and also distributes the estate value among taxes, charitable bequests, bequests to heirs, and estate closing costs. The estimates and the distribution vary depending on the asset value of the estate. This sub-model replaces the prior distribution algorithm that was based on historical patterns of tax liability and distribution in the base year. The new sub-model incorporates the base year distribution but modifies tax liability depending on provisions of the estate tax law in effect at the time of death. Under current law the estate taxes will revert to a $1 million exemption, higher tax rates, and no portability at the end of 2012. The new sub-model takes these changes into account; the previous module did not.
5 The IRS data indicate that these trusts make charitable donations of several billion dollars per year and that some of them are reorganized as charitable trusts each year. The lifetime charitable estimate is therefore a conservative estimate.

A42
5. Portfolio Reorganization
A portfolio reorganization module was developed, tested, and installed in the WTMM. Major changes in the composition of portfolios take place mostly at ages 65 to 75 and mostly among affluent or wealthy households. During this time households divest themselves of substantial amounts of real estate and business equity and to a lesser extent financial assets as well. They also make major lifetime transfers during this period of portfolio reorganization. The portfolio reorganization module captures changes in portfolio composition as well as estimating lifetime transfers of assets.
The WTMM The Wealth Transfer Microsimulation Model (WTMM) was designed and developed at CWP (then known as the Social Welfare Research Institute) at Boston College. Updated and expanded in the past six months, the model simulates wealth transfer, lifetime transfers of assets as part of wealth transfer, the number and value of final estates for households that existed in 2007 during a 20-‐year period, which in this analysis extends from 2007 through 2026, inclusive, and also during a 55-‐year period, which extends from 2007 through 2061. The WTMM incorporates the concept of final estate. A final estate is an estate without a surviving spouse – that is, the estate of a widowed, divorced, or never married decedent. When one of two spouses die the WTMM assumes that the wealth of the decedent is transferred to the surviving spouse. In this case a final estate occurs only when the surviving spouse dies. A final estate also occurs at the death of all other heads of household (i.e., never married, divorced, or widowed heads of household) The WTMM assumes that household wealth grows along secular trends consistent with growth in the gross domestic product of the economy. The rates of growth define each of four scenarios (1%, 2%, 3%, and 4% rates of secular growth, respectively). A major assumption of the analysis is that there will be no sustained period of major economic downturn or upturn other than that captured by the growth rates during the 55-‐year period of the analysis (2007 through 2061). There will, of course, be economic cycles during this period. The WTMM assumes only that none of these cycles will result in a long period (5 years or more) of sustained economic depression below or booming economic growth above the secular rates. The WTMM does not generate births, marriages, or divorces nor does it develop new household businesses although it does divest some wealthy household of existing business assets in the course of the simulation. It does, of course, assume that people die at the 2007 national rates (by age, gender, and race) published by the National Center for Health Statistics based on data from the Center of Disease Control and Prevention.

A43
The WTMM does assume that there are variations in the rate of growth in household wealth, depending on the age of head. These life cycle variations are due to periods of accelerated rates of accumulation, periods of distribution, variations in savings rates, variations in consumption rates, drawdown of assets at the end of their lifecycle for households of modest means, gifting of assets predominantly among affluent and wealthy households, and lifetime transfers of assets in connection with wealth transfer plans. The WTMM assumes that for the next 55 years the pattern of life cycle variations in the rate of growth in household wealth is represented by the current pattern estimated from data from the 1992, 1995, 1998, 2001, 2004, and 2007 SCF. The model has been modified to accommodate increases or decreases in the amounts or prevalence of selected inter vivos gifts (such as charitable remainder trusts and transfers to family foundations) among wealthy households during the period. The WTMM applies the mortality rates, secular growth rates, and life cycle variations to each household to estimate both lifetime transfer of assets as part of wealth transfer as well as the number and value of final estates. For each final estate, its value is distributed to government, charity, heirs, and estate costs based on historical patterns. These patterns depend on the asset value of the estate. They are based primarily on data from federal estate tax filings for 1998 through 2008. The pattern indicates that as asset levels of estates increase, the proportion of the value of the estate bequeathed to charity increases substantially to an average of 34% for estates with assets of $20 million or more. The WTMM assumes that the national historical pattern, adjusted for changes in the estate tax law, holds for the nation during the period of the simulation. The expanded version of the WTMM modifies the historical proportions of the value of estates distributed to government by an adjustment based on changed estate tax liability based on current estate tax law as reflected in The Economic Growth and Tax Relief Reconciliation Act of 2001 and The Tax Relief, Unemployment Insurance Authorization and Job Creation Act of 2010. Specifically the WTMM estimates the government share of the estate based on its asset value and the historical proportion paid in estate taxes. Using an estate tax simulation sub-‐model the WTMM then calculates the estate tax liability under estate tax provisions in effect in 2007 and estate tax provisions in effect for the year being simulated. The proportion of new to old tax liability is applied to the historical estimate of estate taxes paid (which reduces this amount for estates that paid estate taxes). Adjusting for gift taxes, the resulting change (increase or reduction) in estate taxes paid is allocated as changes in the opposite direction (reduction or increase) to charity and heirs, proportional to the historical percentages distributed to charity and heirs for the given household. This allocation is consistent with the proposition that reductions in the estate tax will increase charitable giving [Schervish, 2001]. Since the WTMM does not support hysteresis (asymmetry of reaction, in this case to tax changes), the allocation also reflects the proposition that increases in the estate tax will decrease charitable.

A44
With a few weeks additional work, the expanded WTMM can be further modified to estimate wealth transfer at the national level by race. Because of small sample sizes, however, breakdowns of wealth transfer estimates by race would be unreliable for states with modest populations, and the model has not yet been expanded to include this capability. The WTMM runs in constant (inflation adjusted) dollars for 2007. All internal calculations and all estimates are calculated in 2007 dollars. Lifetime Charitable Giving The expanded WTMM estimates two components of potential charitable giving: charitable bequests through estates and transfer of assets made as part of wealth transfer. The third component, inter vivos charitable giving along secular trend, which we sometimes call lifetime baseline giving along trend, is estimated in a separate analysis independent of the model. The independent analysis is based on the aggregate amount of household giving 2007, as developed by CWP as part of our index of charitable giving relative to income, adjusted for taxes and cost of living. This baseline amount is projected along secular trend based on the growth rates used in each wealth transfer scenario. Data and Parameters Via its microdata file, WTMM uses the relevant demographic characteristics for United States households derived from the SCF and augmented by data from the ACS and CPS. It uses distribution of wealth in 2007 based primarily on the SCF, calibrated to independent estimates of household wealth from the Flow of Funds accounts of the Federal Reserve. For the recessionary years of 2008, 2009, and 2010, the WTMM adjusts the wealth for each household in the microdata file for historical changes in valuation (as described above) and for changes in portfolio composition. Using this procedure it adjusts for the recession through 2010 and applies its secular growth rates thereafter. The WTMM uses parameters based on national statistics. It uses the final mortality rates for 2007 published by the National Center for Health Statistics based on data from the Center of Disease Control and Prevention. It uses historical data from the Statistics of Income Division of the Internal Revenue Service. This data consists of average patterns (1998-‐2008) of distribution of estates, net of surviving spouse deductions, where the distributions are defined in terms of the percentage of the net value distributed to estate fees, charitable deductions, estate taxes, and heirs. The WTMM also uses life cycle variations in the growth of wealth calculated from the 1992, 1995, 1998, 2001, 2004 and 2007 SCF.

A45
Scenarios The national estimates of wealth transfer and national potential for charitable giving have been calculated for four scenarios, differentiated by the rate of secular growth in household wealth. The sluggish growth scenario assumes a 1% real (inflation adjusted) rate of secular growth and lower than average rates of life cycle savings. The moderately low growth scenario assumes a 2% real (inflation adjusted) rate of secular growth and also somewhat lower than average rates of life cycle savings. The middle growth scenario assumes a 3% real rate of secular growth and average rates of life cycle savings. The high growth scenario assumes a 4% real rate of secular growth and above average rates of life cycle savings. Within each scenario there are two sub-‐scenarios: one reflects current law in which the tax provisions will revert to the 2001 version with a $1 million exemption level beginning in 2013. The second envisions a $5 million exemption level in effect in 2011 will be retained in 2013 and thereafter.

Bibliography
Avery, Robert B. 1994. "The Pending Intergenerational Transfer." Philanthropy 8 (1):5, 28-29.
Barclays Capital Aggregate Bond Index. 2010. Barclays Capital.
https://ecommerce.barcap.com/indices/index.dxml
------. 2009. Barclays Capital.
------. 2008. Barclays Capital.
Bureau of Economic Analysis. 2011. Local Area Personal Income Table CA04 –
Personal income and employment summary, and Table CA25N – Total full-time
and part-time employment by NAICS industry. Washington, D.C.: U.S.
Department of Commerce. http://www.bea.gov/regional/reis/default.cfm#step7
Bureau of Labor Statistics. 2007. Current Population Survey. Annual Social and
Economic Supplement. Washington, D.C.: U.S. Department of Commerce.
http://www.bls.gov/cps/
Case-Shiller Home Price Index. 2010. Standard & Poor’s.
http://www.standardandpoors.com/indices/sp-case-shiller-home-price-
indices/en/us/?indexId=spusa-cashpidff--p-us----
------. 2009. Standard & Poor’s.
------. 2008. Standard & Poor’s.
Center on Philanthropy at Indiana University. 2010. Giving USA 2011: The Annual Report on
Philanthropy for the Year 2010. Indianapolis: AAFRC Trust for Philanthropy.

2
Frankel, Martin and Arthur Kennickell. 1995. “Toward the Development of an Optimal
Stratification Paradigm for the Survey of Consumer Finances.” Proceedings of the
Section on Survey Research Methods. 1995 Annual Meetings of the American Statistical
Association, Orlando, FL.
Haveman, Robert and Jon Haveman. 1996. Unpublished calculations based on U.S. Department
of Commerce, Bureau of the Census data from Survey of Income Program Participation.
Washington, D.C. http://sadrc.cfed.org/measures/meannetworth.php
Havens, John J. and Paul G. Schervish. 1999. "Millionaires and the Millennium: New Estimates
of the Forthcoming Wealth Transfer and the Prospects for a Golden Age of
Philanthropy." Center on Wealth and Philanthropy (formerly Social Welfare Research
Institute), Boston College. http://www.bc.edu/cwp
----- and Paul G. Schervish. 2003. “Why the $41 Trillion Wealth Transfer Is Still Valid:
A Review of Challenges and Questions." Center on Wealth and Philanthropy
(formerly Social Welfare Research Institute), Boston College.
http://www.bc.edu/cwp
Internal Revenue Service, Statistics of Income Division. 2011. Estate Tax Statistics.
Washington, D.C.: U.S. Department of the Treasury.
http://www.irs.gov/taxstats/indtaxstats/article/0,,id=96442,00.html
Johnson, Barry W. and Jacob M. Mikow. 1999. "Federal Estate Tax Returns, 1995-1997."
Statistics of Income Bulletin (19)1: 69-129.
Johnson, Barry W. and Lisa M. Schreiber. “Personal Wealth, 1998.” Statistics of Income
Bulletin. (22)3. Winter 2002-2003. pp. 87-115.
Kennickell, Arthur B. 2001. “Modeling Wealth with Multiple Observations of Income:
Redesign of the Sample for the 2001 Survey of Consumer Finances.” Working

3
Paper, Board of Governors of the Federal Reserve System.
http://www.federalreserve.gov/pubs/oss/oss2/method.html
------. 1999. “Using Income Data to Predict Wealth.” Working Paper, Board of Governors of the
Federal Reserve System. http://www.federalreserve.gov/pubs/oss/oss2/method.html
------ and Douglas A. McManus. 1993. “Sampling for Household Financial Characteristics Using
Frame Information on Past Income.” Proceedings of the Section on Survey Research
Methods. 1993 Annual Meetings of the American Statistical Association, San Francisco,
CA.
Manheim Used Vehicle Value Index. 2010. Manheim.
http://www.manheim.com/products/consulting
------. 2009. Manheim.
------. 2008. Manheim.
Metropolitan Area Prices Index. 2010. National Association of Realtors.
http://www.realtor.org/research/research/ehspage
------. 2009. National Association of Realtors.
------. 2008. National Association of Realtors.
National Agriculture Statistics Service. 2010. 2007 Census of Agriculture. Washington,
D.C.: U.S. Department of Agriculture. http://quickstats.nass.usda.gov/
National Opinion Research Center. 2007. Survey of Consumer Finances. University of Chicago.
National Opinion Research Center.

4
------. 2007. Survey of Consumer Finances. University of Chicago. National Opinion Research
Center.
------. 2004. Survey of Consumer Finances. University of Chicago. National Opinion Research
Center.
------. 2001. Survey of Consumer Finances. University of Chicago. National Opinion Research
Center.
------. 1998. Survey of Consumer Finances. University of Chicago. National Opinion Research
Center.
------. 1995. Survey of Consumer Finances. University of Chicago. National Opinion Research
Center.
------. 1992. Survey of Consumer Finances. University of Chicago. National Opinion Research
Center.
Noto, Nonna A. 2006. "Calculating Estate Tax Liability: 2001 to 2011 and Beyond."
Washington, D.C.: Library of Congress, Congressional Research Service.
Pashigian, B. Peter. The Used Car Price Index: A Checkup and Suggested Repairs.
University of Chicago. US Department of Labor, Bureau of Labor Statistics.
March 2011. www.bls.gov/osmr/pdf/ec010060.pdf
Schervish, Paul G. “Philanthropy Can Thrive Without Estate Tax.” Chronicle of Philanthropy.
11 January 2001. http://philanthropy.com/premium/articles/v13/i06/06004701.htm
U.S. Census Bureau, American Community Survey. 2008. 2007 American Community
Survey 1-Year Estimates. Washington, D.C.: U.S. Department of Commerce.
http://www.census.gov/acs/www/
5
U.S. Census Bureau, American Community Survey. 2010. 2005-2009 American
Community Survey 5-Year Estimates. Washington, D.C.: U.S. Department of
Commerce. http://www.census.gov/acs/www/
U.S. Census Bureau, Annual Economic Surveys. 2009. 2007 County Business Patterns.
Washington, D.C.: U.S. Department of Commerce.
http://www.census.gov/econ/cbp/index.html
U.S. Census Bureau, Annual Economic Surveys. 2009. 2007 Nonemployer Statistics.
Washington, D.C.: U.S. Department of Commerce.
http://www.census.gov/econ/nonemployer/index.html
U.S. Department of Labor, Bureau of Labor Statistics and U.S. Department of
Commerce, Bureau of Census. 2007. March Demographic Supplement of Current
Population Survey. http://www.bls.census.gov/cps/ads/sdata.htm
Wilshire 5000 Index. 2010. Wilshire Associates.
http://www.wilshire.com/
------. 2009. Wilshire Associates.
------. 2008. Wilshire Associates.
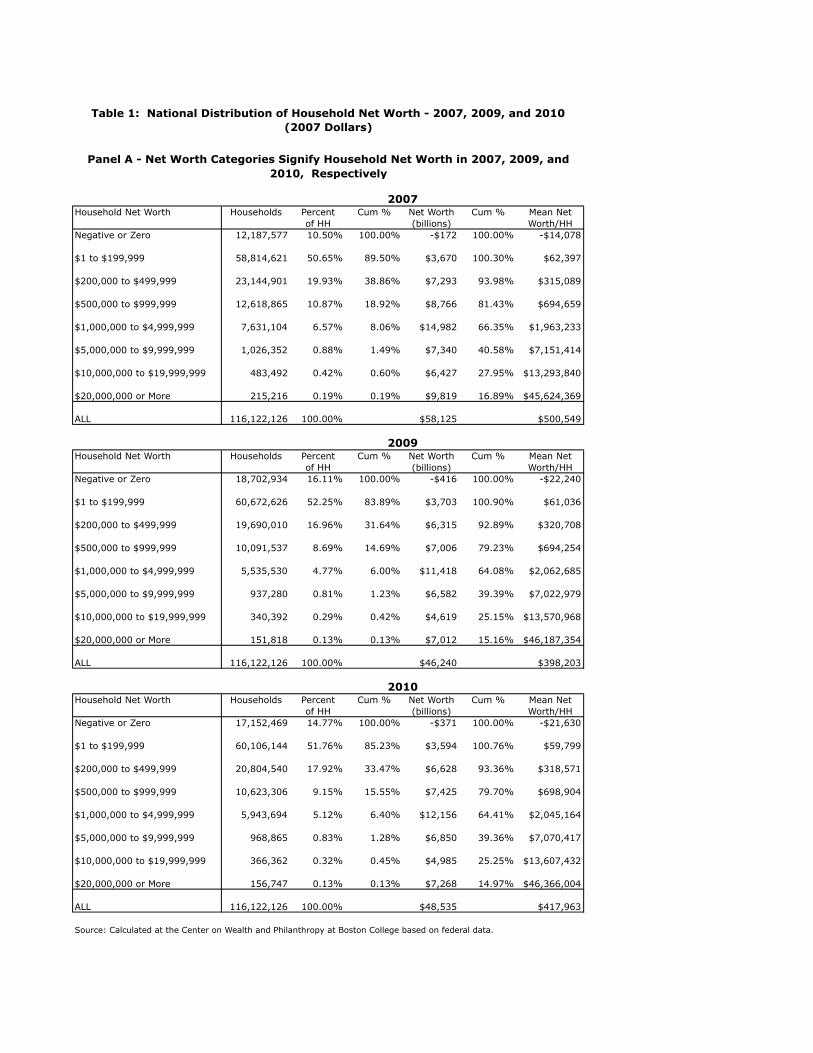
Household Net Worth Households Percent Cum % Net Worth Cum % Mean Netof HH (billions) Worth/HH
Negative or Zero 12,187,577 10.50% 100.00% -$172 100.00% -$14,078
$1 to $199,999 58,814,621 50.65% 89.50% $3,670 100.30% $62,397
$200,000 to $499,999 23,144,901 19.93% 38.86% $7,293 93.98% $315,089
$500,000 to $999,999 12,618,865 10.87% 18.92% $8,766 81.43% $694,659
$1,000,000 to $4,999,999 7,631,104 6.57% 8.06% $14,982 66.35% $1,963,233
$5,000,000 to $9,999,999 1,026,352 0.88% 1.49% $7,340 40.58% $7,151,414
$10,000,000 to $19,999,999 483,492 0.42% 0.60% $6,427 27.95% $13,293,840
$20,000,000 or More 215,216 0.19% 0.19% $9,819 16.89% $45,624,369
ALL 116,122,126 100.00% $58,125 $500,549
Household Net Worth Households Percent Cum % Net Worth Cum % Mean Netof HH (billions) Worth/HH
Negative or Zero 18,702,934 16.11% 100.00% -$416 100.00% -$22,240
$1 to $199,999 60,672,626 52.25% 83.89% $3,703 100.90% $61,036
$200,000 to $499,999 19,690,010 16.96% 31.64% $6,315 92.89% $320,708
$500,000 to $999,999 10,091,537 8.69% 14.69% $7,006 79.23% $694,254
$1,000,000 to $4,999,999 5,535,530 4.77% 6.00% $11,418 64.08% $2,062,685
$5,000,000 to $9,999,999 937,280 0.81% 1.23% $6,582 39.39% $7,022,979
$10,000,000 to $19,999,999 340,392 0.29% 0.42% $4,619 25.15% $13,570,968
$20,000,000 or More 151,818 0.13% 0.13% $7,012 15.16% $46,187,354
ALL 116,122,126 100.00% $46,240 $398,203
Household Net Worth Households Percent Cum % Net Worth Cum % Mean Netof HH (billions) Worth/HH
Negative or Zero 17,152,469 14.77% 100.00% -$371 100.00% -$21,630
$1 to $199,999 60,106,144 51.76% 85.23% $3,594 100.76% $59,799
$200,000 to $499,999 20,804,540 17.92% 33.47% $6,628 93.36% $318,571
$500,000 to $999,999 10,623,306 9.15% 15.55% $7,425 79.70% $698,904
$1,000,000 to $4,999,999 5,943,694 5.12% 6.40% $12,156 64.41% $2,045,164
$5,000,000 to $9,999,999 968,865 0.83% 1.28% $6,850 39.36% $7,070,417
$10,000,000 to $19,999,999 366,362 0.32% 0.45% $4,985 25.25% $13,607,432
$20,000,000 or More 156,747 0.13% 0.13% $7,268 14.97% $46,366,004
ALL 116,122,126 100.00% $48,535 $417,963
Source: Calculated at the Center on Wealth and Philanthropy at Boston College based on federal data.
Panel A - Net Worth Categories Signify Household Net Worth in 2007, 2009, and 2010, Respectively
Table 1: National Distribution of Household Net Worth - 2007, 2009, and 2010(2007 Dollars)
2009
2010
2007
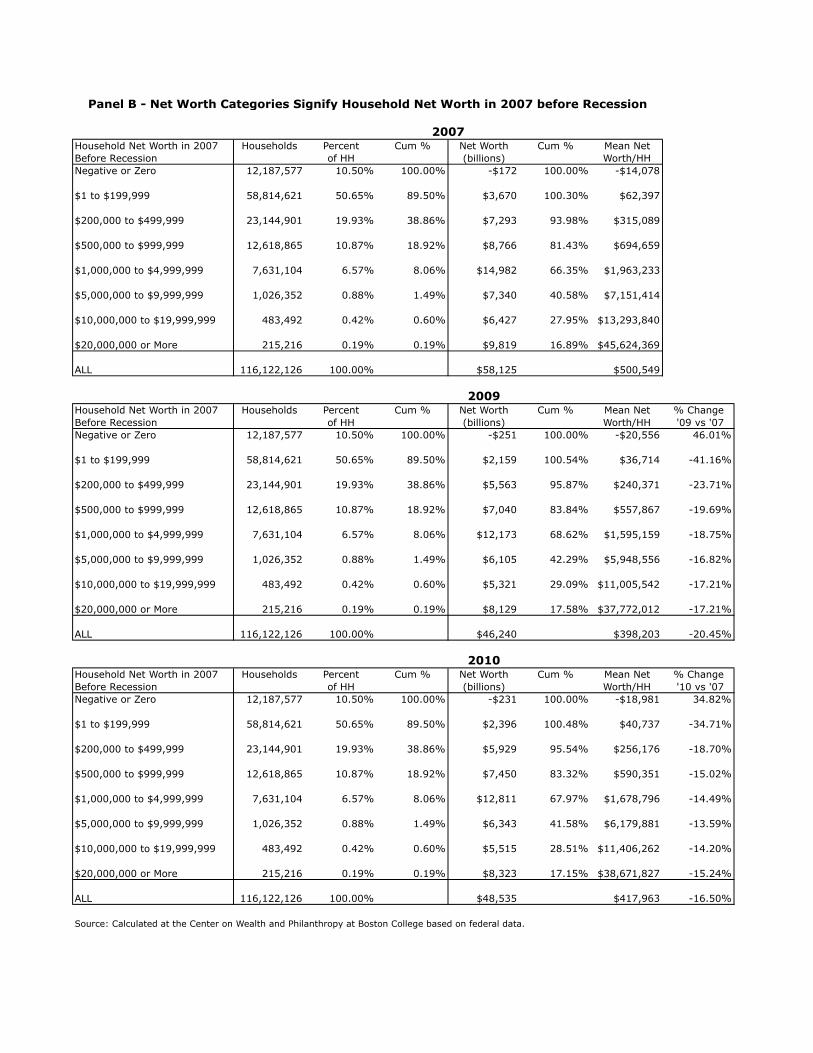
Household Net Worth in 2007 Households Percent Cum % Net Worth Cum % Mean NetBefore Recession of HH (billions) Worth/HHNegative or Zero 12,187,577 10.50% 100.00% -$172 100.00% -$14,078
$1 to $199,999 58,814,621 50.65% 89.50% $3,670 100.30% $62,397
$200,000 to $499,999 23,144,901 19.93% 38.86% $7,293 93.98% $315,089
$500,000 to $999,999 12,618,865 10.87% 18.92% $8,766 81.43% $694,659
$1,000,000 to $4,999,999 7,631,104 6.57% 8.06% $14,982 66.35% $1,963,233
$5,000,000 to $9,999,999 1,026,352 0.88% 1.49% $7,340 40.58% $7,151,414
$10,000,000 to $19,999,999 483,492 0.42% 0.60% $6,427 27.95% $13,293,840
$20,000,000 or More 215,216 0.19% 0.19% $9,819 16.89% $45,624,369
ALL 116,122,126 100.00% $58,125 $500,549
Household Net Worth in 2007 Households Percent Cum % Net Worth Cum % Mean Net % ChangeBefore Recession of HH (billions) Worth/HH '09 vs '07Negative or Zero 12,187,577 10.50% 100.00% -$251 100.00% -$20,556 46.01%
$1 to $199,999 58,814,621 50.65% 89.50% $2,159 100.54% $36,714 -41.16%
$200,000 to $499,999 23,144,901 19.93% 38.86% $5,563 95.87% $240,371 -23.71%
$500,000 to $999,999 12,618,865 10.87% 18.92% $7,040 83.84% $557,867 -19.69%
$1,000,000 to $4,999,999 7,631,104 6.57% 8.06% $12,173 68.62% $1,595,159 -18.75%
$5,000,000 to $9,999,999 1,026,352 0.88% 1.49% $6,105 42.29% $5,948,556 -16.82%
$10,000,000 to $19,999,999 483,492 0.42% 0.60% $5,321 29.09% $11,005,542 -17.21%
$20,000,000 or More 215,216 0.19% 0.19% $8,129 17.58% $37,772,012 -17.21%
ALL 116,122,126 100.00% $46,240 $398,203 -20.45%
Household Net Worth in 2007 Households Percent Cum % Net Worth Cum % Mean Net % ChangeBefore Recession of HH (billions) Worth/HH '10 vs '07Negative or Zero 12,187,577 10.50% 100.00% -$231 100.00% -$18,981 34.82%
$1 to $199,999 58,814,621 50.65% 89.50% $2,396 100.48% $40,737 -34.71%
$200,000 to $499,999 23,144,901 19.93% 38.86% $5,929 95.54% $256,176 -18.70%
$500,000 to $999,999 12,618,865 10.87% 18.92% $7,450 83.32% $590,351 -15.02%
$1,000,000 to $4,999,999 7,631,104 6.57% 8.06% $12,811 67.97% $1,678,796 -14.49%
$5,000,000 to $9,999,999 1,026,352 0.88% 1.49% $6,343 41.58% $6,179,881 -13.59%
$10,000,000 to $19,999,999 483,492 0.42% 0.60% $5,515 28.51% $11,406,262 -14.20%
$20,000,000 or More 215,216 0.19% 0.19% $8,323 17.15% $38,671,827 -15.24%
ALL 116,122,126 100.00% $48,535 $417,963 -16.50%
Source: Calculated at the Center on Wealth and Philanthropy at Boston College based on federal data.
2007
2009
2010
Panel B - Net Worth Categories Signify Household Net Worth in 2007 before Recession
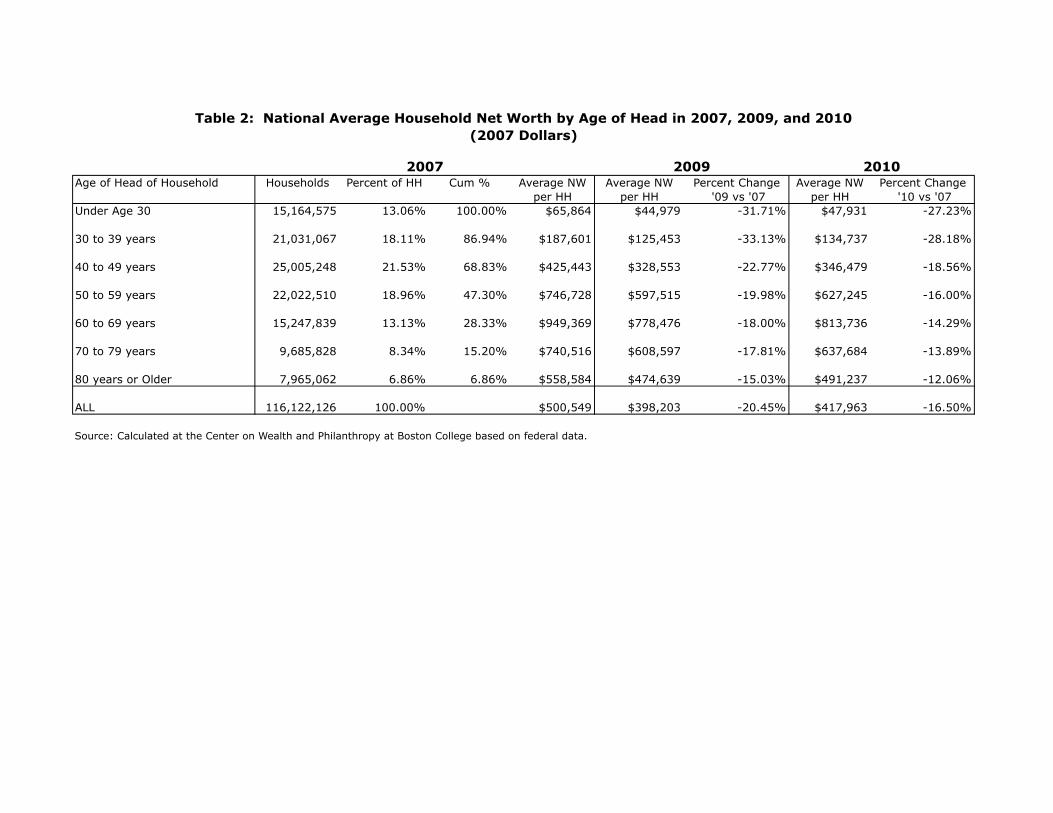
Age of Head of Household Households Percent of HH Cum % Average NW Average NW Percent Change Average NW Percent Changeper HH per HH '09 vs '07 per HH '10 vs '07
Under Age 30 15,164,575 13.06% 100.00% $65,864 $44,979 -31.71% $47,931 -27.23%
30 to 39 years 21,031,067 18.11% 86.94% $187,601 $125,453 -33.13% $134,737 -28.18%
40 to 49 years 25,005,248 21.53% 68.83% $425,443 $328,553 -22.77% $346,479 -18.56%
50 to 59 years 22,022,510 18.96% 47.30% $746,728 $597,515 -19.98% $627,245 -16.00%
60 to 69 years 15,247,839 13.13% 28.33% $949,369 $778,476 -18.00% $813,736 -14.29%
70 to 79 years 9,685,828 8.34% 15.20% $740,516 $608,597 -17.81% $637,684 -13.89%
80 years or Older 7,965,062 6.86% 6.86% $558,584 $474,639 -15.03% $491,237 -12.06%
ALL 116,122,126 100.00% $500,549 $398,203 -20.45% $417,963 -16.50%
Source: Calculated at the Center on Wealth and Philanthropy at Boston College based on federal data.
2007
Table 2: National Average Household Net Worth by Age of Head in 2007, 2009, and 2010(2007 Dollars)
2009 2010

Age of Head of Household Households Aggregate NW Percent of Cum %(Millions) Aggregate NW
Under Age 30 15,164,575 $998,806 1.72% 100.00%
30 to 40 years 21,031,067 $3,945,442 6.79% 98.28%
40 to 50 years 25,005,248 $10,638,303 18.30% 91.49%
50 to 60 years 22,022,510 $16,444,816 28.29% 73.19%
60 to 70 years 15,247,839 $14,475,832 24.90% 44.90%
70 to 80 years 9,685,828 $7,172,514 12.34% 19.99%
80 years or Older 7,965,062 $4,449,156 7.65% 7.65%
ALL 116,122,126 $58,124,869 100.00%
Age of Head of Household Households Aggregate NW Percent of Cum % Percent Change(Millions) Aggregate NW '09 vs '07
Under Age 30 15,164,575 $682,085 1.48% 100.00% -31.71%
30 to 40 years 21,031,067 $2,638,415 5.71% 98.53% -33.13%
40 to 50 years 25,005,248 $8,215,550 17.77% 92.83% -22.77%
50 to 60 years 22,022,510 $13,158,772 28.46% 75.06% -19.98%
60 to 70 years 15,247,839 $11,870,071 25.67% 46.59% -18.00%
70 to 80 years 9,685,828 $5,894,762 12.75% 20.92% -17.81%
80 years or Older 7,965,062 $3,780,532 8.18% 8.18% -15.03%
ALL 116,122,126 $46,240,185 100.00% -20.45%
Age of Head of Household Households Aggregate NW Percent of Cum % Percent Change(Millions) Aggregate NW '10 vs '07
Under Age 30 15,164,575 $726,847 1.50% 100.00% -27.23%
30 to 40 years 21,031,067 $2,833,661 5.84% 98.51% -28.18%
40 to 50 years 25,005,248 $8,663,805 17.85% 92.67% -18.56%
50 to 60 years 22,022,510 $13,813,503 28.46% 74.82% -16.00%
60 to 70 years 15,247,839 $12,407,713 25.56% 46.35% -14.29%
70 to 80 years 9,685,828 $6,176,493 12.73% 20.79% -13.89%
80 years or Older 7,965,062 $3,912,736 8.06% 8.06% -12.06%
ALL 116,122,126 $48,534,756 100.00% -16.50%
Source: Calculated at the Center on Wealth and Philanthropy at Boston College based on federal data.
2007
2009
2010
Table 3: National Aggregate Household Net Worth by Age of Head in 2007, 2009, and (2007 Dollars)

Number of Final Estates 23,358,464
$1 M Exemption after 2012
$5 M Exemption after 2012
$1 M Exemption after 2012
$5 M Exemption after 2012
$1 M Exemption after 2012
$5 M Exemption after 2012
$1 M Exemption after 2012
$5 M Exemption after 2012
Total Wealth Transfer 14.32$ 14.34$ 17.52$ 17.45$ 20.80$ 20.83$ 25.95$ 26.13$ (Unadjusted for Recession)
Total Wealth Transfer 12.96$ 12.98$ 15.52$ 15.55$ 18.18$ 18.21$ 22.24$ 22.28$ (Adjusted for Recession)
Accelerated Lifetime Giving 0.38$ 0.39$ 0.50$ 0.51$ 0.65$ 0.65$ 0.87$ 0.87$
Other Lifetime Transfers 3.00$ 3.01$ 3.71$ 3.72$ 4.48$ 4.49$ 5.74$ 5.76$
Value of Final Estates 9.58$ 9.58$ 11.31$ 11.32$ 13.05$ 13.07$ 15.63$ 15.65$
Estate Taxes 1.39$ 0.78$ 1.84$ 1.06$ 2.36$ 1.42$ 3.10$ 1.94$ Charitable Bequests 0.92$ 1.02$ 1.16$ 1.29$ 1.45$ 1.62$ 1.88$ 2.10$
Bequests to Heirs 7.04$ 7.56$ 8.05$ 8.70$ 8.95$ 9.73$ 10.30$ 11.26$ Estate Closing Fees 0.23$ 0.23$ 0.27$ 0.27$ 0.30$ 0.30$ 0.35$ 0.35$
Potential for CharityBaseline Lifetime Giving Trend 4.34$ 4.34$ 4.63$ 4.63$ 4.95$ 4.95$ 5.30$ 5.30$
Accelerated Livetime Giving 0.38$ 0.39$ 0.50$ 0.51$ 0.65$ 0.65$ 0.87$ 0.87$ Total Lifetime Giving 4.72$ 4.72$ 5.13$ 5.13$ 5.60$ 5.60$ 6.17$ 6.17$
Charitable Bequests 0.92$ 1.02$ 1.16$ 1.29$ 1.45$ 1.62$ 1.88$ 2.10$
Potential Total to Charity 5.64$ 5.74$ 6.29$ 6.42$ 7.04$ 7.22$ 8.05$ 8.27$
Source: Calculated at Center on Wealth and Philanthropy at Boston College based on Federal Data and the CWP Wealth Transfer Microsimulation Model.
Table 4: National Wealth Transfer Summary Table20-Year Period (2007 through 2026)In Inflation-Adjusted 2007 Dollars
In Trillions of Dollars24-Oct-11
1% Growth Scenario 2% Growth Scenario 3% Growth Scenario 4% Growth Scenario

Number of Final Estates 93,609,981
$1 M Exemption after 2012
$5 M Exemption after 2012
$1 M Exemption after 2012
$5 M Exemption after 2012
$1 M Exemption after 2012
$5 M Exemption after 2012
$1 M Exemption after 2012
$5 M Exemption after 2012
Total Wealth Transfer 42.10$ 42.55$ 72.20$ 73.30$ 121.53$ 123.92$ 238.20$ 243.29$ (Unadjusted for Recession)
Total Wealth Transfer 34.53$ 34.95$ 58.08$ 59.03$ 95.91$ 97.77$ 184.48$ 188.45$ (Adjusted for Recession)
Accelerated Lifetime Giving 0.78$ 0.79$ 1.45$ 1.49$ 2.73$ 2.81$ 5.61$ 5.79$
Other Lifetime Transfers 5.12$ 5.21$ 8.39$ 8.58$ 13.50$ 13.89$ 26.11$ 26.85$
Value of Final Estates 28.63$ 28.94$ 48.23$ 48.96$ 79.67$ 81.07$ 152.76$ 155.81$
Estate Taxes 4.60$ 2.38$ 9.80$ 5.64$ 19.86$ 12.68$ 45.02$ 31.14$ Charitable Bequests 2.65$ 3.04$ 5.38$ 6.25$ 11.82$ 13.69$ 28.23$ 32.33$
Bequests to Heirs 20.70$ 22.84$ 31.98$ 35.97$ 46.35$ 53.03$ 76.61$ 89.39$ Estate Closing Fees 0.67$ 0.68$ 1.08$ 1.09$ 1.64$ 1.67$ 2.90$ 2.95$
Potential for CharityBaseline Lifetime Giving Trend 14.69$ 14.69$ 19.17$ 19.17$ 25.51$ 25.51$ 34.54$ 34.54$
Accelerated Livetime Giving 0.78$ 0.79$ 1.45$ 1.49$ 2.73$ 2.81$ 5.61$ 5.79$ Total Lifetime Giving 15.47$ 15.48$ 20.63$ 20.67$ 28.24$ 28.33$ 40.15$ 40.33$
Charitable Bequests 2.65$ 3.04$ 5.38$ 6.25$ 11.82$ 13.69$ 28.23$ 32.33$
Potential Total to Charity 18.11$ 18.52$ 26.01$ 26.92$ 40.07$ 42.01$ 68.38$ 72.66$
Source: Calculated at Center on Wealth and Philanthropy at Boston College based on Federal Data and the CWP Wealth Transfer Microsimulation Model.
Table 5: National Wealth Transfer Summary Table55-Year Period (2007 through 2061)In Inflation-Adjusted 2007 Dollars
In Trillions of Dollars24-Oct-11
1% Growth Scenario 2% Growth Scenario 3% Growth Scenario 4% Growth Scenario

Number of Estates 1,528,601 6.54% 20,358,394 87.16% 1,204,944 5.16% 196,370 0.84% 40,104 0.17% 30,050 0.13% 23,358,464 100.00%
Value of Total Estates (29,710)$ - 3,792,985$ 39.61% 2,473,447$ 25.83% 1,317,177$ 13.76% 559,644$ 5.84% 1,431,005$ 14.95% 9,575,026$ 100.00%
100.00% 100.00% 100.00% 100.00% 100.00% 100.00%
Total Estate Fees 768$ 0.34% 112,621$ 49.34% 57,039$ 24.99% 25,429$ 11.14% 10,564$ 4.63% 21,823$ 9.56% 228,244$ 100.00%
- 2.97% 2.31% 1.93% 1.89% 1.53% 2.38%
Total Estate Taxes $ 0 0.00% $ 0 0.00% 273,109$ 19.66% 387,255$ 27.88% 217,009$ 15.63% 511,436$ 36.83% 1,388,808$ 100.00%
- 0.00% 11.04% 29.40% 38.78% 35.74% 14.50%
Bequest to Charity $ 0 0.00% 107,937$ 11.79% 125,958$ 13.76% 130,961$ 14.30% 69,401$ 7.58% 481,309$ 52.57% 915,567$ 100.00%
- 2.85% 5.09% 9.94% 12.40% 33.63% 9.56%
Bequest to Heirs $ 0 0.00% 3,572,427$ 50.73% 2,017,340$ 28.65% 773,532$ 10.98% 262,670$ 3.73% 416,438$ 5.91% 7,042,407$ 100.00%
- 94.19% 81.56% 58.73% 46.94% 29.10% 73.55%
Number of Estates 8,165,404 8.72% 80,671,767 86.18% 3,987,957 4.26% 557,901 0.60% 140,960 0.15% 85,993 0.09% 93,609,981 100.00%
Value of Total Estates (405,082)$ - 10,478,302$ 36.60% 8,404,347$ 29.36% 3,775,063$ 13.19% 1,923,106$ 6.72% 4,045,092$ 14.13% 28,628,175$ 100.00%
100.00% 100.00% 100.00% 100.00% 100.00% 100.00%
Total Estate Fees 2,265$ 0.34% 311,048$ 46.12% 190,395$ 28.23% 72,875$ 10.81% 36,142$ 5.36% 61,688$ 9.15% 674,412$ 100.00%
- 2.97% 2.27% 1.93% 1.88% 1.53% 2.36%
Total Estate Taxes $ 0 0.00% $ 0 0.00% 1,090,366$ 23.70% 1,198,923$ 26.06% 795,453$ 17.29% 1,516,472$ 32.96% 4,601,213$ 100.00%
- 0.00% 12.97% 31.76% 41.36% 37.49% 16.07%
Bequest to Charity $ 0 0.00% 294,469$ 11.12% 431,353$ 16.29% 362,844$ 13.70% 236,794$ 8.94% 1,322,598$ 49.95% 2,648,057$ 100.00%
- 2.81% 5.13% 9.61% 12.31% 32.70% 9.25%
Bequest to Heirs $ 0 0.00% 9,872,785$ 47.68% 6,692,234$ 32.32% 2,140,421$ 10.34% 854,717$ 4.13% 1,144,336$ 5.53% 20,704,493$ 100.00%
- 94.22% 79.63% 56.70% 44.44% 28.29% 72.32%
Source: Calculated at the Center on Wealth and Philanthropy at Boston College using the 2011 version of the Wealth Transfer Microsimulation Model based primarily on Federal data.
Table 6: Value and Distribution of Final Estates
1% Growth Scenario$1 Million Exemption Scenario
After Inter Vivos Transfers
National Wealth Transfer Study
(In Millions of 2007 Dollars)
Panel 12007-2026
Neg or Zero $1 to $.9M $1M to $4.9M $5M to $9.9M $10M to $19.9M $20M or more Total
Figures in upper-right hand corner of cells are percentages by category and add acrossPercentages at the bottom of cells are percent of the value of estates and add down.
Panel 22007-2061
Neg or Zero $1 to $.9M $1M to $4.9M $5M to $9.9M $10M to $19.9M $20M or more Total
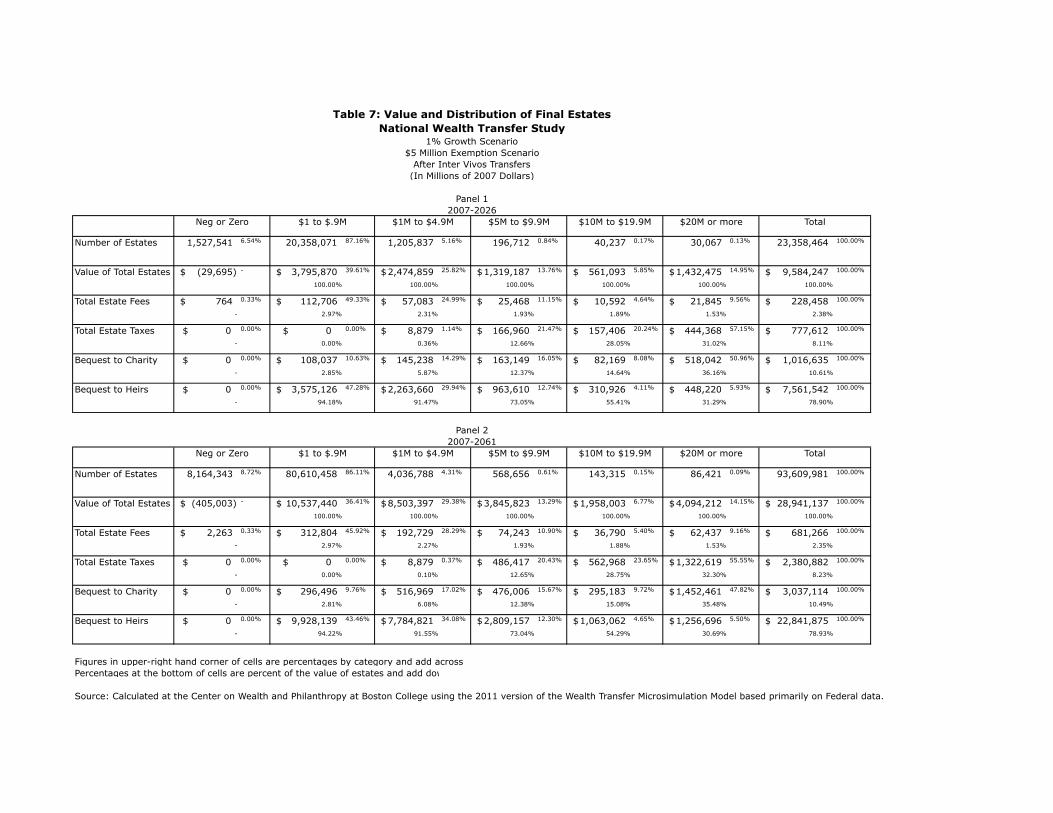
Number of Estates 1,527,541 6.54% 20,358,071 87.16% 1,205,837 5.16% 196,712 0.84% 40,237 0.17% 30,067 0.13% 23,358,464 100.00%
Value of Total Estates (29,695)$ - 3,795,870$ 39.61% 2,474,859$ 25.82% 1,319,187$ 13.76% 561,093$ 5.85% 1,432,475$ 14.95% 9,584,247$ 100.00%
100.00% 100.00% 100.00% 100.00% 100.00% 100.00%
Total Estate Fees 764$ 0.33% 112,706$ 49.33% 57,083$ 24.99% 25,468$ 11.15% 10,592$ 4.64% 21,845$ 9.56% 228,458$ 100.00%
- 2.97% 2.31% 1.93% 1.89% 1.53% 2.38%
Total Estate Taxes $ 0 0.00% $ 0 0.00% 8,879$ 1.14% 166,960$ 21.47% 157,406$ 20.24% 444,368$ 57.15% 777,612$ 100.00%
- 0.00% 0.36% 12.66% 28.05% 31.02% 8.11%
Bequest to Charity $ 0 0.00% 108,037$ 10.63% 145,238$ 14.29% 163,149$ 16.05% 82,169$ 8.08% 518,042$ 50.96% 1,016,635$ 100.00%
- 2.85% 5.87% 12.37% 14.64% 36.16% 10.61%
Bequest to Heirs $ 0 0.00% 3,575,126$ 47.28% 2,263,660$ 29.94% 963,610$ 12.74% 310,926$ 4.11% 448,220$ 5.93% 7,561,542$ 100.00%
- 94.18% 91.47% 73.05% 55.41% 31.29% 78.90%
Number of Estates 8,164,343 8.72% 80,610,458 86.11% 4,036,788 4.31% 568,656 0.61% 143,315 0.15% 86,421 0.09% 93,609,981 100.00%
Value of Total Estates (405,003)$ - 10,537,440$ 36.41% 8,503,397$ 29.38% 3,845,823$ 13.29% 1,958,003$ 6.77% 4,094,212$ 14.15% 28,941,137$ 100.00%
100.00% 100.00% 100.00% 100.00% 100.00% 100.00%
Total Estate Fees 2,263$ 0.33% 312,804$ 45.92% 192,729$ 28.29% 74,243$ 10.90% 36,790$ 5.40% 62,437$ 9.16% 681,266$ 100.00%
- 2.97% 2.27% 1.93% 1.88% 1.53% 2.35%
Total Estate Taxes $ 0 0.00% $ 0 0.00% 8,879$ 0.37% 486,417$ 20.43% 562,968$ 23.65% 1,322,619$ 55.55% 2,380,882$ 100.00%
- 0.00% 0.10% 12.65% 28.75% 32.30% 8.23%
Bequest to Charity $ 0 0.00% 296,496$ 9.76% 516,969$ 17.02% 476,006$ 15.67% 295,183$ 9.72% 1,452,461$ 47.82% 3,037,114$ 100.00%
- 2.81% 6.08% 12.38% 15.08% 35.48% 10.49%
Bequest to Heirs $ 0 0.00% 9,928,139$ 43.46% 7,784,821$ 34.08% 2,809,157$ 12.30% 1,063,062$ 4.65% 1,256,696$ 5.50% 22,841,875$ 100.00%
- 94.22% 91.55% 73.04% 54.29% 30.69% 78.93%
Source: Calculated at the Center on Wealth and Philanthropy at Boston College using the 2011 version of the Wealth Transfer Microsimulation Model based primarily on Federal data.
Total
1% Growth Scenario$5 Million Exemption Scenario
After Inter Vivos Transfers
National Wealth Transfer Study
(In Millions of 2007 Dollars)
$1 to $.9M $1M to $4.9M $5M to $9.9M $10M to $19.9M $20M or more
Percentages at the bottom of cells are percent of the value of estates and add down.
Table 7: Value and Distribution of Final Estates
Figures in upper-right hand corner of cells are percentages by category and add across
Panel 22007-2061
Neg or Zero $1 to $.9M $1M to $4.9M $5M to $9.9M $10M to $19.9M $20M or more Total
Panel 12007-2026
Neg or Zero
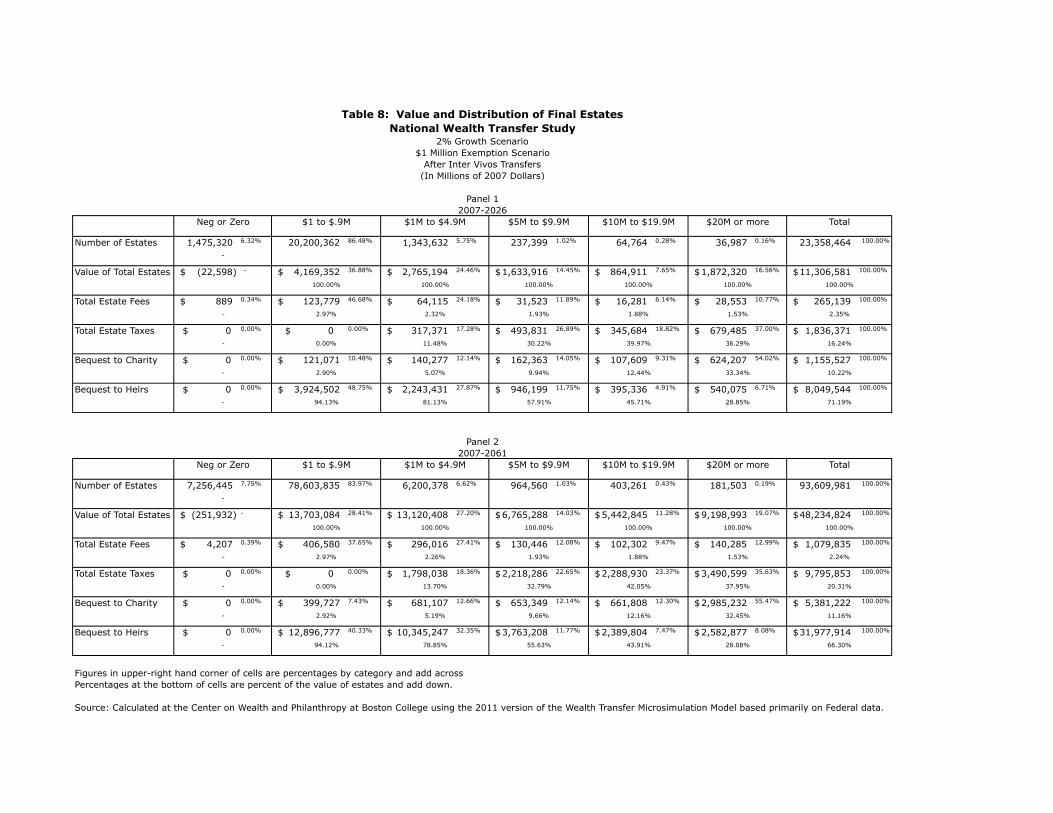
Number of Estates 1,475,320 6.32% 20,200,362 86.48% 1,343,632 5.75% 237,399 1.02% 64,764 0.28% 36,987 0.16% 23,358,464 100.00%
Value of Total Estates (22,598)$ - 4,169,352$ 36.88% 2,765,194$ 24.46% 1,633,916$ 14.45% 864,911$ 7.65% 1,872,320$ 16.56% 11,306,581$ 100.00%
Total Estate Fees 889$ 0.34% 123,779$ 46.68% 64,115$ 24.18% 31,523$ 11.89% 16,281$ 6.14% 28,553$ 10.77% 265,139$ 100.00%
Total Estate Taxes $ 0 0.00% $ 0 0.00% 317,371$ 17.28% 493,831$ 26.89% 345,684$ 18.82% 679,485$ 37.00% 1,836,371$ 100.00%
Bequest to Charity $ 0 0.00% 121,071$ 10.48% 140,277$ 12.14% 162,363$ 14.05% 107,609$ 9.31% 624,207$ 54.02% 1,155,527$ 100.00%
Bequest to Heirs $ 0 0.00% 3,924,502$ 48.75% 2,243,431$ 27.87% 946,199$ 11.75% 395,336$ 4.91% 540,075$ 6.71% 8,049,544$ 100.00%
Number of Estates 7,256,445 7.75% 78,603,835 83.97% 6,200,378 6.62% 964,560 1.03% 403,261 0.43% 181,503 0.19% 93,609,981 100.00%
Value of Total Estates (251,932)$ - 13,703,084$ 28.41% 13,120,408$ 27.20% 6,765,288$ 14.03% 5,442,845$ 11.28% 9,198,993$ 19.07% 48,234,824$ 100.00%
Total Estate Fees 4,207$ 0.39% 406,580$ 37.65% 296,016$ 27.41% 130,446$ 12.08% 102,302$ 9.47% 140,285$ 12.99% 1,079,835$ 100.00%
Total Estate Taxes $ 0 0.00% $ 0 0.00% 1,798,038$ 18.36% 2,218,286$ 22.65% 2,288,930$ 23.37% 3,490,599$ 35.63% 9,795,853$ 100.00%
Bequest to Charity $ 0 0.00% 399,727$ 7.43% 681,107$ 12.66% 653,349$ 12.14% 661,808$ 12.30% 2,985,232$ 55.47% 5,381,222$ 100.00%
Bequest to Heirs $ 0 0.00% 12,896,777$ 40.33% 10,345,247$ 32.35% 3,763,208$ 11.77% 2,389,804$ 7.47% 2,582,877$ 8.08% 31,977,914$ 100.00%
Figures in upper-right hand corner of cells are percentages by category and add across
Source: Calculated at the Center on Wealth and Philanthropy at Boston College using the 2011 version of the Wealth Transfer Microsimulation Model based primarily on Federal data.
Percentages at the bottom of cells are percent of the value of estates and add down.
National Wealth Transfer Study
66.30%
$1 Million Exemption Scenario
- 94.12% 78.85% 55.63% 43.91% 28.08%
20.31%
- 2.92% 5.19% 9.66% 12.16% 32.45% 11.16%
- 0.00% 13.70% 32.79% 42.05% 37.95%
100.00% 100.00%
- 2.97% 2.26% 1.93% 1.88% 1.53% 2.24%
100.00%
-
100.00% 100.00% 100.00%
71.19%
Panel 22007-2061
Neg or Zero $1 to $.9M $1M to $4.9M $5M to $9.9M $10M to $19.9M $20M or more Total
- 94.13% 81.13% 57.91% 45.71% 28.85%
16.24%
- 2.90% 5.07% 9.94% 12.44% 33.34% 10.22%
- 0.00% 11.48% 30.22% 39.97% 36.29%
100.00% 100.00% 100.00%
- 2.97% 2.32% 1.93% 1.88% 1.53% 2.35%
-
100.00% 100.00% 100.00%
2007-2026Neg or Zero $1 to $.9M $1M to $4.9M $5M to $9.9M $10M to $19.9M $20M or more Total
Table 8: Value and Distribution of Final Estates
2% Growth Scenario
After Inter Vivos Transfers(In Millions of 2007 Dollars)
Panel 1
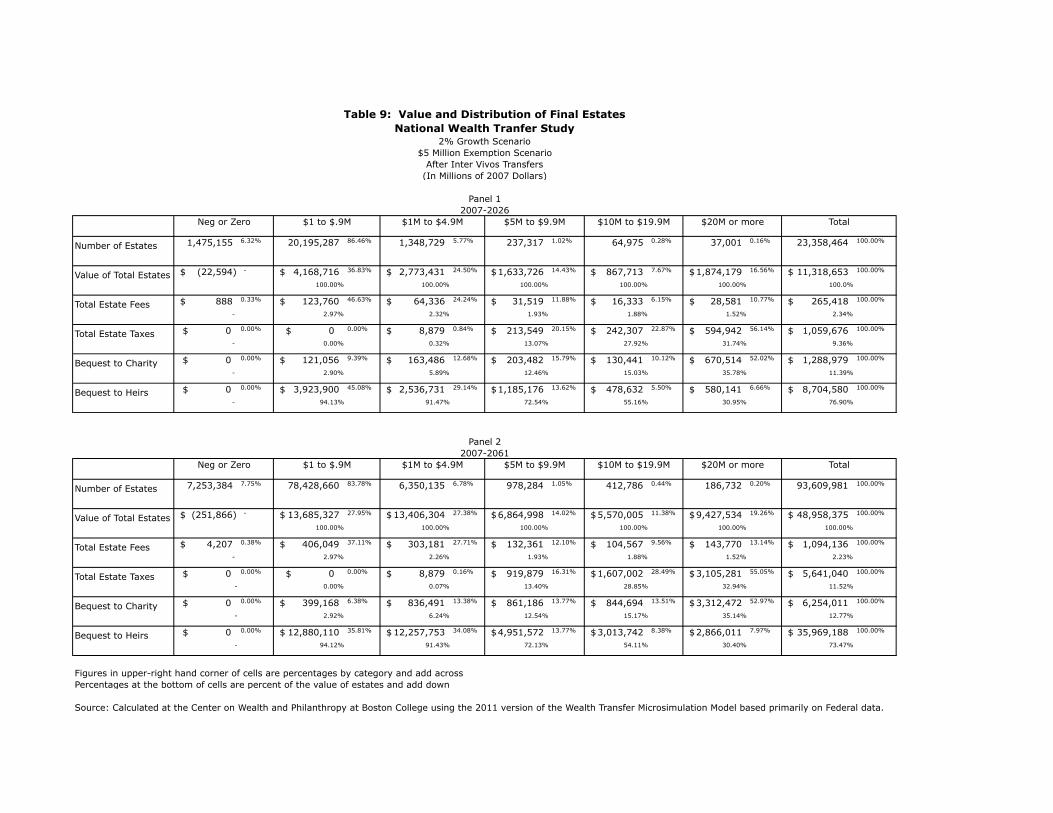
Number of Estates 1,475,155 6.32% 20,195,287 86.46% 1,348,729 5.77% 237,317 1.02% 64,975 0.28% 37,001 0.16% 23,358,464 100.00%
Value of Total Estates (22,594)$ - 4,168,716$ 36.83% 2,773,431$ 24.50% 1,633,726$ 14.43% 867,713$ 7.67% 1,874,179$ 16.56% 11,318,653$ 100.00%
100.00% 100.00% 100.00% 100.00% 100.00% 100.0%
Total Estate Fees 888$ 0.33% 123,760$ 46.63% 64,336$ 24.24% 31,519$ 11.88% 16,333$ 6.15% 28,581$ 10.77% 265,418$ 100.00%
- 2.97% 2.32% 1.93% 1.88% 1.52% 2.34%
Total Estate Taxes $ 0 0.00% $ 0 0.00% 8,879$ 0.84% 213,549$ 20.15% 242,307$ 22.87% 594,942$ 56.14% 1,059,676$ 100.00%
- 0.00% 0.32% 13.07% 27.92% 31.74% 9.36%
Bequest to Charity $ 0 0.00% 121,056$ 9.39% 163,486$ 12.68% 203,482$ 15.79% 130,441$ 10.12% 670,514$ 52.02% 1,288,979$ 100.00%
- 2.90% 5.89% 12.46% 15.03% 35.78% 11.39%
Bequest to Heirs $ 0 0.00% 3,923,900$ 45.08% 2,536,731$ 29.14% 1,185,176$ 13.62% 478,632$ 5.50% 580,141$ 6.66% 8,704,580$ 100.00%
- 94.13% 91.47% 72.54% 55.16% 30.95% 76.90%
Number of Estates 7,253,384 7.75% 78,428,660 83.78% 6,350,135 6.78% 978,284 1.05% 412,786 0.44% 186,732 0.20% 93,609,981 100.00%
Value of Total Estates (251,866)$ - 13,685,327$ 27.95% 13,406,304$ 27.38% 6,864,998$ 14.02% 5,570,005$ 11.38% 9,427,534$ 19.26% 48,958,375$ 100.00%
100.00% 100.00% 100.00% 100.00% 100.00% 100.00%
Total Estate Fees 4,207$ 0.38% 406,049$ 37.11% 303,181$ 27.71% 132,361$ 12.10% 104,567$ 9.56% 143,770$ 13.14% 1,094,136$ 100.00%
- 2.97% 2.26% 1.93% 1.88% 1.52% 2.23%
Total Estate Taxes $ 0 0.00% $ 0 0.00% 8,879$ 0.16% 919,879$ 16.31% 1,607,002$ 28.49% 3,105,281$ 55.05% 5,641,040$ 100.00%
- 0.00% 0.07% 13.40% 28.85% 32.94% 11.52%
Bequest to Charity $ 0 0.00% 399,168$ 6.38% 836,491$ 13.38% 861,186$ 13.77% 844,694$ 13.51% 3,312,472$ 52.97% 6,254,011$ 100.00%
- 2.92% 6.24% 12.54% 15.17% 35.14% 12.77%
Bequest to Heirs $ 0 0.00% 12,880,110$ 35.81% 12,257,753$ 34.08% 4,951,572$ 13.77% 3,013,742$ 8.38% 2,866,011$ 7.97% 35,969,188$ 100.00%
- 94.12% 91.43% 72.13% 54.11% 30.40% 73.47%
Figures in upper-right hand corner of cells are percentages by category and add across
Source: Calculated at the Center on Wealth and Philanthropy at Boston College using the 2011 version of the Wealth Transfer Microsimulation Model based primarily on Federal data.
Percentages at the bottom of cells are percent of the value of estates and add down.
National Wealth Tranfer Study
After Inter Vivos Transfers(In Millions of 2007 Dollars)
Panel 12007-2026
Panel 2
$10M to $19.9M $20M or more Total
Neg or Zero $1 to $.9M $1M to $4.9M $5M to $9.9M $10M to $19.9M $20M or more
Table 9: Value and Distribution of Final Estates
2% Growth Scenario$5 Million Exemption Scenario
Total2007-2061
Neg or Zero $1 to $.9M $1M to $4.9M $5M to $9.9M

Number of Estates 1,383,622 5.92% 20,173,346 86.36% 1,395,081 5.97% 260,963 1.12% 97,864 0.42% 47,587 0.20% 23,358,464 100.00%
Value of Total Estates (17,174)$ - 4,455,030$ 34.13% 2,995,463$ 22.95% 1,814,459$ 13.90% 1,298,073$ 9.94% 2,490,527$ 19.08% 13,054,327$ 100.00%
100.00% 100.00% 100.00% 100.00% 100.00% 100.00%
Total Estate Fees 775$ 0.26% 132,261$ 44.16% 69,038$ 23.05% 35,000$ 11.69% 24,459$ 8.17% 37,981$ 12.68% 299,513$ 100.00%
- 2.97% 2.30% 1.93% 1.88% 1.52% 2.29%
Total Estate Taxes $ 0 0.00% $ 0 0.00% 358,567$ 15.21% 555,033$ 23.54% 528,712$ 22.43% 915,302$ 38.82% 2,357,613$ 100.00%
- 0.00% 11.97% 30.59% 40.73% 36.75% 18.06%
Bequest to Charity $ 0 0.00% 131,722$ 9.10% 153,668$ 10.62% 179,850$ 12.42% 158,100$ 10.92% 824,164$ 56.94% 1,447,504$ 100.00%
- 2.96% 5.13% 9.91% 12.18% 33.09% 11.09%
Bequest to Heirs $ 0 0.00% 4,191,048$ 46.83% 2,414,189$ 26.98% 1,044,576$ 11.67% 586,802$ 6.56% 713,081$ 7.97% 8,949,697$ 100.00%
- 94.07% 80.59% 57.57% 45.21% 28.63% 68.56%
Number of Estates 5,745,540 6.14% 77,430,966 82.72% 7,802,934 8.34% 1,427,220 1.52% 711,338 0.76% 491,983 0.53% 93,609,981 100.00%
Value of Total Estates (127,938)$ - 16,710,799$ 20.97% 18,435,847$ 23.14% 9,796,515$ 12.30% 10,013,688$ 12.57% 24,714,682$ 31.02% 79,674,752$ 100.00%
100.00% 100.0% 100.00% 100.00% 100.00% 100.00%
Total Estate Fees 3,220$ 0.20% 494,307$ 30.09% 393,572$ 23.96% 188,757$ 11.49% 186,205$ 11.33% 376,899$ 22.94% 1,642,961$ 100.00%
- 2.96% 2.13% 1.93% 1.86% 1.53% 2.06%
Total Estate Taxes $ 0 0.00% $ 0 0.00% 2,937,661$ 14.79% 3,267,921$ 16.46% 4,209,877$ 21.20% 9,443,652$ 47.55% 19,859,112$ 100.00%
- 0.00% 15.93% 33.36% 42.04% 38.21% 24.93%
Bequest to Charity $ 0 0.00% 520,060$ 4.40% 1,040,704$ 8.80% 949,354$ 8.03% 1,326,925$ 11.22% 7,985,194$ 67.54% 11,822,237$ 100.00%
- 3.11% 5.65% 9.69% 13.25% 32.31% 14.84%
Bequest to Heirs $ 0 0.00% 15,696,432$ 33.86% 14,063,910$ 30.34% 5,390,482$ 11.63% 4,290,681$ 9.26% 6,908,936$ 14.91% 46,350,442$ 100.00%
- 93.93% 76.29% 55.02% 42.85% 27.95% 58.17%
Figures in upper-right hand corner of cells are percentages by category and add across
Source: Calculated at the Center on Wealth and Philanthropy at Boston College using the 2011 version of the Wealth Transfer Microsimulation Model based primarily on Federal data.
National Wealth Transfer Study
Panel 22007-2061
Neg or Zero $1 to $.9M $1M to $4.9M $5M to $9.9M $10M to $19.9M $20M or more
$1M to $4.9M $5M to $9.9M $10M to $19.9M $20M or more Total
Percentages at the bottom of cells are percent of the value of estates and add down.
Table 10: Value and Distribution of Final Estates
3% Growth Scenario
After Inter Vivos Transfers(In Millions of 2007 Dollars)
$1 Million Exemption Scenario
Total
Panel 12007-2026
Neg or Zero $1 to $.9M

Number of Estates 1,383,549 5.92% 20,169,759 86.35% 1,398,534 5.99% 260,946 1.12% 98,036 0.42% 47,640 0.20% 23,358,464 100.00%
Value of Total Estates (17,170)$ - 4,456,086$ 34.10% 3,003,294$ 22.98% 1,814,799$ 13.89% 1,300,464$ 9.95% 2,493,845$ 19.08% 13,069,262$ 100.00%
100.00% 100.00% 100.00% 100.00% 100.00% 100.00%
Total Estate Fees 774$ 0.26% 132,292$ 44.12% 69,202$ 23.08% 35,007$ 11.68% 24,508$ 8.17% 38,031$ 12.68% 299,814$ 100.00%
- 2.97% 2.30% 1.93% 1.88% 1.52% 2.29%
Total Estate Taxes $ 0 0.00% $ 0 0.00% 8,879$ 0.63% 239,560$ 16.88% 366,774$ 25.84% 804,134$ 56.66% 1,419,347$ 100.00%
- 0.00% 0.30% 13.20% 28.20% 32.24% 10.86%
Bequest to Charity $ 0 0.00% 131,771$ 8.15% 180,803$ 11.18% 226,302$ 13.99% 192,769$ 11.92% 885,515$ 54.76% 1,617,161$ 100.00%
- 2.96% 6.02% 12.47% 14.82% 35.51% 12.37%
Bequest to Heirs $ 0 0.00% 4,192,022$ 43.07% 2,744,411$ 28.20% 1,313,930$ 13.50% 716,414$ 7.36% 766,164$ 7.87% 9,732,941$ 100.00%
- 94.07% 91.38% 72.40% 55.09% 30.72% 74.47%
Number of Estates 5,744,753 6.14% 77,255,037 82.53% 7,926,095 8.47% 1,454,092 1.55% 722,941 0.77% 507,063 0.54% 93,609,981 100.00%
Value of Total Estates (127,863)$ - 16,681,134$ 20.58% 18,770,492$ 23.15% 9,970,448$ 12.30% 10,151,550$ 12.52% 25,491,084$ 31.44% 81,067,932$ 100.00%
100.00% 100.00% 100.00% 100.00% 100.00% 100.00%
Total Estate Fees 3,223$ 0.19% 493,406$ 29.60% 400,385$ 24.02% 192,122$ 11.53% 188,915$ 11.33% 388,739$ 23.32% 1,666,790$ 100.00%
- 2.96% 2.13% 1.93% 1.86% 1.52% 2.06%
Total Estate Taxes $ 0 0.00% $ 0 0.00% 8,879$ 0.07% 1,283,277$ 10.12% 2,948,949$ 23.26% 8,438,429$ 66.55% 12,679,534$ 100.00%
- 0.00% 0.05% 12.87% 29.05% 3392951286.00% 15.64%
Bequest to Charity $ 0 0.00% 519,163$ 3.79% 1,317,608$ 9.63% 1,271,571$ 9.29% 1,646,445$ 12.03% 8,934,030$ 65.27% 13,688,816$ 100.00%
- 3.11% 7.02% 12.75% 16.22% 35.05% 16.89%
Bequest to Heirs $ 0 0.00% 15,668,566$ 29.55% 17,043,621$ 32.14% 7,223,479$ 13.62% 5,367,241$ 10.12% 7,729,886$ 14.58% 53,032,792$ 100.00%
- 93.93% 90.80% 72.45% 52.87% 30.32% 65.42%
Figures in upper-right hand corner of cells are percentages by category and add across
Source: Calculated at the Center on Wealth and Philanthropy at Boston College using the 2011 version of the Wealth Transfer Microsimulation Model based primarily on Federal data.
Percentages at the bottom of cells are percent of the value of estates and add down.
Panel 22007-2061
Neg or Zero $1 to $.9M $1M to $4.9M $5M to $9.9M $10M to $19.9M $20M or more
$1 to $.9M $1M to $4.9M $5M to $9.9M $10M to $19.9M $20M or more
National Wealth Transfer Study
Total
Table 11: Value and Distribution of Final Estates
3% Growth Scenario$5 Million Exemption Scenario
After Inter Vivos Transfers
Total
(In Millions of 2007 Dollars)
Panel 12007-2026
Neg or Zero
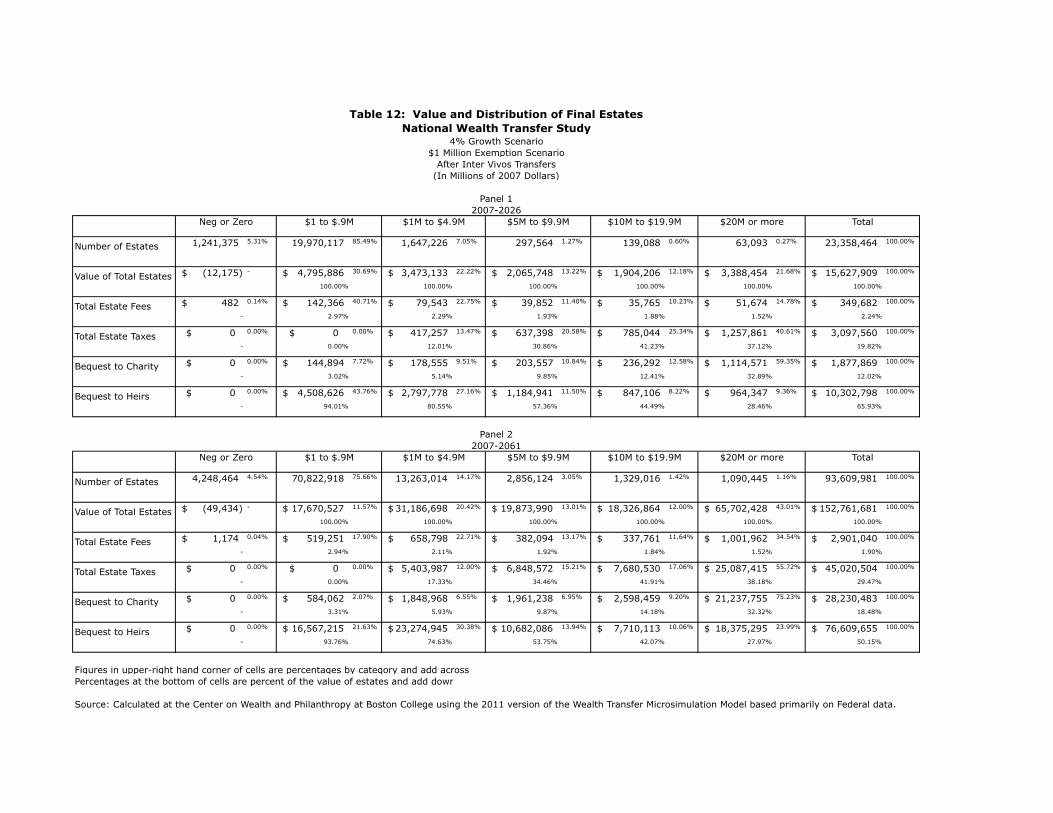
Number of Estates 1,241,375 5.31% 19,970,117 85.49% 1,647,226 7.05% 297,564 1.27% 139,088 0.60% 63,093 0.27% 23,358,464 100.00%
Value of Total Estates (12,175)$ - 4,795,886$ 30.69% 3,473,133$ 22.22% 2,065,748$ 13.22% 1,904,206$ 12.18% 3,388,454$ 21.68% 15,627,909$ 100.00%
100.00% 100.00% 100.00% 100.00% 100.00% 100.00%
Total Estate Fees 482$ 0.14% 142,366$ 40.71% 79,543$ 22.75% 39,852$ 11.40% 35,765$ 10.23% 51,674$ 14.78% 349,682$ 100.00%
- 2.97% 2.29% 1.93% 1.88% 1.52% 2.24%
Total Estate Taxes $ 0 0.00% $ 0 0.00% 417,257$ 13.47% 637,398$ 20.58% 785,044$ 25.34% 1,257,861$ 40.61% 3,097,560$ 100.00%
- 0.00% 12.01% 30.86% 41.23% 37.12% 19.82%
Bequest to Charity $ 0 0.00% 144,894$ 7.72% 178,555$ 9.51% 203,557$ 10.84% 236,292$ 12.58% 1,114,571$ 59.35% 1,877,869$ 100.00%
- 3.02% 5.14% 9.85% 12.41% 32.89% 12.02%
Bequest to Heirs $ 0 0.00% 4,508,626$ 43.76% 2,797,778$ 27.16% 1,184,941$ 11.50% 847,106$ 8.22% 964,347$ 9.36% 10,302,798$ 100.00%
- 94.01% 80.55% 57.36% 44.49% 28.46% 65.93%
Number of Estates 4,248,464 4.54% 70,822,918 75.66% 13,263,014 14.17% 2,856,124 3.05% 1,329,016 1.42% 1,090,445 1.16% 93,609,981 100.00%
Value of Total Estates (49,434)$ - 17,670,527$ 11.57% 31,186,698$ 20.42% 19,873,990$ 13.01% 18,326,864$ 12.00% 65,702,428$ 43.01% 152,761,681$ 100.00%
100.00% 100.00% 100.00% 100.00% 100.00% 100.00%
Total Estate Fees 1,174$ 0.04% 519,251$ 17.90% 658,798$ 22.71% 382,094$ 13.17% 337,761$ 11.64% 1,001,962$ 34.54% 2,901,040$ 100.00%
- 2.94% 2.11% 1.92% 1.84% 1.52% 1.90%
Total Estate Taxes $ 0 0.00% $ 0 0.00% 5,403,987$ 12.00% 6,848,572$ 15.21% 7,680,530$ 17.06% 25,087,415$ 55.72% 45,020,504$ 100.00%
- 0.00% 17.33% 34.46% 41.91% 38.18% 29.47%
Bequest to Charity $ 0 0.00% 584,062$ 2.07% 1,848,968$ 6.55% 1,961,238$ 6.95% 2,598,459$ 9.20% 21,237,755$ 75.23% 28,230,483$ 100.00%
- 3.31% 5.93% 9.87% 14.18% 32.32% 18.48%
Bequest to Heirs $ 0 0.00% 16,567,215$ 21.63% 23,274,945$ 30.38% 10,682,086$ 13.94% 7,710,113$ 10.06% 18,375,295$ 23.99% 76,609,655$ 100.00%
- 93.76% 74.63% 53.75% 42.07% 27.97% 50.15%
Source: Calculated at the Center on Wealth and Philanthropy at Boston College using the 2011 version of the Wealth Transfer Microsimulation Model based primarily on Federal data.
Figures in upper-right hand corner of cells are percentages by category and add acrossPercentages at the bottom of cells are percent of the value of estates and add down.
$1 Million Exemption Scenario
Panel 22007-2061
Neg or Zero $1 to $.9M $1M to $4.9M $5M to $9.9M $10M to $19.9M $20M or more Total
Panel 12007-2026
Neg or Zero $1 to $.9M $1M to $4.9M $5M to $9.9M $10M to $19.9M $20M or more Total
Table 12: Value and Distribution of Final Estates
4% Growth Scenario
After Inter Vivos Transfers(In Millions of 2007 Dollars)
National Wealth Transfer Study

Number of Estates 1,241,183 5.31% 19,965,419 85.47% 1,651,623 7.07% 297,974 1.28% 139,025 0.60% 63,239 0.27% 23,358,464 100.00%
Value of Total Estates (12,172)$ - 4,795,695$ 30.65% 3,482,722$ 22.26% 2,069,332$ 13.23% 1,904,098$ 12.17% 3,394,748$ 21.70% 15,647,077$ 100.00%
100.00% 100.00% 100.00% 100.00% 100.00% 100.00%
Total Estate Fees 482$ 0.14% 142,362$ 40.67% 79,770$ 22.79% 39,921$ 11.40% 35,771$ 10.22% 51,770$ 14.79% 350,076$ 100.00%
- 2.97% 2.29% 1.93% 1.88% 1.53% 2.24%
Total Estate Taxes $ 0 0.00% $ 0 0.00% 8,879$ 0.46% 276,186$ 14.24% 546,245$ 28.17% 1,107,846$ 57.13% 1,939,155$ 100.00%
- 0.00% 0.25% 13.35% 28.69% 32.63% 12.39%
Bequest to Charity $ 0 0.00% 144,880$ 6.90% 210,247$ 10.02% 257,218$ 12.26% 287,814$ 13.72% 1,198,322$ 57.10% 2,098,481$ 100.00%
- 3.02% 6.04% 12.43% 15.12% 35.30% 13.41%
Bequest to Heirs $ 0 0.00% 4,508,452$ 40.04% 3,183,826$ 28.28% 1,496,008$ 13.29% 1,034,267$ 9.19% 1,036,810$ 9.21% 11,259,364$ 100.00%
- 94.01% 91.42% 72.29% 54.32% 30.54% 71.96%
Number of Estates 4,247,857 4.54% 70,686,754 75.51% 13,274,243 14.18% 2,910,980 3.11% 1,376,924 1.47% 1,113,222 1.19% 93,609,981 100.00%
Value of Total Estates (49,423)$ - 17,643,576$ 11.32% 31,348,163$ 20.12% 20,207,738$ 12.97% 19,001,977$ 12.20% 67,602,988$ 43.39% 155,805,615$ 100.00%
100.00% 100.00% 100.00% 100.00% 100.00% 100.00%
Total Estate Fees 1,174$ 0.04% 518,328$ 17.56% 661,690$ 22.42% 388,526$ 13.17% 350,273$ 11.87% 1,030,946$ 34.94% 2,950,936$ 100.00%
- 2.94% 2.11% 1.92% 1.84% 1.53% 1.89%
Total Estate Taxes $ 0 0.00% $ 0 0.00% 8,879$ 0.03% 2,751,023$ 8.84% 5,411,768$ 17.38% 22,964,698$ 73.76% 31,136,368$ 100.00%
- 0.00% 0.03% 13.61% 28.48% 33.97% 19.98%
Bequest to Charity $ 0 0.00% 583,563$ 1.81% 2,380,154$ 7.36% 2,652,912$ 8.21% 3,332,899$ 10.31% 23,379,217$ 72.32% 32,328,746$ 100.00%
- 3.31% 7.59% 13.13% 17.54% 34.58% 20.75%
Bequest to Heirs $ 0 0.00% 16,541,685$ 18.51% 28,297,440$ 31.66% 14,415,277$ 16.13% 9,907,036$ 11.08% 20,228,127$ 22.63% 89,389,566$ 100.00%
- 93.75% 90.27% 71.34% 52.14% 29.92% 57.37%
Source: Calculated at the Center on Wealth and Philanthropy at Boston College using the 2011 version of the Wealth Transfer Microsimulation Model based primarily on Federal data.
Figures in upper-right hand corner of cells are percentages by category and add acrossPercentages at the bottom of cells are percent of the value of estates and add down.
Panel 22007-2061
Neg or Zero $1 to $.9M $1M to $4.9M $5M to $9.9M $10M to $19.9M $20M or more Total
(In Millions of 2007 Dollars)
Panel 12007-2026
Neg or Zero $1 to $.9M $1M to $4.9M $5M to $9.9M $10M to $19.9M $20M or more Total
Table 13: Value and Distribution of Final Estates
4% Growth Scenario$5 Million Exemption Scenario
After Inter Vivos Transfers
National Wealth Transfer Study

Appendix A
Summary Estimates in 2014 Purchasing Power
May 28, 2014

This appendix contains two tables (Table 4A and Table 5A) that contain summary estimates of wealth transfer and projections of charitable giving for the 20-‐year period 2007 to 2026 and the 55-‐year period 2007 to 2061, respectively, expressed in 2014 purchasing power. The tables are replicates of Table 4 and Table 5 from the original report except that the dollar figures have been adjusted using the consumer price index from 2007 to 2014 purchasing power.

Number of Final Estates 23,358,464
$1 M Exemption after 2012
$5 M Exemption after 2012
$1 M Exemption after 2012
$5 M Exemption after 2012
$1 M Exemption after 2012
$5 M Exemption after 2012
$1 M Exemption after 2012
$5 M Exemption after 2012
Total Wealth Transfer 16.38$ 16.40$ 20.03$ 19.95$ 23.78$ 23.82$ 29.67$ 29.88$ (Unadjusted for Recession)
Total Wealth Transfer 14.82$ 14.84$ 17.74$ 17.78$ 20.78$ 20.82$ 25.43$ 25.48$ (Adjusted for Recession)
Accelerated Lifetime Giving 0.44$ 0.44$ 0.58$ 0.58$ 0.74$ 0.74$ 0.99$ 1.00$
Other Lifetime Transfers 3.43$ 3.44$ 4.24$ 4.26$ 5.12$ 5.14$ 6.57$ 6.59$
Value of Final Estates 10.95$ 10.96$ 12.93$ 12.94$ 14.93$ 14.94$ 17.87$ 17.89$
Estate Taxes 1.59$ 0.89$ 2.10$ 1.21$ 2.70$ 1.62$ 3.54$ 2.22$ Charitable Bequests 1.05$ 1.16$ 1.32$ 1.47$ 1.66$ 1.85$ 2.15$ 2.40$
Bequests to Heirs 8.05$ 8.65$ 9.20$ 9.95$ 10.23$ 11.13$ 11.78$ 12.87$ Estate Closing Fees 0.26$ 0.26$ 0.30$ 0.30$ 0.34$ 0.34$ 0.40$ 0.40$
Potential for CharityBaseline Lifetime Giving Trend 4.96$ 4.96$ 5.29$ 5.29$ 5.66$ 5.66$ 6.06$ 6.06$
Accelerated Livetime Giving 0.44$ 0.44$ 0.58$ 0.58$ 0.74$ 0.74$ 0.99$ 1.00$ Total Lifetime Giving 5.40$ 5.40$ 5.87$ 5.87$ 6.40$ 6.40$ 7.05$ 7.06$
Charitable Bequests 1.05$ 1.16$ 1.32$ 1.47$ 1.66$ 1.85$ 2.15$ 2.40$
Potential Total to Charity 6.44$ 6.56$ 7.19$ 7.34$ 8.05$ 8.25$ 9.20$ 9.46$
Note: Table 4A is identical to Table 4 in the original report except that the dollar estimates are expressed in 2014 purchasing power.Source: Calculated at Center on Wealth and Philanthropy at Boston College based on Federal Data and the CWP Wealth Transfer Microsimulation Model.
Table 4A: National Wealth Transfer Summary Table20-Year Period (2007 through 2026)
In Inflation-Adjusted 2014 DollarsIn Trillions of Dollars
28-May-14
1% Growth Scenario 2% Growth Scenario 3% Growth Scenario 4% Growth Scenario
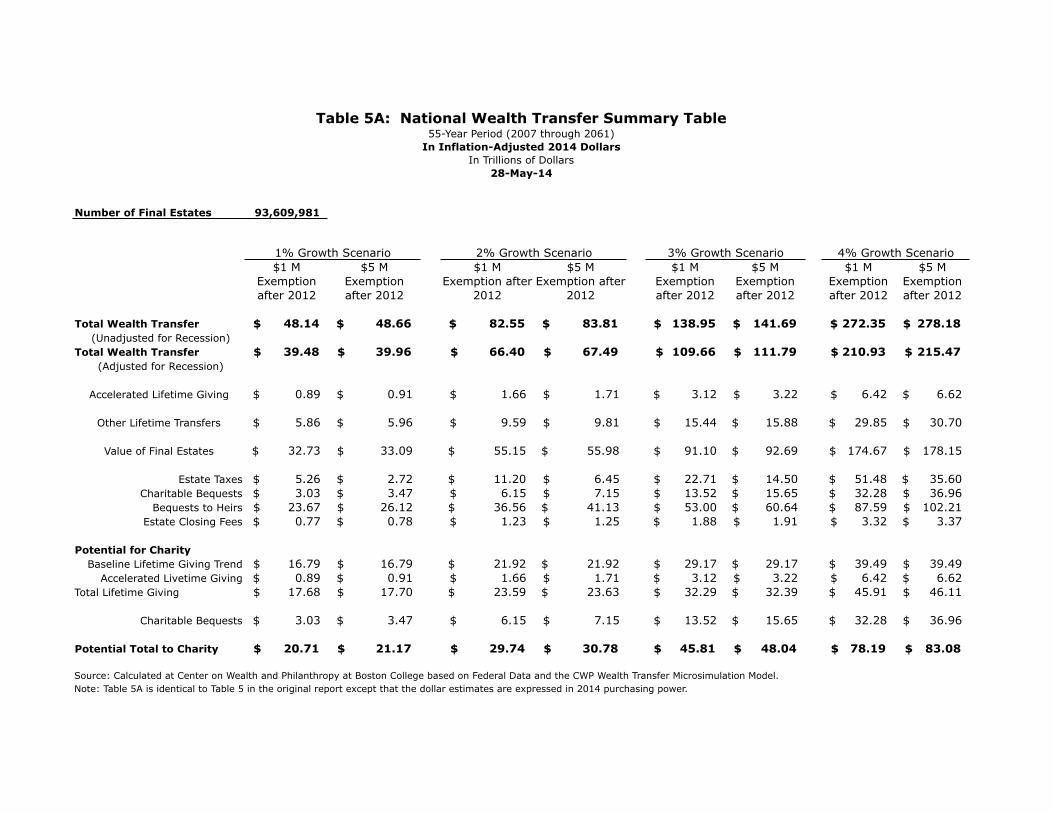
Number of Final Estates 93,609,981
$1 M Exemption after 2012
$5 M Exemption after 2012
$1 M Exemption after
2012
$5 M Exemption after
2012
$1 M Exemption after 2012
$5 M Exemption after 2012
$1 M Exemption after 2012
$5 M Exemption after 2012
Total Wealth Transfer 48.14$ 48.66$ 82.55$ 83.81$ 138.95$ 141.69$ 272.35$ 278.18$ (Unadjusted for Recession)
Total Wealth Transfer 39.48$ 39.96$ 66.40$ 67.49$ 109.66$ 111.79$ 210.93$ 215.47$ (Adjusted for Recession)
Accelerated Lifetime Giving 0.89$ 0.91$ 1.66$ 1.71$ 3.12$ 3.22$ 6.42$ 6.62$
Other Lifetime Transfers 5.86$ 5.96$ 9.59$ 9.81$ 15.44$ 15.88$ 29.85$ 30.70$
Value of Final Estates 32.73$ 33.09$ 55.15$ 55.98$ 91.10$ 92.69$ 174.67$ 178.15$
Estate Taxes 5.26$ 2.72$ 11.20$ 6.45$ 22.71$ 14.50$ 51.48$ 35.60$ Charitable Bequests 3.03$ 3.47$ 6.15$ 7.15$ 13.52$ 15.65$ 32.28$ 36.96$
Bequests to Heirs 23.67$ 26.12$ 36.56$ 41.13$ 53.00$ 60.64$ 87.59$ 102.21$ Estate Closing Fees 0.77$ 0.78$ 1.23$ 1.25$ 1.88$ 1.91$ 3.32$ 3.37$
Potential for CharityBaseline Lifetime Giving Trend 16.79$ 16.79$ 21.92$ 21.92$ 29.17$ 29.17$ 39.49$ 39.49$
Accelerated Livetime Giving 0.89$ 0.91$ 1.66$ 1.71$ 3.12$ 3.22$ 6.42$ 6.62$ Total Lifetime Giving 17.68$ 17.70$ 23.59$ 23.63$ 32.29$ 32.39$ 45.91$ 46.11$
Charitable Bequests 3.03$ 3.47$ 6.15$ 7.15$ 13.52$ 15.65$ 32.28$ 36.96$
Potential Total to Charity 20.71$ 21.17$ 29.74$ 30.78$ 45.81$ 48.04$ 78.19$ 83.08$
Note: Table 5A is identical to Table 5 in the original report except that the dollar estimates are expressed in 2014 purchasing power.Source: Calculated at Center on Wealth and Philanthropy at Boston College based on Federal Data and the CWP Wealth Transfer Microsimulation Model.
Table 5A: National Wealth Transfer Summary Table55-Year Period (2007 through 2061)
In Inflation-Adjusted 2014 DollarsIn Trillions of Dollars
28-May-14
1% Growth Scenario 2% Growth Scenario 3% Growth Scenario 4% Growth Scenario