LAND-BASED DISPOSAL OF FLOWBACK WATER RESULTING …
65
The Pennsylvania State University The Graduate School College of Agricultural Sciences LAND-BASED DISPOSAL OF FLOWBACK WATER RESULTING FROM HYDRAULIC FRACTURING OF GAS WELLS IN THE MARCELLUS SHALE A Thesis in Agricultural and Biological Engineering by Cody C. Cogan © 2013 Cody C. Cogan Submitted in Partial Fulfillment of the Requirements for the Degree of Master of Science May 2013
Transcript of LAND-BASED DISPOSAL OF FLOWBACK WATER RESULTING …

The Pennsylvania State University
The Graduate School
College of Agricultural Sciences
LAND-BASED DISPOSAL OF FLOWBACK WATER RESULTING FROM
HYDRAULIC FRACTURING OF GAS WELLS IN THE MARCELLUS SHALE
A Thesis in
Agricultural and Biological Engineering
by
Cody C. Cogan
© 2013 Cody C. Cogan
Submitted in Partial Fulfillment of the Requirements
for the Degree of
Master of Science
May 2013

ii
The thesis Cody C. Cogan was reviewed and approved* by the following: Herschel A. Elliott Professor of Agricultural and Biological Engineering Major Professor and Thesis Adviser Albert R. Jarrett Professor Emeritus of Biological Engineering Jack Watson Professor of Soil Science/Soil Physics Thomas B. Murphy Co-Director of the Marcellus Center for Outreach and Research (MCOR) Virendra M. Puri Distinguished Professor and Graduate Coordinator of Agricultural and Biological Engineering *Signatures are on file in the Graduate School.

iii
Abstract
Natural gas is extracted through hydraulic fracturing, the pumping of water under high
pressure into the shale, fracturing the strata, thereby allowing gas to escape. Gas returns to the
surface under high pressure carrying with it brackish or brine water known as flowback.
Flowback is generally contaminated with fracturing fluids and substances naturally occurring in
the shale strata. Flowback ranges from 1,000-150,000 ppm total dissolved solids (TDS)
including sulfates, chlorides, bromides, and toxic proprietary fracturing chemicals (Shramko et
al., 2009). Flowback contains several components that are linked to harmful environmental and
health effects.
Due to these potentially toxic substances contained within flowback waters, discharge
directly into the aquatic systems is not permitted. Flowback water requires extensive treatment at
specialized treatment facilities to meet Pennsylvania discharge regulations. Due to the high
quantities of flowback produced in Pennsylvania, 4 million gpd (15 million Lpd), a more
efficient and cost effective disposal method is needed. Land-based disposal of flowback waters
could potentially meet this need.
Feasibility of land-based disposal of flowback in Pennsylvania was evaluated specifically
focusing on the effects on soil saturated hydraulic conductivity (Ksat) and leaching of selected
flowback components (Ba, Cd, Pb, Se, Sr, and Cl) through 66 cm soil cores collected from an
area mapped as the Morrison soil series. The soil Ksat was estimated in-situ at the soil collection
location with double-ringed infiltrometers and in the laboratory column leaching experiments.
Leachate samples (100 mL) were collected from soil columns until one pore volume (~1,000
mL) had leached. Leachate concentrations of Ba, Cd, Pb, Se, Sr, and Cl were evaluated by the
PSU Agricultural Analytical Services Laboratory and compared to federal drinking water
standards and EPA lifetime advisory levels.
The flowback water collected from an active well pad in SW Pennsylvania was
characterized by very high salinity (EC = 87.7 dS/m), sodicity (SAR=68.8 (meq/L)0.5), and
extremely high TDS (219,000 ppm). Chloride (141,000 mg/L) was a major contributor to the

vi
high TDS level. Elevated Ba and Sr concentrations were comparable to values reported in the
literature for other flowback waters.
The Ksat values measured using flowback were not significantly different (α=0.05) from
those determined for a 0.05 M CaCl2 solution in both the field infiltrometer and laboratory
column leaching experiments. Results therefore indicate that flowback water will not likely
impact the hydraulic capacity of the soil if applied directly to the land surface as a disposal
method.
Application of flowback water to soil columns resulted in leachate concentrations of Ba,
Cd, and Pb that significantly exceeded Federal Drinking Water Standards. Leachate Sr levels
were far in excess of the EPA Drinking Water Lifetime Advisory Level of 4 mg/L. The Ba and
Sr leachate concentrations increased progressively as more flowback was applied to the soil
columns so that the leachate concentrations were equal to the initial flowback concentrations of
Ba and Sr. Based on the estimated total soil cation exchange capacity, it is likely that the
extremely high content of cations in the flowback quickly saturated all available exchange sites
in the column soils.
Equilibrium calculations based on tabulated thermodynamic stability constants suggest
that high Cl- in the flowback enhanced leaching of Cd and Pb by forming non-adsorbing
complexes with these metals. Some leachate Cd and Pb concentrations were higher than levels in
the flowback water applied to the soil columns, implying that the high Cl- in the flowback water
was mobilizing Cd and Pb from the soil itself.
Results indicate that direct application of flowback water will not initially have a
negative impact on the hydraulic capacity of the Morrison soil used in this study. However, the
presence of Ba, Cd and Pb at levels above drinking water standards in soil column leachates
suggest land application of flowback water potentially represents a groundwater pollution risk.
Further investigation is needed under a variety of soil, flowback water, and vegetation conditions
for a more comprehensive evaluation of the feasibility of land-based disposal of flowback waters
generated in hydrofracturing operations.

Table of Contents
Chapter 1: Introduction and Justification ........................................................................................ 1
Chapter 2: Literature Synthesis ....................................................................................................... 4
2.1 Introduction/Background ...................................................................................................... 4
2.2 Hydraulic Fracturing ............................................................................................................. 4
2.3 Flowback Composition ......................................................................................................... 6
2.4 Environmental Effects ........................................................................................................... 8
2.5 Regulation ........................................................................................................................... 10
2.6 Treatment Methods ............................................................................................................. 11
2.7 Disposal Methods ................................................................................................................ 12
2.8 Land Application ................................................................................................................. 13
2.9 State of the Art .................................................................................................................... 15
Chapter 3: Goal, Objectives, and Hypotheses .............................................................................. 16
3.1 Introduction ......................................................................................................................... 16
3.2 Goal Statement .................................................................................................................... 16
3.3 Hypotheses .......................................................................................................................... 17
Chapter 4: Methodology ............................................................................................................... 18
Overview ................................................................................................................................... 18
4.1 Sample Collection ............................................................................................................... 19
4.1.1 Collection Site Description ........................................................................................... 19
4.1.2 Flowback Sample Collection Procedure ....................................................................... 19
4.1.3 Soil Sample Collection Procedure ................................................................................ 19
4.1.4 Determination of Constituent Concentrations .............................................................. 20
4.2 Flowback Leaching Experiments ........................................................................................ 20
4.2.1 Experiment Plan ........................................................................................................... 20
4.2.2 Hydraulic Conductivity Determination ........................................................................ 21
4.2.3 Leaching Experiments .................................................................................................. 23
4.2.4 Post Percolation Sample Collection Procedure ............................................................ 25
4.2.5 Statistical Analysis ....................................................................................................... 26

4.2.6 Flowback Characterization .................................................................................................. 26
4.3 Analysis of Flowback Characterization and Influence on Hydraulic Conductivity ............... 27
4.3.1 Qualitative Analysis of Flowback Characterization ............................................................ 27
4.3.2 Statistical Analysis ............................................................................................................... 27
4.4 Hypothesis Testing.................................................................................................................. 27
4.4.1 Specific Hypotheses Evaluated ............................................................................................ 27
Chapter 5: Results and Discussion ................................................................................................ 28
5.1 Flowback Characterization ..................................................................................................... 28
5.2 Effect of Flowback Application on Saturated Hydraulic Conductivity of the Soil ................ 28
5.3 Statistical Analysis of the Effect of Flowback Application to Hydraulic Conductivity of Soil
....................................................................................................................................................... 31
5.4 Leaching Experiment Results ................................................................................................. 33
5.5 Potential Causes of Elevated Metal Leachate Concentrations ................................................ 35
5.6 Statistical Analysis of Metal Concentrations from Leaching Experiments ............................ 38
Chapter 6: Conclusion................................................................................................................... 40
6.1 Major Findings ........................................................................................................................ 40
6.2 Future Research Areas ............................................................................................................ 41
References ..................................................................................................................................... 42
Appendix A: Ksat and Flowback Characterization Data .............................................................. 45
Appendix B: PSU AASL Flowback and Soil Analyses................................................................ 52

v
List of Figures
Figure 4-1 Ten mile (16.09 km) Radius Circles to Determine Dominant Soil Series ....... 19
Figure 4-2 Double-ring Infiltrometer ................................................................................. 22
Figure 4-3 eTape Water Level Sensor ............................................................................... 23
Figure 4-4 Leaching Columns ........................................................................................... 23
Figure 4-5 PVC Grate/Soil Core Interface ........................................................................ 23
Figure 4-6 Inserted 4” Soil Core Tube ............................................................................... 24
Figure 4-7 Leaching Column in Position ........................................................................... 24
Figure 4-8 Crock Pot and Hot Plate ................................................................................... 24
Figure 4-9 Sealed Column to 1” of Soil Surface ............................................................... 24
Figure 4-10 HDPE Collection Containers with Funnel ..................................................... 26
Figure 5-1 SAR vs EC Relationship Effect on Infiltration ................................................ 30
Figure 5-2 Control Column Ba Concentration .................................................................. 34
Figure 5-3 Control Column Cd Concentration .................................................................. 34
Figure 5-4 Control Column Pb Concentration ................................................................... 34
Figure 5-5 Control Column Sr Concentration ................................................................... 35
Figure 5-6 Test Column Ba Concentration ........................................................................ 34
Figure 5-7 Test Column Cd Concentration ........................................................................ 34
Figure 5-8 Test Column Pb Concentration ........................................................................ 34
Figure 5-9 Test Column Sr Concentration ......................................................................... 35
Figure 5-10 Pb Speciation vs pCl ...................................................................................... 36
Figure 5-11 Cd Speciation vs pCl ...................................................................................... 36
Figure A-1 Double-ring Infiltrometer Scatter Plots ........................................................... 47
iv
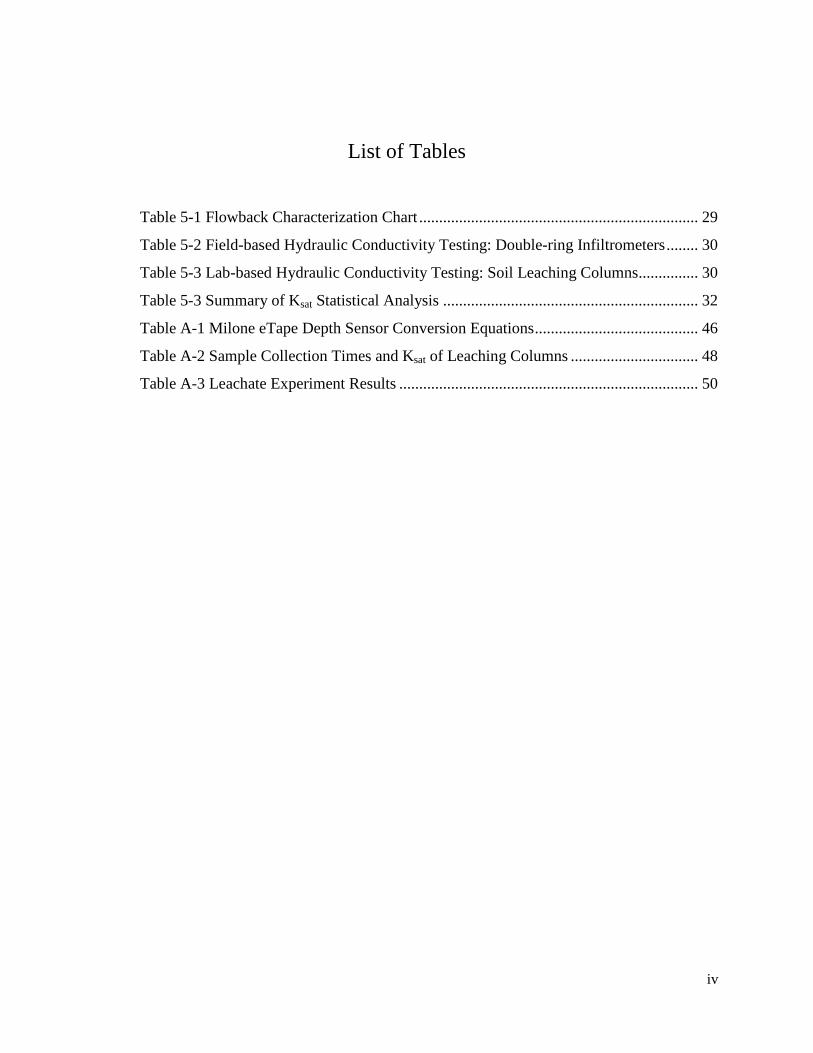
List of Tables
Table 5-1 Flowback Characterization Chart ...................................................................... 29
Table 5-2 Field-based Hydraulic Conductivity Testing: Double-ring Infiltrometers ........ 30
Table 5-3 Lab-based Hydraulic Conductivity Testing: Soil Leaching Columns ............... 30
Table 5-3 Summary of Ksat Statistical Analysis ................................................................ 32
Table A-1 Milone eTape Depth Sensor Conversion Equations ......................................... 46
Table A-2 Sample Collection Times and Ksat of Leaching Columns ................................ 48
Table A-3 Leachate Experiment Results ........................................................................... 50

1
Chapter 1: Introduction and Justification
The Marcellus Shale is a natural gas bearing geologic formation spanning from
southeastern New York, across Pennsylvania, western Ohio, and into northwest West Virginia.
The extraction of natural gas is enhanced through hydraulic fracturing, the pumping of water
under high pressure into the shale, fracturing the strata, thereby allowing gas to escape. Gas
returns to the surface under high pressure carrying with it brackish or brine water known as
flowback. The flowback contains many potentially harmful chemical constituents that render the
water unsuitable for discharge to the natural environment without substantial treatment. As a
result, drilling companies incur great cost disposing of the flowback. This study sought to
explore land-based application of flowback as a means of treatment and effective disposal.
Extensive natural gas exploration and extraction operations have begun to take place in
Pennsylvania and West Virginia over the past two to three years. Natural gas exploration and
extraction requires many resources, including environmental resources. Of the environmental
resources, water is the most utilized in the hydraulic fracturing of the shale. One to ten million
gallons of water are used to hydraulic fracture a single well. Of that 1-10 million gallons (4-38
million L) of water, 20-30% returns to the surface as flowback (Shramko et al., 2009). Flowback
contains heavy metals, radionuclides, high concentrations of salt, fracturing chemicals, and other
chemical constituents. With an increasing number of wells being hydraulically fractured each
year in Pennsylvania (active well sites are expected to exceed 2,243 sites by 2013), considerable
quantities (18.7 million gpd or 70 million Lpd) of water will be utilized and an associated large
volume of flowback produced (4 million gpd or 15 million Lpd) (Gaudlip et al., 2008).
Flowback is generally contaminated with fracturing chemicals and substances naturally
occurring in the shale strata. Fracturing fluids typically range from 1,000-10,000 ppm total
dissolved solids (TDS), while some flowback waters have had associated TDS concentrations of
150,000 ppm (Shramko et al., 2009). The TDS contaminants of most concern are sulfates,
chlorides, bromides, and proprietary fracturing chemicals. Some of these are potential
environmental contaminents and have been linked to adverse health effects, such as bladder
cancer and birthing complications. Due to these potentially harmful effects, flowback is not

2
permitted to be discharged directly into the environment in Pennsylvania. The Pennsylvania
Department of Environmental Protection (PaDEP), under the Clean Streams Law has set
regulations for the disposal of flowback into waters of the Commonwealth of Pennsylvania. As
of 1 January 2011, all new sources of high TDS wastewaters were prohibited from Pennsylvania
waters (PA Bulletin, 2009).
Initially, flowback was taken to wastewater treatment facilities for treatment and
subsequent discharge. The U.S. Environmental Protection Agency (EPA) and the Pennsylvania
Department of Environmental Protection (PaDEP) along with other agencies conducted a study
in response to increased TDS concentrations, chlorides and sulfides, to levels exceeding drinking
water standards in the major watersheds of the Commonwealth of Pennsylvania. The study
concluded that “new discharge,” that is a discharge that did not exist as of 1 April 2009 and
includes a TDS concentration in excess of 2,000 ppm or TDS loading exceeding 100,000 pounds
per day, must be treated to meet regulatory standards. Discharge must not exceed 500 mg/L of
TDS as a monthly average, 250 mg/L of total chlorides as a monthly average, and 250 mg/L of
total sulfates as a monthly average (PA Bulletin, 2009). Flowback is considered a “new
discharge” under this description. As such, wastewater treatment facilities (WWTF) must put in
place advanced treatment to meet regulatory standards if they are to be permitted to accept
flowback waters. Anticipated treatment costs are estimated to be $0.25 per gallon. Currently
there are no discharge limits at WWTFs for TDS, chlorides and sulfides. WWTFs that choose to
accept flowback for treatment must employ appropriate treatment measures to attain the
prescribed contaminant levels set by PaDEP and the EPA. Any cost would be an increase over
the existing cost. This additional cost would be reflected in the cost for treatment at WWTFs,
thereby having an economic impact (PA Bulletin, 2009).
The inability of drilling companies to dispose of flowback in Pennsylvania through
wastewater treatment facilities or deep-well injection due to unsuitable geology of the region and
the use of suitable geology for natural gas storage has forced companies to seek alternatives
(Hoffman, 2011). The most widely used alternative method of disposal is the transport of the
flowback out of state to specialized treatment facilities that practice via deep-well injection. Two
percent of flowback from the Marcellus shale is currently being transported by tanker trucks to
Ohio where it is deep-well injected (Murphy, 2013). To transport 1 million gallons (4 million L)
3
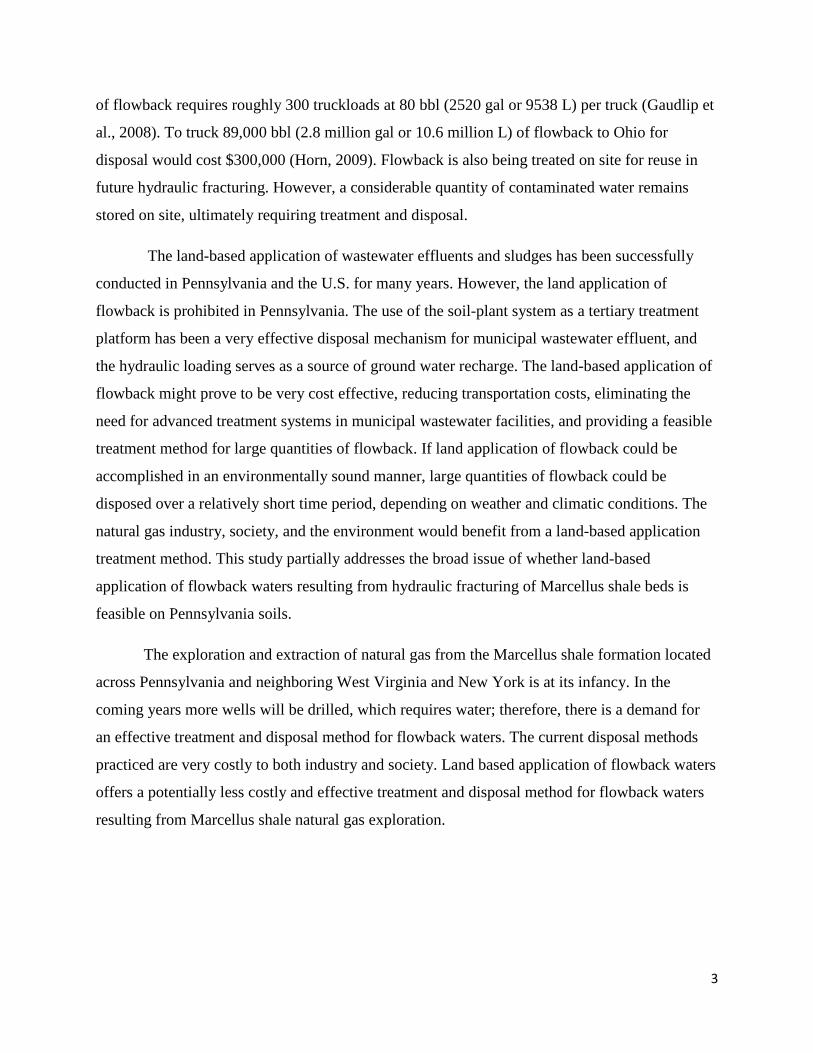
of flowback requires roughly 300 truckloads at 80 bbl (2520 gal or 9538 L) per truck (Gaudlip et
al., 2008). To truck 89,000 bbl (2.8 million gal or 10.6 million L) of flowback to Ohio for
disposal would cost $300,000 (Horn, 2009). Flowback is also being treated on site for reuse in
future hydraulic fracturing. However, a considerable quantity of contaminated water remains
stored on site, ultimately requiring treatment and disposal.
The land-based application of wastewater effluents and sludges has been successfully
conducted in Pennsylvania and the U.S. for many years. However, the land application of
flowback is prohibited in Pennsylvania. The use of the soil-plant system as a tertiary treatment
platform has been a very effective disposal mechanism for municipal wastewater effluent, and
the hydraulic loading serves as a source of ground water recharge. The land-based application of
flowback might prove to be very cost effective, reducing transportation costs, eliminating the
need for advanced treatment systems in municipal wastewater facilities, and providing a feasible
treatment method for large quantities of flowback. If land application of flowback could be
accomplished in an environmentally sound manner, large quantities of flowback could be
disposed over a relatively short time period, depending on weather and climatic conditions. The
natural gas industry, society, and the environment would benefit from a land-based application
treatment method. This study partially addresses the broad issue of whether land-based
application of flowback waters resulting from hydraulic fracturing of Marcellus shale beds is
feasible on Pennsylvania soils.
The exploration and extraction of natural gas from the Marcellus shale formation located
across Pennsylvania and neighboring West Virginia and New York is at its infancy. In the
coming years more wells will be drilled, which requires water; therefore, there is a demand for
an effective treatment and disposal method for flowback waters. The current disposal methods
practiced are very costly to both industry and society. Land based application of flowback waters
offers a potentially less costly and effective treatment and disposal method for flowback waters
resulting from Marcellus shale natural gas exploration.

4
Chapter 2: Literature Synthesis
2.1 Introduction/Background
The Marcellus shale is a natural gas bearing geologic formation containing an estimated
50 trillion cubic feet (1.4 trillion m3) of recoverable natural gas (PaDEP, 2010). The
development of unconventional drilling practices, horizontal drilling and hydraulic fracturing,
has made it possible to develop Marcellus shale gas (Shramko et al., 2009). Hydraulic fracturing
is the primary method through which shale gas is extracted. Four to six million gallons (15-23
million L) of water is used in the hydraulic fracturing process of each well. A portion of that
water, termed flowback, returns to the surface as brackish water high in TDS and containing
fracturing chemicals. The flowback that cannot be reused in the future fracturing processes is
considered a waste product and requires disposal. However, with very few disposal and
treatment facilities located in the Pennsylvania, much of the flowback is transported out-of-state
at considerable costs. An efficient cost effective disposal method is sorely needed. Land-based
application of flowback water is one disposal option, allowed in some states (Adams, 2011), that
has received limited investigation.
The information and science surrounding Marcellus shale natural gas development is
extensive. This study is focused on the feasibility of land-based disposal to accommodate the
large volumes of flowback associated with hydraulic fracturing. The process of hydraulic
fracturing, flowback composition, environmental effects of flowback, regulation surrounding
flowback treatment and disposal, treatment methods, disposal methods, land application of
flowback, and the current state of the technology will be covered in the following sections as
background for this study.
2.2 Hydraulic Fracturing
Hydraulic fracturing is a conventional well stimulation technique used to enhance the
production efficiency of shale gas wells. Hydraulic fracturing technology has been developed
and used extensively over the past 15 years in coal bed methane and shale gas extraction (EPA,
2004).

5
The hydraulic fracturing process starts with a production well being drilled into the target
shale formation. Water mixed with fracturing chemicals to form a fracturing solution is injected
into the shale via the well bore at an increasing rate and pressure (EPA, 2004). As voids in the
shale fill with fracturing fluids and can no longer accommodate the increasing volume of
fracturing solution, pressure increases to the point where the shale fractures. These fractures act
as conduits through which gas travels to the well bore and then to the surface. The hydraulic
fracturing process may be repeated several times at a particular well site (EPA, 2004).
There are four main types of fracturing fluids: gelled fluids, foamed gels, plain water and
KCl water, and acids. Fracturing fluids are characterized by their ability to be viscous enough to
create fractures of adequate width, maximize fluid travel distance, transport large quantities of
proppant into the fracture, and require minimal gelling agent to allow for easier degradation and
reduced cost. Fluid additives are also used to enhance the performance and efficiency of the
fracturing process. The major categories of fluid additives include breakers, biocides, fluid-loss
additives, friction reducers, and acid corrosion inhibitors. Some of the fracturing fluids and fluid
additives contain constituents of potential human health effects and well as environmental
impact. However, these fluids are heavily diluted prior to injection and the impacts to human
health and the environment are not well documented by literature (EPA, 2004).
The quantities of water used in the fracturing process are considerable. The EPA
estimates that 2-5 million gallons of water are needed to fracture a single gas well, depending on
depth, horizontal distance and the number of times the well is fractured (Rahm, 2011). Fifteen to
eighty percent of the water volume used in the fracturing process returns to the surface as
flowback (Rahm, 2011) in the first 3 weeks following hydraulic fracturing (Shramko et al.,
2009). After this initial period, water returned to the surface is called “produced” water.
A survey conducted by Appalachian Shale Water Conservation Management Committee
(ASWCMC) estimated the growth in drilling rig activity will increase from 64 rigs drilling and
fracturing 857 wells in 2009, to 171 rigs drilling and fracturing 2,243 wells in 2013. The daily
water consumption of drilling and fracturing activities is estimated to increase from 6.1 million
gallons per day (gpd) (23 million Lpd) to 18.7 million gpd (71 million Lpd) over the same period
of time. Hydraulic fracturing accounts for 95% of that estimated water consumption. The amount
6
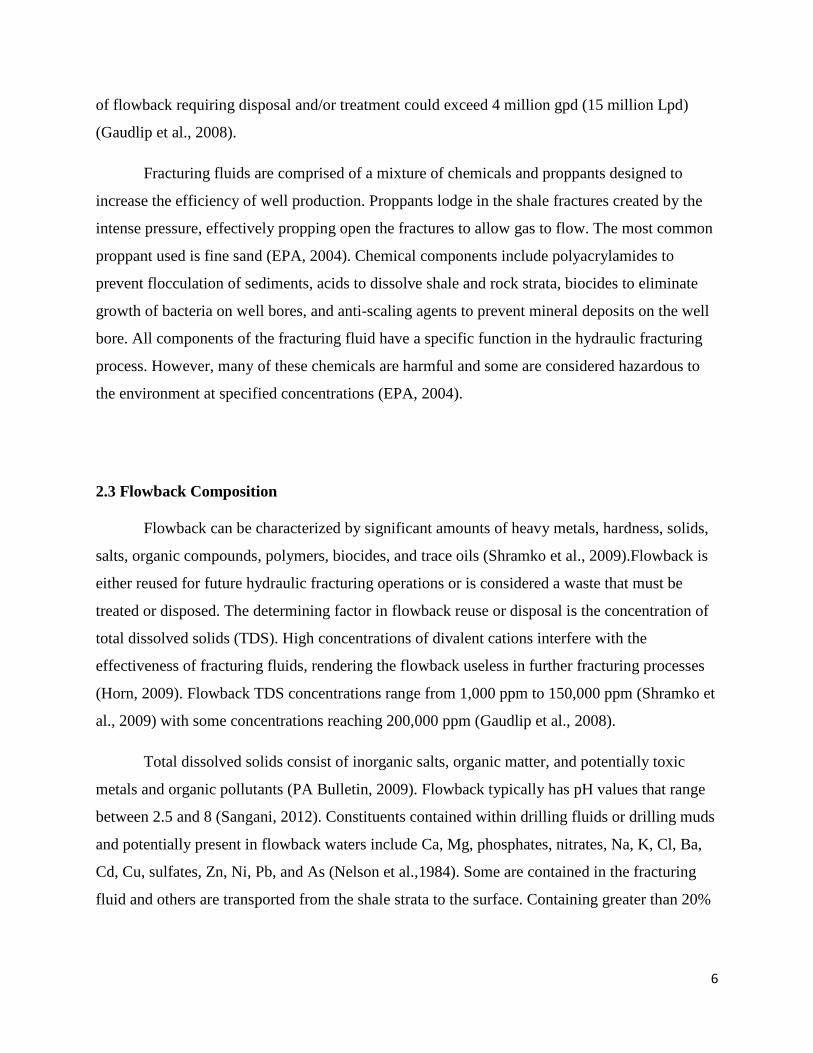
of flowback requiring disposal and/or treatment could exceed 4 million gpd (15 million Lpd)
(Gaudlip et al., 2008).
Fracturing fluids are comprised of a mixture of chemicals and proppants designed to
increase the efficiency of well production. Proppants lodge in the shale fractures created by the
intense pressure, effectively propping open the fractures to allow gas to flow. The most common
proppant used is fine sand (EPA, 2004). Chemical components include polyacrylamides to
prevent flocculation of sediments, acids to dissolve shale and rock strata, biocides to eliminate
growth of bacteria on well bores, and anti-scaling agents to prevent mineral deposits on the well
bore. All components of the fracturing fluid have a specific function in the hydraulic fracturing
process. However, many of these chemicals are harmful and some are considered hazardous to
the environment at specified concentrations (EPA, 2004).
2.3 Flowback Composition
Flowback can be characterized by significant amounts of heavy metals, hardness, solids,
salts, organic compounds, polymers, biocides, and trace oils (Shramko et al., 2009).Flowback is
either reused for future hydraulic fracturing operations or is considered a waste that must be
treated or disposed. The determining factor in flowback reuse or disposal is the concentration of
total dissolved solids (TDS). High concentrations of divalent cations interfere with the
effectiveness of fracturing fluids, rendering the flowback useless in further fracturing processes
(Horn, 2009). Flowback TDS concentrations range from 1,000 ppm to 150,000 ppm (Shramko et
al., 2009) with some concentrations reaching 200,000 ppm (Gaudlip et al., 2008).
Total dissolved solids consist of inorganic salts, organic matter, and potentially toxic
metals and organic pollutants (PA Bulletin, 2009). Flowback typically has pH values that range
between 2.5 and 8 (Sangani, 2012). Constituents contained within drilling fluids or drilling muds
and potentially present in flowback waters include Ca, Mg, phosphates, nitrates, Na, K, Cl, Ba,
Cd, Cu, sulfates, Zn, Ni, Pb, and As (Nelson et al.,1984). Some are contained in the fracturing
fluid and others are transported from the shale strata to the surface. Containing greater than 20%

7
salt content in extreme cases, flowback is highly saline and is termed brine while in storage tanks
or lagoons (Gaudlip et al., 2008).
Due to the presence of Cl in brine waters complexation of Pb and Cd in soils has caused
the increased mobility and leaching potential of these elements, posing potential water
contamination issues (DeWalle and Galeone, 1990). Specific constituents of TDS that have
potentially detrimental impacts on vegetation are Na and Cl (Bates, 1988).
Flowback water as well as drill cuttings contain naturally occurring radioactive materials
(NORM) that is present in gas-bearing shale formations. Naturally occurring radioactive
materials are natural substances that exist in all natural media: soils, rocks, water and air. The
Marcellus shale primarily contains radioactive materials 238U, 40K, and 232Th. Radioactivity
readings of 0.1 mR/hr or greater have not been recorded in the Marcellus shale, but have been
recorded extensively in the Barnett shale that underlies northern Texas. These primary
radioactive isotopes have half-lives of over a billion years and consequently not highly
radioactive in nature. Uranium and thorium are relatively insoluble and bound to soil and rock,
making them less likely to in high concentrations in fracturing fluids after reaching the surface.
However both 238U and 232Th, degrade in to more soluble radioactive isotopes 226Ra and 228Ra. 226Ra has a half-life of 1,600 years, as compared to the 5.75 year half-life of 228Ra, making it the
primary radioisotope of concern in the Marcellus shale. Due to their solubility over longer time
periods, 226Ra and 228Ra have a greater chance of being concentrated in brine contained within
the shale strata and transported back to the surface with fracturing fluids. Flowback water does
not initially contain high concentrations of NORM, but concentrations have the tendency to
increase over time as more brine is extracted (Auer Perry and PRI Marcellus Shale Team, 2011).

8
2.4 Environmental Effects
All drilling operations have some environmental impact. The significance of that impact
depends on the nature of the operation and associated wastes. Hydraulic fracturing and flowback
have known environmental hazards as well as potentially future environmental implications.
Drilling operations have a substantial land impact. Drilling pads alone demand on
average a 2.2 ha land area. Roadways, pipe lines, and power lines all have a land area
requirement. It is estimated that 12 ha are disturbed for every pad constructed. Shale-gas
development could impact 180,000 ha, with between 6,000-15,000 pads. That is area similar in
extent to Pennsylvania’s abandoned surface mine sites (Drohan et al., 2012). In some areas wells
are placed systematically on a grid system. Forest fragmentation has resulted, and the impact on
native species is of great concern. Forest fragmentation also has an impact on the sustainability
classification of the forestland. The classification has an economic impact due to the demand for
sustainably managed forest land by the lumber industry. In Pennsylvania, 45-62% of well pads
have been constructed on agricultural lands and 38-54% on forest lands. Twenty-four percent of
the pads built on forest land were in areas considered core forest habitat; more than 100 m from
the preexisting edge. The disruption of core forest habitat and subsequent fragmentation has
caused the relocation of birds among others species (Drohan et al., 2012).
Hydraulic fracturing utilizes 2-5 million gallons (7.5-19 million L) of water to fracture a
single well (Rahm, 2011). Surface waters, streams, rivers, and lakes supply 60-70% of the water
to natural gas extraction and exploration operations (Gaudlip et al., 2008). With the water
consumption of drilling operations expected to increase to 18.7 million gpd (71 million Lpd) by
2013, potential stress to aquatic ecosystems and drinking water supplies could result. Ground
water drinking water supplies could potentially be diminished as well (Gaudlip et al., 2008).
Hydraulic fracturing also has potential to contaminate groundwater. In order to reach
shale gas in the Marcellus formation, well bores must extend through ground water aquifers
(EPA, 2004). Drilling companies take precautionary measures to protect ground water supplies
by sealing well casings within the aquifer zone. Preventative measures may be put in place, but
risk of failure is associated with any engineered process. Failure in the drilling process is termed

9
a blowout. Blowouts occur when pressures within the well bore cause the casing to rupture,
thereby discharging production water or flowback into the surrounding soil strata or land area.
The chemical nature of flowback encourages the mobility of otherwise immobile heavy
metals. Two elements of concern are Pb and Cd. Flowback typically contains high
concentrations of Cl which can complex these metals and increase their mobility in the soil
profile (DeWalle and Galeone, 1990). The leaching of these elements in soil water, and
potentially ground water, potentially poses a threat to drinking water quality.
Flowback is characteristic of having TDS concentrations reaching as high as 200,000
ppm (20% salt content) (Gaudlip et al., 2008). High sodium wastewater will create a sodic layer
or crust on the soil surface, ultimately affecting infiltration and potentially increasing the depth
of the sodic layer in the soil profile (Hamilton and Elliott, 1991). Excessive Na+ causes clays to
swell, reducing the infiltration capacity of the soil. With permeability decreased, water cannot
infiltrate to the rooting zone to support plant growth. Impermeability of the soil also inhibits the
exchange of gases throughout the soil profile resulting in the soil being less aerated (Hamilton
and Elliott, 1991). The lack of water sufficient for plant growth and reduced gas exchange
greatly impairs plant growth and in some cases prevents all vegetative cover.
The documented impacts of flowback on vegetation following land application are
variable. In a recent study, Adams (2011) investigated application of hydrofracturing fluids to a
deciduous forest stand in West Virginia. Application was observed to cause browning and
wilting foliage, leaf scorch, curling, and defoliation (Adams, 2011). Ground vegetation that has
received large volumes of flowback experienced 100% mortality in 2-3 days. In the following 7-
10 days, overstory trees began to show damage. Months after exposure, 51% of the trees had no
foliage and two years post exposure, 56% of all trees had died (Adams, 2011).
Vegetation exposed to managed applications of spent drilling mud showed different
results. Minimal effects on native vegetation were observed. The number of individuals of
certain plant species were reduced but not completely eliminated. Some species showed an
increased or no change in the number of individuals (Zvomuya et al., 2011). The Zn, Cu, Cd, Ni,
Pb, and As contained within drilling fluids were available for plant uptake. The plant uptake of
these elements was proportional to the concentration found in drilling fluids waters (Nelson et

10
al., 1984). Changes in plant tissue chemistry were not associated with changes in biomass or
species composition (Zvomuya et al., 2011).
2.5 Regulation
In response to the potential environmental issues associated with hydrofracking,
standards have been promulgated. These regulatory measures focus on the treatment and disposal
methods of flowback waters.
Under the Federal Safe Drinking Water Act, disposal of flowback via deep well injection
is governed by the Underground Injection Control Program (UIC). The UIC has regulatory
control over the injection of flowback into Class I and Class II injection wells. Class I injection
wells are usually reserved for hazardous wastes and non-hazardous industrial liquids beneath the
lowest underground sources of drinking water (EPA, 2012). Class II injection wells are reserved
for brines and fluids associated with oil and natural gas production operations (EPA, 2010).
Regulatory controls seeks to ensure that injected flowback waters remain confined in the
injection zone in a manner that does not risk contamination of potential and current sources of
drinking water (Gaudlip et al., 2008).
Flowback is also regulated under the Clean Water Act’s (CWA) National Pollution
Discharge Elimination System (NPDES). The CWA states that no discharge to waters of the U.S.
can occur without a NPDES permit. NPDES permits are issued by the state of Pennsylvania
pursuant to specific regulations regarding acceptable contaminate discharge levels.
Responsibility then falls on the WWTFs to meet treatment requirements to achieve NPDES
regulations. EPA is the approval authority for pretreatment of flowback waters before treatment
by WWTFs (Hanlon, 2011).
The PaDEP, under The Clean Streams Law, has the authority to adopt rules and
regulations pertaining to the quality of the waters of the Commonwealth. Under this law
flowback is considered a “new discharge,” that is a discharge of high-TDS wastewater that did
not exist prior to 1 April 2009, and applies to any case where a TDS concentration exceeding
2,000 mg/L or a TDS loading rate that exceeds 100,000 lbs/day. The new discharge designation
11
also extends to an expanded or an increased discharge prior to the 1 April 2009 date (PA
Bulletin, 2009).
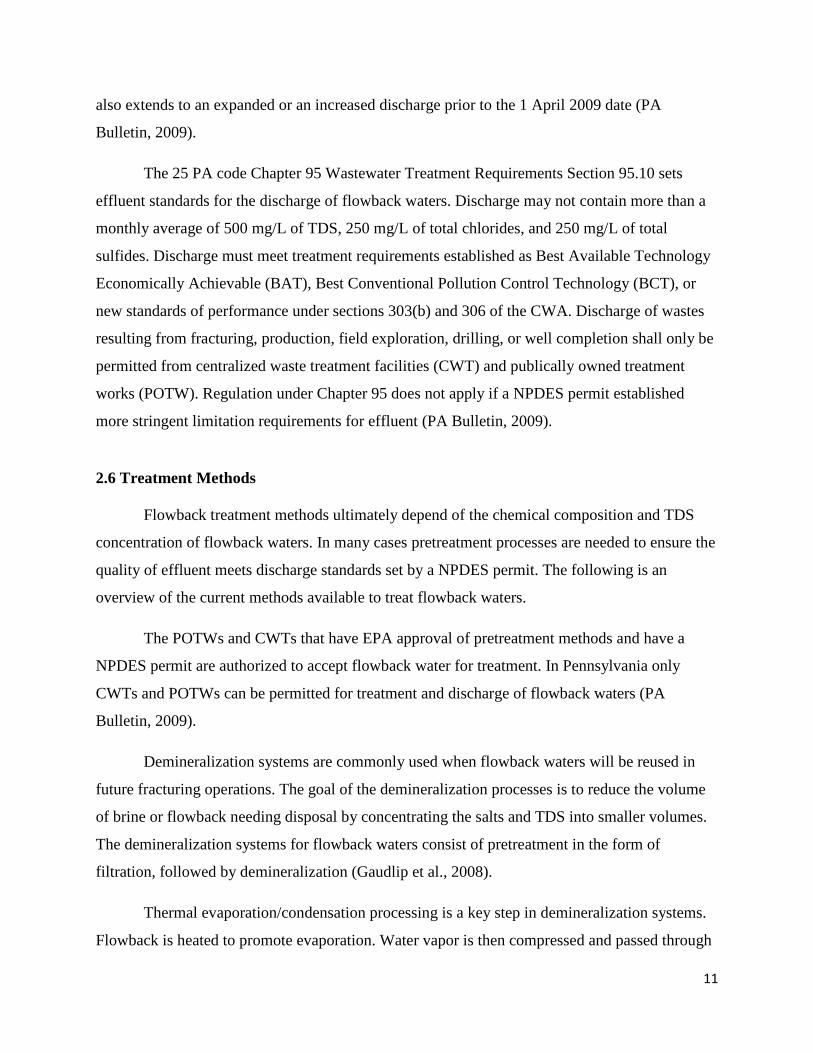
The 25 PA code Chapter 95 Wastewater Treatment Requirements Section 95.10 sets
effluent standards for the discharge of flowback waters. Discharge may not contain more than a
monthly average of 500 mg/L of TDS, 250 mg/L of total chlorides, and 250 mg/L of total
sulfides. Discharge must meet treatment requirements established as Best Available Technology
Economically Achievable (BAT), Best Conventional Pollution Control Technology (BCT), or
new standards of performance under sections 303(b) and 306 of the CWA. Discharge of wastes
resulting from fracturing, production, field exploration, drilling, or well completion shall only be
permitted from centralized waste treatment facilities (CWT) and publically owned treatment
works (POTW). Regulation under Chapter 95 does not apply if a NPDES permit established
more stringent limitation requirements for effluent (PA Bulletin, 2009).
2.6 Treatment Methods
Flowback treatment methods ultimately depend of the chemical composition and TDS
concentration of flowback waters. In many cases pretreatment processes are needed to ensure the
quality of effluent meets discharge standards set by a NPDES permit. The following is an
overview of the current methods available to treat flowback waters.
The POTWs and CWTs that have EPA approval of pretreatment methods and have a
NPDES permit are authorized to accept flowback water for treatment. In Pennsylvania only
CWTs and POTWs can be permitted for treatment and discharge of flowback waters (PA
Bulletin, 2009).
Demineralization systems are commonly used when flowback waters will be reused in
future fracturing operations. The goal of the demineralization processes is to reduce the volume
of brine or flowback needing disposal by concentrating the salts and TDS into smaller volumes.
The demineralization systems for flowback waters consist of pretreatment in the form of
filtration, followed by demineralization (Gaudlip et al., 2008).
Thermal evaporation/condensation processing is a key step in demineralization systems.
Flowback is heated to promote evaporation. Water vapor is then compressed and passed through

12
a heat exchanger that transfers the heat from the water vapor to the liquid flowback to promote
evaporation. Flowback with TDS concentrations of 75,000 ppm had a water recovery efficiency
of 70% with a 4:1 reduction in flowback volume. The maximum TDS concentration for thermal
evaporation/condensation systems is approximately 150,000 ppm. Flowback of this TDS
concentration experiences 2:1 reduction in flowback volume and a 50% water recovery
efficiency. Problems of fouling, scaling, and corrosion are associated with the formation of
precipitates from the flowback solution that impede treatment processes. However, these
problems will be reduced as technologies in surface coatings and system designs improve
(Gaudlip et al., 2008).
Reverse osmosis (RO) is a treatment process that uses high pressures to force flowback
through membranes that allow water to pass but retains dissolved constituents and is a well-
establish and proven technology in various industries (Horn, 2009). Under ideal conditions RO
systems are capable of treating flowback waters of concentrations up to 40,000 mg/L. Due to
high-TDS concentrations of flowback, membranes of RO systems become clogged over short
periods of time. Extensive pretreatment is necessary to reduce TDS concentrations to levels
appropriate for RO treatment (Gaudlip et al., 2008).
Ozone treatment has been proposed as a method to increase the removal of soluble
organics, oils, greases, and heavy metals when used in combination with the previously-
mentioned treatment practices (Horn, 2009). As much as 80% of organic constituents were
removed through oxidation, and many heavy metals were oxidized and easily removed via
filtration in laboratory trials. Further studies are being conducted in the field to determine
efficiency and effectiveness of ozone treatment (Gaudlip et al., 2008).
2.7 Disposal Methods
Disposal methods for flowback are very limited due to the potential harm flowback can
cause if discharged without treatment to the natural environment. Regulations of disposal
methods seek to protect the environment and valuable water resources. The current disposal
method utilized extensively by the gas drilling industry is deep well injection.

13
NPDES permitted CWTs and POTWs are the only facilities authorized to discharge
flowback effluent to surface waters. Treatment facilities that accept flowback have advanced
treatment regiments to handle high-TDS waters. High-TDS concentrations of flowback water
cannot be properly removed by current WWTFs. The TDS and varying pH, 2.5-8 (Sangani,
2012), of flowback interfere with the facility’s ability to properly treat wastewater to meet
discharge standards (Gaudlip et al., 2008).
Underground deep well injection (UDI) via Class I and II injection wells is currently the
most common and widely used means of disposal for flowback. There are currently 8 Class II
injection wells permitted for disposal of flowback by the UIC in Pennsylvania. There are two
types of Class II disposal wells that are associated with oil and gas disposal and injection of
flowback. Enhanced recovery wells inject flowback as a means of recovering residual oil from
natural gas. Enhanced recovery well injection is referred to as secondary or tertiary recovery.
Enhanced recovery wells make up 80% of the Class II injection wells. For disposal wells,
flowback and drilling wastes are injected as a storage disposal method. Flowback and other gas
production wastes are injected into the same geologic formation used for production or a similar
formation. Pennsylvania has a limited capacity to dispose of flowback via UDI due to the lack of
infrastructure to support such practices and the best geology for UDI is being used for gas
storage (Hoffman, 2011). Therefore, flowback must be transported to appropriate areas for
injection. Disposal wells make up 20% of the Class II injection wells. Oil and gas production
wastes can only be injected into Class II injection wells (EPA, 2010). These wells have average
injection rates of less than 1,000 barrels per day (bpd), which is only a fraction of the potentially
95,000 bpd of flowback requiring disposal (Gaudlip et al., 2008).
2.8 Land Application
Flowback may be land applied as a method of disposal (Rahm, 2011). Currently land
application of flowback is prohibited in Pennsylvania. Land application of hydraulic fracturing
fluids is permitted in other gas-producing states such as Colorado, Arkansas, and West Virginia
(Adams, 2011). Studies have shown that land application of drilling muds, cuttings, and wastes
associated with natural gas production can be accomplished at minimal or no impact to the
environment, if the application is properly managed and administered. Land application of

14
flowback has been used as a method of disposal and tertiary treatment in Alberta, Canada and
other gas producing states in the U.S. for several years (Alberta Environment, 2009).
Land spraying while drilling (LWD) is a widely used disposal method for water-based
drilling muds in western Canada (Zvomuya et al., 2011). LWD applies water-based drilling muds
at rates of 40 m3/ha in the summer and 20 m3/ha in the winter or on frozen ground. Loadings
from solids must not exceed 6 Mg/ha total. The applied concentrations had no significant impact
on most native vegetation (Zvomuya et al., 2011).
Land application of drilling fluids to agricultural lands, or land farming, showed similar
impacts on agricultural crops as on native vegetation. Depressed growth of chard, rye grass,
beans, and corn were observed (Bates, 1988). Land farming of drilling fluids in Oklahoma
showed no effects on soil productivity, the capacity of the soil to support healthy plant growth
with maintaining the quality of the soil to support future use, in some cases productivity was
improved due to the presence of trace mineral content in the fluids (Bates, 1988).
Forest land disposal of brine is also expanding but is not widely practiced. Brine applied
to forest lands had no significant effect on ground vegetation at loading rates of 1.52, 0.69, and
0.17 kg/m2 when applied early in the dormant season (DeWalle and Galeone, 1990). The time of
application allowed sufficient time for leaching of contaminants from the rooting zone. The
leaching of chlorides from the soil and managed flowback application kept the salinity low
enough to allow for the survival of ground vegetation. Concentrations of contaminants contained
within soil macropore water declined as a result of leaching. It was determined that the natural
precipitation of Pennsylvania would provide adequate leaching of contaminants from the rooting
zone and dilute applied chlorides to safe drinking water levels (DeWalle and Galeone, 1990).
Salination and associated impacts of high salt content are controlled by balancing salts contained
within wastes with the leaching capabilities of the soil from annual rainfall (Hamilton and Elliott,
1991).
Land-based disposal of flowback has great appeal amongst drilling companies due to the
potential to reduce transportation and treatment costs (Clements et al., 2010). Land-based
disposal avoids transportation costs in hauling flowback long distances to disposal sites, while
naturally filtering flowback waters through soil and vegetation. Land-based disposal also

15
eliminates the need for extensive storage lagoons on drilling pads, in turn reducing the land
footprint of drilling activities (Zvomuya et al., 2011).
2.9 State of the Art
There are many technologically advanced treatment and disposal methods from flowback
waters. The current treatment and disposal practices implemented by industry in Pennsylvania do
not have the capacity for handling the significantly large volumes of flowback needing treatment
or disposal. All methods have considerable costs associated as well. Land-based disposal of
flowback similar in methodology to the land-based disposal of wastewater effluent could
potentially provide a low cost method for disposal of large volumes of flowback with subsequent
soil treatment. To accomplish disposal of flowback waters through land application, the behavior
of fracturing chemicals within the soil profile must be evaluated, properly managed application
rates must be identified and employed, and design procedures are needed to determine land area
requirements based on flowback charateristics. Feasibility of the land-based disposal of flowback
waters in Pennsylvania must be determined before the disposal method can be promoted for use
within the state.

16
Chapter 3: Goal, Objectives, and Hypotheses
3.1 Introduction
While land application of fluids generated in the oil and gas industry has been long
practiced, there have been relatively few investigations of land-based disposal of flowback water
from hydrofracturing operations.
The current state-of-the-art of treatment and disposal methods for flowback waters lack
the capacity to treat large quantities of flowback readily, at reasonable cost to the industry, and at
locations in close proximity to drilling operations. Land-based disposal of flowback has the
potential to remedy the situation, providing an additional option for disposal of flowback waters
3.2 Goal Statement
The goal of this research was to contribute to the knowledge needed to make a
comprehensive evaluation of the feasibility of the land-based disposal of flowback resulting from
the hydraulic fracturing of gas wells in the Marcellus shale in Pennsylvania. Two specific issues
were addressed:
• Determine if flowback influences the hydraulic conductivity of a soil characteristic of the
Allegheny Plateau region of Pennsylvania.
• Using column leaching experiments, determine the extent to which selected elements (Cl,
Ba, Cd, Pb, Se, and Sr) are retained by the soil in the downward movement of flowback.
Ultimate feasibility of land-based disposal of flowback in Pennsylvania depends partially
on the concentrations of Cl, specific trace elements (Ba, Cd, Pb, Se, Sr), the sodium adsorption
ratio (SAR), and electrical conductivity (EC) of the flowback water. These constituents have the
potential to cause the harm and concern environmentally. The concentrations of these
constituents that enter the natural system could have a direct impact on water quality and the EC
and SAR of the flowback water could potentially impact soil permeability. Therefore, feasibility
will be dependent on the capacity of the soil to bind trace elements Ba, Cd, Pb, Se, and Sr and
allow flowback water to infiltrate the soil profile.

17
3.3 Hypotheses
Ho: Ksat of the soil does not vary significantly when infiltrating flowback water or 0.05 M
CaCl2 solution.
Ha: Ksat of the soil varies significantly when infiltrating flowback water or 0.05 M CaCl2
solution.
Ho: Concentrations of Ba, Cd, Pb and Sr emerging from a soil column loaded with flowback
water do not exceed federal drinking water standards or lifetime advisory levels.
Ha: Concentrations of Ba, Cd, Pb and Sr emerging from a soil column loaded with flowback
water do exceed federal drinking water standards or lifetime advisory levels.

18
Chapter 4: Methodology
Overview
The following methodology was performed to determine if the land-based disposal of
flowback is feasible in Pennsylvania with respect to select element concentrations, SAR, and EC
of the flowback water. The concentrations of Ba, Cd, Pb and Sr, hydraulic conductivities,
behavior of flowback in soil characteristic of potential drilling sites, and comparison of the
concentrations of Ba, Cd, Pb and Sr to drinking water standards and lifetime advisory levels
following percolation through the soil were evaluated.
Flowback samples were collected from an active drilling site and characterized for
selected chemical and elemental constituents. Samples were analyzed by the PSU Agricultural
Analytical Research Lab (AASL). The calculated SAR and measured saturated hydraulic
conductivity (Ksat) were used to characterize the effects flowback may have if applied on a
specific soil. Morrison soil, characteristic of the Allegheny Plateau, was collected and leaching
columns constructed to evaluate Ksat of flowback through the soil profile and the capability of the
soil to retain selected elements. Leachate samples (100 mL) were collected from each soil
column to determine the concentrations of heavy metals after percolation through the soil.
Appropriate statistical testing of the data was completed to test the hypotheses developed.
Conclusions drawn from hypothesis testing were interpreted in the context of the feasibility of
land-based disposal of flowback water in Pennsylvania.

19
4.1 Sample Collection
4.1.1 Collection Site Description
Soil samples were collected from the Morrison soil series which is characteristic of the
Marcellus Shale region located on the Allegheny Plateau. The Morrison soil series was selected
using ArcGIS 10.1 where a 10 mile (16.09 km) radius was drawn around all active well sites in
the Allegheny Plateau. SSURGO soil data was used to determine the most prevalent soil series
contained in the circle surrounding each site (Figure 4-1). The Morrison soil series was one of
the most prevalent soil series surrounding the well sites. Its prevalence in the State College, PA
area meant that cores of the Morrison soil could be obtained locally.
Figure 4-1 Ten mile (16.09 km) Radius Circles to Determine Dominant Soil Series
4.1.2 Flowback Sample Collection Procedure
Flowback samples were collected from containment lagoons or storage tanks by hand and
stored in commercial polyethylene drums. Two barrels, 84 gallons (318 L), of flowback was
collected from a single well site located in southwestern Pennsylvania.
4.1.3 Soil Sample Collection Procedure
Undisturbed soil samples were collected from the Morrison soil series, characteristic of
the Marcellus Shale region. Sixteen 3 inch (7.62 cm) diameter soil core samples were collected
20
from the sample area. Soil core samples were taken to a depth that included the A, B, and
possibly C horizon soils. Soil cores averaged (or were typically) 26 inch (66.04 cm) in depth.
Soil cores were collected through the use of a Giddings Sampler. The Giddings Sampler is
mounted on a farm tractor and used the tractor’s hydraulics to press the steel sampling core into
the soil. Each soil core is encased in a heavy plastic sleeve, which were inserted into the
sampling core prior to the soil sample being collected. Each core sample was capped at both ends
to minimize air exposure to maintain natural soil moisture. This method of sample collection
maintains in-situ soil bulk density, natural moisture content, and the soil structure.
4.1.4 Determination of Constituent Concentrations
Analysis of the flowback was provided by the PSU Agricultural Analytical Services
Laboratory (AASL). The turf grass test package was conducted on the collected flowback sample
and included the following parameters: pH, total alkalinity, bicarbonates, carbonates, residual
sodium carbonate, hardness, electrical conductivity, total dissolved solids, calcium, magnesium,
sodium, sodium adsorption ratio, chloride, boron, nitrate-nitrogen, ammonium-nitrogen,
phosphorus, potassium, sulfur, iron, manganese, copper, molybdenum, lead, and zinc were
evaluated through the lab testing. This initial testing provided the constituent concentrations of
the flowback water that was compared to the leachate samples. More detailed information
regarding the specific methodologies used for the chemical analyses performed can be found at
http://www.aasl.psu.edu/. Independently of AASL analyses, the EC of the flowback was
determined by an YSI Model 85 DO/EC meter.
4.2 Flowback Leaching Experiments
4.2.1 Experiment Plan
The average pore volume of the Morrison soil cores were calculated based on the
porosities associated with horizon and soil depth of pastured Morrison (Luo et al., 2010) and was
calculated to be 967 mL. For sampling convenience, one pore volume was assumed to be 1,000
mL. Flowback was applied to the 3 test columns and a soil solution of 0.05M CaCl2 was also

21
applied to a control column. Raw flowback was applied to the “test” columns and 0.05M CaCl2
was applied to the “control” columns. Post percolation samples were collected from the leachate
of the soil columns. Leachate was collected every 100 mL until one pore volume (1,000 mL) had
been leached through the soil columns or until the experiment was concluded. The time of
collection of each leachate sample was recorded. The 100 mL leachate samples were sent to the
PSU AASL for analysis of the concentrations of Cl, Ba, Cd, Pb, Se, and Sr. The saturated
hydraulic conductivity of the soil was evaluated using flowback and 0.05 M CaCl2. Barium, Cd,
Pb, Se and Sr leachate concentrations were compared to the initial flowback water composition
as well as Federal Drinking Water Standards and EPA Lifetime Advisory Levels. Hypotheses
were evaluated through statistical analysis and ultimate feasibility of land-based disposal of
flowback assessed.
Leaching experiments were conducted in the PSU Agricultural Engineering Bay located
in the Agricultural Engineering Building, University Park, PA.
4.2.2 Hydraulic Conductivity Determination
Saturated hydraulic conductivity ( Ksat) was determined via both double-ring infiltrometer
testing at the sampling sites and in controlled laboratory leaching experiments. The steady-state
infiltration rate was used as an approximation of the Ksat of the surface soil. The field based
double-ring infiltrometer tests were conducted at the location where the Morrison soil cores were
collected. Four controls infiltrating a 0.05M CaCl2 solution and four test columns infiltrating
synthetic flowback water were used. Because land application of flowback is not permitted in
Pennsylvania, a synthetic flowback was prepared using NaCl and CaCl2 in amounts necessary to
approximate the SAR, 69.47 (meq/L)0.5, and EC, 87.7 dS/m, of the actual flowback water. The
EC was determined using the 𝐸𝐶 �𝑑𝑆𝑚� =
𝑇𝐷𝑆 (𝑚𝑔𝐿 )
800 for high salinity samples (Porter and Marek,
2011).
Infiltrometers were constructed of SCH-40 PVC pipe. Each double-ring infiltrometer had
an inner ring diameter of 2 inches (5.08 cm) and an outer ring diameter of 4 inches (10.16 cm)
(Figure 4-2). Infiltrometers were seated into the soil to a depth of 0.5 inches (1.27 cm) using a
wood block and mallet to tap the rings to the specified depth. Great care was taken to not
compact the soil to a degree that would affect infiltration.

22
Figure 4-2 Double-ring Infiltrometer
Water depth was recorded every 5 sec by an automated data logger for 1.5 hr or until
steady state was achieved. The use of a Milone eTape ® water level sensor (Figure 4-3) was used
to measure the water depth in the inner ring over the testing period.
The infiltrometer data was used to estimate Ksat of the controls and test columns. The eTape
® water level sensors record the voltage that passed thru a resistor, with the voltage being
directly proportional to the depth of water. Equations found in Table A-1 were used to convert
the voltage measurements to water level depths. The difference in water depths was calculated
between the 5 sec recording intervals and converted to in/hr. The double-ring infiltrometer data
was plotted in graphs shown in Figure A-1. The cumulative depth vs. time was plotted in in/sec.
The relative slope of the line is determined to be the average Ksat. If the cumulative depth vs.
time plots exhibited irregular slope, the Ksat was assumed to be the overall average of the
infiltration rates. The average Ksat values of the controls and tests were then statistically
compared to determine if the application of flowback impacts the hydraulic conductivity of the
soil.

23
Figure 4-3 eTape ® Water Level Sensor
4.2.3 Leaching Experiments Cylindrical leaching columns (Figure 4-4) were constructed of SCH-80 PVC pipe with
SCH-40 fittings.
Figure 4-4 Leaching Columns

24
Soil cores were sealed using liquefied petrolatum. Cheese cloth was placed over the PVC
grate/soil core interface (Figures 4-5) to maintain core stability and prevent soil debris from
entering the collection vessels. Polyethylene soil core collection tubes were cut into 4 inch (10.16
cm) sections and placed at the bottom of the leaching column apparatus. This allowed for the
sealing of the soil PVC interface using petrolatum at room temperature to fill the void space
between the soil core and the cut tube section (Figure 4-6).
Figure 4-5 PVC Grate/Soil Core Interface Figure 4-6 Inserted 4” Soil Core Tube
Figure 4-7 Leaching Column in Position Figure 4-8 Crock Pot and Hot Plate
25
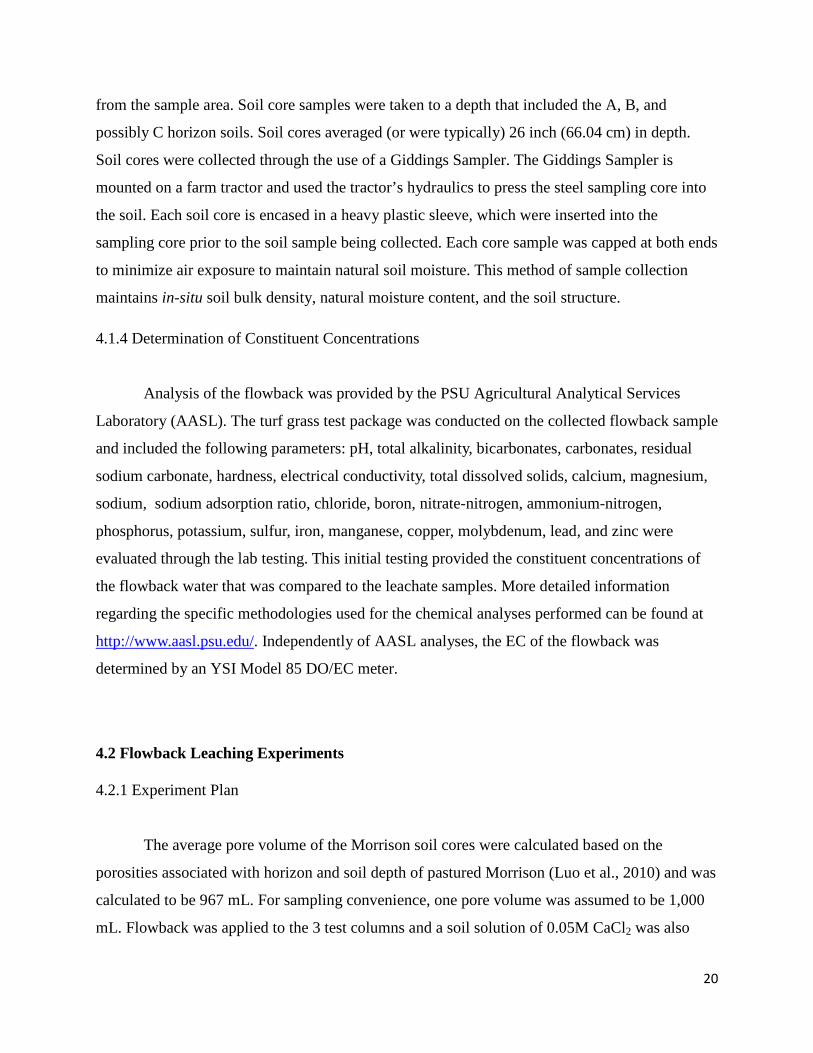
Figure 4-9 Sealed Column to 1” of Soil Surface
Once the bottom of the core was effectively sealed, the main body of the leaching column
was screwed into place (Figure 4-7). Petrolatum was liquefied using a hot plate and crock pot
heated to 200 oF (Figure 4-8). Once liquefied, the petrolatum was poured into the void space
between the leaching column and core tube. After the initial pour, the soil core was held in the
center of the leaching column by the core tube for 6-10 min to allow the petrolatum to solidify.
This was done to ensure that the soil PVC interface is sealed completely and that when additional
liquefied petrolatum was poured into the void space the force from the resulting mass of
petrolatum will not compromise the seal. After the 6-10 min wait time, liquefied petrolatum was
poured into the remaining void space to within 1 inch of the soil core surface (Figure 4-9).
Sealed cores were allowed to set up for 2 hr before application of soil solution or flowback.
Maintaining a constant head of 10 inches (25.4 cm), two pore volumes of 0.05 M CaCl2 or
flowback were applied to the soil cores.
4.2.4 Post Percolation Sample Collection Procedure
One-hundred mL volumes of leachate were collected from the bottom of each leaching
column and the time of collection recorded. Leachate was collected in 1000 mL HDPE sealable
containers. Funnels were used with each collection container to ensure that all leachate wass
collected (Figure 4-10). One-hundred mL samples were taken until one pore volume has leached
through the soil column. Those samples were then sent to PSU AASL for selected parameter
analysis.

26
Figure 4-10 HDPE Collection Containers with Funnel
4.2.5 Statistical Analysis
Statistical analysis of the data was conducted using MiniTab® 16 software. Normality and
equal variance testing was conducted on the Ksat and leachate constituent concentration data sets.
The appropriate parametric or nonparametric test associated with two independent samples was
conducted to compare control leachate constituent concentrations with test leachate constituent
concentrations. The appropriate parametric or nonparametric test associated with paired samples
was conducted to compare leachate constituent concentrations to federal drinking water
standards or lifetime advisory levels.
4.2.6 Flowback Characterization
Flowback was characterized based on the chemical composition and concentration of
constituents prior to application to soil cores. Concentrations of Ba, Cd, Pb, Se, Sr and Cl were
of most concern due to their potential negative impact to water quality.

27
4.3 Analysis of Flowback Characterization and Influence on Hydraulic Conductivity
4.3.1 Qualitative Analysis of Flowback Characterization
The observed Ksat values were interpreted on the basis of the chemical characteristics
(specifically EC and SAR) of the flowback water. All comparisons were made with reference to
a control column that was leached with a 0.05M CaCl2 solution.
4.3.2 Statistical Analysis
Normality and equal variance testing was conducted on the data sets. The appropriate
parametric or nonparametric test associated with two independent samples was conducted to
compare Ksat values associated with the actual flowback application in the leaching experiments
and those associated with the synthetic flowback in the field testing using double-ring
infiltrometers.
4.4 Hypothesis Testing
4.4.1 Specific Hypotheses Evaluated
Hypotheses were tested through statistical evaluation of the experimental data stated above
for each data set. A confidence interval of 95% was used in the statistical evaluation.
28
Chapter 5: Results and Discussion
5.1 Flowback Characterization
The flowback water used in the leaching experiments was compared to other Marcellus
Shale region flowback samples found in Sangani (2012) and Shramko et al. (2009). The
chemical characterizations of the flowback waters are found in Table 5-1. The flowback water
used in the leaching experiments was evaluated in Samples #1-4. The average value for each
constituent was calculated and compared to values reported in the literature. The flowback used
in the leaching experiments was very comparable in constituent concentrations to the other
flowback samples. The concentrations of Ca, Mg, Mn, Fe, Mn, Pb and Sr fell within the range of
concentrations exhibited by the other Marcellus flowback waters. The flowback used in the
experiment had a higher pH compared to reported values but a considerably lower Ba
concentration. Based on the parameters available for comparison, the flowback used in this study
is compositionally similar to other flowback samples reported in the literature.
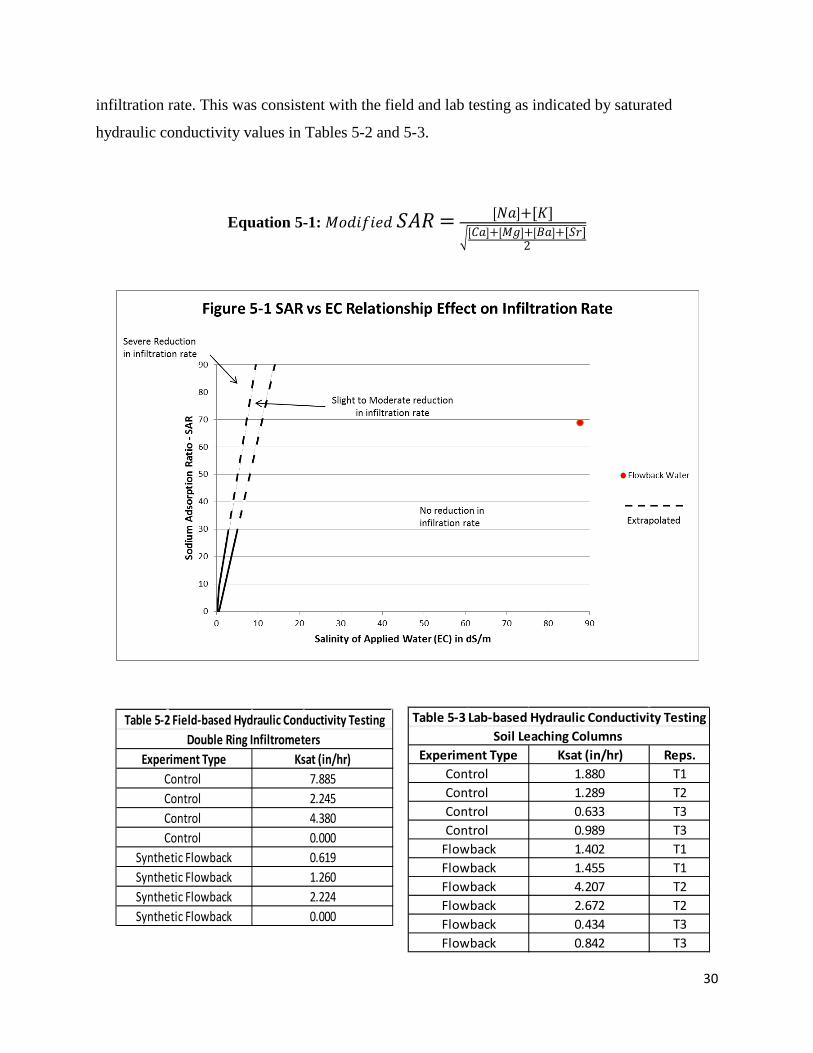
5.2 Effect of Flowback Application on Saturated Hydraulic Conductivity of the Soil
The infiltration of a soil is influenced by the sodium adsorption ratio (SAR) and electrical
conductivity (EC) of the fluid that is applied. Ayres and Westcot (1994) presented a figure which
indicates the effect of various combinations of EC and SAR on soil infiltration (see Figure 5-1).
The original range of Figure 5-1 had a maximum EC value of 6 and maximum SAR value of 35.
Assuming that the linear trends continued at higher EC and SAR values, the plot was
extrapolated to maximum axis values of 90 for both EC and SAR. This extrapolation allowed the
SAR/EC combination for the flowback used to be plotted on the figure. The SAR was calculated
using equation 5.1, and EC measured with a DO/EC meter were 68.82 (meq/L)0.5 and 87.7 dS/m,
respectively. Equation 5-1 takes into consideration all divalent cations present in significant
concentration within the flowback water and K+ along with Na+. The standard SAR calculation
only takes into account Na, Ca and Mg concentrations and, as such, is likely limited as a guide to
the impact of flowback water on soil structure. Assuming the boundary lines are valid for high
EC/SAR combinations, the flowback SAR and EC values should result in no reduction in

29
Uni
tsFR
AC-1
6 2
FRAC
-17
2FR
AC-1
8 2
Mar
cellu
s 3
-4.
012.
593.
847
mg/
L-
--
-m
g/L
--
--
mg/
L-
--
-m
g/L
--
--
dS/m
--
--
mg/
L-
--
2780
0m
g/L
--
--
mg/
L-
--
-m
g/L
2598
035
023
2738
611
76m
g/L
2499
2841
2057
127
mg/
L99
3912
943
mg/
L13
179
40m
g/L
--
--
mg/
L-
--
-m
g/L
--
--
mg/
L-
--
-m
g/L
--
--
mg/
L-
--
-m
g/L
--
--
(meq
/L)^
0.5
--
--
mg/
L39
476
315
540
-m
g/L
--
--
mg/
L0.
0068
60.
0432
30.
0248
6-
mg/
L-
--
-m
g/L
3561
5319
7127
-
3: F
rom
Shr
amko
et a
l. (2
009)
<0.0
1051
98
- - - 0.00
3
5198
4819
9.40
70.2
713
9.7
<0.0
020.
08<0
.010
1.30
0.10
-11.8
0
Tabl
e 5-
1 Fl
owba
ck C
hara
cter
izat
ion
Char
t
1: S
ampl
e w
as d
ilute
d 1:
10 p
rior t
o an
alys
is b
y AA
SL. W
here
app
ropr
iate
, sam
ple
valu
es h
ave
been
mul
tiplie
d by
10
to re
flect
conc
entr
atio
ns in
an
undi
lute
d sa
mpl
e2:
Fro
m S
anga
ni (2
012)
1411
5045
208.
0869
.47
139.
70.
0027
0.04
4
11.2
00.
710.
1515
.79
<0.0
101.
85
2188
57.0
0 4
0.74
531.
9428
095.
7624
56.8
451
.60
0.02
6- -
Avg.
Ana
lysi
s Val
ues
5.4
28.0
034
.50
0.00
8027
2.60
87.7
0 5
- -- - - - - -- - - - - -
Sam
ple
#4- - - - -
- - 0.00
40.
027
- -- - - - - -- - - - - -
<0.0
10<0
.5
Sam
ple
#3- - - - - - - -
Sam
ple
#2 1 5.
956
.00
69.0
00.
0089
155.
0031
.50
2016
0.00
15.2
0
Para
met
erSa
mpl
e #1 4.
90.
000.
000.
0071
390.
2087
.70
5
Chlo
ride
(Cl)
Man
gane
se (M
n)Zi
nc (Z
n)Co
pper
(Cu)
Boro
n (B
)
pHTo
tal A
lkal
inity
as C
aCO
3
Bica
rbon
ates
(HCO
3)
Carb
onat
es (C
O3)
0.20
16.3
7<0
.010
3.70
2188
57.0
0 4
0.78
4: C
alcu
late
d fr
om su
m o
f Na,
Ca,
Mg,
and
Cl
5: V
alue
det
erm
ined
via
YSI
Mod
el 8
5 DO
/EC
met
er
Mol
ybde
num
(Mo)
Sulfu
r (S)
Tota
l Dis
solv
ed S
olid
s (TD
S)Ph
osph
orus
(P)
Pota
ssiu
m (K
)Ca
lciu
m (C
a)M
agne
sium
(Mg)
Iron
(Fe)
85.6
9
Sele
nium
(Se)
Stro
ntiu
m (S
r)
Sodi
um (N
a)So
dium
Ads
orpt
ion
Ratio
(SAR
)Ba
rium
(Ba)
Cadm
ium
(Cd)
1326
00
0.70
502.
5031
790.
5023
73.4
017
.50
10.6
0
Lead
(Pb)
- -
4221
6.76
68.6
7- -
Hard
ness
as C
aCO
3El
cetr
ican
Con
duct
ivity
(EC)
561.
3824
401.
0125
40.2
8
1497
00
0.11
30
Reps.T1T2T3T3T1T1T2T2T3T3
Table 5-3 Lab-based Hydraulic Conductivity TestingSoil Leaching Columns
FlowbackFlowbackFlowback
Experiment TypeControl Control Control Control
Ksat (in/hr)1.8801.2890.6330.9891.402
FlowbackFlowbackFlowback
1.4554.2072.6720.4340.842
2.2240.000
Table 5-2 Field-based Hydraulic Conductivity TestingDouble Ring Infiltrometers
Synthetic FlowbackSynthetic Flowback
Ksat (in/hr)7.8852.2454.3800.000
Control Control Control Control
Synthetic FlowbackSynthetic Flowback
Experiment Type
0.6191.260
infiltration rate. This was consistent with the field and lab testing as indicated by saturated
hydraulic conductivity values in Tables 5-2 and 5-3.
Equation 5-1: 𝑀𝑜𝑑𝑖𝑓𝑖𝑒𝑑 𝑆𝐴𝑅 = �𝑁𝑎�+[𝐾]��𝐶𝑎�+�𝑀𝑔�+�𝐵𝑎�+[𝑆𝑟]
2
31
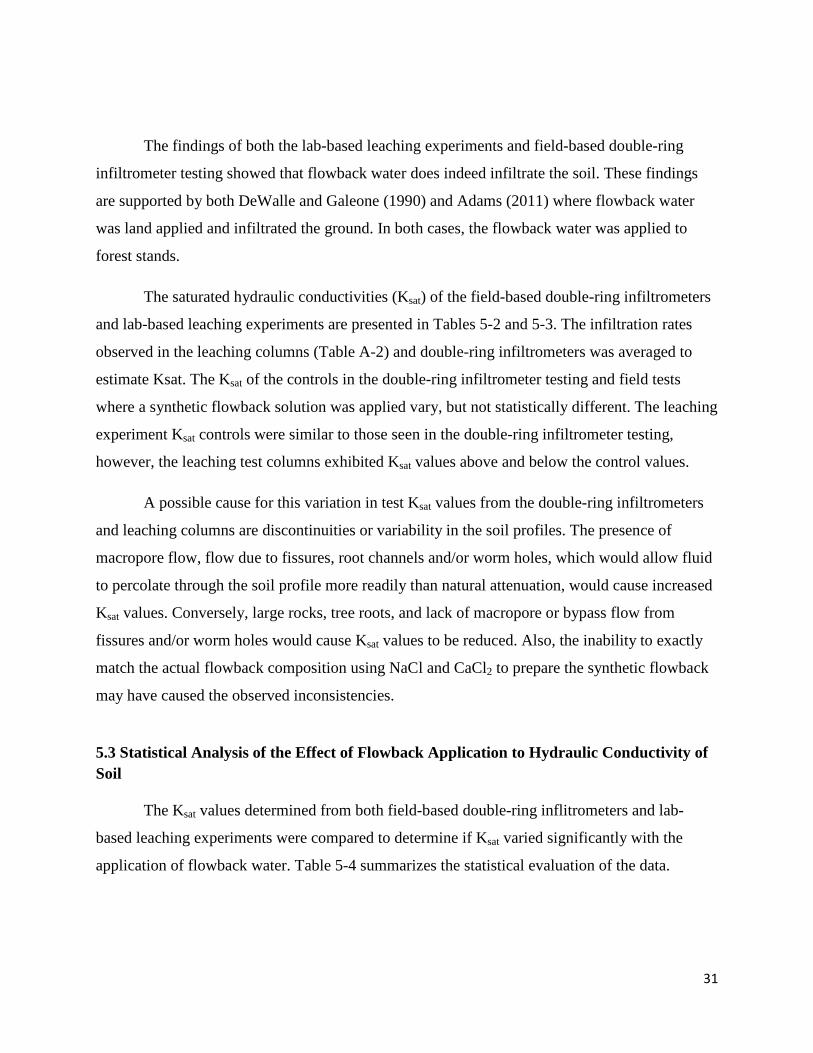
The findings of both the lab-based leaching experiments and field-based double-ring
infiltrometer testing showed that flowback water does indeed infiltrate the soil. These findings
are supported by both DeWalle and Galeone (1990) and Adams (2011) where flowback water
was land applied and infiltrated the ground. In both cases, the flowback water was applied to
forest stands.
The saturated hydraulic conductivities (Ksat) of the field-based double-ring infiltrometers
and lab-based leaching experiments are presented in Tables 5-2 and 5-3. The infiltration rates
observed in the leaching columns (Table A-2) and double-ring infiltrometers was averaged to
estimate Ksat. The Ksat of the controls in the double-ring infiltrometer testing and field tests
where a synthetic flowback solution was applied vary, but not statistically different. The leaching
experiment Ksat controls were similar to those seen in the double-ring infiltrometer testing,
however, the leaching test columns exhibited Ksat values above and below the control values.
A possible cause for this variation in test Ksat values from the double-ring infiltrometers
and leaching columns are discontinuities or variability in the soil profiles. The presence of
macropore flow, flow due to fissures, root channels and/or worm holes, which would allow fluid
to percolate through the soil profile more readily than natural attenuation, would cause increased
Ksat values. Conversely, large rocks, tree roots, and lack of macropore or bypass flow from
fissures and/or worm holes would cause Ksat values to be reduced. Also, the inability to exactly
match the actual flowback composition using NaCl and CaCl2 to prepare the synthetic flowback
may have caused the observed inconsistencies.
5.3 Statistical Analysis of the Effect of Flowback Application to Hydraulic Conductivity of Soil
The Ksat values determined from both field-based double-ring inflitrometers and lab-
based leaching experiments were compared to determine if Ksat varied significantly with the
application of flowback water. Table 5-4 summarizes the statistical evaluation of the data.

32
The Ksat values of the controls of the leaching experiments and double-ring infiltrometers
were evaluated through a two sample t-test, data was normally distributed and exhibited equal
variance at a 95% confidence interval, to determine if a significant difference in Ksat values
existed between the two experiments. The two sample t-test yielded a p-value of 0.160, greater
than 0.05, indicating that there is not a significant difference between the Ksat values of the
controls for the double-ring infiltrometer testing and leaching experiments.
The Ksat values of the test replications of the leaching experiments and double-ring
infiltrometers were evaluated through a two sample t-test, data was normally distributed and
exhibited equal variance, at a 95% confidence interval to determine if a significant difference in
Ksat values existed between the two experiments. The two sample t-test yielded a p-value of
0.547, greater than 0.05, indicating that there is not a significant difference between the Ksat
values of the test replications for the double-ring infiltrometer testing and leaching experiments.
The Ksat values of the test replications and controls of the leaching experiments were
evaluated through a two sample t-test, data was normally distributed and exhibited equal
variance, at a 95% confidence interval to determine if a significant difference in Ksat values
existed between the columns that received flowback and those that received simulated soil
solution. The two sample t-test yielded a p-value of 0.347, greater than 0.05, indicating that there
is not a significant difference between the Ksat values of the test replications and controls for the
leaching experiments. This means the saturated hydraulic conductivity of the soil receiving
flowback water and the soil receiving the 0.05 M CaCl2 solution were not significantly different.
The Ksat values of the test replications and controls of the double ring infiltrometer testing
were evaluated through a two sample t-test, data was normally distributed and exhibited equal
variance, at a 95% confidence interval to determine if a significant difference in Ksat values
existed between the double-ring infiltrometers that received flowback and those that received soil
Comparison Test P-ValueDRI Control vs. LC Control 2 Sample t-test 0.160DRI Test vs. LC Test 2 Sample t-test 0.547LC Control vs. LC Test 2 Sample t-test 0.347DRI Control vs. LC Test 2 Sample t-test 0.179
Table 5-4 Summary of Ksat Statistical Analysis
Comparisons abbreviate Double-ring Infi ltrometer (DRI) and Leaching Column (LC)
MethodParametricParametricParametricParametric

33
solution. The two sample t-test yielded a p-value of 0.179, greater than 0.05, indicating that there
is not a significant difference between the Ksat values of the test replications and controls for the
double-ring infiltrometer testing. This means the hydraulic conductivity of the soil receiving
flowback water and the soil receiving soil solution were not significantly different.
Based on the statistical analysis of the Ksat values of the double-ring infiltrometer testing
and leaching experiments, the H0 was not rejected and therefore it was concluded that the Ksat of
the soil is not different when infiltrating flowback water compared to 0.05M CaCl2.
5.4 Leaching Experiment Results
The concentrations of Ba, Cd, Pb, Se, Sr and Cl initially present within the flowback water
prior to application are presented in the AASL test reports found in Appendix B. The
concentrations of Ba, Cd, Pb, Se, Sr and Cl found within the 100 mL leachate samples are
presented in Table A-3. The control columns exhibited significantly lower concentrations of
heavy metals in comparison to the various test columns to which flowback was applied. Values
reported as below detection limit are plotted in the figures as one-half the detection limit.
Most all control column leachate samples had heavy metal concentrations below Federal
Drinking Water Standards: Ba-2.00 mg/L, Cd-0.005 mg/L, Pb-0.015 mg/L (EPA, 2012) and
Lifetime Advisory Levels: Sr-4.00 mg/L (EPA, 2011) for the duration of the experiment. The
concentrations of Cd and Sr were elevated at times above the Federal Drinking Water Standard
and Lifetime Advisory Level; the 400 mL Cd concentration spiked to 0.006 mg/L and Sr
concentrations were consistently elevated above the Lifetime Advisory Level. The element
concentrations with respect to volume leached of the control columns can be referenced in
Figures 5-2, 5-3, 5-4, and 5-5.
All test columns exhibited Ba, Cd, Pb and Sr. concentrations above Federal Drinking
Water Standards and Lifetime Advisory Levels. The metal concentrations with respect to volume
leached of the test columns can be referenced in Figures 5-6, 5-7, 5-8, and 5-9. Selenium
concentrations were well below the Federal Drinking Water Standard in all test columns. Test
columns T3 Test 1 and Test 2 had heavy metal concentrations considerably lower as compared to
other test columns.

34
Almost all column leachate Se levels were reported as below the method detection limit.
A few samples had reported Se levels of 0.011-0.012 mg/L, well below the drinking water
standard of 0.05 mg/L. Selenium concentrations in the initial flowback water were below the
method detection limit as well. Thus, Se leaching to groundwater is unlikely to be a limiting
factor in land application of flowback water.

35
5.5 Potential Causes of Elevated Metal Leachate Concentrations
As can be seen in Figures 5-2 through 5-9, Ba, Cd, Pb and Sr concentrations are
significantly higher than those concentrations observed in the control columns. Most test
columns exhibited increasing Ba, Cd, Pb and Sr concentrations with increasing volume of
flowback leached through the soil column.
Progressive saturation of cation exchange capacity (CEC) sites by cations contained
within the flowback water would cause the leaching of Ba, Cd, Pb and Sr observed in the
experiment results. The CEC of a soil column was calculated to be ≈680+ meq/L, assuming soil
bulk density of 1.5 g/cm3 and CEC of 15 meq/100g. Flowback has 3693 meq/L of cations,
calculated from the major cation concentrations reported in the flowback (Table 5-1). After ≈
200 mL, 1/5th of a pore volume, the CEC of the soil column is theoretically completely saturated
and concentrations of Ba and Sr begin to approach the concentrations of the raw flowback water
as can be seen in figures 5-6 and 5-10. With CEC sites completely saturated, remaining cations
have no way of binding to the soil structure resulting in elevated concentrations of those cations
in the leachate similar to the concentrations found in flowback water. Barium and Sr do not
readily complex with chloride and therefore concentrations plateau once raw flowback levels are
reached, instead of continuing to climb as is seen for Cd and Pb.
The increasing concentrations of Cd and Pb are likely due to complexation with chloride
ions. The speciation of Cd and Pb as a function of chloride concentration are shown in Figures 5-
10 and 5-11, respectively. The diagrams were developed using the stability constants referenced
in Butler (1964). The test column pCl range is displayed on the Figures 5-10 and 5-11.
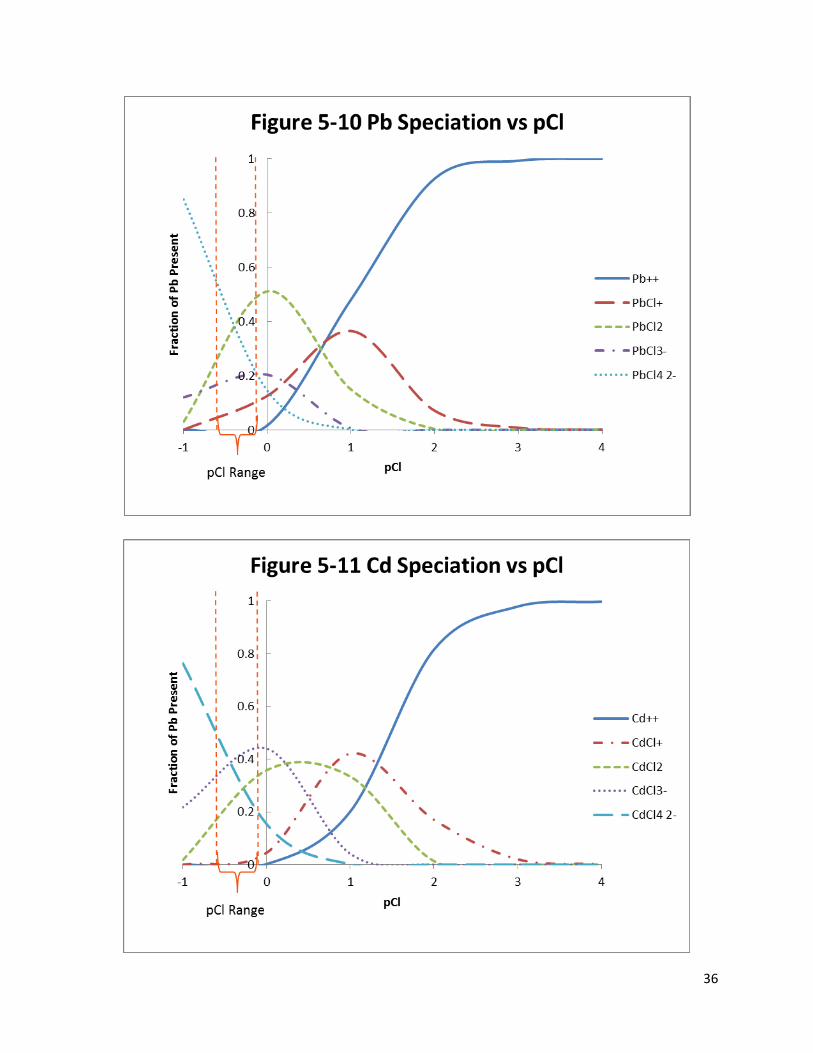
36
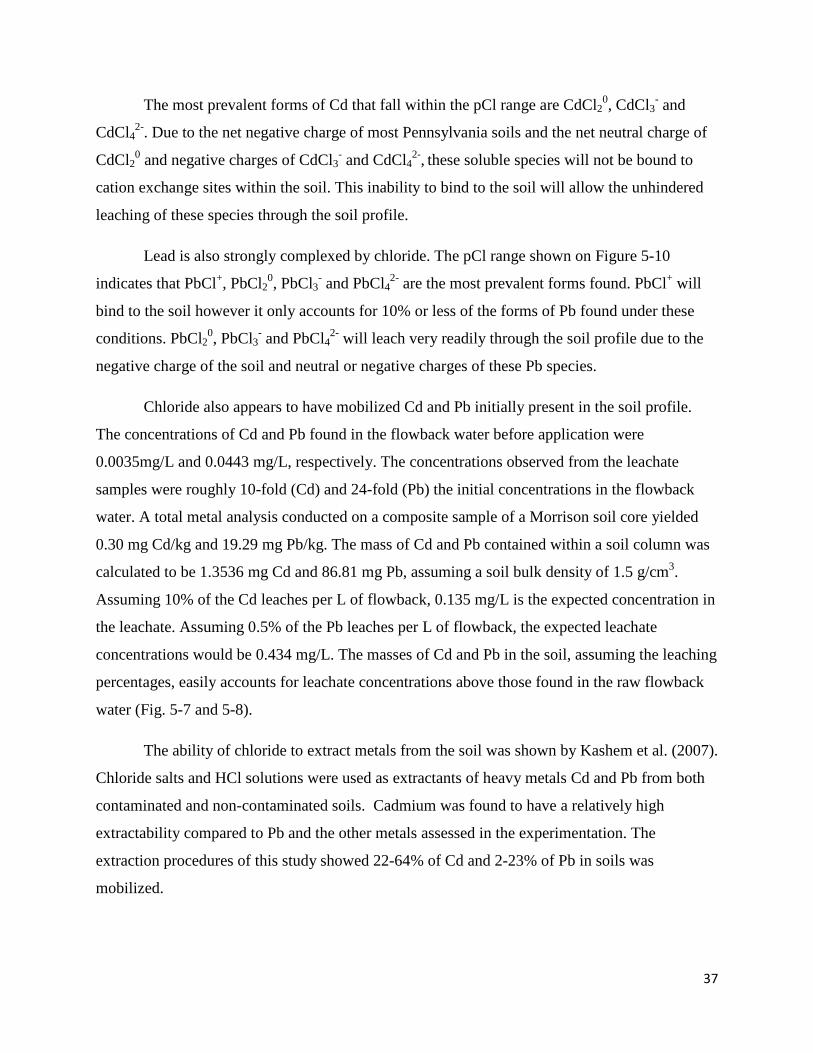
37
The most prevalent forms of Cd that fall within the pCl range are CdCl20, CdCl3
- and
CdCl42-. Due to the net negative charge of most Pennsylvania soils and the net neutral charge of
CdCl20 and negative charges of CdCl3
- and CdCl42-, these soluble species will not be bound to
cation exchange sites within the soil. This inability to bind to the soil will allow the unhindered
leaching of these species through the soil profile.
Lead is also strongly complexed by chloride. The pCl range shown on Figure 5-10
indicates that PbCl+, PbCl20, PbCl3- and PbCl42- are the most prevalent forms found. PbCl+ will
bind to the soil however it only accounts for 10% or less of the forms of Pb found under these
conditions. PbCl20, PbCl3- and PbCl42- will leach very readily through the soil profile due to the
negative charge of the soil and neutral or negative charges of these Pb species.
Chloride also appears to have mobilized Cd and Pb initially present in the soil profile.
The concentrations of Cd and Pb found in the flowback water before application were
0.0035mg/L and 0.0443 mg/L, respectively. The concentrations observed from the leachate
samples were roughly 10-fold (Cd) and 24-fold (Pb) the initial concentrations in the flowback
water. A total metal analysis conducted on a composite sample of a Morrison soil core yielded
0.30 mg Cd/kg and 19.29 mg Pb/kg. The mass of Cd and Pb contained within a soil column was
calculated to be 1.3536 mg Cd and 86.81 mg Pb, assuming a soil bulk density of 1.5 g/cm3.
Assuming 10% of the Cd leaches per L of flowback, 0.135 mg/L is the expected concentration in
the leachate. Assuming 0.5% of the Pb leaches per L of flowback, the expected leachate
concentrations would be 0.434 mg/L. The masses of Cd and Pb in the soil, assuming the leaching
percentages, easily accounts for leachate concentrations above those found in the raw flowback
water (Fig. 5-7 and 5-8).
The ability of chloride to extract metals from the soil was shown by Kashem et al. (2007).
Chloride salts and HCl solutions were used as extractants of heavy metals Cd and Pb from both
contaminated and non-contaminated soils. Cadmium was found to have a relatively high
extractability compared to Pb and the other metals assessed in the experimentation. The
extraction procedures of this study showed 22-64% of Cd and 2-23% of Pb in soils was
mobilized.

38
Barium, Se and Sr concentrations of the leachate samples were similar to the initial
flowback water concentrations of these elements. This indicates that Ba, Se and Sr are not bound
to the soil to any significant extent as the flowback moves through the column. It is most likely
that the Ba, Se and Sr saturated the CEC of the soil column and then simply leach straight
through the columns without any soil retention.
5.6 Statistical Analysis of Metal Concentrations from Leaching Experiments
Anderson-Darling normality tests and tests for equal variance were conducted on the
leaching experiment data and concluded that the data lacked equal variance and most of the data
sets were not significantly different from a normal distribution. Due to the lack of equal variance,
the Mann-Witney Test with a 95% confidence interval was used to determine whether the
leachate concentrations of metals differed significantly from the concentrations found in the
controls in the 100 mL, 500 mL and 1000 mL leachate samples. Barium 100 mL, 500 mL and
1000 mL concentrations were found to be significantly different from control concentrations for
Ba with p-values of 0.0380, 0.0142 and 0.0142, respectively. The Cd 100 mL concentration had
a p-value of 0.0550, which indicated that Cd 100 mL test and control concentrations were not
significantly different from each other. Cadmium 500 mL and 1000 mL concentrations were
significantly different from controls with p-values of 0.0142. The Pb 100 mL concentration had a
p-value of 0.1658, which indicated Pb 100 mL test and control concentrations were not
significantly different from each other. Lead 500 mL and 1000 mL concentrations were
significantly different from controls with p-values of 0.0142. Strontium 100 mL, 500 mL and
1000 mL concentrations were found to be significantly different from control concentrations for
Sr with p-values of 0.0428, 0.0142 and 0.0142, respectively.
Metal concentrations from the 100 mL, 500 mL and 1,000 mL leachate samples were
compared to Federal Drinking Water Standards and Lifetime Advisory Levels for Ba, Cd, Pb and
Sr. The non-parametric One-Sample Wilcoxon Signed Rank Test was used to determine if a
significant difference exists between the associated drinking water standards and the leachate
metal concentrations. The test median for the One-Sample Wilcoxon Signed Rank Test was the
specified drinking water standard or lifetime advisory level for each metal. The One-Sample
39
Wilcoxon Test then evaluated whether the median of the test concentrations are equal to or
greater than the test median (drinking water standard or lifetime advisory level).
The median of the Ba test concentrations (96.81 mg/L) was significantly higher
(p<0.0001) than the Ba drinking water standard (2.00 mg/L). The median of the Cd test
concentrations (0.011 mg/L) was significantly higher (p<0.0001) than the Cd drinking water
standard (0.005 mg/L). The median of the Pb test concentrations (0.07950 mg/L) was
significantly higher (p=0.002) than the Pb drinking water standard (0.015 mg/L). The median of
the Sr test concentrations (3,132 mg/L) was significantly higher (p<0.0001) than the Sr life time
advisory level (4.00 mg/L).
Based on this statistical analysis, the H0 is rejected and it was concluded that
concentrations of Ba, Cd, Pb and Sr that pass through a soil column loaded with flowback water
do exceed federal drinking water standards or lifetime advisory levels.

40
Chapter 6: Conclusion
6.1 Major Findings
The experiments conducted to evaluate the potential influence of land application of
flowback water on the Ksat of the soil yielded conclusive results. Flowback leached through the
soil at varying rates when compared to controls and to other field and lab test replications but
through statistical analysis proved not to vary significantly. Based on statistical evaluation of the
data the application of flowback water did not have a significant impact on the hydraulic
conductivity of the soil. This study also confirmed that flowback will infiltrate as long as the EC
and SAR relationship (Fig. 5-1) is fulfilled. Even at high EC and SAR values, the flowback
infiltrated the soil.
The leaching experiment conducted on the undisturbed Morrison soil series cores where
flowback water applied at a constant head yielded elevated concentrations of Ba, Cd, Pb and Sr
from the collection of 100 mL leachate samples. These elevated metal concentrations
significantly exceeded Federal Drinking Water Standards and Lifetime Advisory Levels.
The ultimate feasibility of land-based disposal of flowback water under the conditions of
this study was determined to be highly detrimental to water quality and poses a potentially
serious human health concern. Due to this determination, it is not feasible to land apply flowback
water as a method of disposal under the conditions of the study. Heavy metal concentrations in
leachate far in excess of Federal Drinking Water Standards and Lifetime Advisory Levels
support this determination. Despite this conclusion, the research did show that by increasing the
residence time of the flowback water in the soil profile, lower metal concentrations were
observed. This indicated that flowback application to very deep soil high in clay content may be
able to slow the percolation rate thereby increasing residence time and flowback-soil exposure
allowing for the binding of metals to the soil structure.
The issue of elevated heavy metal concentrations and chloride complexation can be
mitigated through the pretreatment of the flowback water to remove these potentially toxic
constituents. By reducing Cl concentrations, complexation of Cd and Pb can be reduced. A
reduction in Ba and Sr levels would potentially prevent CEC saturation or increase the volume of

41
flowback that could be land applied before CEC saturation occurs. Through the removal of Ba,
Cd, Pb and Sr in a pretreatment process, these metals will not be present in the natural system in
high concentrations and it is possible that natural soil processes can manage continual land-based
application without the threat to water quality.
The extreme salinity and sodicity of the flowback water did not negatively affect the
infiltration ability or the hydraulic conductivity of the soil. If potentially toxic metals are
removed in a pretreatment process, the extreme salinity and sodicity could potentially be
managed through land application. The study by Dewalle and Galeone (1990) concluded that the
natural precipitation alone would be sufficient to wash salts from the soil profile and avoid
reduction in hydraulic conductivity. However, the extreme salinity of flowback will likely
damage existing vegetation at the application site (Adams, 2011) and reduce germination and
growth until precipitation-induced leaching lowers the salinity of the soil solution in the root
zone.
6.2 Future Research Areas
There are several research areas surrounding the land-based disposal of flowback water
and the impact of flowback water to the natural system that will require attention in the very near
future. Is the ability of soils to bind heavy metals related to the clay content? At what rate do
metals bind to the soil profile? If so, which metals and does residence time and hydraulic
conductivity affect that binding? How do metal concentrations behave after multiple pore
volumes have been leached through the soil profile? Are there trends in rate at which they
change? How do other competing soil series perform as compared to the Morrison soil series?
How are the implications associated with radioactivity addressed? What impact will elevated
levels of trace organics have? Over time, how does salinity affect vegetation? Does vegetation
uptake significant amounts of metals associated with flowback? What are the implication of
NORM on land-based application of flowback? These are just some of the many questions
related to this study that deserve the attention of future researchers to better understand the
feasibility of land-based disposal of flowback water.

42
References
Adams, M.B. 2011. Land application of hydrofracturing fluids damages a deciduous forest stand in West Virginia. J. Environ. Qual. 40(4): 1340-1344.: doi: 10.2134/jeq2010.0504.
Alberta Environment. 2009. Assessing drilling waste disposal areas: Compliance options for reclamation certificate. Edmonton, Alberta: Alberta Environment. Available at: http://environment.gov.ab.ca/info/library/6898.pdf. Accessed 28 September 2011.
Auer Perry, S. and PRI Marcellus Shale Team. 2011. Understanding naturally occurring radioactive material in the marcellus shale. Marcellus Shale. 4: 1-8. Available at: http://cce.cornell.edu/EnergyClimateChange/NaturalGasDev/Documents/PRI%20Papers/Marcellus_issue4.pdf. Accessed 23 April 2013.
Ayres, R.S and D.W. Westcot. 1994. Water Quality for Agriculture. Rome: Food and Agriculture Organization of the United Nations. 1985. 29(1).
Bates, M. H. 1988. Land farming of reserve pit fluids and sludges: Fate of selected contaminants. Wat. Res. 22(6): 793-797.
Butler, J.N.1964. Ionic equilibrium, A mathematical approach. New York: Platinum Press., 1964. 261-271.
Clements, K., J.A. Veil, and A. J. J. Leuterman. 2010. Global practices and regulations for land application and disposal of drill cuttings and fluids. SPE Paper No. 126565. Richardson, Tex.: SPE.
DeWalle, D.R. ,and D.G. Galeone. 1990. One-time dormant season application of gas well brine on forest land. J. Environ. Qual. 19: 288-295.
Drohan, P.J., J.C. Finley, P. Roth, T.M. Schuler, S.L. Stout, M.C. Brittingham, and N.C. Johnson. 2012. Oil and gas impacts on forest ecosystems: findings gleaned from the 2012 goddard forum at penn state university. Environmental Practice. 14(4): 394-399.: doi: 10.1017/S1466046612000300.
EPA. 2004. Evaluation of impacts to underground sources of drinking water by hydraulic fracturing of coalbed methane reserves. EPA 816-R-04-003. Washington, D.C.: EPA OW.
EPA. 2010. Class II Wells – Oil and Gas Related Injection Wells (Class II). Washington, D.C.: Environmental Protection Agency. Available at: http://water.epa.gov/type/groundwater/uic/class2. Accessed 28 September 2011.
EPA. 2011. 2011 Edition of Drinking Water Standards and Health Advisories. Washington, D.C.: Environmental Protection Agency Department of Water. Available at: http://water.epa.gov/action/advisories/drinking/upload/dwstandards2011.pdf. Accessed 12 March 2013.

43
EPA. 2012. Class I Wells – Industrial and Municipal Waste Disposal Wells (Class I). Washington, D.C.: Environmental Protection Agency. Available at: http://water.epa.gov/type/groundwater/uic/wells_class1.cfm Accessed 18 March 2013.
EPA. 2012. Drinking Water Contaminents. Washington, D.C.: Environmental Protection Agency. Available at: http://water.epa.gov/drink/contaminants/index.cfm. Accessed 12 March 2013.
Gaudlip, A.W., L.O. Paugh, and T.D. Hayes. 2008. Marcellus shale water management challenges in Pennsylvania. SPE Paper No. 119898. Richardson, Tex.: SPE.
Hamilton, D.W., and H.A. Elliott. 1991. Predicting soil physical damage from high sodium wastes. ASAE Paper No. 912603. St. Joseph, Mich.: Soc. Agr. Biol. Engr.
Hanlon, J. 2011. Natural gas drilling in the Marcellus shale under the NPDES program. Memorandum. Washington, D.C.: EPA.
Hoffman, N. 2011. “Injection Wells not DEP’s First Choice.” Courier Express. October 7. Available at: http://www.thecourierexpress.com/courierexpresscourierexpresslocal/935257-349/injection-wells-not-deps-first-choice.html.
Horn, A.D. 2009. Breakthrough mobile water treatment converts 75% of fracturing flowback fluid to fresh water and lowers CO2 emissions. SPE Paper No. 121104. San Antonio, Tex.: SPE.
Kashem, M.A., B.R. Singh, T. Kondo, S.M. Imamul Huq, and S. Kawai. 2007. Comparison of extractability of Cd, Cu, Pb, and Zn with sequential extraction in contaminated and non-contaminated soils. Int. J. Environ. Sci. Tech: 4(2): 169-176.
Luo, L., H. Lin, and S. Li. 2010. Quantification of 3-D soil macropore networks in differnet soil types and land uses using computed tomography. J. Hydrology. 393(1-2): 53-64.
Murphy, T. 2013. Personal Communication.
Nelson, D. W., S.L. Liu, and L.E. Sommers. 1984. Extractability and plant uptake of trace elements from drilling fluids. J. Environ. Qual. 13(4): 562-566.
PA Bulletin. 2009. Wastewater Treatment Requirements. Doc. No. 09-2065. Harrisburg, Penn.: PA Bulletin.
PaDEP. 2010. Marcellus Shale. Harrisburg, Penn.: Pennsylvania Department of Environmental Protection. Available at: http://www.elibrary.dep.state.pa.us/dsweb/Get/Document-77964/0100-FS-DEP4217.pdf. Accessed 10 October 2011.
Porter, D.O. and T. Marek. 2011. Irrigation Management with Saline Water. Texas A&M University Agricultural Research and Extension Center. Available at: http://cotton.tamu.edu/cottonDVD/content/cottondvd/Irrigation/IrrigationwithSalineWater.pdf. Accessed 20 March 2013.
Rahm, D. 2011. Regulating hydraulic fracturing in shale gas plays: The case of Texas. J. Energy Policy. 39: doi: 10.1016/j.enpol.2011.03.009.

44
Sangani, K. 2012. Modeling and environmental analysis of hydraulic fracturing in upstate New York. The NEWEA Journal. Summer 2012: 56-65.
Shramko, A., T. Palmgren, D. Gallo, and R. Dixit. 2009. Analytical characterization of flowback waters in the field. In Proc. 16th Annual Petroleum and Biofuels Environmental Conference. Houston, Tex.: IPEC.
Zvomuya, F., F.J. Larney, W.D. Willms, R.K. Beck, and A.F. Olson. 2011. Vegetation response to a one-time spent drilling mud application to semiarid, mixed-grass prairie. Rangeland Ecol. Management 64(4): 375-383.

45
Appendix A
Ksat and Flowback Characterization Data

46
Sensor #1Sensor #2Sensor #3Sensor #4Sensor #5Sensor #6Sensor #7Sensor #8
(v = sensor voltage)
Depth(in) = -1.4503v2 + 0.3251v + 8.8867Depth(in) = -1.4094v2 + 0.3294v + 8.9031Depth(in) = -1.7436v2 + 1.3014v + 8.3324
Table A-1 Milone eTape Depth Sensor Converstion EquationsDepth(in) = -1.5626v2 + 0.8555v + 8.4831Depth(in) = -1.4063v2 + 0.3839v + 8.7264Depth(in) = -1.4152v2 + 0.1354v + 9.1188Depth(in) = -1.6961v2 + 1.2035v + 8.4005Depth(in) = -1.5404v2 + 0.4777v + 9.0528

47
Figure A-1 Double-ring Infiltrometer Scatter Plots
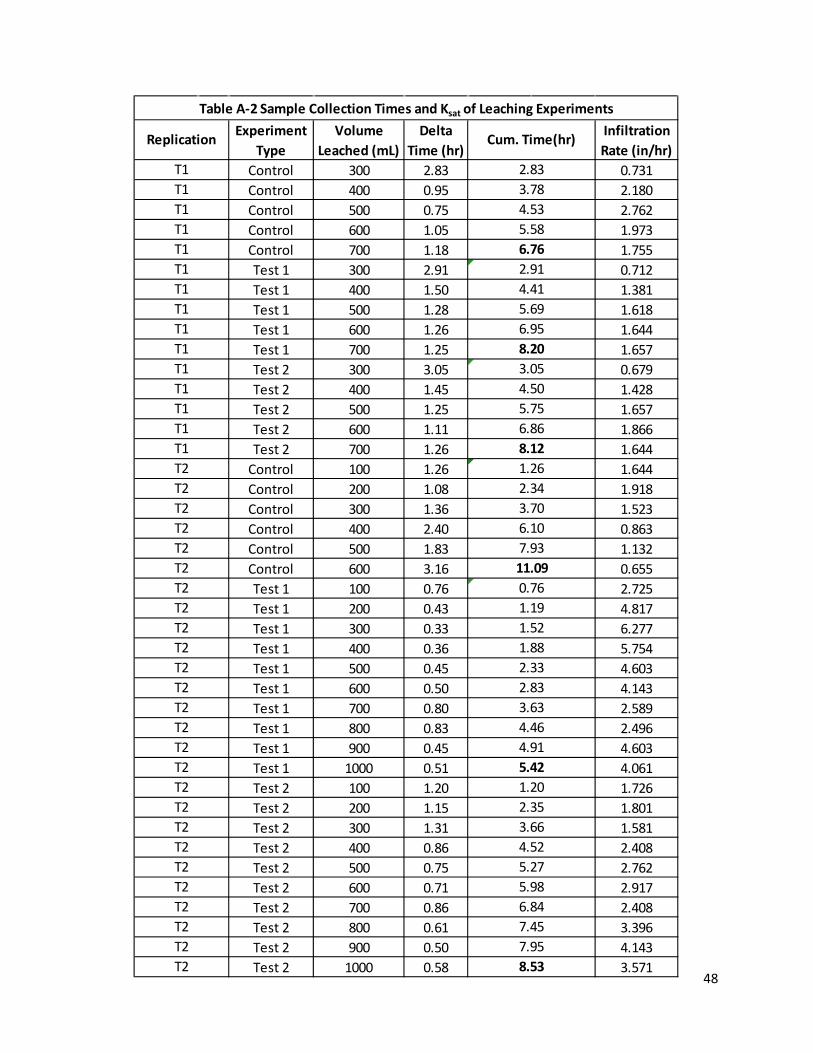
48
Control 300 2.83 0.731Control 400 0.95 2.180Control 500 0.75 2.762Control 600 1.05 1.973Control 700 1.18 1.755Test 1 300 2.91 0.712Test 1 400 1.50 1.381Test 1 500 1.28 1.618Test 1 600 1.26 1.644Test 1 700 1.25 1.657Test 2 300 3.05 0.679Test 2 400 1.45 1.428Test 2 500 1.25 1.657Test 2 600 1.11 1.866Test 2 700 1.26 1.644
Control 100 1.26 1.644Control 200 1.08 1.918Control 300 1.36 1.523Control 400 2.40 0.863Control 500 1.83 1.132Control 600 3.16 0.655Test 1 100 0.76 2.725Test 1 200 0.43 4.817Test 1 300 0.33 6.277Test 1 400 0.36 5.754Test 1 500 0.45 4.603Test 1 600 0.50 4.143Test 1 700 0.80 2.589Test 1 800 0.83 2.496Test 1 900 0.45 4.603Test 1 1000 0.51 4.061Test 2 100 1.20 1.726Test 2 200 1.15 1.801Test 2 300 1.31 1.581Test 2 400 0.86 2.408Test 2 500 0.75 2.762Test 2 600 0.71 2.917Test 2 700 0.86 2.408Test 2 800 0.61 3.396Test 2 900 0.50 4.143Test 2 1000 0.58 3.571
Table A-2 Sample Collection Times and Ksat of Leaching Experiments
4.525.275.986.847.457.958.53
2.332.833.634.464.915.421.202.353.66
2.343.706.107.9311.090.761.191.521.88
Delta Time (hr)
Cum. Time(hr) Infiltration Rate (in/hr)
2.833.784.535.586.762.914.415.696.958.203.054.505.756.868.121.26
T2T2
T2T2T2T2T2T2T2T2T2
T2T2T2T2T2T2T2T2T2
T1T1T1T2T2T2T2T2T2
T1T1T1T1T1T1T1T1T1
Replication Experiment Type
VolumeLeached (mL)
T1T1T1
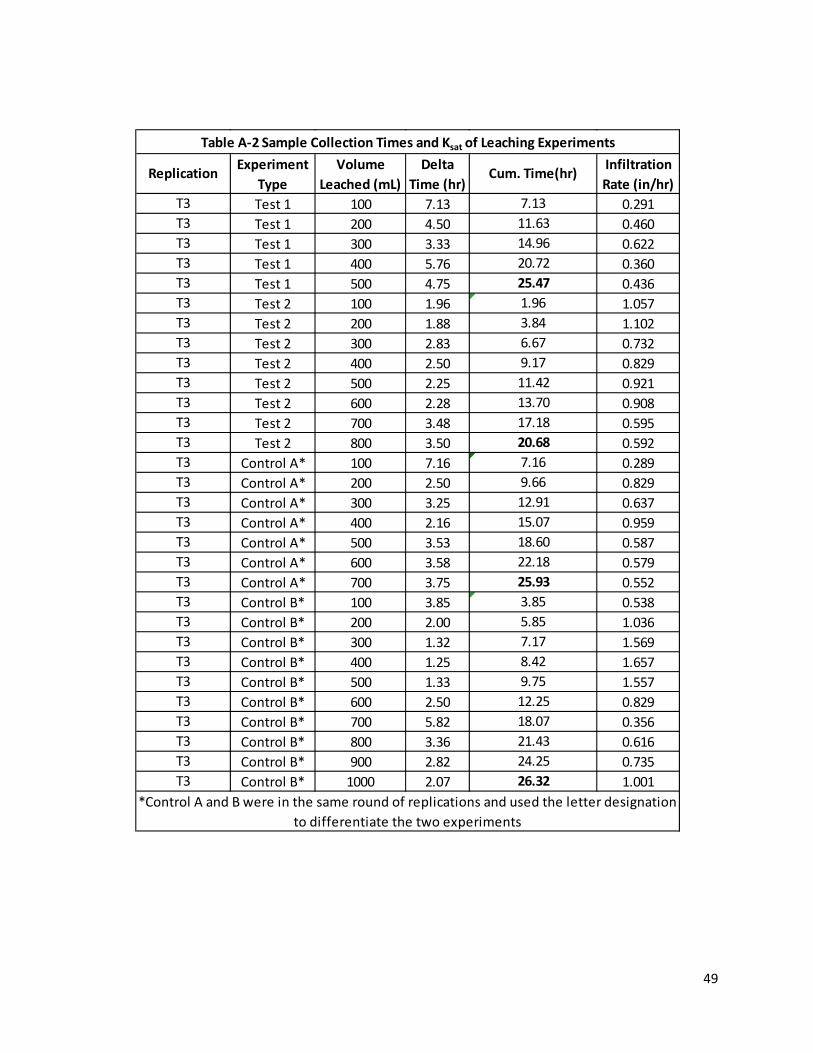
49
Test 1 100 7.13 0.291Test 1 200 4.50 0.460Test 1 300 3.33 0.622Test 1 400 5.76 0.360Test 1 500 4.75 0.436Test 2 100 1.96 1.057Test 2 200 1.88 1.102Test 2 300 2.83 0.732Test 2 400 2.50 0.829Test 2 500 2.25 0.921Test 2 600 2.28 0.908Test 2 700 3.48 0.595Test 2 800 3.50 0.592
Control A* 100 7.16 0.289Control A* 200 2.50 0.829Control A* 300 3.25 0.637Control A* 400 2.16 0.959Control A* 500 3.53 0.587Control A* 600 3.58 0.579Control A* 700 3.75 0.552Control B* 100 3.85 0.538Control B* 200 2.00 1.036Control B* 300 1.32 1.569Control B* 400 1.25 1.657Control B* 500 1.33 1.557Control B* 600 2.50 0.829Control B* 700 5.82 0.356Control B* 800 3.36 0.616Control B* 900 2.82 0.735Control B* 1000 2.07 1.001
Table A-2 Sample Collection Times and Ksat of Leaching Experiments
26.32
Replication Experiment Type
VolumeLeached (mL)
Delta Time (hr)
Cum. Time(hr) Infiltration Rate (in/hr)
17.1820.687.169.6612.9115.0718.6022.1825.93
14.9620.7225.471.963.846.67
*Control A and B were in the same round of replications and used the letter designation to differentiate the two experiments
3.855.857.178.429.7512.2518.0721.4324.25
T3T3T3T3T3
T3
9.1711.4213.70
7.1311.63
T3T3T3T3T3T3T3T3
T3T3T3T3T3T3T3T3T3
T3T3T3T3T3T3T3

50
Control 300 0.99 <0.002* <0.005* <0.010* 1.77Control 400 1.20 <0.002* <0.005* <0.010* 6.78Control 500 1.24 <0.002* <0.005* <0.010* 9.64Control 600 1.29 <0.002* <0.005* <0.010* 2.70Control 700 1.61 <0.002* <0.005* <0.010* 9.75 3160Test 1 300 90.60 0.009 0.052 <0.010* 3024.68Test 1 400 132.58 0.009 0.130 0.012 4488.20Test 1 500 128.77 0.009 0.217 <0.010* 4265.86Test 1 600 153.95 0.008 0.254 <0.010* 4981.03Test 1 700 147.89 0.008 0.264 <0.010* 4827.34 116600Test 2 300 83.29 0.010 0.030 <0.010* 2871.05Test 2 400 101.40 0.013 0.056 <0.010* 3434.15Test 2 500 130.42 0.013 0.100 <0.010* 4173.66Test 2 600 145.54 0.013 0.123 <0.010* 4762.96Test 2 700 140.41 0.013 0.154 0.011 4583.72 95500
Control 100 0.87 <0.002* <0.005* <0.010* 28.09Control 200 0.67 <0.002* <0.005* <0.010* 14.49Control 300 0.52 <0.002* <0.005* <0.010* 7.71Control 400 0.66 <0.002* <0.005* <0.010* 6.79Control 500 0.91 <0.002* <0.005* <0.010* 7.87Control 600 0.93 <0.002* <0.005* <0.010* 11.76 2070Test 1 100 146.51 0.006 0.057 <0.010* 5010.25Test 1 200 142.66 0.008 0.063 <0.010* 4847.88Test 1 300 138.71 0.006 0.098 <0.010* 4709.80Test 1 400 142.36 0.007 0.094 <0.010* 4882.92Test 1 500 141.01 0.007 0.066 <0.010* 4827.28Test 1 600 180.50 0.006 0.105 <0.010* 6362.27Test 1 700 154.25 0.006 0.077 <0.010* 5593.19Test 1 800 150.17 0.007 0.104 <0.010* 5126.71Test 1 900 143.68 0.007 0.107 <0.010* 5011.80Test 1 1000 138.25 0.007 0.117 <0.010* 4390.20 118100Test 2 100 55.38 0.017 0.014 <0.010* 1873.51Test 2 200 69.21 0.024 0.023 <0.010* 2462.16Test 2 300 98.69 0.033 0.051 <0.010* 3345.76Test 2 400 90.95 0.033 0.121 <0.010* 3115.28Test 2 500 135.49 0.032 0.252 <0.010* 4545.52Test 2 600 123.81 0.042 0.243 <0.010* 4121.69Test 2 700 121.49 0.027 0.367 <0.010* 4234.93Test 2 800 132.67 0.024 0.436 <0.010* 4565.77Test 2 900 126.10 0.024 0.467 <0.010* 4459.40Test 2 1000 161.68 0.021 0.649 <0.010* 5284.54 121200
T2T2T2T2T2T2
Table A-3 Leachate Experiment Results
* ( The "<" indicates that the concentration was below the method deteciton limit)
T2T2
T2T2T2T2T2T2
T2T2T2T2T2T2
T2T2T2T2T2T2
T1T1T1T1T1T1
T1T1T1T1T1T1
Se (mg/L) Sr (mg/L) Cl(mg/L)
T1T1T1
Replication Experiment Type
Vol. Leached (mL)
Ba(mg/L) Cd (mg/L) Pb(mg/L)

51
Test 1 100 7.31 0.007 <0.005* <0.010* 148.48Test 1 200 22.51 0.009 <0.005* <0.010* 610.54Test 1 300 25.02 0.010 0.011 <0.010* 740.04Test 1 400 46.90 0.022 0.023 <0.010* 1387.64Test 1 500 46.19 0.022 0.019 <0.010* 1368.01 39470Test 2 100 0.91 <0.002* <0.005* <0.010* 17.35Test 2 200 6.66 <0.002* <0.005* <0.010* 239.49Test 2 300 23.11 <0.002* 0.007 <0.010* 728.44Test 2 400 49.87 0.006 0.007 0.011 1564.56Test 2 500 55.43 0.007 0.010 <0.010* 1713.94Test 2 600 54.39 0.007 0.010 <0.010* 1646.48Test 2 700 62.83 0.009 0.018 <0.010* 1908.23Test 2 800 95.81 0.020 0.024 0.018 2811.79 50100
Control A** 100 2.14 <0.002* <0.005* 0.012 26.62Control A** 200 2.23 <0.002* <0.005* <0.010* 25.42Control A** 300 2.98 <0.002* <0.005* <0.010* 28.54Control A** 400 2.18 <0.002* <0.005* <0.010* 27.19Control A** 500 5.24 <0.002* <0.005* <0.010* 68.04Control A** 600 6.24 <0.002* 0.007 <0.010* 95.69Control A** 700 8.77 <0.002* <0.005* <0.010* 183.99 12220Control B** 200 0.67 <0.002* <0.005* <0.010* 14.42Control B** 300 0.70 <0.002* <0.005* 0.011 14.61Control B** 400 0.90 <0.002* <0.005* 0.012 4.26Control B** 500 0.95 <0.002* <0.005* <0.010* 6.74Control B** 600 0.97 <0.002* <0.005* 0.013 5.99Control B** 700 1.06 <0.002* <0.005* 0.011 4.66Control B** 800 1.42 <0.002* <0.005* <0.010* 7.41Control B** 900 1.35 <0.002* <0.005* <0.010* 6.47Control B** 1000 1.90 <0.002* <0.005* <0.010* 6.34 3020
**Control A and B were in the same round of replications and used the letter designation to differentiate the two experiments
Cl(mg/L)Experiment ExperimentType
Vol. Leached (mL)
Ba(mg/L) Cd (mg/L) Pb(mg/L)
T3T3
T3
* ( The "<" indicates that the concentration was below the method deteciton limit)
Table A-3 Leachate Experiment Results
T3T3T3T3T3T3
T3T3T3T3T3
T3T3T3T3T3
Se (mg/L) Sr (mg/L)
T3
T3
T3T3T3T3
T3T3T3T3

52
Appendix B
PSU AASL Flowback and Soil Analyses
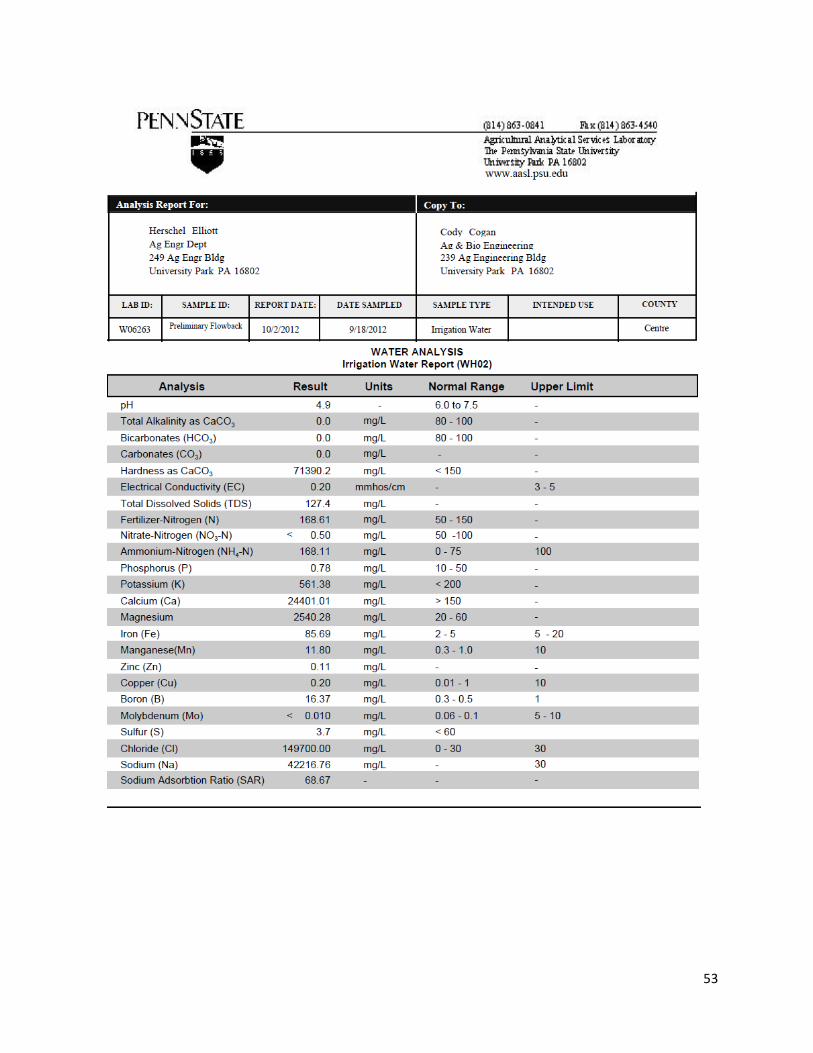
53
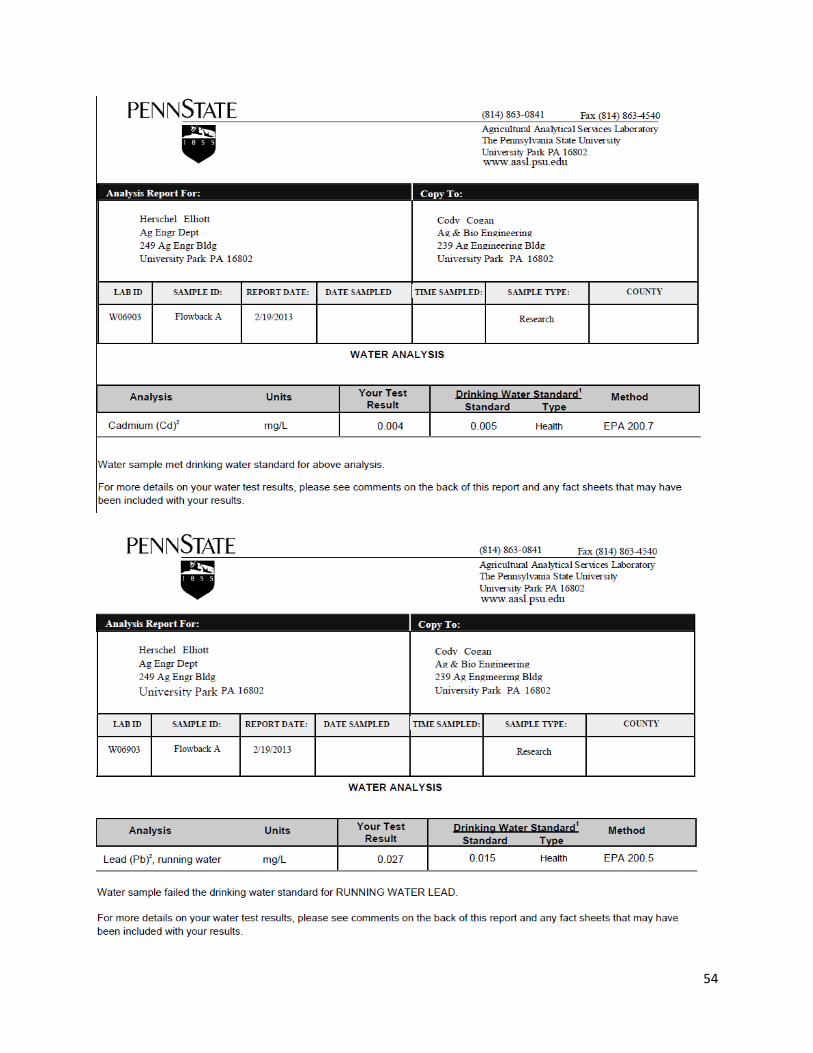
54

55
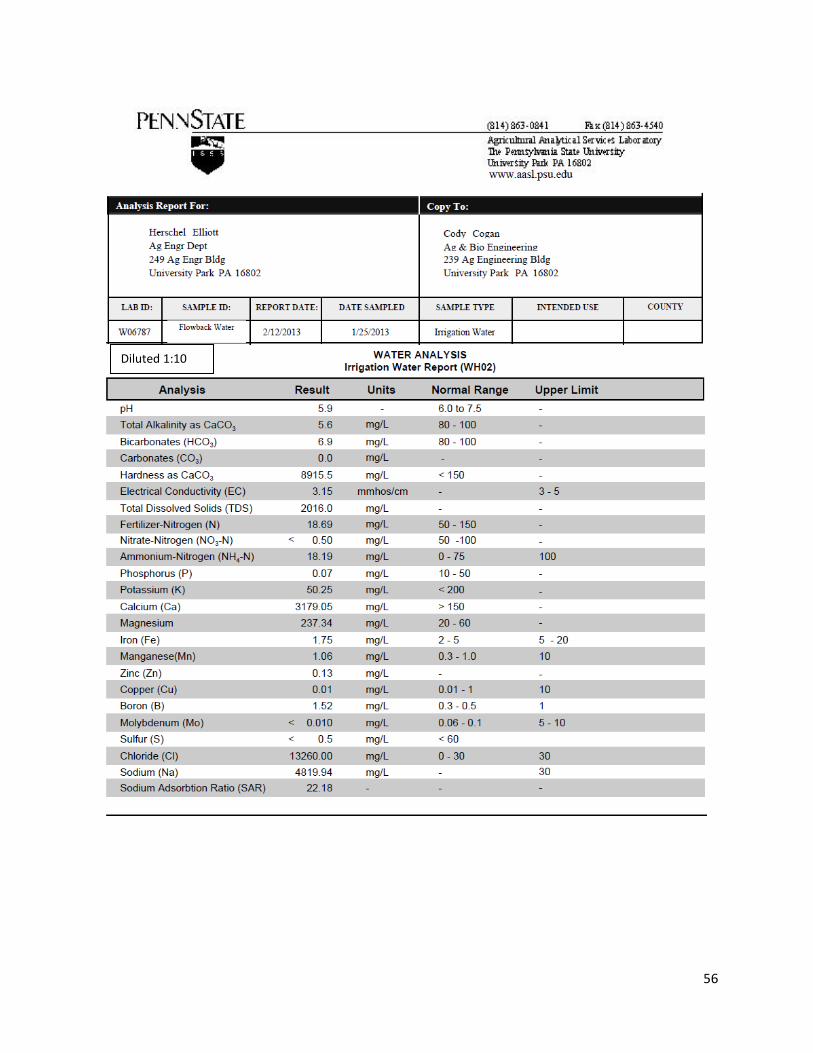
56
Diluted 1:10

57
Diluted 1:10
Soil Core Composite