
Round 1Round 2 Ultimate Question La Follette RooseveltWilson.

Policy Report
In the 1990s the main cash welfare program for single-parent families, Aidto Families with Dependent Children (AFDC), faced widespread criticism.
A common concern was that the structure of welfare meant that work did not“pay.” Those receiving AFDC typically also received several other benefits: allreceived Medicaid, almost all received Food Stamps, and many received ben-efits through other programs. Because most AFDC recipients would havereceived a fairly low wage in the labor market and because some of the ancil-lary benefits were not available to those who worked, the total package ofsupport provided many women on welfare was higher than the income theymight earn in the labor market. These incentives may have encouragedwomen to turn to welfare and contributed to long-term welfare use.
Several policy responses occurred, some designed to move women offwelfare altogether. The Personal Responsibility and Work OpportunityReconciliation Act of 1996 eliminated AFDC and replaced it with Tempo-rary Assistance for Needy Families (TANF), which instituted time limits forreceiving federal cash assistance and required most participants to work.
Policymakers enacted other changes later in the 1990s to increaseincome when women were in the labor market. For example, a substantialincrease in the Earned Income Tax Credit provided considerable benefits,but only to those with earnings. Funding for child-care assistance wasincreased. Moreover, some support programs were decoupled from AFDC,so that families could enroll in Medicaid (and later the State Children’sHealth Insurance Program) even when not receiving cash assistance.Finally, TANF was structured differently from AFDC so states could design
Robert M. La Follette School of Public Affairs Volume 15, Number 2, Fall 2005-Winter 2006
La Follette
Director’s Perspective
Hurricane response,
political scandals,
challenge public’s
trust in government
These are challenging times for peo-ple engaged with the public sector.
Allegations of political corruption in Washington, Wisconsin, and elsewhere have caused the public to question whether elected officialswho accept money from lobbyistscan act in the best interests of theirconstituents. Systemic failures ofpublic institutions, especially in theKatrina debacle, have shaken thepublic’s trust and confidence in thecompetence of government toaddress social ills. Neighborhood residents wonder if their city gov-ernment is competent to providepromised emergency services.
People are not sure whether thelevee will hold.
In This IssueWelfare Patterns after the Welfare Revolution . . . . . . . . . . . . 1
Ensuring a Minimum: Social Security Reform and Women . . . . 3
The Current Account Deficit:Causes and Challenges. . . . . . . . 16
Can Technology Reinvigorate CitizenParticipation? Lessons from the Digital Town Hall Meeting . . . 21
Welfare Patterns after the Welfare RevolutionMaria Cancian, Daniel R. Meyer, and Chi-Fang Wu
Maria Cancian is a professor with the La Follette School of Public Affairs and theSchool of Social Work at the University of Wisconsin-Madison, where she is alsodirector of the Institute for Research on Poverty. Daniel R. Meyer is a professorwith the School of Social Work at the University of Wisconsin-Madison. Chi-FangWu is an assistant professor with the School of Social Work at the University of Illinois at Urbana-Champaign. This paper is based on work conducted under a contractual agreement between the Wisconsin Department of Workforce Devel-opment and the Institute for Research on Poverty. Any views expressed here arethose of the authors and not necessarily those of the sponsoring institutions. Theauthors thank Dawn Duren and Jan Blakeslee for assistance with the manuscriptand colleagues at the Institute for Research on Poverty for their comments. Thispiece is drawn from the authors’ 2005 article in Social Work Research, “After theRevolution: Welfare Patterns Since TANF Implementation,” 29(4):199-214.
Perspective continued on page 9

and implement new policies and programs. Theyresponded with an array of innovations. Many of theseprograms were designed to move families off cashassistance and into work quickly and to provide themwith other supports such as child-care subsidies, accessto health insurance, and transportation services.
Have these policy changes affected welfare use?We know that AFDC/TANF caseloads declined dra-matically during the 1990s, from 14.4 million individ-uals in March 1994 to 5 million in September 2002.However, we know relatively little about the dynamicsand correlates of program participation in the “newworld of welfare.” Perhaps more important, in light ofthe new interest in the interactive effects of multipleprograms, we know even less about how families mayuse several programs simultaneously, even when theyare not receiving cash. This article addresses theseissues, using post-reform information on TANF, FoodStamps, and Medicaid in Wisconsin.
Policy and Research Context
Wisconsin’s Food Stamp and Medicaid programs aresimilar to those of other states. With the TANF blockgrant, states have substantial flexibility to design theirown programs. Wisconsin’s TANF program, Wiscon-sin Works (W-2), is similar to programs in many otherstates in that it emphasizes work first and tries tomove quickly those who receive cash benefits intoprograms in which they receive only services andwork supports. W-2 is structured as a program withfour tiers, with the idea that individuals will worktheir way up the tiers. The lowest tier is W-2 Transi-tions, for those least ready for employment; this pro-vides $628 per month in exchange for completing awork or “work-like” assignment. The next tier is aCommunity Service Job; this tier generally requiresgreater hours of participation and provides $673 amonth in exchange for completing a work assignmentin a community job. The top two tiers include no cashpayment, only work supports. An additional program,Caretaker of Newborn, provides $673 a month for thefirst 12 weeks of a child’s life.
Wisconsin’s TANF program has perhaps thestrongest emphasis on work of any state program. It isalso unusual in that it does not increase benefits forlarger families, and it generally does not allow partici-pants to have earnings from employment at the sametime as they are collecting cash benefits. But W-2includes a uniquely generous treatment of child sup-port payments that are generally disregarded in calcu-lating cash benefits. Another unusual feature isWisconsin’s State Children’s Health Insurance Program,BadgerCare, which is available to all types of low-income families and covers adults as well as children.
Because TANF programs differ across states,conclusions from a study of welfare participation in
any single state cannot be generalized to other states.Nevertheless, the substantial state flexibility and sig-nificant program changes associated with TANF makelearning from experiences in individual states increas-ingly important. Wisconsin’s work-first approach andmore stringent work requirements are, moreover,consistent with pending TANF reauthorization pro-posals. Understanding the implications of thisapproach for multiple-program participation may beof growing importance across the nation.
Much of the research on the dynamics and corre-lates of AFDC/TANF and on Food Stamps and Medi-caid comes from the pre-TANF period and thus maynot reflect the current situation. Very little workexamines multiple-program participation, an increas-ingly important issue given the time limits on cashassistance and widespread policy attempts to divertlow-income families from cash assistance to otherprograms. Thus this study makes two new contribu-tions. We provide current and detailed information on
The Robert M. La FolletteSchool of Public Affairs
University of Wisconsin–Madison1225 Observatory Drive
Madison, WI 53706(608) 262-3581
Fax: (608) [email protected]
www.lafollette.wisc.edu
StaffDonald A. Nichols . . . . . . . DirectorKaren Holden . . . . . . . . . . . Associate DirectorCraig Allan . . . . . . . . . . . . . Information Services CoordinatorJoanne Chapin . . . . . . . . . . Student Services CoordinatorKaren Faster . . . . . . . . . . . . Publications DirectorAndrew Lambert . . . . . . . . Information Technology SpecialistGregory Lynch . . . . . . . . . . Faculty AssistantMary Mead . . . . . . . . . . . . . Student ServicesBridget Pirsch. . . . . . . . . . . Outreach SpecialistBarbara Prigge . . . . . . . . . . Financial SpecialistAndrew Reschovsky . . . . . . Policy Report EditorKari Reynolds. . . . . . . . . . . AdministratorTerry Shelton . . . . . . . . . . . Outreach DirectorMary Woodward. . . . . . . . . Career Development Coordinator
Centers of the La Follette SchoolCenter for Research on the Wisconsin EconomyCenter for Wisconsin State, Local, and Tribal Governance
The La Follette School has cooperative relationships withCenter for World Affairs and the Global EconomyDepartment of Urban and Regional PlanningGaylord Nelson Institute for Environmental StudiesInstitute for Research on PovertyInternational InstituteLaw SchoolWisconsin Center for Education Research
The La Follette Policy Report is a semiannual publication of theRobert M. La Follette School of Public Affairs. The school is a non-partisan teaching and research department of the College ofLetters and Science at the University of Wisconsin–Madison. Theschool takes no stand on policy issues; opinions expressed in thesepages reflect the views of individual researchers and authors.
© 2006 Board of Regents of the University of WisconsinSystem and the Robert M. La Follette School of Public Affairs
2 La Follette Policy Report Fall 2005-Winter 2006
Welfare Patterns continued on page 10

Concerns about the risks associated with introducingindividual retirement accounts into Social Security
and the problems with the current family benefit struc-ture have prompted politicians and academics to sug-gest the reintroduction of a minimum benefit intoSocial Security. Older women are a cause for concern,and an impetus for reform, because Social Securitycomprises 60 percent of their income, and all incomefor one in five women. Moreover, 12 percent of olderwomen compared to 7 percent of older men are poor
Yet, while significant attention is paid to the gen-der gap in poverty, even more striking are the povertygaps among women. Approximately 25 percent ofelderly African-American women live below thepoverty line compared to 11 percent of white olderwomen. Relative to 4 percent of older marriedwomen, 20 percent of unmarried older women arepoor. A new minimum benefit would affect thesewomen most because they rely most heavily on SocialSecurity for retirement income.
But how should minimum benefits be constructed?This study examines the three most common propos-als. Each option reflects a larger ideological presump-tion about how the welfare state should distributebenefits. Should policies target certain groups or beuniversal and available to all residents? One minimumbenefit is tightly targeted to the employed poor, onelies in the middle of the continuum requiring 10 earn-ings years, whereas the last is universal and requiresonly residency in the United States. The ways in whichthese proposals would affect the benefits of womenreaching age 62 between 2020 and 2030 are evaluated.Given that benefit adequacy (protecting the neediestbeneficiaries) is arguably Social Security’s mostimportant goal, this analysis centers on how thereforms affect Social Security’s progressiveness. Butattention is also paid to how these proposals affectprogram costs and benefit equity, i.e., the tie betweenan individual’s contribution to the program throughher employment and the benefits she ultimatelyreceives. This link between earnings and benefits hashelped keep Social Security popular.
The Theoretical Background
Should policies be targeted or universal? Should onlytargeted groups be eligible? Or should all residents beeligible? Income guarantees, under which minimum
benefits fall, vary in the extent to which they are tar-geted or universal. The minimum benefit accompany-ing proposals to privatize Social Security targets theemployed poor by requiring 40 earnings years to qual-ify for a poverty-level benefit. At the other extreme,minimum benefits are distributed universally, whereall residents are eligible and no earnings history isrequired for eligibility. This is common to the Swedishwelfare state, and some argue should be adopted bythe United States. Countries that have more universalpolicies have lower poverty rates than countries withtargeted policies. Others argue that universalism isinefficient, distributing resources to many people whodo not need them.
This study explores how these approaches to min-imum benefits would affect the progressiveness ofwomen’s benefits. Universal approaches are oftenbeneficial for women because they work and earn lessas a result of workplace discrimination and their dis-proportionate responsibility for raising children. Butwould a universal benefit simply prove to be a boonfor wealthy women who do not need to work? In con-trast, would targeted approaches be enough of a boonfor poor women? Do poor women work enough toqualify for a benefit that requires 40 earnings years?Many argue that poor mothers face significant diffi-culties balancing work and family. Their low-payingjobs fail to provide them the money, time, and flexi-bility to meet conflicting demands, thus often forcingthem out of work altogether.
To lend insights into these questions and issues—that is, the ramifications of targeted versus universal—each proposal represents a point on the targeted-uni-versal continuum. But before detailing the proposals,this study examines how minimum benefits ended upon the Social Security reform agenda in the first place.
The Policy Background
Social Security’s minimum benefit, first added in1939, was eliminated in the 1981 Social Securityamendments for budgetary reasons amid claims thatit was benefiting housewives and individuals with lim-ited work histories.
Amendments to the program in 1972 institutedtwo measures to protect the low-income elderly popu-lation, but each has serious shortcomings. The firstwas a special minimum benefit for which few qualify
Fall 2005-Winter 2006 La Follette Policy Report 3
Ensuring a Minimum: Social Security Reform and WomenPamela Herd
The author joined the La Follette School of Public Affairs in fall 2005 as an assistant professor of public affairs andsociology. A more detailed version of this paper appears in The Gerontologist, volume 45, number 1, copyright TheGerontological Society of America. It is reproduced by permission of the publisher. It is part of a larger work to appearin Social Forces as “Reforming a Breadwinner Welfare State: Gender, Race, Class, and Social Security Reform.”

because it requires such a long, low earnings history.The second created Supplemental Security Income toprovide a safety net for poor elderly and disabled peo-ple. However, federal benefits are below the povertyline (though some states supplement them), paymentsare reduced significantly if the recipient lives withsomeone, and only a few thousand dollars are allowedin savings. About half of those eligible for Supple-mental Security Income receive benefits.
Reintroduction of a minimum benefit was sug-gested in the late 1990s when privatization proposalswere gaining credibility. Critics of partial privatizationargued that individual accounts would reduce benefitadequacy. As payroll taxes are shifted to individualaccounts, there is no opportunity for redistribution ofthe resources within individual accounts from high-earner to low-earner beneficiaries, many of whom arewomen. Further, a bear market would hurt those whorely primarily on Social Security as their retirementincome. Proponents of privatization responded byincluding a minimum benefit within their proposals.
Calls to reintroduce a minimum benefit have notonly accompanied partial privatization proposals.Since the 1970s they have been mentioned in debatesabout how to “update’’ spousal and survivor benefits.Currently, individuals receive contributory benefits asworkers, based on their highest 35 earnings years, ornon-contributory benefits as the wives and widows ofworkers, which require no earnings history. Awoman’s spousal benefit is half her husband’s workerbenefit, and, should he die, her survivor benefit is 100percent of his benefit. Two-thirds of women receivefamily benefits, and women comprise 98 percent offamily benefit recipients. Under this “breadwinnerbenefit,” the women who fare best are married andare never employed. Of course, very few women fallinto this category today. Noncontributory benefitsaim to improve benefit adequacy by subsidizing mar-ried women’s exits from work. In contrast, while theworker benefit is progressive, replacing a higher per-centage of income for low earners, it places a heavieremphasis on benefit equity by tying eligibility andbenefit levels to earnings.
While the current critique of breadwinner familybenefits is that they have not kept up with changes inthe American family, including more women workingand fewer women marrying, one overlooked problemis that spousal and survivor benefits cannot protectmany poor American women. This is particularly truefor many unmarried mothers, who comprise a grow-ing proportion of the population; the percentage ofsingle mothers rose from 12 percent in 1970 to 26 per-cent in 2000. Those who most need the supplementaryincome, poor, and African-American women, are lesslikely to marry and be eligible for noncontributorybenefits. Spousal benefits also offset the progressiveworker benefit. Because they require no earnings his-tory, a woman who worked in low-wage jobs for mostof her life may receive a smaller benefit than a womanwho was never employed but whose husband had sub-stantial earnings. Many African-American and poorwomen, who are more likely to be employed, are effec-tively subsidizing the noncontributory benefits ofupper-income women who do no paid work.
Reform Options
There are three general approaches to reformingwomen’s benefits: altering spousal and survivor bene-fits to better protect unmarried women; introducingcare credits to reward women for raising children;and introducing a minimum benefit. Each of thesegeneral options, in turn, could be implemented innumerous ways. Given the range of potential reforms,this article examines only minimum benefits based onthe three most common reform proposals. Each pro-posal falls along the targeted-universal continuumand addresses some of the problems discussed above.Table 1 provides an overview of each policy proposal.
Privatization MinimumThe first proposal, Privatization Minimum, targets theemployed poor. The proposal, which has gained atten-tion through its association with privatization propos-als, attempts to enhance benefit adequacy with aminimum benefit that maintains a strong emphasis
Table 1: Description of Three Policy Proposals to Reform Social Security
Policy Option Eligibility Monthly Benefit Size Cost Offset Targeted vs. Universal
60 percent of poverty level Privatization Those who work for those working at least 20 years; None TargetedMinimum 20 to 40 years up to 100 percent of poverty level ($751)
for those working at least 40 years
Worker Those who work Poverty level for Eliminate Partially universalMinimum minimum of 10 years single elderly person ($751) spousal benefits
Resident Any U.S. citizen $545 Eliminate UniversalMinimum or resident spousal benefits
4 La Follette Policy Report Fall 2005-Winter 2006
on benefit equity. Despite this emphasis on equity, thereform does not alter noncontributory marital statusbenefits, which have no link between an individual’semployment history and benefit. It requires 20 earn-ings years to guarantee a benefit equal to 60 percentof the poverty line. For each additional year the bene-fit rises 2 percentage points until 40 earnings yearswhere the benefit equals the poverty line. The gen-erosity of the minimum will ultimately determinehow women fare. For example, wage indexing thepoverty level would produce a higher number of ben-efit gainers than will this proposal.
The next two minimum benefits move away frombreadwinner family benefits by eliminating noncon-tributory spousal benefits and shifting these revenuesto subsidize the costs of minimum benefits that aremore universal than the Privatization Minimum.
Worker MinimumThis proposal is neither targeted nor exactly univer-sal. The Worker Minimum reintroduces the minimumbenefit eliminated in 1981 but makes it more gener-ous. Eligibility requires 10 years of earnings, the qual-ification for the Social Security worker benefit. Thebenefit equals the federal poverty level, which in 2001was $751 a month for one-person households with ahead age 65 or older. Spousal benefits are eliminated.
Resident MinimumThe Resident Minimum proposal is universal. Anyolder U.S. resident is eligible. Unlike the Worker Min-imum, eligibility for Social Security is not required.The benefit is set at the federal Supplemental SecurityIncome level, which was $531 a month in 2001.Spousal benefits are eliminated.
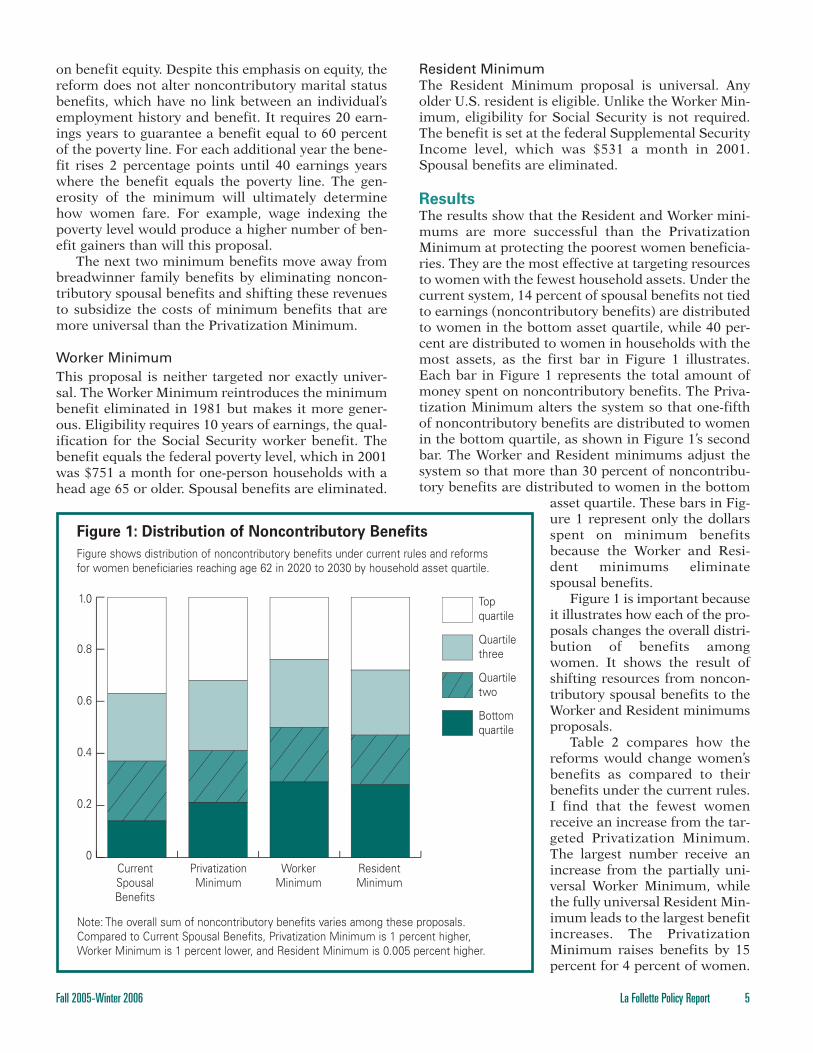
ResultsThe results show that the Resident and Worker mini-mums are more successful than the PrivatizationMinimum at protecting the poorest women beneficia-ries. They are the most effective at targeting resourcesto women with the fewest household assets. Under thecurrent system, 14 percent of spousal benefits not tiedto earnings (noncontributory benefits) are distributedto women in the bottom asset quartile, while 40 per-cent are distributed to women in households with themost assets, as the first bar in Figure 1 illustrates.Each bar in Figure 1 represents the total amount ofmoney spent on noncontributory benefits. The Priva-tization Minimum alters the system so that one-fifthof noncontributory benefits are distributed to womenin the bottom quartile, as shown in Figure 1’s secondbar. The Worker and Resident minimums adjust thesystem so that more than 30 percent of noncontribu-tory benefits are distributed to women in the bottom
asset quartile. These bars in Fig-ure 1 represent only the dollarsspent on minimum benefitsbecause the Worker and Resi-dent minimums eliminatespousal benefits.
Figure 1 is important becauseit illustrates how each of the pro-posals changes the overall distri-bution of benefits amongwomen. It shows the result ofshifting resources from noncon-tributory spousal benefits to theWorker and Resident minimumsproposals.
Table 2 compares how thereforms would change women’sbenefits as compared to theirbenefits under the current rules.I find that the fewest womenreceive an increase from the tar-geted Privatization Minimum.The largest number receive anincrease from the partially uni-versal Worker Minimum, whilethe fully universal Resident Min-imum leads to the largest benefitincreases. The PrivatizationMinimum raises benefits by 15percent for 4 percent of women.
Fall 2005-Winter 2006 La Follette Policy Report 5
Figure 1: Distribution of Noncontributory Benefits
Figure shows distribution of noncontributory benefits under current rules and reforms for women beneficiaries reaching age 62 in 2020 to 2030 by household asset quartile.
1.0
0.8
0.6
0.4
0.2
0
Topquartile
Quartilethree
Quartiletwo
Bottomquartile
Current Privatization Worker ResidentSpousal Minimum Minimum MinimumBenefits
Note: The overall sum of noncontributory benefits varies among these proposals.Compared to Current Spousal Benefits, Privatization Minimum is 1 percent higher, Worker Minimum is 1 percent lower, and Resident Minimum is 0.005 percent higher.
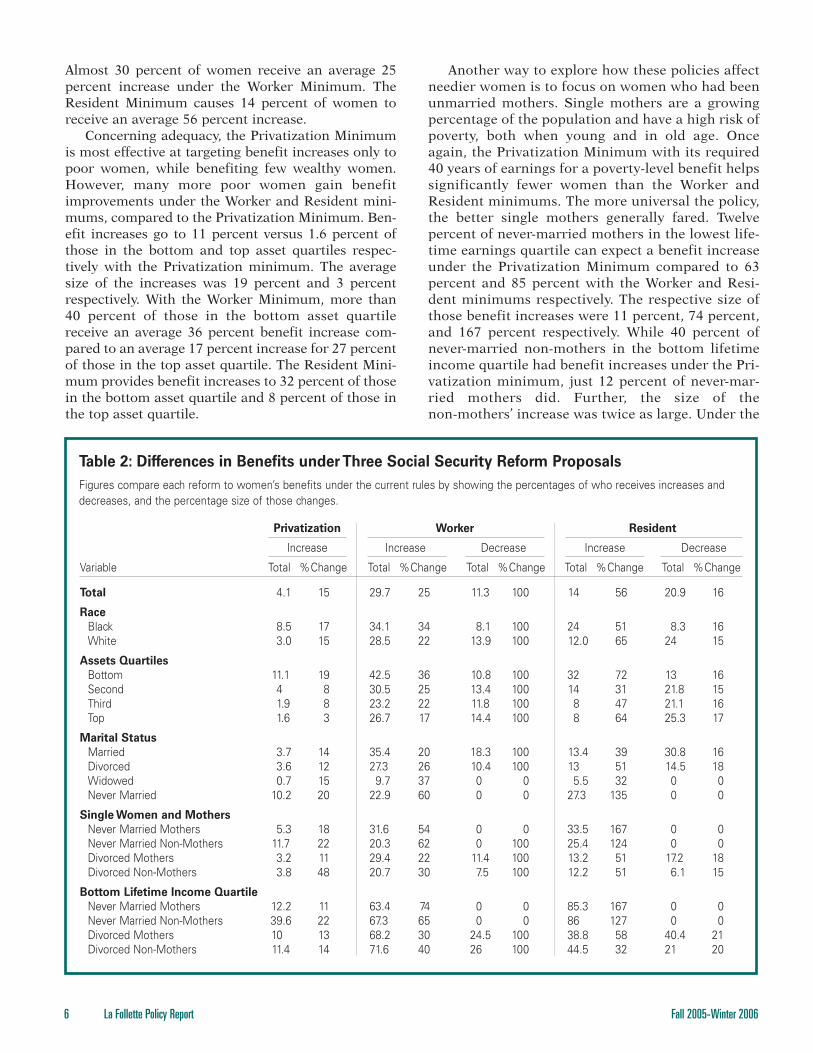
Almost 30 percent of women receive an average 25percent increase under the Worker Minimum. TheResident Minimum causes 14 percent of women toreceive an average 56 percent increase.
Concerning adequacy, the Privatization Minimumis most effective at targeting benefit increases only topoor women, while benefiting few wealthy women.However, many more poor women gain benefitimprovements under the Worker and Resident mini-mums, compared to the Privatization Minimum. Ben-efit increases go to 11 percent versus 1.6 percent ofthose in the bottom and top asset quartiles respec-tively with the Privatization minimum. The averagesize of the increases was 19 percent and 3 percentrespectively. With the Worker Minimum, more than40 percent of those in the bottom asset quartilereceive an average 36 percent benefit increase com-pared to an average 17 percent increase for 27 percentof those in the top asset quartile. The Resident Mini-mum provides benefit increases to 32 percent of thosein the bottom asset quartile and 8 percent of those inthe top asset quartile.
Another way to explore how these policies affectneedier women is to focus on women who had beenunmarried mothers. Single mothers are a growingpercentage of the population and have a high risk ofpoverty, both when young and in old age. Onceagain, the Privatization Minimum with its required40 years of earnings for a poverty-level benefit helpssignificantly fewer women than the Worker andResident minimums. The more universal the policy,the better single mothers generally fared. Twelvepercent of never-married mothers in the lowest life-time earnings quartile can expect a benefit increaseunder the Privatization Minimum compared to 63percent and 85 percent with the Worker and Resi-dent minimums respectively. The respective size ofthose benefit increases were 11 percent, 74 percent,and 167 percent respectively. While 40 percent ofnever-married non-mothers in the bottom lifetimeincome quartile had benefit increases under the Pri-vatization minimum, just 12 percent of never-mar-ried mothers did. Further, the size of thenon-mothers’ increase was twice as large. Under the
6 La Follette Policy Report Fall 2005-Winter 2006
Privatization Worker Resident
Increase Increase Decrease Increase Decrease
Variable Total %Change Total %Change Total %Change Total %Change Total %Change
Total 4.1 15 29.7 25 11.3 100 14 56 20.9 16
Race
Black 8.5 17 34.1 34 8.1 100 24 51 8.3 16White 3.0 15 28.5 22 13.9 100 12.0 65 24 15
Assets Quartiles
Bottom 11.1 19 42.5 36 10.8 100 32 72 13 16Second 4 8 30.5 25 13.4 100 14 31 21.8 15Third 1.9 8 23.2 22 11.8 100 8 47 21.1 16Top 1.6 3 26.7 17 14.4 100 8 64 25.3 17
Marital Status
Married 3.7 14 35.4 20 18.3 100 13.4 39 30.8 16Divorced 3.6 12 27.3 26 10.4 100 13 51 14.5 18Widowed 0.7 15 9.7 37 0 0 5.5 32 0 0Never Married 10.2 20 22.9 60 0 0 27.3 135 0 0
Single Women and Mothers
Never Married Mothers 5.3 18 31.6 54 0 0 33.5 167 0 0Never Married Non-Mothers 11.7 22 20.3 62 0 100 25.4 124 0 0Divorced Mothers 3.2 11 29.4 22 11.4 100 13.2 51 17.2 18Divorced Non-Mothers 3.8 48 20.7 30 7.5 100 12.2 51 6.1 15
Bottom Lifetime Income Quartile
Never Married Mothers 12.2 11 63.4 74 0 0 85.3 167 0 0Never Married Non-Mothers 39.6 22 67.3 65 0 0 86 127 0 0Divorced Mothers 10 13 68.2 30 24.5 100 38.8 58 40.4 21Divorced Non-Mothers 11.4 14 71.6 40 26 100 44.5 32 21 20
Table 2: Differences in Benefits under Three Social Security Reform Proposals
Figures compare each reform to women’s benefits under the current rules by showing the percentages of who receives increases anddecreases, and the percentage size of those changes.
Worker and Resident minimums single mothersfared relatively equally or even better than non-mothers.
Two of the proposals lead to benefit decreases.The Worker and Resident minimums eliminate non-contributory spousal benefits and shift thoseresources, in theory, toward poorer women. Underthe Worker and Resident minimums, 11 percent and21 percent of women, respectively, receive benefitcuts. The Worker Minimum generates the largest cutsbecause it requires at least 10 years of earnings toreceive the $751 benefit; otherwise no benefit isreceived. About 11 percent of women who reach age62 from 2020 through 2030 would be ineligible forthe Worker Minimum. Almost 90 percent of them aremarried, and 57 percent are in the top two asset quar-tiles. Only married and divorced women receivespousal benefits and have cuts. Further calculationsshow, overall, 5 percent of women in the bottom twoasset quartiles lose their Social Security benefits alto-gether, though they could draw on SupplementalSecurity Income.
The cuts under the Resident Minimum are not assevere as cuts under the Worker Minimum becauseeveryone receives a minimum $545 benefit. The aver-age benefit cut is 16 percent. The highest spousal ben-efit is $830; thus one could not lose more than $285.Approximately 13 percent of those in the bottom asset
quartile received an average 16 percent benefit cut,which is problematic because they likely have littleincome outside of Social Security. Nonetheless, 32percent of women in the bottom asset quartile wouldreceive an average 72 percent increase in their benefitunder the Resident Minimum.
All of the previous analyses are descriptive and donot control for more than two background factors ata time. In thinking about adequacy and equity issues,however, a useful comparison is between a singlemother in a low-asset household with high employ-ment and a married mother with limited employ-ment in a high-asset household. Older women who had been single mothers are of particular con-cern given their high rates of poverty and becausetheir numbers are growing. The precise estimatesdiscussed here are less important than the generaldifferences between the proposals that they convey.The low-asset, never-married working mother has a 76 percent probability of receiving a benefitincrease under the Worker Minimum and a 57 percent probability under the Resident Minimum,compared to a 12 percent probability under the Pri-vatization Minimum. Thus, she fares much betterunder the Resident and Worker minimums com-pared to the Privatization Minimum. She has noprobability of receiving a benefit decrease underany of these proposals.
Fall 2005-Winter 2006 La Follette Policy Report 7
The policy simulation is carried out with the1992 Health and Retirement Study (HRS) with
restricted-access administrative Social Securityearnings data and the Current Population Survey.The HRS is a nationally representative longitudinalstudy of Americans and their spouses born between1931 and 1941. The sample for this study includesage-eligible women in Wave 1 of the HRS, butexcludes women without Social Security adminis-trative records because these are essential to createSocial Security benefits. Weights were used toadjust for survey design as well as to account forthese women. The final sample was 3,427 women.To simulate how women who reach the age of 62between 2020 and 2030 would fare under the threeproposed minimum benefits, I created weightsbased on the Current Population Survey.
Benefits were calculated based on retirement atage 62 without adjusting for benefit reductions nor-mally associated with early retirement because thepoint is to consider women’s options rather thantheir choices. Because the study’s goal is to evaluaterelative outcomes, their benefits must be compara-ble. The major limitation of this study is that 100percent certainty about the benefits of younger
women cannot be achieved until these women actu-ally reach the eligibility age for Social Security. Thesimulation provides an educated estimate. The like-liest error to result from this approach is that thepercentage of women who had no benefit change isunderestimated because the wages of women haveimproved between the HRS cohort and youngercohorts of women. Younger cohorts of women havehigher earnings and may be less likely to rely on anyform of noncontributory benefits. Therefore, theseestimates are strongest when thinking about the dif-ferences among women, i.e., how married womenfare relative to unmarried women.
Finally, a more general and conceptual issuewith this study is that only minimum benefits areanalyzed as a way to reform Social Security’s fam-ily benefits. Other reform suggestions haveincluded altering spousal and widow benefits tobetter protect divorced women or rewarding par-ents with “care credits.” Other analyses conductedby this author show that more universal minimumbenefits (i.e. the Worker and Resident minimums)are more progressive, in terms of benefiting thepoorest women, than are care credits or improve-ments to spousal and widow benefits.
Methods, Data, and Limitations

A married mother in a high-asset household who israrely employed has less than a 1 percent probabilityof benefit increase under the Privatization Minimumand a 6 percent and 12 percent probability of increasewith the Worker and Resident minimums, respec-tively. She has a significant probability of benefitdecrease under the Worker (61 percent) and Resident(39 percent) minimums. This demonstrates how theWorker and Resident reforms shift noncontributoryspousal benefits from women like the high-asset, mar-ried mother who is rarely employed toward the poor,working, never-married mother.
Recent proposals to reform Social Security are dri-ven by the program’s perceived budgetary problems. Itis therefore important toaccount for budgetary impli-cations. The elimination ofspousal benefits ensuredthat all three proposalswould raise benefits lessthan 2 percent. And, overallgovernment costs may riseless given the elimination ofthe Supplemental SecurityIncome Program under theResident and Worker mini-mum proposals.
Average changes in benefits are meant to be illus-trative of these proposals’ relative costs. Behavioralchanges that might result from these reforms are nottaken into account, which is common for policy sim-ulations. Nonetheless, minimum benefits that requireno or limited employment could reduce employment,particularly just before retirement. But because cur-rent spousal benefits require no employment, theirelimination combined with the introduction of mini-mum benefits would likely lead to no overall changein employment incentives for married and formerlymarried women. However, these minimums couldreduce incentives for labor force participation formen and those who never marry as compared to thecurrent system.
DiscussionConcerns with individual accounts and problems withfamily benefits, as well as high poverty rates amongsubgroups of women, have prompted politicians andacademics to suggest implementing a minimum ben-efit into Social Security. This study sheds light on howthe three most common proposals would affect theprogressiveness of older women’s benefits. The tightlytargeted Privatization Minimum, which requires 40years of earnings for a poverty-level benefit, is signifi-cantly less successful at improving Social Security’sadequacy goals than the more universal Worker andResident minimums, which require 10 earnings yearsand U.S. residency, respectively, for eligibility.
The Worker and Resident minimums shift themoney spent on noncontributory spousal benefits,which most heavily benefit upper-income women,toward more generous minimums that benefit poorwomen. Poor women were also less likely to benefit,and received smaller increases, from the Privatiza-tion Minimum, than the Resident and Worker mini-mums. Ultimately, most women, even poor womenwho are more likely to work, cannot muster 40 yearsof earnings largely due to their disproportionateresponsibility for raising children. Universal policiesare beneficial to women for this very reason.
Using funds once spent on spousal benefits toimplement a minimum benefit has not been seriously
considered, but in a budget-driven policy debate thiscould be a viable alternative.Spousal benefits are mostbeneficial for marriedwomen with high-earningspouses. But, the elimina-tion of spousal benefits doescause some women toreceive lower benefits. Mostwomen with limited meansface no benefit reduction,
but some women with limited assets, particularlydivorced women, receive smaller benefits than theywould have under the current benefit rules. Thosereceiving benefit cuts are safest under the ResidentMinimum because their benefit cannot go below $545.
In contrast, under the Worker Minimum, thosewithout 10 years of earnings could receive no benefitwhatsoever. Ideally, all beneficiaries should have anadequate benefit. But resources are limited. Noncon-tributory benefits should be distributed more equallyamong women. Should a divorced mother who neverworked have an $830 benefit while a never-marriedmother who did low-wage intermittent work have a$400 benefit? By eliminating spousal benefits andinstituting a more universal minimum benefit, welevel the playing field for these two women.
Some may argue that spousal benefits subsidizewomen who stay at home to raise children. Women do“work” for these benefits. But spousal benefits are nota reward for raising children, one need not have chil-dren to receive them, and many single parents willnever access them. It is an indirect approach to reward-ing parents that does not reward all parents. Moreover,women are rewarded differently depending on howmuch their husbands earn. One could argue minimumbenefits are a more equitable way to distribute benefitsthat are unassociated with earnings and indirectly ben-efit parents who took significant chunks of time out ofemployment than are spousal benefits.
Another concern is how the Worker and Resi-dent minimums would affect work incentives. The
8 La Follette Policy Report Fall 2005-Winter 2006
Using funds once spent on spousal
benefits to implement a minimum
benefit has not been seriously
considered, but in a budget-driven
policy debate, this could be a viable
alternative.

Fall 2005-Winter 2006 La Follette Policy Report 9
A democratic society is based on the precept that elected officials willpursue society’s goals. The peopletrust that these officials will act in the public interest. Without this publictrust, democracy cannot last.
The people also expect compe-tence. They will trust their public insti-tutions to do the right thing if thepolicymakers running the institutionsact when problems arise, makesound decisions, and spend publicmoneys judiciously.
Belief in the Democratic Process
Listening to the public and then acting on what the people say is anessential component of the publictrust. As Donald Moynihan describesin his piece on digital town halls, technology offers new ways to givethe public a stronger voice in how its members want their society tooperate and allocate resources.
A stronger voice in governance willincrease public participation, which, in turn, should increase the level oftrust in public officials and the institu-tions they operate. By acting—at leastin part—on public input, officialsdemonstrate that they respect what
the public is saying and that the people can participate in governingtheir society beyond casting a ballot.
Belief in the Competence
of Government
Here at the La Follette School, ourfaculty, staff, and students engageregularly with policymakers at all levels of government. Our expertsoffer many solutions to troublesomeproblems—including possibilities for reforming Social Security andreducing fiscal deficits. We respondto policymakers and to members of the public when they ask us foranalysis, such as how welfare use has changed since the reforms of the late 1990s. Society’s problemsform our research agenda.
Our faculty work with policymakersand members of the public to craftsolutions to these problems. Throughour interactions with members of thepublic, and with local, state, and federal officials—some of whom areLa Follette alumni—we on the facultyhave come to believe that membersof the public can trust most of itsgovernmental institutions. And as our students train to become policy
analysts and public managers, theysee the competence and integrity ofprofessionals in the field. Through thispublic engagement, our scholars—themselves part of the public sectorby virtue of their employment withour state’s flagship land-grant university—reinforce the public trust.
Those in government, whetherelected or hired, should be able to trust policy recommendations that have been through a university’sresearch grinder. Our role in rebuildingthe public’s trust in democracy is notto abuse the public’s trust in ourobjectivity. Those outside the academyshould be able to see the usefulnessof a public research institution and tovalue its contributions. La Follette’sinteractions with the public go a longway in strengthening the public’s trustin government.
Members of the public should trustthemselves and their ability to govern.While repairs will take time, work,and investment, I believe the leveeswill hold.
Director’s Perspective continued from page 1
Worker Minimum would improve work incentivesfor married women, relative to spousal benefits,because they require some earnings history forreceipt. The Resident Minimum, like spousal bene-fits, would require no earnings history. But elimi-nating spousal benefits means someone without anemployment history would not receive a higherbenefit than someone with an employment history.The downside is that under both reforms an indi-vidual who does less paid work than another mayreceive an equivalent benefit. Moreover, more peo-ple would be eligible for the Worker and Residentminimum benefits than were eligible for spousalbenefits, so they would reduce overall employmentincentives.
Some may argue that altering Supplemental Secu-rity Income is the best way to improve benefits forthe poorest elderly Americans. But less than half ofthose eligible for Supplemental Security Incomereceive benefits. It does not reach all of the neediest
elderly Americans. Systems that combine a minimumbenefit with an earnings-related benefit are mosteffective at reducing poverty. Means-tested benefits,like Supplemental Security Income, generally cannotgenerate the broad support that a more universalsocial insurance program like Social Security gener-ates. Having a minimum benefit within Social Secu-rity shifts resources toward the needy within apopular, mostly universal program.
In terms of implementing targeted or more univer-sal minimum benefits, targeting may reduce waste,but it fails to protect many needy beneficiaries. Uni-versal approaches may benefit some who do not needthem, but they catch almost everyone who does. Ulti-mately, more universal minimum benefit proposalsbest meet the goal of benefit adequacy. And whilesome will query whether such proposals are politicallyviable, before politicians, policymakers, and Americancitizens decide what is politically viable, the researchthat explains all of the options must be there.
program participation in the post-TANF period, andwe examine multiple programs and the factors associ-ated with multiple-program use.
Data and MethodsWe use data from Wisconsin administrative records,Client Assistance for Re-employment and EconomicSupport, and Unemployment Insurance for September1997 to August 2001. These data provide monthly infor-mation on the receipt and level of cash welfare benefit,Food Stamp, and Medicaid or State Children’s HealthInsurance Program participation. They also provideinformation on welfare history and demographic char-acteristics (e.g., work experience, earnings, education,marital status, race, number of children, and familycomposition). Unemployment Insurance data containquarterly earnings records for individually coveredworkers that allowed us to track work records and earn-ings of W-2 participants over time. We studied 22,552women, all the female participants who entered Wis-consin’s TANF program (W-2) during its first year ofimplementation (from September 1, 1997, to August 31,
1998). We excluded 698 cases in which a father was des-ignated as the case head because we expected patternsof program use to differ. We followed each woman forat least 36 months after entry.
ResultsOur results examine patterns and correlates of benefit usein individual programs. We present statistics on partici-pation when the three programs are considered simulta-neously, then explore survival analyses and the number oftimes women return to and leave welfare in the multiple-program context. Finally, we provide information onchild-care subsidies and the Earned Income Tax Credit.
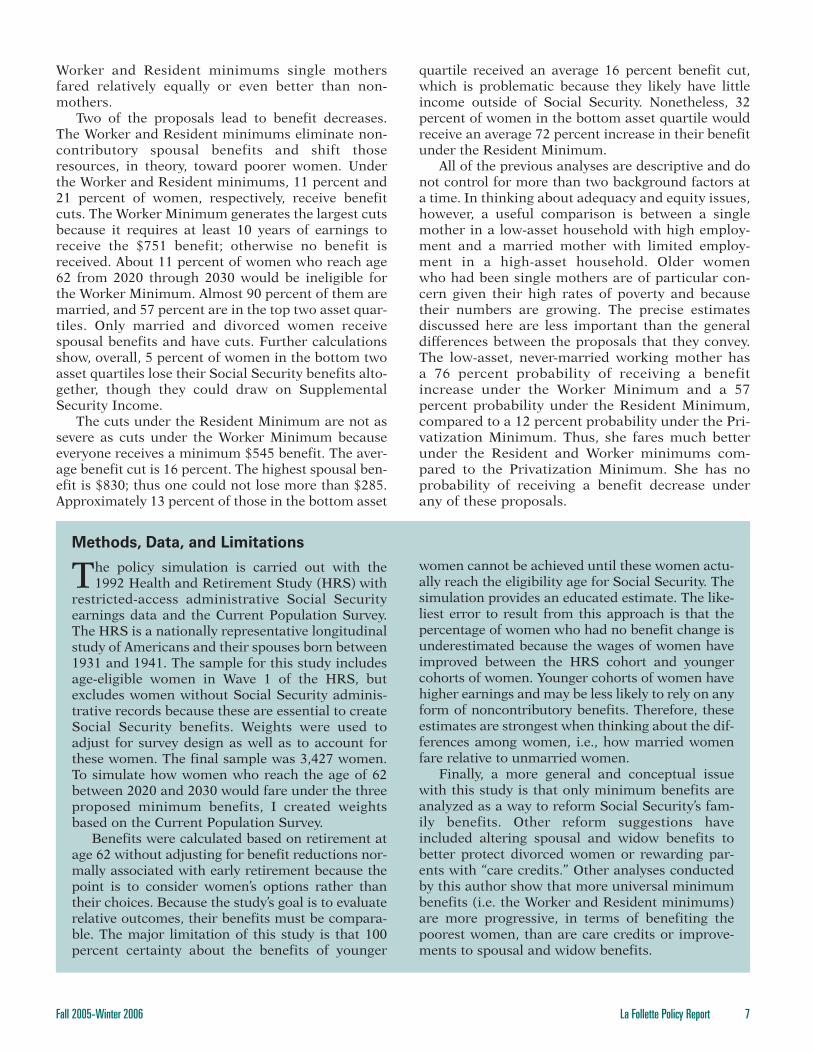
Patterns of Benefit Use in Individual ProgramsFigure 1 illustrates program participation in TANF,Food Stamps, and Medicaid during 36 months. Medi-caid participation fell fairly steadily throughout theperiod (top line), but even 36 months after participantsentered TANF, 73 percent of families had at least oneperson covered by Medicaid. Food stamp receipt alsostarted high and fell quickly, before leveling out at
10 La Follette Policy Report Fall 2005-Winter 2006
100
90
80
70
60
50
40
30
20
10
01 2 3 4 5 6 7 8 9 10 11 12 13 14 15 16 17 18 19 20 21 22 23 24 25 26 27 28 29 30 31 32 33 34 35 36
Number of Months after Entering Program
Perc
en
tag
e o
f P
art
icip
an
ts R
em
ain
ing
in
Pro
gra
m
Figure 1: Program Participation in Cash Benefits, Food Stamps, and Medicaid
This is based on 22,552 participants in Wisconsin Works (W-2), the state’s Temporary Assistance for Needy Families program.
W-2 cash benefits recipientsFood Stamps participantsMedicaid participants
Welfare Patterns continued from page 2
Fall 2005-Winter 2006 La Follette Policy Report 11
about 50 percent two to three years later. Cash assis-tance likewise began high—about 85 percent of allwomen entered in one of the W-2 tiers that provides acash payment—but then fell steeply: less than a thirdof participants were receiving cash benefits a yearlater, and only 12 percent of participants by the thirdyear after entry. Perhaps the relatively high participa-tion in Food Stamps and Medicaid is not surprising, given the fairly low earnings of most TANFparticipants, even after they left cash assistance. Theseresults are generally comparable to national figures ofprogram participation.
Examining the total number of months each indi-vidual received benefits during our three-year period,we find that most participants received cash assis-tance for fairly short periods: about one-third of par-ticipants received cash payments for one to sixmonths, and 8 percent never received cash payments.Long-term use was uncommon: fewer than 5 percentof participants received cash benefits for longer than30 months. This is in strong contrast with Medicaidand Food Stamp participation during the three-yearperiod. Two-thirds of cases received Medicaid benefitsfor more than 30 months, and more than 40 percent
of participants received Food Stamp benefits for morethan two years, whereas short-term use of either pro-gram was relatively uncommon.
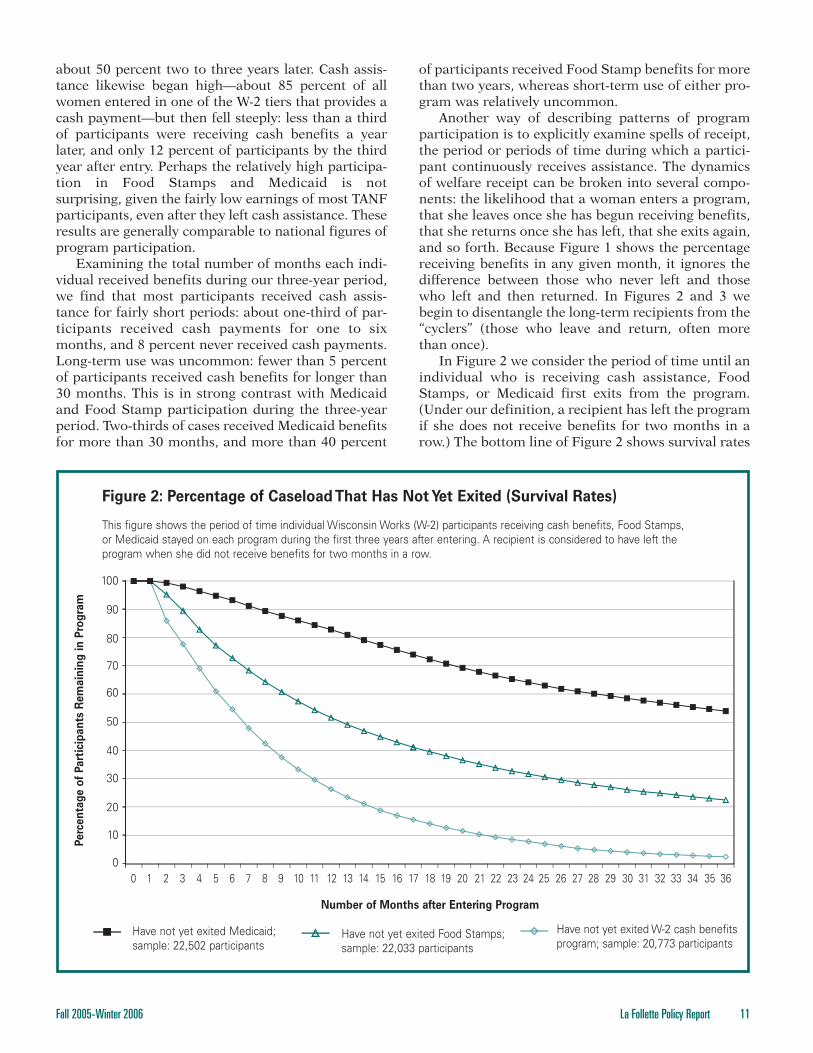
Another way of describing patterns of programparticipation is to explicitly examine spells of receipt,the period or periods of time during which a partici-pant continuously receives assistance. The dynamicsof welfare receipt can be broken into several compo-nents: the likelihood that a woman enters a program,that she leaves once she has begun receiving benefits,that she returns once she has left, that she exits again,and so forth. Because Figure 1 shows the percentagereceiving benefits in any given month, it ignores thedifference between those who never left and thosewho left and then returned. In Figures 2 and 3 webegin to disentangle the long-term recipients from the“cyclers” (those who leave and return, often morethan once).
In Figure 2 we consider the period of time until anindividual who is receiving cash assistance, FoodStamps, or Medicaid first exits from the program.(Under our definition, a recipient has left the programif she does not receive benefits for two months in arow.) The bottom line of Figure 2 shows survival rates
100
90
80
70
60
50
40
30
20
10
00 1 2 3 4 5 6 7 8 9 10 11 12 13 14 15 16 17 18 19 20 21 22 23 24 25 26 27 28 29 30 31 32 33 34 35 36
Number of Months after Entering Program
Perc
en
tag
e o
f P
art
icip
an
ts R
em
ain
ing
in
Pro
gra
m
Figure 2: Percentage of Caseload That Has Not Yet Exited (Survival Rates)
This figure shows the period of time individual Wisconsin Works (W-2) participants receiving cash benefits, Food Stamps, or Medicaid stayed on each program during the first three years after entering. A recipient is considered to have left the program when she did not receive benefits for two months in a row.
Have not yet exited W-2 cash benefitsprogram; sample: 20,773 participants
Have not yet exited Food Stamps;sample: 22,033 participants
Have not yet exited Medicaid;sample: 22,502 participants
(that is, the percentage still receiving benefits) forcash assistance among the 20,773 participants whoever received cash benefits during the first three yearsafter entry. The results resemble those of Figure 1:most women first moved off cash benefits quitequickly, and fewer than 10 percent had not yet done soby the end of the second year. Food Stamp exitsoccurred more slowly: about half the sample leftwithin the first year. Women were particularlyunlikely to leave Medicaid quickly: only 17 percentleft Medicaid within a year.
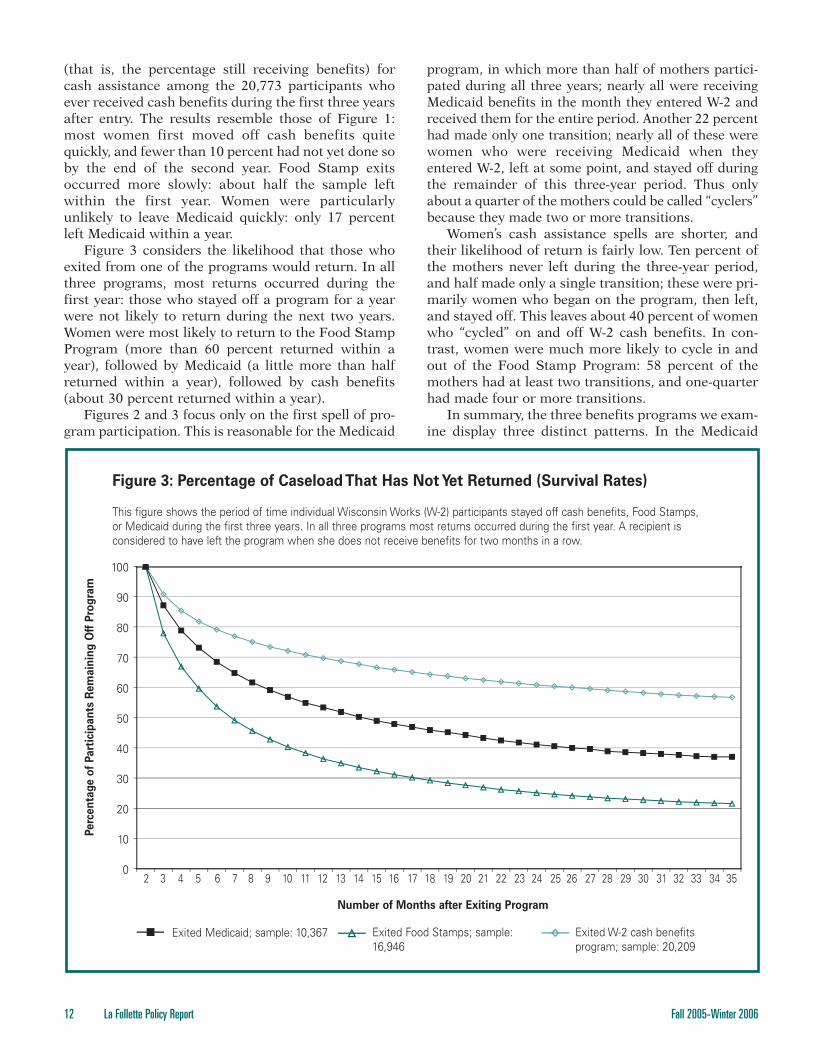
Figure 3 considers the likelihood that those whoexited from one of the programs would return. In allthree programs, most returns occurred during thefirst year: those who stayed off a program for a yearwere not likely to return during the next two years.Women were most likely to return to the Food StampProgram (more than 60 percent returned within ayear), followed by Medicaid (a little more than halfreturned within a year), followed by cash benefits(about 30 percent returned within a year).
Figures 2 and 3 focus only on the first spell of pro-gram participation. This is reasonable for the Medicaid
program, in which more than half of mothers partici-pated during all three years; nearly all were receivingMedicaid benefits in the month they entered W-2 andreceived them for the entire period. Another 22 percenthad made only one transition; nearly all of these werewomen who were receiving Medicaid when theyentered W-2, left at some point, and stayed off duringthe remainder of this three-year period. Thus onlyabout a quarter of the mothers could be called “cyclers”because they made two or more transitions.
Women’s cash assistance spells are shorter, andtheir likelihood of return is fairly low. Ten percent ofthe mothers never left during the three-year period,and half made only a single transition; these were pri-marily women who began on the program, then left,and stayed off. This leaves about 40 percent of womenwho “cycled” on and off W-2 cash benefits. In con-trast, women were much more likely to cycle in andout of the Food Stamp Program: 58 percent of themothers had at least two transitions, and one-quarterhad made four or more transitions.
In summary, the three benefits programs we exam-ine display three distinct patterns. In the Medicaid
12 La Follette Policy Report Fall 2005-Winter 2006
100
90
80
70
60
50
40
30
20
10
02 3 4 5 6 7 8 9 10 11 12 13 14 15 16 17 18 19 20 21 22 23 24 25 26 27 28 29 30 31 32 33 34 35
Number of Months after Exiting Program
Perc
en
tag
e o
f P
art
icip
an
ts R
em
ain
ing
Off
Pro
gra
m
Figure 3: Percentage of Caseload That Has Not Yet Returned (Survival Rates)
This figure shows the period of time individual Wisconsin Works (W-2) participants stayed off cash benefits, Food Stamps, or Medicaid during the first three years. In all three programs most returns occurred during the first year. A recipient is considered to have left the program when she does not receive benefits for two months in a row.
Exited W-2 cash benefitsprogram; sample: 20,209
Exited Food Stamps; sample:16,946
Exited Medicaid; sample: 10,367

Fall 2005-Winter 2006 La Follette Policy Report 13
program, there were few transitions: most commonly,mothers received benefits for the entire period. In theW-2 cash assistance program, women were quitelikely to leave and not likely to return—the most com-mon pattern is a single short spell of receiving cash. In the Food Stamp Program, the likelihood that moth-ers would leave is moderately high (higher than cashbenefits or Medicaid), but the likelihood that thosewho left would return is very high.
Correlates of Benefit Use in Individual Programs We examine the likelihood that women with partic-ular characteristics were still receiving any benefitsin the third year after entering W-2. Women withouta high school diploma and African-Americanwomen were more likely to receive cash assistancein the third year. We expect that mothers’ familyresponsibilities are likely to be linked to the agesand number of their children, which may limit earn-ings and increase reliance on cash payments. Moth-ers with older children were indeed less likely to receive cash assistance in the third year, but,unexpectedly, so too were those with three or more
children. This may reflect a feature of W-2—the lackof adjustment for family size. Fixed W-2 paymentsmay be relatively more economically attractive tosmall families than to large ones. Women withlonger welfare histories (more months of AFDCreceipt) were more likely to receive cash payments;those who had previously had higher earnings orchild support were less likely.
For participation in Food Stamps and Medicaid,results are similar. For example, as with cash assis-tance, mothers were more likely to be receiving FoodStamps and Medicaid if they had lower educationallevels, were African American, had younger children,and had longer histories of AFDC receipt. But thosewith more children were more likely to be receivingFood Stamps or Medicaid, perhaps reflecting theirhigher need or the greater potential benefits for thosewith larger families. Although one might expect bene-fit participation to be higher in counties with highunemployment rates, Food Stamps is the only pro-gram that shows this pattern.
The relationship between previous earnings andprogram participation patterns is puzzling. Consistent
100
90
80
70
60
50
40
30
20
10
03 6 9 12 15 18 21 24 27 30 33 36
Number of Months after Entering Program
Perc
en
tag
e i
n E
ach
Part
icip
ati
on
Cate
go
ry
Figure 4: Multiple Program Participation
This figure shows the sample’s distribution among five mutually exclusive groups, based on combinations of Wisconsin Works(W-2) cash payments, Food Stamps, and Medicaid benefits. This reveals interactions otherwise obscured when programs areconsidered individually.
W-2 cash, FoodStamps, and Medicaid
Food Stamps, Medicaid (no W-2 cash)
Medicaid only (no W-2cash or Food Stamps)
Other None

14 La Follette Policy Report Fall 2005-Winter 2006
with our expectations, those with previous earningswere less likely to be receiving cash payments thanthose with no earnings history. Likewise, those withhistories of high earnings (that is, above $15,000)were less likely to be receiving Food Stamps or Medi-caid than those with no earnings history. However,those with small amounts of earnings prior to W-2were actually more likely to receive Food Stamps orMedicaid than those with no earnings history.
Patterns of Benefit Use in Multiple ProgramsIn the context of time-limited cash assistance, there isincreasing interest in patterns of multiple-programparticipation. Many women who leave cash assistancecontinue to qualify for otherprograms. In-kind benefitprograms such as Medicaidand Food Stamps may beexpected to become a moreimportant part of the safetynet for vulnerable families.Figure 4 shows the distribu-tion of our sample amongfive mutually exclusivegroups, based on the vari-ous combinations of W-2cash payments, Food Stamps, and Medicaid benefitsthey were receiving. We examine participation in mul-tiple programs at the end of each three-month period,beginning the third month after entry.
The bars in Figure 4 reveal program interactionsthat are obscured when programs are considered indi-vidually. At the end of third month after entry, morethan half of our sample were participating in all threeprograms (cash assistance, Food Stamps, and Medi-caid), but this proportion declined dramatically, to 10percent of participants by the end of the 36th month.The second most common initial pattern was receiptof Food Stamps and Medicaid, but not of cash assis-tance (23 percent of the sample, growing to 38 percentof the sample at the end of the third year). One group,consisting of women who had someone in their familyreceiving Medicaid but not cash or Food Stamps, wasuncommon in the third month after entry (8 percent ofthe sample). This group became fairly common by theend of the 36th month (23 percent). Finally, the tinypercentage not receiving any program benefits in thethird month (top portion of each bar) grew to one-quarter of the entire sample in the 36th month.
For how much of the time were women participat-ing in more than one program? Consistent with ourfindings on short spells of cash receipt, only 6 percentreceived all three benefits in more than 24 of the 36months. But although very few women received bene-fits from all three programs simultaneously during along period, most women continued to receive at leastone benefit. Half the sample received at least one of
the three benefits in every month, and only 7 percentwent more than two years without any benefit.
We also computed survival rates for the 19,587women who ever had a month in which they receivedall three benefits. We found that women moved out ofthis status quickly: by the third month, 30 percent,and within a year 80 percent, had left at least one pro-gram. In contrast, when we followed the same sampleand considered time until women left Food Stamps orMedicaid (ignoring leaving cash), we found that onlyabout half of women who received all three programsleft Food Stamps or Medicaid within the first year.
We examined the 7,640 women who ever had amonth in which they did not receive any benefits and
considered the likelihoodthat they would return to atleast one program. Returnrates were fairly high; bythe end of the first yearabout half these womenhad returned to at least oneprogram, and within threeyears about two-thirds hadreturned. It was, however,quite uncommon forwomen to return to all three
programs simultaneously (only 6 percent of the tran-sitions); more common patterns involved return toFood Stamps and Medicaid, or to Medicaid only, or toMedicaid one month and Food Stamps the next.
Finally, we examined the number of transitionswomen made during the three-year period. Multipletransitions are quite common if we count as a transi-tion any change in participation from one month tothe next. Only 2 percent of the women never changedtheir receipt of a benefit during the 36 months; 9 per-cent changed just once. In contrast, about half of thesample had five or more transitions, and one-fifth hadmore than seven transitions. If determining eligibilityis complicated, the frequency of transitions impliesthat caseworkers may be required to devote a substan-tial amount of time to processing such changes.
Other Benefits and Programs: Child-CareSubsidies and the Earned Income Tax CreditLow-income families are eligible for child-care subsi-dies and the Earned Income Tax Credit (EITC) inaddition to TANF cash assistance, Food Stamps, andMedicaid. When we consider child-care subsidies andthe EITC as well as TANF cash, Food Stamps, andMedicaid benefits, nearly the entire sample receivedat least one benefit, even in the third year. In the thirdyear, TANF cash benefits are not the most important,either in participation rates or the dollar value ofbenefits. TANF participation rates (29 percent) aresmaller than child-care subsidies (35 percent), FoodStamps (74 percent), the EITC (75 percent), and
If determining eligibility
is complicated, the frequency
of transitions implies that
caseworkers may be required
to devote a substantial amount
of time to processing such changes.
Fall 2005-Winter 2006 La Follette Policy Report 15
Medicaid (83 percent). Although the average amountreceived by TANF participants, $3,000, is higher thanthe amount participants in Food Stamps or EITCreceive (both about $2,300), it is substantially lessthan the cost of Medicaid ($4,700 per participatingfamily) or child-care subsidies ($7,500 per participat-ing family). This highlights the importance of consid-ering multiple programs when examining incomesupports for low-income families.
Summary and Policy Implications In this study we examined patterns of participation inTANF, the Food Stamp Program, and Medicaid inWisconsin and explored multiple-program participa-tion during a three-year period. We found that receiptof cash payments declined dramatically during thethree years but participation in Food Stamps andMedicaid remained relatively high. Most participantsreceived cash assistance for fairly short periods, andre-entry was fairly uncommon, a finding that is con-sistent with other studies of AFDC/TANF programparticipation. In contrast, many women received ben-efits from Medicaid for the entire period. Food stamprecipiency followed yet another pattern: mothers werelikely to cycle on and off the program.
Relative to research on other states, we found thatthe welfare participation patterns in our Wisconsinsample included shorter spells of cash assistance,higher Food Stamp use, and more Food Stamp Pro-gram cycling. Wisconsin’s strong work-first focus,which generally provides cash only in exchange forwork, may be more likely to push people into low-wage employment in which they continue to qualifyintermittently for Food Stamps. Policymakers mayneed to pay attention to the special needs of familieswho have left cash assistance but continue to needother supports when implementing a work-focusedwelfare regime. Moreover, our findings suggest thatresearch that focuses only on TANF cash receiptmisses a great deal of complexity and may provide amisleading picture of the patterns of welfare use.
In the context of time-limited cash assistance, thereis increasing interest in patterns of multiple-programparticipation. Our results show that although thesimultaneous receipt of cash assistance, Food Stamps,and Medicaid is uncommon by the end of the period,a substantial proportion of women typically werereceiving Medicaid or Medicaid combined with Food
Stamps. We found that the number of transitionsmade during these three years was quite high. Perhapsthese programs are not really working together; if so,some of the recent demonstration programs to inte-grate benefits may be simpler for families and for theworkers who determine eligibility. The presumed costsavings associated with more frequent eligibility deter-mination should be reconsidered in light of the poten-tially substantial administrative work and the burdenfor clients. One approach to reducing costly transi-tions would be to ignore small or short-term incomechanges. Research in Canada suggests that partici-pants would prefer a system less concerned with tryingto match benefits to small changes in income (evensmall increases in benefits in response to smalldeclines in income) if the system was less intrusive.
In this study we also examined factors associatedwith individual program participation in TANF, FoodStamps, and Medicaid, and multiple-program partici-pation in the third year after entry. Our findings aregenerally similar to those of prior studies on programparticipation. People more likely to receive TANF,Food Stamps, Medicaid, or all three programs werethose who had lower education, were African Ameri-can or Hispanic, had younger children, had longerAFDC histories, less child support, and shorter earn-ings histories. Moreover, our results suggest thatlarger families were likely to continue to receive FoodStamps and/or Medicaid, but not cash. As we note, therelatively low cash benefit participation rates for largefamilies in Wisconsin may reflect the lack of any fam-ily size adjustment in cash benefits. Like much otherresearch in this area, we find that those with a highschool degree or more are more likely to exit and lesslikely to return. This highlights the potential impor-tance of initiatives that make it possible for welfareparticipants to complete high school (or even college).
Finally, although participation in TANF, FoodStamps, and Medicaid declined over time, little evi-dence in this or other research shows that very manyfamilies have incomes high enough to be ineligible forthese programs. The reasons families do not receivethe benefits for which they are presumably eligibleare an important policy issue. These reasons may sug-gest that the families are making informed choices toforgo benefits, or that they lack information abouttheir continued eligibility, or that they see the rules orprocedures for participants as onerous. Our resultssuggest that social workers working with low-incomepopulations could try to educate their clients so thatthey know the array of programs that they may be eli-gible to receive. In addition, policymakers may wantto rethink the ways that people apply for various pro-grams so that applications can occur during theevening, online, or via telephone, to increase theextent to which these programs are available to thosewho are working.
Support the Policy Report and the La Follette School of Public AffairsGo to: www.lafollette.wisc.edu/alumnifriends/support.html
E-mail: [email protected]
Call: (608) 263-7657
16 La Follette Policy Report Fall 2005-Winter 2006
Twenty years ago the United States was the world’slargest creditor nation, unsurpassed in its owner-
ship of assets outside of its borders, even after deduct-ing out what foreigners owned inside its borders. Yet,during the past two decades, the United States hasbeen transformed into the world’s largest debtornation. At the end of 2004, its debts to the rest of theworld exceeded its assets by about $2.5 trillion, 21percent of its gross domestic product. This proportionis unmatched by any other major developed economyin recent history.
The current account deficit—the difference betweenwhat residents of the United States spend on importsand payments on liabilities to foreigners, and what theyearn from exports and income on assets fromabroad—has soared from just less than $389.5 billionin 2001 to $665.9 billion, 5.7 percent of U.S. grossdomestic product (GDP) in 2004. Other countries haveexperienced deficits this large relative to the size oftheir economy, but the absolute magnitude of thedeficit is unprecedented because the United Stateslooms so large in the international economy. Moreover,a deficit of 6.4 percent of GDP for 2005’s first threequarters provides no evidence that the trend in the cur-rent account is being reversed.
A trade deficit results whenever consumptionexceeds production. Add to the trade deficit the dif-ference between the income the United States earnson its assets abroad and what it pays on foreign-owned liabilities in the United States, and the result-ing number is the current account deficit (which iscurrently about the same size as the trade deficit). TheUnited States must borrow to pay for the currentaccount deficit, and the amount shows up as capitalflowing in. This borrowing results in the accumula-tion of debt or the sale of assets to foreign entities.Borrowing means we accumulate debt or sell off oursavings held in the form of factories and securitiesabroad.
The United States cannot continue increasing itsindebtedness to the rest of the world at this pace forlong: the size of the current account deficit is not sus-tainable. The United States should be concernedabout how the reduction in borrowing occurs, sincetheory suggests that the more prolonged the borrow-ing, the more painful will be the consequences when
it ends. Taking the initiative now to reduce borrowingwill give the United States better control over its eco-nomic destiny. Otherwise we will cede it to foreigneconomic interests and governments.
How Did We Get Here?
A large portion of the current account deficit is of ourown making. First and foremost among domestic fac-tors is the expansionary fiscal policy undertaken inrecent years. In 2000, the budget surplus, adjusted toremove business cycle effects, was almost 1 percent ofGDP. By 2004, it had swung to a negative 5 percent, adramatic shift. The first term of the Bush administra-tion inherited projected budget surpluses as far as theeye could see. Two rounds of tax cuts, two wars, and arecession have replaced those surpluses with an end-less vista of projected deficits.
The resulting deficits affected current accountdeficits in an obvious way: tax cuts and governmentspending increased private consumption, sucking inadditional imports. Government borrowing increasedthe demand for credit, bidding up interest rates and,hence, the value of the dollar. This process made U.S.exports relatively less competitive on world marketsand made more difficult the position of U.S. indus-tries competing with imported goods.
A second way that fiscal profligacy has affected thecurrent account deficit receives little discussion, par-ticularly by the administration. When the U.S. gov-ernment runs a budget deficit, the legacy of the deficitis an increase in the stock of government outstandingdebt. The nonpartisan Congressional Budget Office’sfive-year projection of the amount of federal govern-ment debt swung from 15 percent of GDP in 2000 toa September 2004 projection of 40 percent. Somebodyhas to buy this additional debt. Since then, on net, for-eigners have taken up the slack. Foreign centralbanks’ accumulation of $355.3 billion of dollars andU.S. Treasury securities has financed almost theentire 2004 federal deficit of $369.4 billion. Inessence, the federal government has been borrowingat very low rates—lower than any other private or gov-ernment entity—and then providing those resourcesas a tax cut to households to consume at the govern-ment’s expense. This is not prudent long-term policywhen the government itself faces a set of daunting
The Current Account Deficit: Causes and ChallengesMenzie D. Chinn
Menzie D. Chinn is a professor with the La Follette School of Public Affairs and the Department of Economics at the University of Wisconsin-Madison. This article is draws upon “Getting Serious about the Twin Deficits,”Council Special Report No. 10 published in September 2005 by the Council on Foreign Relations. The full report is available at http://www.cfr.org. The views contained herein are solely those of the author and do not necessarilyrepresent those of the Council on Foreign Relations or any other institutions with which the author is affiliated.
contingent liabilities on the horizon, from guaranteeson pension benefits to Medicare and Social Security.
Monetary policy has exacerbated the situation.The aggressive easing of interest rates by the FederalReserve in the wake of the stock market collapse ledto a continuing boom in the housing market. Home-owners perceive the capital gains on their houses aswealth, so they have increased spending—on Ameri-can and foreign goods—without apparent limits. Now,the Fed has embarked on a path of raising short-terminterest rates to keep the economy from overheating.The good news is that, eventually, these interest rateincreases will cool consumer spending. But in themeantime, consumption of imported goods is increas-ing, thereby worsening the country’s current accountdeficit.
The United States has also become increasinglydependent upon oil imports. When oil prices were low,the United States made little attempt to spur energyconservation. Firms invested in energy intensiveequipment and consumers in gasoline intensive vehi-cles. Even now, the tax rate on gasoline is substantiallylower, in inflation-adjusted terms, than it was beforethe first oil crisis in 1973-74. Now that oil prices havesurged to more than $60 a barrel (which is not arecord high in inflation-adjusted dollars), the hazardsof being so energy dependent are becoming clear. Notonly is macroeconomic activity susceptible to oil pricemovements, the current account is becoming increas-ingly sensitive to such movements. Increases in oilimports account for 49 percent of the $379 billionincrease in the trade deficit from the end of 2001 until
the first quarter of 2005. According to these latest sta-tistics, the trade balance excluding oil imports is 3.7percentage points of GDP, as compared to the totaltrade balance figure of 5.8 percentage points. Sincepredictors of prices of oil, such as contracts for petro-leum futures, do not indicate a substantial reductionin prices in the near term, U.S. policymakers canexpect this component of the trade deficit to remainlarge indefinitely. Moreover, because oil is priced indollars, the weakening of the dollar has almost noeffect on the value of oil imports. This means a largerexchange rate change is necessary to get a given reduc-tion in imports than would be the case if only a smallamount of energy was imported.
In response to the ballooning current accountdeficit, the administration has almost entirely focusedon dollar depreciation. In addition, it has exhortedgovernments in Europe and Japan to persevere instructural reforms of labor, financial, and productmarkets in the hopes that success along these dimen-sions will lead to an acceleration of growth. Morerecently, it has engaged in public pressure on the Chi-nese government to revalue the renminbi.
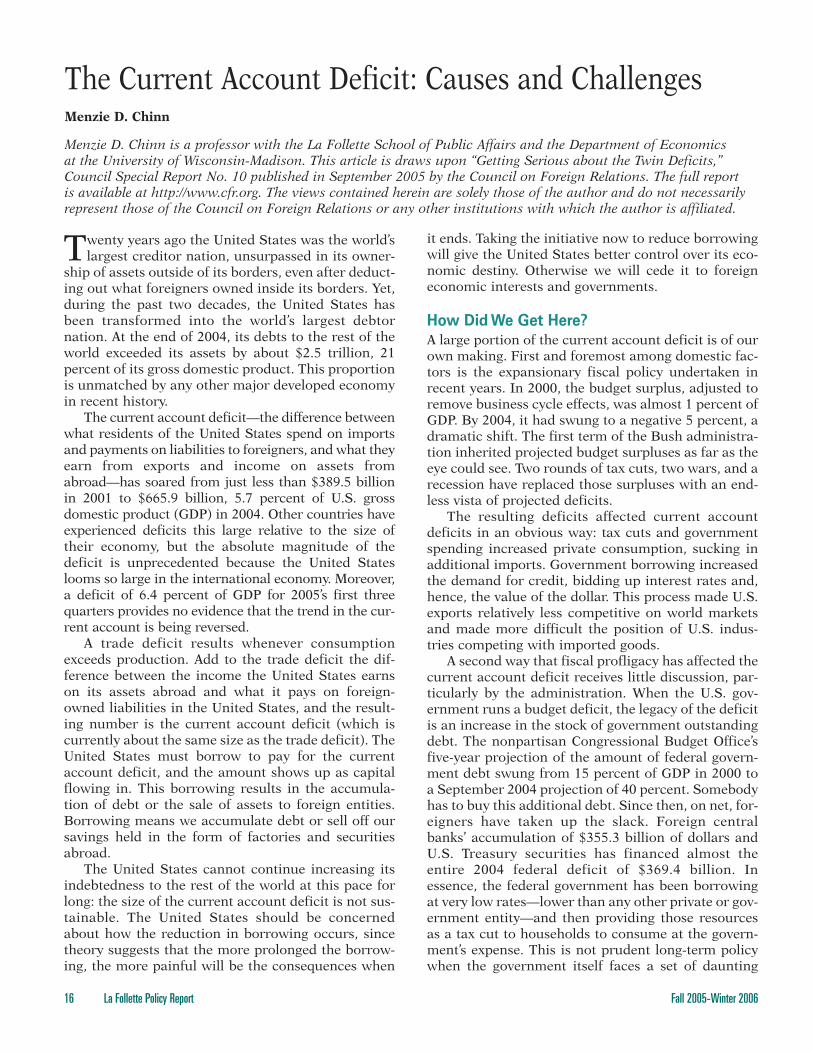
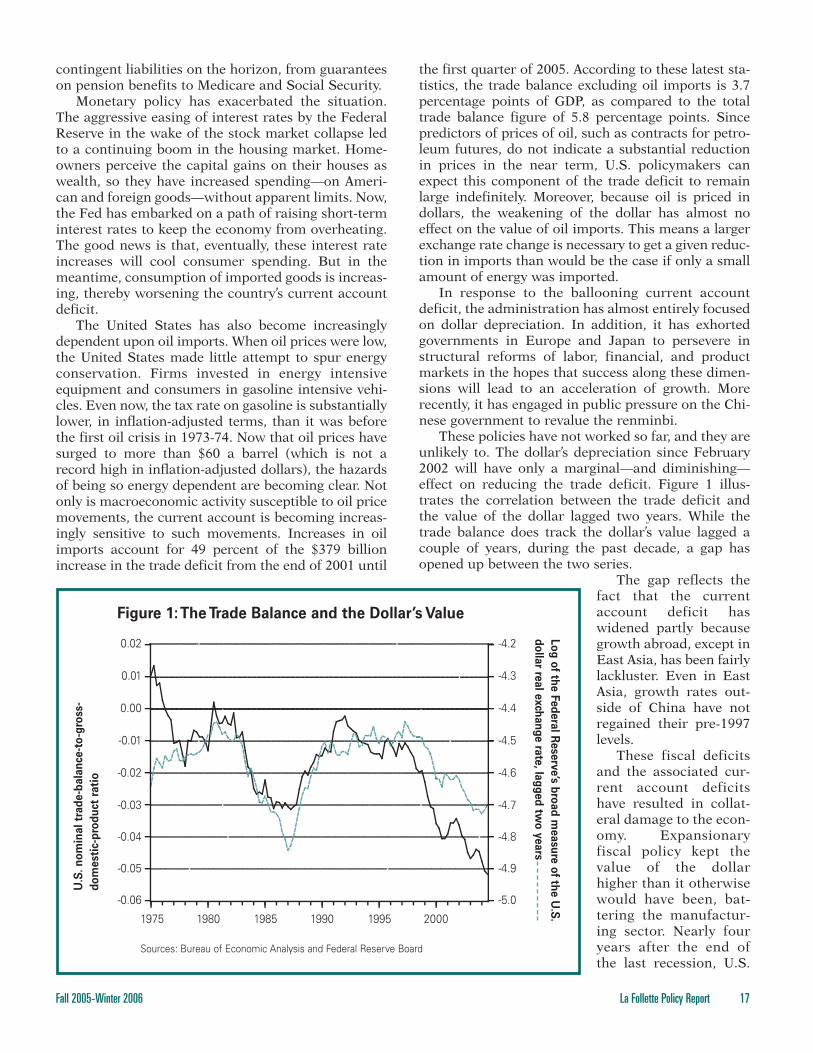
These policies have not worked so far, and they areunlikely to. The dollar’s depreciation since February2002 will have only a marginal—and diminishing—effect on reducing the trade deficit. Figure 1 illus-trates the correlation between the trade deficit andthe value of the dollar lagged two years. While thetrade balance does track the dollar’s value lagged acouple of years, during the past decade, a gap hasopened up between the two series.
The gap reflects thefact that the currentaccount deficit haswidened partly becausegrowth abroad, except inEast Asia, has been fairlylackluster. Even in EastAsia, growth rates out-side of China have notregained their pre-1997levels.
These fiscal deficitsand the associated cur-rent account deficitshave resulted in collat-eral damage to the econ-omy. Expansionaryfiscal policy kept thevalue of the dollarhigher than it otherwisewould have been, bat-tering the manufactur-ing sector. Nearly fouryears after the end ofthe last recession, U.S.
Figure 1:The Trade Balance and the Dollar’s Value
Fall 2005-Winter 2006 La Follette Policy Report 17
0.02
0.01
0.00
-0.01
-0.02
-0.03
-0.04
-0.05
-0.06
-4.2
-4.3
-4.4
-4.5
-4.6
-4.7
-4.8
-4.9
-5.0
1975 1980 1985 1990 1995 2000
Sources: Bureau of Economic Analysis and Federal Reserve Board
Lo
g o
f the F
ed
era
l Rese
rve’s b
road
measu
re o
f the U
.S.
do
llar re
al e
xch
an
ge ra
te,
lag
ged
two
years
U.S
.n
om
inal
trad
e-b
ala
nce
-to
-gro
ss-
do
mest
ic-p
rod
uct
rati
o

18 La Follette Policy Report Fall 2005-Winter 2006
manufacturing employment remains 16 percentbelow its January 2001 levels. If the dollar’s overval-uation had not been so sustained, some of those jobswould not have migrated abroad; the dollar depreci-ation that will induce a return of those jobs mayhave to be substantial indeed.
The large trade deficits have also sparked bouts oftrade protectionism that threaten the completion ofthe Doha Development Round of trade negotiations.It started with the Bush administration’s steel tariffsin 2001, but large trade deficits, bilateral (with China)and multilateral, make it harder to resist calls for pro-tection. In this sense, the administration’s macroeco-nomic and microeconomic policies are at odds.
Why has so little alarm been expressed regardingthese trends? Some economists focus on the currentaccount deficit as the consequence of capital flowingto the United States to seek high returns here versusabroad. According to Fed Chair Ben Bernanke andothers, there is a global savings glut—at least relativeto investment—in East Asia, and, to a lesser extent, inEurope. Excess savings then moves to seek the high-est return, which is in the United States, Bernankesays. Other experts view the current account deficit asthe outcome of an explicit attempt by the East Asiangovernments to keep their currencies weak, therebymaintaining export growth.
Both of these views contain grains of truth. Theglobal savings glut may explain why in the last couple
of years, the current account deficit has maintainedits downward trajectory even as the dollar has weak-ened. And mercantilist tendencies in East Asia mayhelp one understand why the East Asian countrieshave accumulated such large stocks of U.S. Trea-suries. But none of them fully explains the evolutionof the U.S. current account deficit during the pastdecade, and none of them contradicts the assertionthat the budget deficit has an important impact onexternal imbalances.
Why We Should Worry
Left unchecked, these deficits pose a variety of threatsto the United States. One real possibility entails thesatiation of global investors’ appetite for U.S. Treasurysecurities, combined with an endless vista of govern-ment budget deficits. After several years of largelosses on dollar assets due to depreciation, investorsthen demand a substantial premium for holding dol-lar denominated assets; either the dollar must weakenso as to make Treasury securities cheap, or yieldsmust rise relative to those on other assets.
Let’s make this scenario a bit more concrete. Thefederal debt-to-GDP ratio projected by the Congres-sional Budget Office in August 2000 for the end of2005 was 14.3 percent of GDP. By September 2004,ignoring likely expenditures in Iraq and assumingimplausibly low growth rates of discretionary spend-ing, the Congressional Budget Office projection for
2009 was about 40.3 per-cent. However, this pro-jected debt-to-GDP ratio of40.3 percent by 2009 is fartoo optimistic. Figure 2illustrates various paths forU.S. government debt heldby the public, expressed asa proportion of projectedGDP. The baseline paththat exhibits a downwardpath is not taken seriouslyby the market; this projec-tion assumes that no newspending programs are im-plemented, and it includesunrealistically slow discre-tionary expenditures growth.It also omits expendituresfor operations in Iraq andAfghanistan. A more realis-tic debt trajectory, giventhe behavior of the currentadministration and Con-gress, is one that leads to agovernment debt-to-GDPratio of more than 50 percent
Figure 2: Projections of the Federal Debt Held by the Public
0.52
0.48
0.44
0.40
0.36
0.32
0.28
0.24
1980 1985 1990 1995 2000 2005 2010 2015
Fiscal Year
Perc
en
tag
e o
f Fed
era
l D
eb
t H
eld
by P
ub
lic
Fed
era
l Deb
t Held
by P
ub
lic as a
Ratio
to G
ross
Do
mestic P
rod
uct
Source: Congressional Budget Office and author’s calculations based on August 2005 Congressional Budget Office data.
Discretionaryspending
Debt-to-gross-domestic-product ratio (actual andprojected)
Iraq phase-down
Tax fixes
by 2015. Right now, non-residents (foreign firms, indi-viduals, and governments) are funding America’s bud-get deficits. In the absence of action, the government’sfinancing need will increase, meaning more debt willbe issued at a faster and faster pace. Foreigners do nothave an infinite appetite for Treasuries, so yields willhave to rise.
As more U.S. government debt is dumped intofinancial markets, U.S. interest rates will rise relativeto foreign interest rates after accounting for expecteddepreciation, or the dollar will plummet. A 2005 sur-vey of previous current account deficit reductionsshows that the higher the share of bond financing ofdeficits, the higher interest rates tend to rise. Bondsnow account for the majority of the financing ofAmerica’s current account deficit.
A dollar depreciation eventually improves thetrade deficit. But in the short term, with volume ofimports so very much larger than that of exports, theimmediate effect is to worsen the trade deficit. Thus,exactly when financing is expensive, the United Stateswill need even more financing.
How will this play out for the broader economy?With interest rates spiking, the housing sector experi-ences a sharp correction. Since much of the typicalAmerican household’s wealth is in the form of hous-ing, suddenly poorer consumers will be forced to cutback on their spending. The weakening dollar putsupward pressure on import prices, which then con-fronts the Fed with a choice between accommodatingthe shock and stifling inflationary pressures. To theextent that the Fed opts for greater price stability,interest rates will have to rise by even more. All theseevents will result in a deep recession.
Do more benign outcomes provide the rationalefor continued inaction? Suppose we consider a morelikely outcome in which investors merely slow theiracquisition of U.S. Treasuries, or state actors such asthe People’s Bank of China choose to diversify theirreserve currency holdings, away from dollars andtoward other currencies. They don’t actually “dump”the dollar holdings, but acquire them at a slower pace.
The premium necessary to induce investors tohold U.S. Treasuries rises gradually but inexorably,slowing the economy. Because of the large andincreasing budget deficits set in place, expansionaryfiscal policy is off the table. So too is expansionarymonetary policy hamstrung. Accelerating the print-ing of money would alarm holders of U.S. Trea-suries—alarm that would be well founded given thetremendous incentives the Fed would have to inflateaway the government’s debt held by foreign residents.So America is trapped in slow growth, with no viablepolicy options. In such a state, policymakers may beeven more tempted than they are now to impose tar-iffs and sanctions, increasing further the possibilityof trade wars.
Even if there is no sharp, discrete adjustment,America’s continued descent into greater and greaterdebt threatens an important source of America’s influ-ence: the dollar’s role as the key global currency.Recall that the U.S. dollar overtook the British poundas the most important currency after Britain slippedinto debtor status. Long periods of depreciation canlead to an erosion of the status of a currency as onethat is held by central banks. This is one hazard thatmust be confronted by those who are comfortablewith a long-term decline in the dollar’s value.
The discussion so far has focused on the directeffects on the U.S. economy. By virtue of its flexiblemarkets and well-developed legal institutions, theUnited States is well situated to avoid the worst effectsof an economic disruption. However, the emergingmarket economies are not so fortunate. As U.S. inter-est rates rise or growth slows dramatically, the rest ofthe world—the Chinas and the Argentinas—will expe-rience the effects. The precedents are not good; thedebt crises of 1982 and the financial crises of 1997were preceded by run-ups in real interest rates in theUnited States. To the extent that the United States isnow more dependent on events in the rest of theworld—that is, after all, the definition of globaliza-tion—we can be sure that America will share in someof the world’s economic distress.
What Should the Policy Response Be?
No informed observer believes that the United Statesneeds to reduce the current account deficit to zero inshort course. Rather, it needs a combination of poli-cies to reduce the deficit substantially so that itsindebtedness to the rest of the world stops rising atsome point.
These challenges can only be addressed throughthe implementation of decisive and responsible poli-cies. Most immediately, the United States needs toacknowledge the role of fiscal policy in widening thecurrent account deficit and return to a policy of fiscalrestraint. Reducing the growth rate of governmentspending and raising tax revenues as a proportion ofGDP—currently at record lows—should be at the topof the country’s economic agenda. Successful reduc-tion in the budget deficit will reduce overall spendingin the economy, reducing the U.S. role as the world’sconsumer of first resort. Since foreigners are financ-ing the federal government budget deficit, reducingthe government’s borrowing needs will lower thecountry’s exposure to the whims of East Asian gov-ernments.
Over the longer term, persistent budget deficitsimply a higher trajectory for the amount of outstand-ing U.S. government debt. The larger the amount ofgovernment debt that is going to be accumulated, theweaker the dollar and the higher the interest rates will
Fall 2005-Winter 2006 La Follette Policy Report 19
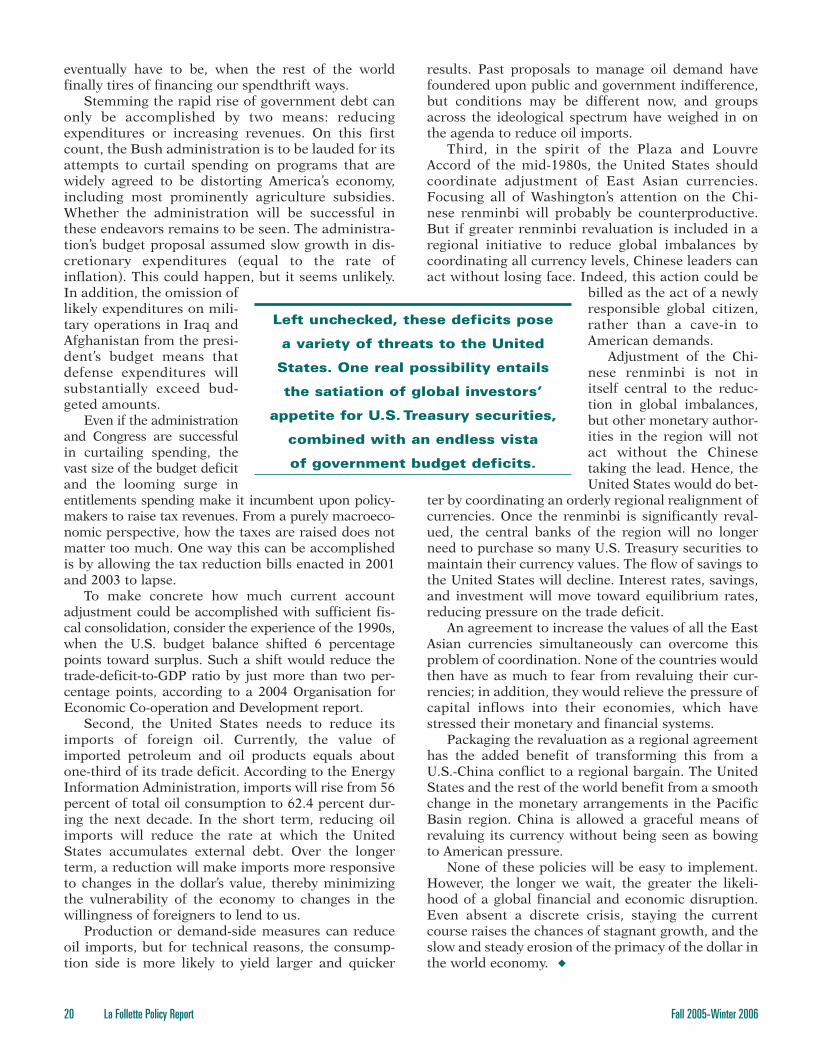
20 La Follette Policy Report Fall 2005-Winter 2006
eventually have to be, when the rest of the worldfinally tires of financing our spendthrift ways.
Stemming the rapid rise of government debt canonly be accomplished by two means: reducingexpenditures or increasing revenues. On this firstcount, the Bush administration is to be lauded for itsattempts to curtail spending on programs that arewidely agreed to be distorting America’s economy,including most prominently agriculture subsidies.Whether the administration will be successful inthese endeavors remains to be seen. The administra-tion’s budget proposal assumed slow growth in dis-cretionary expenditures (equal to the rate ofinflation). This could happen, but it seems unlikely.In addition, the omission oflikely expenditures on mili-tary operations in Iraq andAfghanistan from the presi-dent’s budget means thatdefense expenditures willsubstantially exceed bud-geted amounts.
Even if the administrationand Congress are successfulin curtailing spending, thevast size of the budget deficitand the looming surge inentitlements spending make it incumbent upon policy-makers to raise tax revenues. From a purely macroeco-nomic perspective, how the taxes are raised does notmatter too much. One way this can be accomplishedis by allowing the tax reduction bills enacted in 2001and 2003 to lapse.
To make concrete how much current accountadjustment could be accomplished with sufficient fis-cal consolidation, consider the experience of the 1990s,when the U.S. budget balance shifted 6 percentagepoints toward surplus. Such a shift would reduce thetrade-deficit-to-GDP ratio by just more than two per-centage points, according to a 2004 Organisation forEconomic Co-operation and Development report.
Second, the United States needs to reduce itsimports of foreign oil. Currently, the value ofimported petroleum and oil products equals aboutone-third of its trade deficit. According to the EnergyInformation Administration, imports will rise from 56percent of total oil consumption to 62.4 percent dur-ing the next decade. In the short term, reducing oilimports will reduce the rate at which the UnitedStates accumulates external debt. Over the longerterm, a reduction will make imports more responsiveto changes in the dollar’s value, thereby minimizingthe vulnerability of the economy to changes in thewillingness of foreigners to lend to us.
Production or demand-side measures can reduceoil imports, but for technical reasons, the consump-tion side is more likely to yield larger and quicker
results. Past proposals to manage oil demand havefoundered upon public and government indifference,but conditions may be different now, and groupsacross the ideological spectrum have weighed in onthe agenda to reduce oil imports.
Third, in the spirit of the Plaza and LouvreAccord of the mid-1980s, the United States shouldcoordinate adjustment of East Asian currencies.Focusing all of Washington’s attention on the Chi-nese renminbi will probably be counterproductive.But if greater renminbi revaluation is included in aregional initiative to reduce global imbalances bycoordinating all currency levels, Chinese leaders canact without losing face. Indeed, this action could be
billed as the act of a newlyresponsible global citizen,rather than a cave-in toAmerican demands.
Adjustment of the Chi-nese renminbi is not initself central to the reduc-tion in global imbalances,but other monetary author-ities in the region will notact without the Chinesetaking the lead. Hence, theUnited States would do bet-
ter by coordinating an orderly regional realignment ofcurrencies. Once the renminbi is significantly reval-ued, the central banks of the region will no longerneed to purchase so many U.S. Treasury securities tomaintain their currency values. The flow of savings tothe United States will decline. Interest rates, savings,and investment will move toward equilibrium rates,reducing pressure on the trade deficit.
An agreement to increase the values of all the EastAsian currencies simultaneously can overcome thisproblem of coordination. None of the countries wouldthen have as much to fear from revaluing their cur-rencies; in addition, they would relieve the pressure ofcapital inflows into their economies, which havestressed their monetary and financial systems.
Packaging the revaluation as a regional agreementhas the added benefit of transforming this from aU.S.-China conflict to a regional bargain. The UnitedStates and the rest of the world benefit from a smoothchange in the monetary arrangements in the PacificBasin region. China is allowed a graceful means ofrevaluing its currency without being seen as bowingto American pressure.
None of these policies will be easy to implement.However, the longer we wait, the greater the likeli-hood of a global financial and economic disruption.Even absent a discrete crisis, staying the currentcourse raises the chances of stagnant growth, and theslow and steady erosion of the primacy of the dollar inthe world economy.
Left unchecked, these deficits pose
a variety of threats to the United
States. One real possibility entails
the satiation of global investors’
appetite for U.S. Treasury securities,
combined with an endless vista
of government budget deficits.
Fall 2005-Winter 2006 La Follette Policy Report 21
If part of the promise of digital government is to enable citizens and businesses to enjoy greater con-
venience in their interaction with government,another goal is to revitalize democracy itself. Adecline in civic engagement among citizens has beennoted in society, while citizen distrust of politicalinstitutions is on the rise. Both trends do not augurwell for democracy. Democratic theorists and publicmanagement scholars have argued that one way toreverse these trends is to foster greater citizen partic-ipation in public decisions. Groups of citizens seekingto influence governmental decisions will foster higherlevels of social capital among one another, and thesecitizens will believe they are part of government iftheir input is taken into account.
One basic barrier to enhanced citizen participa-tion is the nature of bureaucracy itself. Benjamin Bar-ber has argued that government has become a form of“representative bureaucracy” that undermines indi-vidual responsibility for beliefs, values, and actions,and is incompatible with freedom since it delegatesand alienates political will. The alternative to “repre-sentative bureaucracy” is “strong democracy” charac-terized by increased citizen participation. The valuesof bureaucracy are based on expertise and qualifica-tions, and they conflict with democratic or represen-tative values that underpin the idea of participation.Citizens are defined as non-expert outsiders who mayhave to be listened to, but they are likely to have littleactual impact on decisions. This is reflected in thefailings of traditional modes of citizen participation.
Subject to particular ire is the town hall meeting/public hearing mode of participation. Scholars havecritiqued them as ineffective. Such meetings arepoorly attended and dominated by elite, non-repre-sentative groups. Hearings are often timed late in thedecision process, used to convince citizens of pre-made decisions rather than to gain their input andprovide no opportunity for an iterative dialogue withsequential exchanges of information and response.Democratic theorists have criticized hearings for fos-tering self-interested claims rather than concern withthe general welfare of the citizenry and deemedunsuitable to foster choices between policy trade-offs.
Citizens attending public hearings may have littlebackground information on issues, which often leadsto poorly informed opinions about policy and theworking of government.
A more digital approach may address the problemsof the traditional town hall meeting. Digital town hallmeetings, if well organized, can enable a large anddiverse group of citizens to engage in an intelligent,iterative dialogue with each other and with publicofficials. However, whether this input ends up shapinggovernmental decisions still rests largely in the handsof public officials.
The Digital Town Hall Meeting:Two Examples
Efforts have been made to reinvent the town hallmeeting using technology since the 1970s. In 1976,public officials in Reading, Pennsylvania, began totelevise public forums and invited members of thepublic to offer comment or question via telephone.This approach can now be extended to allow publicresponses via the internet. One drawback of thismodel is that citizens are not physically present atsuch meetings, and the dialogue is not iterative. Tocounter these limits, the nonprofit organizationAmericaSpeaks advocates for a type of digital townhall meeting that allows many citizens to meet in thesame physical space and engage in meaningful dis-course. AmericaSpeaks has run a number of meet-ings, including one in Washington, D.C., and anotherin New York City.
Washington, D.C., Digital Town Hall MeetingIn 1999, Washington, D.C., Mayor Anthony Williamsestablished a series of “citizen summits” as a way ofincorporating public involvement in the city govern-ment’s strategic planning and budget. The Office ofNeighborhood Action was created to organize citizenparticipation that would link to District strategic plan-ning. The office initiated the goal-setting process priorto the citizen summit, facilitating two cabinet retreatsthat generated broad goals. Following the retreats,cross-agency task forces led by the mayor’s officedeveloped more detailed strategic plans around these
Can Technology Reinvigorate Citizen Participation?Lessons from the Digital Town Hall MeetingDonald P. Moynihan
Donald P. Moynihan joined the La Follette School of Public Affairs at the University of Wisconsin-Madison in fall2005. His research and teaching interests include performance management, homeland security, citizen participation,and public budgeting. In particular, he studies the selection and implementation of public management reforms. Thispiece draws on “Can Technology Reinvigorate Participation? Lessons from the Digital Town Hall Meeting,” forthcom-ing in Ari-Veikko Anttiroiko & Matti Malkia (eds.) Encyclopedia of Digital Government. Hershey, PA: Idea Group Inc.

22 La Follette Policy Report Fall 2005-Winter 2006
broad goals. The Office of Neighborhood Action sum-marized the draft strategic plan into a four-pageprinted tabloid to present before and at the summit toinform citizens about the basic issues to improve thenature of the dialogue.
The summit itself lasted more than seven hoursand included development of District and neighbor-hood vision statements, discussion of citywide priori-ties and the draft strategic plan, and identification ofaction items to be carried out in each neighborhood.Efforts were made to ensure that all elements of D.C.’sdiverse citizenry were reached. The summit was opento all comers, and summit literature and translationsof the proceedings were available in Spanish, Viet-namese, Korean, and Chi-nese. Demographic surveysof the summit found it to beracially representative of theDistrict’s population.
The nearly 3,000 peoplewho attended the summitwere divided into tables of 10; trained facilitators satwith each group to promote meaningful dialogue. Thedigital aspect of the meeting was reflected in twokinds of technologies: networked laptop computersand wireless polling keypads. The computersrecorded the messages developed at each table. Theiruse fostered discussion among the individuals in eachgroup and consensus about the messages to beentered into the computer. The computers alsoallowed the mayor to receive and respond to the mes-sages during the forum, thus providing greater inter-action between the mayor and participants. Thepolling keypads allowed the mayor to ask participantsto vote on any question during any point of the sum-mit, providing instantaneous results on large screensat the front of the room. Participants prioritized andranked citywide goals. The data collected through thekeypads were cross-referenced with demographicdata collected at the beginning of the program whenparticipants completed a short survey.
The input from the meeting served to shape theformat and allocation of resources in the District’sbudget. The next budget request to the City Council(overseen by the federal government) saw each Dis-trict department identify strategic issues that wereraised at the summit and codified in the strategicplan, subsequently requesting resources to pursuethese goals. The meeting also pushed for suggestionsof how to solve problems at the more local level,encouraging residents from different wards to registertheir opinions on neighborhood issues. The summitbecame the first step for more localized District/citi-zen planning and action efforts through a series ofstrategic neighborhood action plans. These planswere designed to link to actual resource provision andoperations at the micro level. Management teams of
agency officials were appointed for each ward andtasked with addressing persistent neighborhood prob-lems raised in these local plans. Goals from the Dis-trict plan were linked to the performance standardsfor senior officials. Each department head had a per-formance contract and a public performance score-card—a single-page list of the key performancetargets and measurement of success or failure inachieving those targets—that incorporated goalsraised at the summit of relevance to the department.
Following the summit, the revised strategic planwas presented to citizens at a similar forum on January29, 2000, where approximately 1,500 citizens (60 per-cent of whom had participated in the first summit) had
the opportunity to hold themayor accountable for therevisions made and to offerfinal messages and thoughtsbefore the plan was com-pleted. The final version ofthe strategic plan bore the
clear imprint of the meetings. The front section of eachissue-driven chapter identified specific citizen concernsor priorities raised at the summit and the resultingstrategic goals. Each goal was then broken down by aspecific action item that described the implementationsteps taking place to achieve the goal. A performancetarget accompanied each action item, and the planidentified the agency responsible for the target and thedate by which the target would be achieved.
New York City Digital Town Hall MeetingAnother case of a digital town hall meeting occurredin New York City in the aftermath of 9/11. Authoritiessought to incorporate public input into the planningprocess for rebuilding the site of the World Trade Cen-ter. AmericaSpeaks was hired to run two of its digitaltown hall meetings—one for the Civic Alliance, a non-profit coalition of civic, labor, business, and environ-mental groups, and academic institutions, and theother for the Lower Manhattan Development Corpo-ration, a specially created public body charged withplanning the redevelopment of lower Manhattan. Theevents became know as Listening to the City. The firstmeeting in February 2002 featured more than 500participants, while the second, in July 2002, featuredmore than 5,000. Participants in New York used thesame technology that had been used in the Washing-ton, D.C., summits.
The impact of the second meeting was striking. Theaudience was presented with six designs for replacingthe World Trade Center. All were criticized as mediocreefforts that resulted in a dense and uninspiring thicketof buildings that added little to the city skyline. Cheerswent up as low polling results for each design wereprojected on large screens at the meeting. There wasconsensus among participants that a spectacular and
Technology makes possible
the reinvigoration of the traditional
town hall meeting.

Fall 2005-Winter 2006 La Follette Policy Report 23
symbolic design was required to reinvigorate the NewYork skyline. While disagreement may have existed onwhat this design might look like, participants madeclear that it was not contained in the six designs pre-sented. They made it so clear, in fact, that, at the endof the meeting, representatives of the Lower Manhat-tan Development Corporation and the World TradeCenter owner, the Port Authority, promised to offernew designs and to reduce demands for a high amountof commercial space when they invited another roundof design submissions from around the world. Themeeting was covered by local, national, and interna-tional media, whose high-profile reporting empha-sized the degree of participant consensus in therejection of the designs. A New York Times editorialconcluded that “public opposition saved the city fromthe ordinary.”
While in some respects Listening to the City was asuccess, participants did not have the degree of influ-ence on the final design that they wanted. After thenext rounds of designs were invited, the finalists werepublicly displayed, and the public was invited to offercomment, but another high-profile digital town hallmeeting was not organized. Public officials, especiallyGovernor George Pataki, felt pressure to choose adesign quickly. Even after a specially created commit-tee selected the Studio Daniel Libeskind design, thistoo was subject to a redesign by architects of Larry Sil-verstein, the leaseholder of the site. A key changedemanded by Silverstein was more commercial space,which was one of the problems that the participants ofListening to the City had identified with original
designs. While Libeskind remained the nominal mas-ter architect of the site, the final version of the Free-dom Tower eliminated almost all of the elements of hisoriginal design, shaped by the preferences of Silver-stein’s architects and by security concerns of the NewYork Police Department.
Lessons from the Cases
Both cases provide lessons. Perhaps the best way toconsider these lessons is to re-examine the criticismsof the traditional town hall meeting and see how thedigital town hall approach served to overcome theseproblems. Table 1 presents this comparison. Whilethe digital town hall meeting clearly does not ensureperfect participation, it does offer an improvedoption for governments intent on taking citizen inputseriously.
Perhaps the most obvious lesson is that technology—with the help of trained facilitators—makes possi-ble the reinvigoration of the traditional town hallmeeting. These gatherings have been criticized aspseudo-participation where a non-representative sliceof citizenry are co-opted into providing symbolic par-ticipation for public decisions. The experience of thesummits in Washington, D.C., and, to a lesser extent,Listening to the City in New York, suggests it is possi-ble to bring together a representative group of thou-sands and use technology to engage them in aninteractive dialogue with public officials. Trainedfacilitators played a key role, encouraging membersof the small groups to contribute during the daylongexperience. The use of specific topics, computer feed-
back, and polling summarized theresults of these conversations intoconcise points.
In both cases, the need for suchpublic involvement was driven byan acknowledgment of the needfor the type of legitimacy gener-ated by meaningful public partic-ipation. The District’s reform-minded Mayor Anthony Williamssought to turn around the city’simage as one of the most poorlyrun and corrupt in America. In thecase of the Listening to the City,public officials faced an unso-licited outpouring of public opin-ion and design suggestions thatreflected the participants’ sense ofloss and emotional connection tothis decision. To ignore the publiccompletely seemed unthinkable.
Differences between the casesalso exist. The citizen summitswere more broadly representative
Table 1: Reinvigorating the Town Hall Meeting
Critiques of traditional town hall meeting Lessons of digital town hall meeting
Slow, expensive and time-consuming Digital meetings require careful organizationto listen to large numbers of citizens and resources, but they can facilitate input
of thousands in a single meeting
Not representative of citizenry; dominated Undertake extensive outreach; track aspects by middle and upper classes of representativeness through poll
of participants
Participants driven by self-interest, focus Structure presentation of questions to force on narrow issues rather than community consideration of wider issues and trade-offs problems; unable to make trade-offs; and among policies; generate discussion and seek provide mixed messages to government clarity through polling of ordered preferences
Dialogue is not iterative; citizens voice Can create iterative dialogue through grievances in disconnected way facilitation of small-group discussion,
ordering of questions and responses to follow-up questions on polling keypads
Participation primarily symbolic to provide Level of influence depends on willingness sense of legitimacy to decision process of public officials to listen; however, direct
involvement of officials, media coverage of events and clarity of citizen preferences can put pressure on government

La Follette
Policy ReportThe Robert M. La FolletteSchool of Public AffairsUniversity of Wisconsin–Madison1225 Observatory DriveMadison, WI 53706
Non-Profit Org.U.S. Postage
PaidMadison, WI
Permit No. 658
of different demographic groups than the Listening tothe City meetings, especially in terms of race andincome. This suggests the importance of active andtargeted outreach in ensuring a representative sampleof the public. More broadly, the cases point to theneed for careful organization to facilitate citizen inputwith digital town hall meetings. A nonprofit specializ-ing in digital town hall meetings was hired in bothcases, and, in the Washington case, AmericaSpeakspartnered with the local government to ensure thatthe meetings were well-attended, representative, effi-cient, and that they made direct contributions to thedecision agenda of public officials. While the technol-ogy is a boon, it requires careful organization andsmart application on the part of public/nonprofitemployees to realize its full benefits.
More fundamentally, differences exist in the degreeof influence the town hall meetings exerted. This vari-ation in influence on decision-making also reflects thefact that, despite the benefits of the digital town hallmeeting, there is no guarantee that the input of thesemeetings will have a direct influence on decision out-comes. As with any type of citizen input, public influ-ence on decision-making depends on the willingness ofpublic officials to take this information into account. Anumber of factors will drive the willingness to listen.Citizens may be viewed as unqualified to make deci-sions, and public officials may be unwilling to cedetheir own preferences. On the other hand, the digitaltown halls provided information about citizen prefer-ences, which enabled officials to understand whichtrade-offs citizens were willing to make and added asense of legitimacy to the decision process. In Wash-ington, D.C., the mayor used the digital town hallmeetings multiple times, first to craft a strategic plan
and then to seek public approval of this plan. In thecase of the Listening to the City, public involvementwas limited to early stages of the decision process, dueto perceived time pressures and worries about anotherrejection of design plans. The nature of the decision athand also may explain somewhat the differences.Strategic plans are essentially statements of broad pol-icy goals, something that the citizenry is fundamen-tally qualified to comment on. Officials may have beenless willing to trust qualifications of the public witharchitectural choices of design. In addition, the role ofthe World Trade Center site’s leaseholder meant thatprivate actors had more control over the decision out-come and wanted to sideline any public input thatmight reduce the site’s commercial value.
An optimistic perspective assumes that as the ideaof digital town hall meetings becomes better known,as technology declines in cost, and as governmentsbecome acquainted with process, we can expect to seethis form of participation increase. The digital townhall meeting requires greater resources and effort onthe part of government than alternative technologicalroutes to participation, such as online discussiongroups or polling. But it also has the virtues of the tra-ditional town hall model—citizens coming together toshare their views in person, voice their concerns, andinteract with the officials who represent them. In thisrespect, it is an innovation that seeks to incorporatetechnology in a way that will render a traditionalpractice of democracy more effective rather thanreplace it. Ultimately, the success of these meetingsdepends on governmental willingness to view thepotential of digital government to reinvigorate thepractices of democracy and act as a source of citizeninput that will shape public decisions.