KONGSBERG · PDF fileVolvo and JLR INTERIOR . 7 New ... manual gear shifter systems, for C and...
35
1 1 KONGSBERG AUTOMOTIVE Third Quarter 2013
Transcript of KONGSBERG · PDF fileVolvo and JLR INTERIOR . 7 New ... manual gear shifter systems, for C and...

1 1
KONGSBERG AUTOMOTIVE Third Quarter 2013

2
Still improving profitability
REVENUES
► Revenues of EUR 234.8 million in line with guiding
► Revenues for the 4th quarter are expected to be approx. EUR 230 million
PROFITABILITY
► EBITDA of EUR 24.4 million (10.4%), up EUR 9.5 million from 3rd quarter 2012
► Improved profitability on lower revenues, reflecting the effects of
operational and commercial improvements
► The gearing ratio further reduced to 2.7 times NIBD/EBITDA
MARKET
► Positive trend in European commercial vehicle segment
► Steady growth in North American light vehicle segment
3
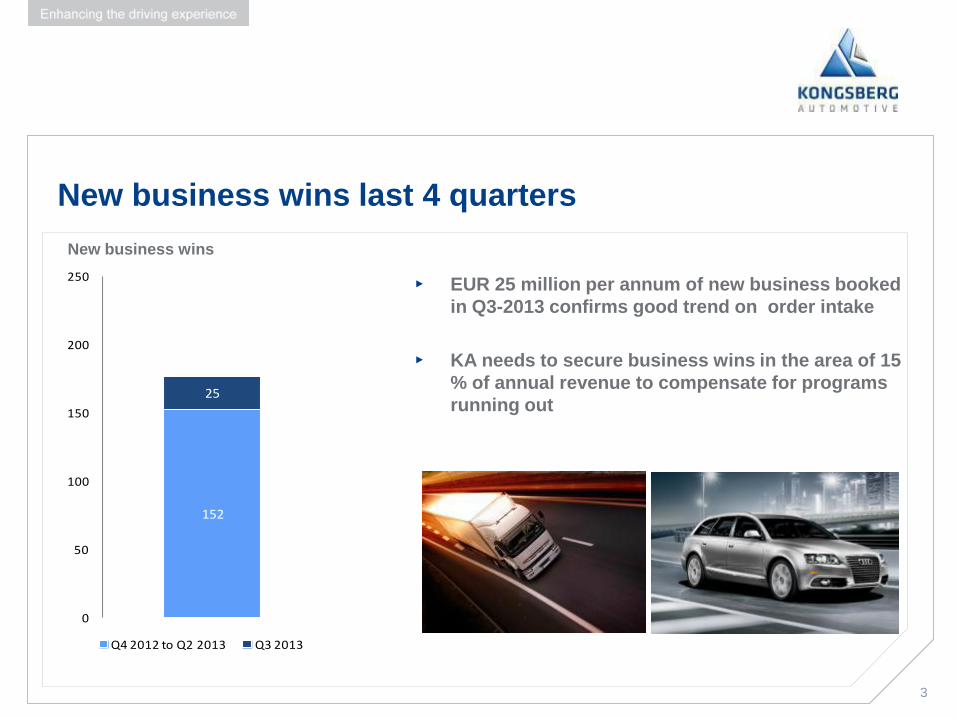
New business wins last 4 quarters
New business wins EUR Million
▸ EUR 25 million per annum of new business booked
in Q3-2013 confirms good trend on order intake
▸ KA needs to secure business wins in the area of 15
% of annual revenue to compensate for programs
running out
152
25
0
50
100
150
200
250
Q4 2012 to Q2 2013 Q3 2013

4 4
Hans Peter Havdal President & CEO
Operational Review
4

5
11,3%
5,5%
18,7%13,0%
Market
Safety and comfort related
products for vehicle interiors
Gear shift systems for light duty
vehicles
Fluid handling systems for
passenger cars, industrial and
commercial vehicles
Driver control systems and
chassis related products to
commercial vehicles
Continued Driveline margin improvement
INTERIOR DRIVELINE DRIVER CONTROL FLUID TRANSFER
PASSENGER CARS COMMERICAL VEHICLES
EB
ITD
A-m
arg
in
30% of total
revenues
28% of total
revenues
19% of total
revenues
23% of total
revenues
6
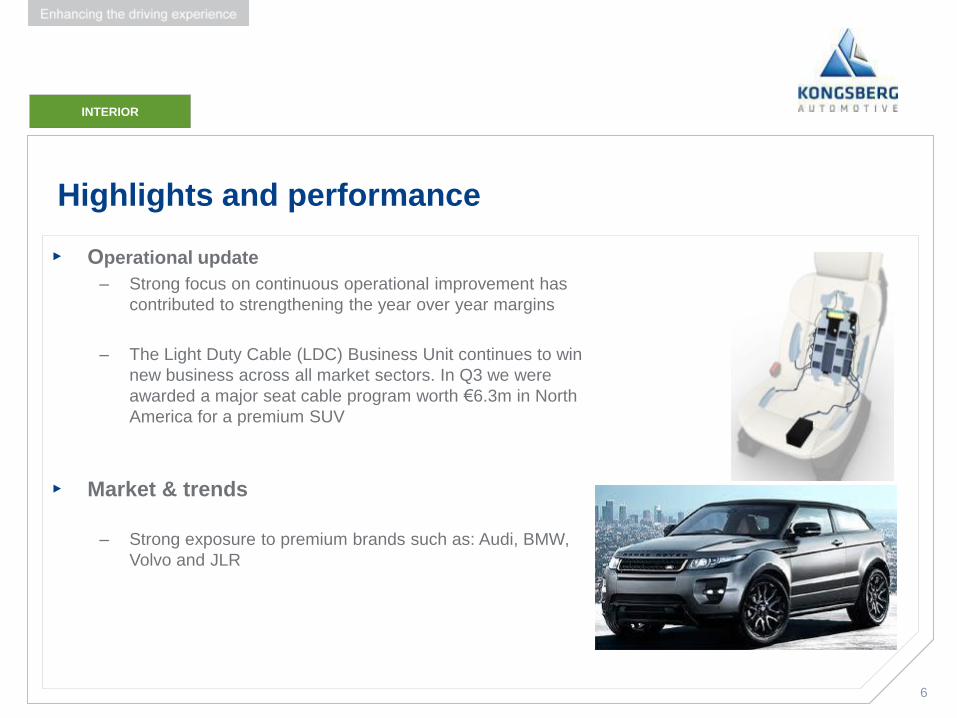
Highlights and performance
▸ Operational update
– Strong focus on continuous operational improvement has
contributed to strengthening the year over year margins
– The Light Duty Cable (LDC) Business Unit continues to win
new business across all market sectors. In Q3 we were
awarded a major seat cable program worth €6.3m in North
America for a premium SUV
▸ Market & trends
– Strong exposure to premium brands such as: Audi, BMW,
Volvo and JLR
INTERIOR

7
New contract worth EUR 11.2 million for supply of Seat
Heat systems in China
▸ Seat heating systems for a global OEM to a
popular crossover SUV and C segment car in
China
▸ The life time of this contract is 7 years, with start
of production at the second half of 2015
▸ Production will take place from KA’s facility in
Wuxi, China
This contract confirms KA ’s ability to grow in emerging countries which start to
adopt high end products
INTERIOR

8
Highlights and performance
▸ Operational update
– Continuing focus on further improving margins
– Focused R&D effort on developing new concepts for the next
generation technology to meet customer demand
– Continue to win significant global contracts with strong
momentum in the BRIC regions
– Launch in Mexico of 85,000 automatic gear shifters per year for
Chrysler in North America
▸ Market & Trends
– The decline in revenue was mainly due to a general decline in
sales in the European market , combined with some programs
reaching end of production
DRIVELINE

9
”Crystal shifter system” to Volvo’s latest concept car
▸ At the automotive show IAA in Frankfurt, the new Shift-by-
Wire concept from Driveline was displayed in the Volvo
Concept Coupe
▸ The shifter concept attracted a lot of interest and is
demonstrating the capabilities of the Driveline R&D team
▸ This shifter is equipped with state of the art technology;
this sets a new standard in terms of safety, weight, compact
packaging and styling
Confirms positive growth trend for Fluid Transfer Systems within commercial vehicles

10
3 New key contracts won by Driveline in China
worth 116 MEUR
Product Content Customer Production
Facility Life time value
EUR million Planned SOP
Automatic gear shifter systems, for C
segment cars sold in China
Global Brand Wuxi in China 14 2014
Automatic and manual gear shifter systems, for C and D segment cars sold in
China
Chinese OEM Wuxi in China 102 2014
These contracts confirms the strong sales momentum KA is enjoying in the BRIC regions
DRIVELINE

11
Highlights and performance
▸ Operational update
– Fluid transfer continued to win contracts globally that
strengthen our position as an expert niche supplier in the
commercial vehicle and automotive segments
– Two new global program launches for DAF PACCAR Trucks
related to the new Euro 6 and EPA 10 engines standards with
total volume of 65.000 units
▸ Market & trends
– Strength in European commercial vehicle and global
automotive markets was partially offset by commercial vehicle
weakness in North America
FLUID TRANSFER

12
Highlights and performance
DRIVER CONTROL
▸ Operational update – Electronic Center of Excellence in North America is close to be
fully operative.
This is resulting in an increased level of opportunities
– Increased yoy aftermarket sales
– New program launch for BRP on cluster display with 15.000 units annually to be delivered from our Grand Mere (Canada) facility
▸ Market & Trends
– Improving demand due to reduced inventories for Off-Highway
equipment, stabilized economic conditions within the EU
– Stronger On-Highway demand partially driven by Euro 6 pre-buy effects
13
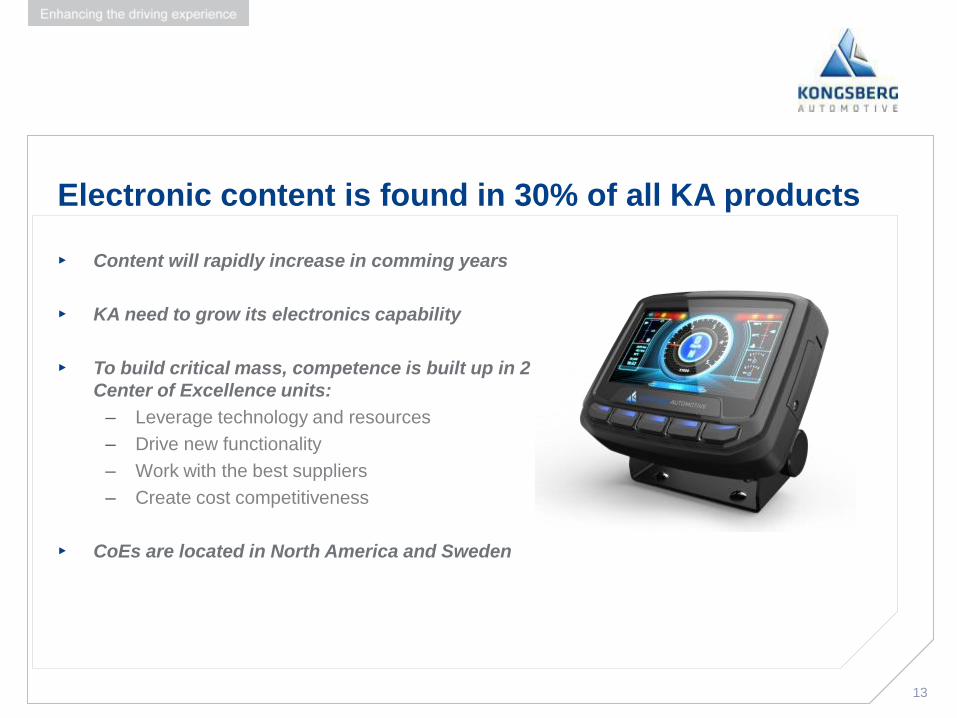
Electronic content is found in 30% of all KA products
▸ Content will rapidly increase in comming years
▸ KA need to grow its electronics capability
▸ To build critical mass, competence is built up in 2
Center of Excellence units:
‒ Leverage technology and resources
‒ Drive new functionality
‒ Work with the best suppliers
‒ Create cost competitiveness
▸ CoEs are located in North America and Sweden
14 14
Financial Update Trond Stabekk Executive Vice President & CFO
14

15
Revenue and EBITDA
239233
252
262
235
Q3 2012 Q4 2012 Q1 2013 Q2 2013 Q3 2013
Revenues EUR million
14.8
19.0
25.1
28.6
24.4
6.2%
8.1%
9.9%
10.9%10.4%
Q3 2012 Q4 2012 Q1 2013 Q2 2013 Q3 2013
EBITDA and EBITDA marginEUR million and percent

16
Segment financials 3rd quarter
Revenues and EBITDA margin EUR million and percent
70 7278 80
72
Interior
Revenues
5.78.4
9.8 9.78.2
8.2%
11.7% 12.6% 12.1% 11.3%
Q3 2012
Q4 2012
Q1 2013
Q2 2013
Q3 2013
EBITDA
7871 72 72
67
Driveline
Revenues
-2.1
2.5 3.4 3.6 3.7
-2.7%
3.6%4.7% 4.9% 5.5%
Q3
2012
Q4
2012
Q1
2013
Q2
2013
Q3
2013
EBITDA
59 5665
70
56
Driver Control
Revenues
8.75.7
9.611.0
7.3
14.8%
10.2%
14.7%15.8%
13.0%
Q3 2012
Q4 2012
Q1 2013
Q2 2013
Q3 2013
EBITDA
42 43 45 48 47
Fluid
Revenues
6.1 6.6 7.08.4 8.8
14.4% 15.4% 15.4%17.5%
18.7%
Q3 2012
Q4 2012
Q1 2013
Q2 2013
Q3 2013
EBITDA

17
Consolidated income statement
► Revenue run rate in line with full
year guiding.
► Continue to improve EBITDA run
rate and margins through
operational and commercial
improvements.
► NET PROFIT influenced by
unrealized FX effects
30.09.12 31.12.12 31.03.13 30.06.13 30.09.13
982.6 985.6 991.7 985.8 981.5
-915.0 -914.4 -909.6 -898.3 -884.5
67.6 71.2 82.1 87.5 97.0
6.9% 7.2% 8.3% 8.9% 9.9%
-44.7 -45.5 -44.6 -45.2 -44.6
22.9 25.6 37.4 42.3 52.5
2.3% 2.6% 3.8% 4.3% 5.3%
-21.0 -13.1 -16.2 -29.6 -35.3
2.0 12.5 21.2 12.7 17.2
1.3 -5.4 -9.1 -6.9 -8.1
3.4 7.2 12.2 5.8 9.1
Financial items
Profit before taxes
Tax
Net profit
D&A
EBIT
EBIT (%)
Twelve months ending
Revenues
OPEX
EBITDA
EBITDA (%)
EUR Million

18
ROCE (LTM = last twelve months)
75.3
4.6%5.8% 5.9%
8.1%
10.3%
Q3 2012 Q4 2012 Q1 2013 Q2 2013 Q3 2013
ROCEPercent
1,015 1,001
985 986 982
Q3 2012 Q4 2012 Q1 2013 Q2 2013 Q3 2013
Revenues (LTM)EUR Million
24.7 30.7 31.442.3
52.52.4%
3.1% 3.2%
4.3%
5.3%
Q3 2012 Q4 2012 Q1 2013 Q2 2013 Q3 2013
EBIT and EBIT margin (Ltm)EUR Million and percent
542530
532 520508
1.871.89
1.85
1.90
1.93
Q3 2012 Q4 2012 Q1 2013 Q2 2013 Q3 2013
Avg. Capital Employed and turnover (Ltm)EUR Million and Times

19
Financial items
▸ Interest rate
margin reduced as
a consequence of
lower gearing
-5.1 -5.3-4.4 -4.5
-3.3
4.1
1.4
-5.2
-5.2
-3.3-1.4-1.3
-0.8-1.8
-1.4
Q3 2012 Q4 2012 Q1 2013 Q2 2013 Q3 2013
Other items Currency effects
Net interest Net financial items
Net financial itemsEUR million

20
Available funds and utilization
44.2 42.1
86.8
64.2
0.0
-22.6
0.0
Restricted cash
Cash reserve
Cash
-40
-20
0
20
40
60
80
100
120
140
Gross Q3 2013
Net Q3 2013
Liquidity reserveEUR million
Restricted cash
Overdraft
Un-utilized facility
Un-utilized revolving
credit facility
2.1
361341
321301
281274
0
50
100
150
200
250
300
350
400
450
Q3 2013 Q4 2013 Q2 2014 Q4 2014 Q2 2015
Credit utilization RRCFEUR Million
Available credit
Drawn credit

21
Cash flow and facility development
75.3 61.8
69.6 72.759.6
30.733.3
42.9
100.3 106.0 102.5
0
20
40
60
80
100
120
140
160
Q3 2012 Q4 2012 Q1 2013
Available fundsEUR Million
64.6
42.1
(9.3)(5.3) (3.0)
(30.0)
24.4
30.0 0.2
34.764.2
99.0 106.0
Q2 2013 EBITDA Change in total NWC, and taxes
paid
Capital expenditures
Net financial expenses
Change in drawn amount incl. overdraft
Change in un-utilized
facility
Other Q3 2013
Cash Un-utilized facility
Cash flow Facility Other

22
Financial ratios
311
289297
275265
Q3 2012 Q4 2012 Q1 2013 Q2 2013 Q3 2013
NIBDEUR million
193.5
184.7
189.0 189.4
193.4
Q3 2012 Q4 2012 Q1 2013 Q2 2013 Q3 2013
EquityEUR million
4.33.8 3.8
3.12.7
Q3 2012 Q4 2012 Q1 2013 Q2 2013 Q3 2013
NIBD/EBITDATimes
24.8% 24.8% 24.8% 25.2%
27.4%
Q3 2012 Q4 2012 Q1 2013 Q2 2013 Q3 2013
Equity ratioPercent

23 23
Market Update Philippe Toth Vice President Investor Relations and M&A
23
24
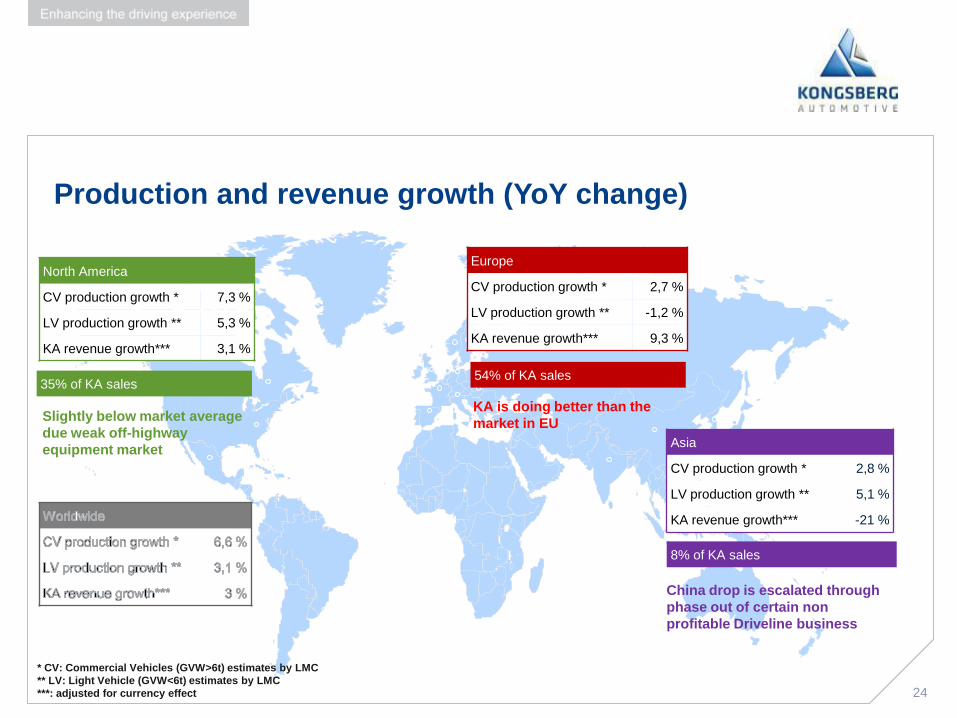
Production and revenue growth (YoY change)
* CV: Commercial Vehicles (GVW>6t) estimates by LMC
** LV: Light Vehicle (GVW<6t) estimates by LMC
***: adjusted for currency effect
North America
CV production growth * 7,3 %
LV production growth ** 5,3 %
KA revenue growth*** 3,1 %
Europe
CV production growth * 2,7 %
LV production growth ** -1,2 %
KA revenue growth*** 9,3 %
Asia
CV production growth * 2,8 %
LV production growth ** 5,1 %
KA revenue growth*** -21 %
35% of KA sales 54% of KA sales
8% of KA sales
KA is doing better than the
market in EU Slightly below market average
due weak off-highway
equipment market
China drop is escalated through
phase out of certain non
profitable Driveline business

25
-02%
-01%
00%
01%
02%
03%
04%
05%
06%
07%
08%
2013Q1 2013Q2 2013Q3 2013Q4 2013 2014 2015 2016
Light vehicle production: revised world estimates (ch Y/Y)
World new (Oct) World old (July)
Light vehicle production – 2013 forecast
Total production according to LMC has been revised down from 83.6 millions to 83.4 millions vehicle in 2013
mainly due to a lower growth in Asia (especially India and Thailand) compared to the beginning of 2013
.
Source: LMC Automotive – July 2013
Europe: Outlook remains challenging due to weak
economy and uncertainty surrounding the Eurozone
Western Europe production forecast slightly improved
by export of premium brands
-2.1%
North America: US market has cooled down
slightly after the summer , but still has a good year on
year growth
3.9%
China: Fundamental demand for vehicles remains solid
despite weaker than expected industrial output and real
GDP growth
11.1%
2.1%

26
-20%
-15%
-10%
-05%
00%
05%
10%
15%
20%
2013Q1 2013Q2 2013Q3 2013Q4 2013 2014 2015 2016
Medium and heavy duty truck production: revised world estimates (ch Y/Y)
World new (Oct) World old (July)
Commercial vehicle production – 2013 forecast
Source: LMC Automotive – July 2013
Total output for CV production is slightly down to 2.69 million vehicles from 2.72 in June outlook mainly due to a
slower growth of the commercial vehicle market in China.
.
Europe: Q3 experienced actual growth compared to
Q3 last year mainly due to EURO6 pre-buy. This will
continue out the year.
-0.5%
North America: Expect the market to continue to
remain stable , but somewhat lower than last year
-2.7%
China: Slower growth in industrial output than
preceding forecast but market remains dynamic
4.5%
2%

27 27
Summary and Outlook
Hans Peter Havdal
27

28
230 232
0
50
100
150
200
250
300
Q4-2013 Q4-2012
Summary and outlook
▸ Strong double digit EBITDA margin of 10.4%
despite a weak European market - demonstrating
the effect of the operational improvements
implemented over the last 2 years
▸ The gearing ratio further reduced from 3.1 to 2.7
times NIBD/EBITDA
▸ The company expects revenue of approx. EUR
230 million for Q4 2013
▸ Capital market day to be held on 3rd December
2013
Company outlook for Q4 2013 EUR Million

29 29
Questions & Answers
29

30 30
Appendix

31 31
Passionate Prepared Accountable
“Enhancing the driving experience”
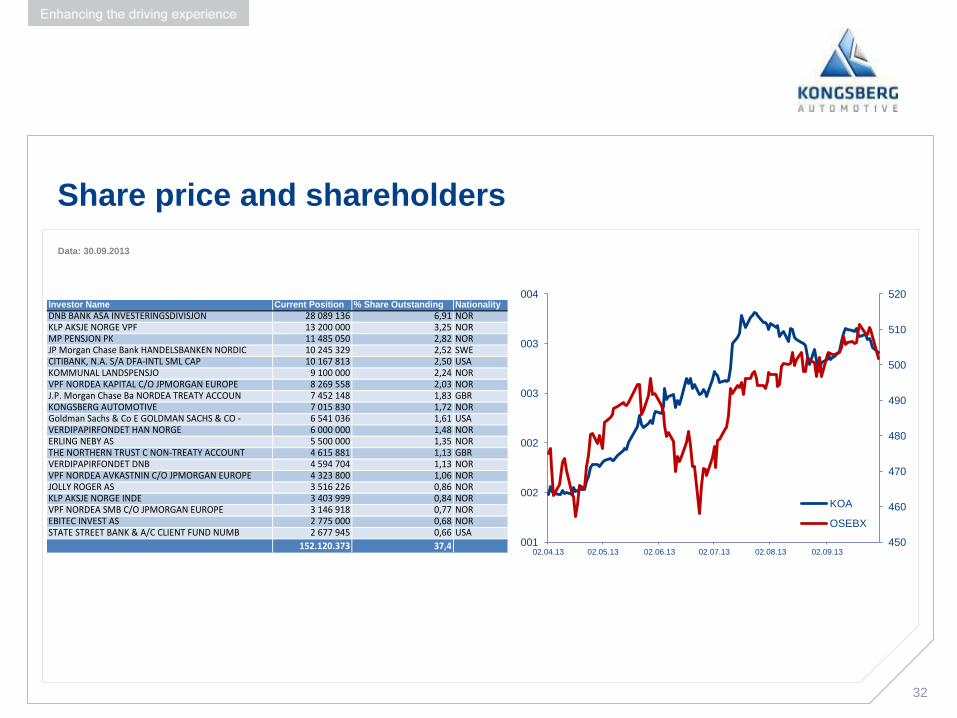
32
Share price and shareholders
Data: 30.09.2013
Share price increase of 67 % in Q2 2013
450
460
470
480
490
500
510
520
001
002
002
003
003
004
02.04.13 02.05.13 02.06.13 02.07.13 02.08.13 02.09.13
KOA
OSEBX
Investor Name Current Position % Share Outstanding Nationality
DNB BANK ASA INVESTERINGSDIVISJON 28 089 136 6,91 NORKLP AKSJE NORGE VPF 13 200 000 3,25 NORMP PENSJON PK 11 485 050 2,82 NORJP Morgan Chase Bank HANDELSBANKEN NORDIC 10 245 329 2,52 SWECITIBANK, N.A. S/A DFA-INTL SML CAP 10 167 813 2,50 USAKOMMUNAL LANDSPENSJO 9 100 000 2,24 NORVPF NORDEA KAPITAL C/O JPMORGAN EUROPE 8 269 558 2,03 NORJ.P. Morgan Chase Ba NORDEA TREATY ACCOUN 7 452 148 1,83 GBRKONGSBERG AUTOMOTIVE 7 015 830 1,72 NORGoldman Sachs & Co E GOLDMAN SACHS & CO - 6 541 036 1,61 USAVERDIPAPIRFONDET HAN NORGE 6 000 000 1,48 NORERLING NEBY AS 5 500 000 1,35 NORTHE NORTHERN TRUST C NON-TREATY ACCOUNT 4 615 881 1,13 GBRVERDIPAPIRFONDET DNB 4 594 704 1,13 NORVPF NORDEA AVKASTNIN C/O JPMORGAN EUROPE 4 323 800 1,06 NORJOLLY ROGER AS 3 516 226 0,86 NORKLP AKSJE NORGE INDE 3 403 999 0,84 NORVPF NORDEA SMB C/O JPMORGAN EUROPE 3 146 918 0,77 NOREBITEC INVEST AS 2 775 000 0,68 NORSTATE STREET BANK & A/C CLIENT FUND NUMB 2 677 945 0,66 USA
152.120.373 37,4

33
Ulla-Britt FräjdinHellqvist (58) HalvorStenstadvold (69)
Thomas Falck (47) EivindHolvik
Maria BorchHelsengreen (47) TonjeSivesindtajet
Magnus Jonsson (57) Kjell Kristiansen
The Board of Directors of Kongsberg Automotive Holding ASA
•Chairwoman of the Board since 2010
• Other Corporate Affiliations:
• Chairman of Data Respons ASA and SinterCast AB
• Board member, Castellum, e-man, Fouriertransform,
MicronicMydata, SEI and Tallberg Foundation
• Member of the Board since 2010
• Other Corporate Affiliations:
•Chairman of Making Waves AS and Filmparken AS
• Board member, EMS Seven Seas ASA, Vizrt ASA
• Board of several fund-of-fund investment companies
• Member of the Board since 2012
• Other Corporate Affiliations:
• CFO, TV2
• Board member, Norsk Tillitsmann and GIEK
• Member of the Board since 2011
• Other Corporate Affiliations:
•Board member, Powercell AB, LeanNova AB and Senseair AB
• Member of the Board since 2011
• Other Corporate Affiliations:
• Chairman of SOS barnebyerNorge, Henie OnstadKunstsenter
and Civita AS
•Board member, Storebrand ASA, Statkraft SF/Statkraft AS,
Navamedic ASA, SosChildrens Villages International and SOS
CV USA
•Member of the Board (Employee representative)
•Manager Research and Development, Kongsberg Automotive
•Member of the Board (Employee representative)
•Measuring Operator, Kongsberg Automotive
•Member of the Board (Employee representative)
• HSE, Kongsberg Automotive

34
Financial calendar and Investor Relations contacts
Financial calendar 2013
3th
Quarter2013
4th
Quarter2013
Interim Reports
17 Oct 2013
13 Feb 2013
Presentation
18 Jul 2013
14 Feb 2013
Capital Markets Day : 03 Dec 2013
IR contacts
Hans Peter Havdal
President & CEO Telephone: +47 92 06 56 90
E- mail: [email protected]
Trond Stabekk
CFO Telephone: +47 98 21 40 54
E- mail: [email protected]
Philippe Toth
VP M&A and IRO Telephone: +47 98 21 40 21
E- mail: [email protected]
Kongsberg Automotive Holding ASA
Telephone: +47 32 77 05 00
For more information, see: http://kongsbergautomotive.com/INVESTOR-RELATIONS/
35
Disclaimer
This presentation contains certain forward-looking information and statements. Such forward-looking information and
statements are based on the current, estimates and projections of the Company or assumptions based on information currently
available to the Company. Such forward-looking information and statements reflect current views with respect to future events
and are subject to risks, uncertainties and assumptions. The Company cannot give assurance to the correctness of such
information and statements. These forward-looking information and statements can generally be identified by the fact that they
do not relate only to historical or current facts. Forward-looking statements sometimes use terminology such as "targets",
"believes", "expects", "aims", "assumes", "intends", "plans", "seeks", "will", "may", "anticipates", "would", "could", "continues",
"estimate", "milestone" or other words of similar meaning and similar
expressions or the negatives thereof.
By their nature, forward-looking information and statements involve known and unknown risks, uncertainties and other important
factors that could cause the actual results, performance or achievements of the Company to differ materially from any future
results, performance or achievements that may be expressed or implied by the forward-looking information and statements in
this presentation. Should one or more of these risks or uncertainties materialize, or should any underlying assumptions prove to
be incorrect, the Company's actual financial condition or results of operations could differ materially from that or those described
herein as anticipated, believed, estimated or expected.
Any forward-looking information or statements in this presentation speak only as at the date of this presentation. Except as
required by the Oslo Stock Exchange rules or applicable law, the Company does not intend, and expressly disclaims any
obligation or undertaking, to publicly update, correct or revise any of the information included in this presentation, including
forward-looking information and statements, whether to reflect changes in the Company's expectations with regard thereto or as
a result of new information, future events, changes in conditions or circumstances or otherwise on which any statement in this
presentation is based.
Given the aforementioned uncertainties, prospective investors are cautioned not to place undue reliance on any of these forward-
looking statements.