
Knudsen- and Torsion- Effusion Measurements of the Vapor ...
78
Western Michigan University Western Michigan University ScholarWorks at WMU ScholarWorks at WMU Master's Theses Graduate College 4-1969 Knudsen- and Torsion- Effusion Measurements of the Vapor Knudsen- and Torsion- Effusion Measurements of the Vapor Pressure of Manganese(II) Fluoride Pressure of Manganese(II) Fluoride Walter Clayton Hitchingham Follow this and additional works at: https://scholarworks.wmich.edu/masters_theses Part of the Chemistry Commons Recommended Citation Recommended Citation Hitchingham, Walter Clayton, "Knudsen- and Torsion- Effusion Measurements of the Vapor Pressure of Manganese(II) Fluoride" (1969). Master's Theses. 3046. https://scholarworks.wmich.edu/masters_theses/3046 This Masters Thesis-Open Access is brought to you for free and open access by the Graduate College at ScholarWorks at WMU. It has been accepted for inclusion in Master's Theses by an authorized administrator of ScholarWorks at WMU. For more information, please contact [email protected].
Transcript of Knudsen- and Torsion- Effusion Measurements of the Vapor ...
Western Michigan University Western Michigan University
ScholarWorks at WMU ScholarWorks at WMU
Master's Theses Graduate College
4-1969
Knudsen- and Torsion- Effusion Measurements of the Vapor Knudsen- and Torsion- Effusion Measurements of the Vapor
Pressure of Manganese(II) Fluoride Pressure of Manganese(II) Fluoride
Walter Clayton Hitchingham
Follow this and additional works at: https://scholarworks.wmich.edu/masters_theses
Part of the Chemistry Commons
Recommended Citation Recommended Citation Hitchingham, Walter Clayton, "Knudsen- and Torsion- Effusion Measurements of the Vapor Pressure of Manganese(II) Fluoride" (1969). Master's Theses. 3046. https://scholarworks.wmich.edu/masters_theses/3046
This Masters Thesis-Open Access is brought to you for free and open access by the Graduate College at ScholarWorks at WMU. It has been accepted for inclusion in Master's Theses by an authorized administrator of ScholarWorks at WMU. For more information, please contact [email protected].

KNUDSEN- AND TORSION. EFFUSION MEASUREMENTS OF THE VAPOR PRESSURE OF MANGANESE(II) FLUORIDE
Walter Clayton Hitchingham
A Thesis Submitted to the
Faculty of the School of Graduate Studies in partial fulfillment
of theDegree of Master of Arts
t
Western Michigan University Kalamazoo, Michigan
April 1969
Reproduced with permission of the copyright owner. Further reproduction prohibited without permission.

ACKNOWLEDGEMENTS
The Author wishes to express his appreciation to Dr. Adli S.
Kana'an for his direction in the course of this investigation.
Further acknowledgement is extended to Dr. Dean Cooke and Dr. Thomas
Houser for their constructive evaluation of the manuscript and to
Dr* Dale H. Warren and Dr. Robert E. Harmon and the staff of the
Department of Chemistry whose training, experience and encouragement
have been invaluable to me. The time saving technical assistance
obtained from Hr. Dick Durbin and Mr. Fred Ryba of the Physios and
Chemistry machine shop is also greatly appreciated. Mr. Max Anable's
assistance in preparing the photographs for the thesis is also
greatly appreciated.
Walter Clayton Hitohlngham
i
Reproduced with permission of the copyright owner. Further reproduction prohibited without permission.

MASTER’S THESIS M-1844
HITCHINGHAM, Walter Clayton KNUDSEN- AND TORSION- EFFUSION MEASUREMENTS OF THE VAPOR PRESSURE OF MANGANESE(II) FLUORIDE.
Western Michigan University, M.A., 1969 Chemistry, physical
University Microfilms, Inc., Ann Arbor, Michigan
Reproduced with permission of the copyright owner. Further reproduction prohibited without permission.

TABLE OF CONTENTS
INTRODUCTION.................... 1
CHAPTER I THEORETICAL................................. 3Knudsen - Effusion Method 3Torsion - Effusion Msthod...... ...... 5Correlation of the Knudsen- and Torsion-Effusion Methods.»....»......... 7Effect of Orifice Dimensions onEquilibrium fressures... 8
CHAPTER II EXPERIMENTAL..... ........................10
Description of Apparatus............. 10The Balance.......••••••...... 10The Torsion-Effusion Assembly. ..... 20The Optical Lever System............. 24The Vacuum System............*••»..*............. 26The Furaaoe and Temperature Controland Measurement... ..... 2?Calibration of the Thermocouple ...... 28Calibration of the Torsion Fiber. ............ 31Characteristics of the Effusion Cell.............. 35Operational Prooedure.... ............ 37
CHAPTER i n MEASUREMENT OF THE VAPOR PRESSUREOF MANGANESE (n) FLUORIDE.................. 40
Introduction............. 40Literature Review....... ..... 40Experiments.................... 4-2Results .... 44Discussion... .... 57Conclusions...... 64
ii
Reproduced with permission of the copyright owner. Further reproduction prohibited without permission.

Suggested Apparatus Improvements................ 66Suggestions for Future Work................... 6?
BIBLIOGRAPHY............................................ 66
VITA.................................................. 70
ill
Reproduced with permission of the copyright owner. Further reproduction prohibited without permission.

LIST OF TABLESPag#
Table I Measurements of Torsional Constants .......... 33
Table II Calibration of Torsion Filament used in Experiment V. 34Table IH Parameters of Effusion Cells ............... J6
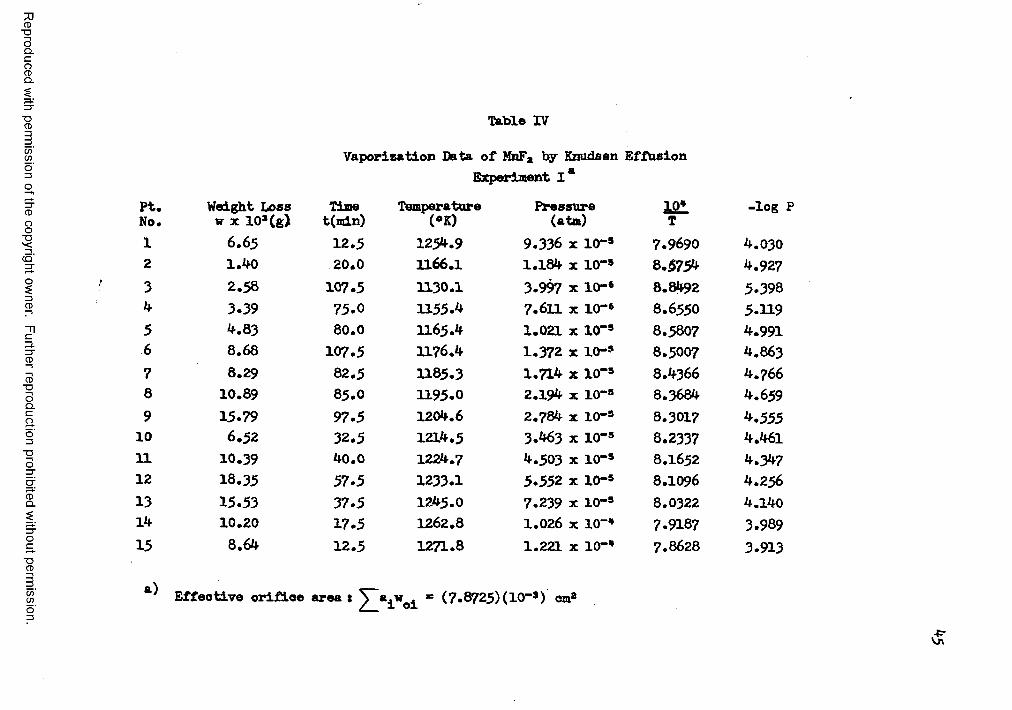
Table IV Vaporization Data of MnF* by Knudsen-EffusionExperiment I ............ 45
Table V Vaporization Data of MnFa by Knudsen-EffusionExperiment II .... 46
Table VI Vaporization Data of MnFa by Knudsen-EffusionExperiment III ...... 47
Table VII Vaporization Data of MnFa by Torsion-EffusionExperiment I H ................. 48
Tabie VHI Knudsen-Effusion Data of Vaporization for MnFaExperiment I V ...... 49
Table IX Vaporization Data of MnF* by Knudsen-EffusionExperiment V ....... 50
Table X Vaporization Data of MnFa by Torsion EffusionExperiment V ...... 51
Table XI Summary of Vapor Pressure Measurements of MnFa ..... 56
ir
Reproduced with permission of the copyright owner. Further reproduction prohibited without permission.

LIST OF FIGURESPage
Figure 1 Torsion-Knudsen Effusion Apparatus - 1 ...... 12
Figure 2 Torsion-Knudsen Effusion Apparatus - 2 ......... 13
Figure 3 Torsion-Knudsen Effusion Apparatus - 3 .... 14
Figure 4 Torsion-Knudssn Effusion Apparatus -4 ...........15
Figure 5 Vacuum System.............. .......... 17
Figure 6 Schematic of Torsion- and Knudsen-Effusion Apparatus .......... 19
Figure 7 Torsion-Effuslon Assembly ..... 22
Figure 8 Exploded and Assembled View of a Cell .......... 25
Figure 9 High Temperature Furnace....... 29
Figure 10 Knudsen-Effusion Data of MnFa Experiment I ......... 52Figure 11 Knudsen-Effusion Data of MnF, Experiment I I ...... 53
Figure 12 Knudsen- and Torsion- Effusion Dataof MnFj Experiment I H ...... 54
Figure 13 Knudsen- and Torsion- Effusion Dataof MnFa Experiment V ..... 55
Figure 14 Summary of Experiments ..... 58Figure 15 Knudsen- and Torsion- Effusion Data
of MnFa Experiment IH ....... 61
r
Reproduced with permission of the copyright owner. Further reproduction prohibited without permission.

INTRODUCTION
The vaporization behavior of manor materials must be desoribed
in terms of several simultaneous reactions. Even the elements do
not necessarily vaporize in a simple, well-defined form, for example
sodium vapor contains a mixture of Na and Naa; the vapor above
phosphorous contains various amounts of P4, Pa and P, depending upon
the temperature; sulfur vapor contains molecules as large as Ss.
Some well knovm compounds are known to vaporize as mixtures of
monomers and polymers ; e.g., the vapor phase above A1C13, P*05,
CuCl, and Ped3 contains the monomers as well as AlaClj, P40lc,
Cu3Cl3 and FeaClt respectively. Other compounds are known to
decompose rather than simply vaporize, for example Aga0 decomposes
to *nd 0»» and C*Ha decomposes to and Ba.
The investigation of ternary systems may be further compli
cated by an Increase in the number of components. In oontrast to binary systems, ternary systems have not been thoroughly investigated
although a variety of such compounds has been known for some time.
An important class of ternary compounds is that of complex halides
of the form M*M^X3 and where M* represents the Alkali
metals, M11 and represent divalent and trivalent metals
respectively and X refers to F or Cl. Gaseous ternary compounds of
the mentioned types have been reviewed recently by Buchler
et al,^ Information on the volatility and stability of suoh complexes, in the vapor phase, is limited to measurements of
1
Reproduced with permission of the copyright owner. Further reproduction prohibited without permission.

2
partial pressures of vapors in equilibriua with the melts of
mixtures, of the two binary components M^X and or
Only in a few eases suoh studies over the crystalline complex have
been reported*
The accumulation of reliable information on the volatility of
complexes and its interpretation from the standpoint of thermo
dynamics, kinetics and chemical bonding is important in understanding
the principles of complex formation and the relation between the
properties of the simple components with those of their complex
species. To study the vaporization behavior of suoh complex salts,
the vapor pressure of the pure components of these salts as well as
the partial pressures of the gaseous speeies are needed* It is the
objeotive of this program to study the vaporisation of manganese
difluoride by the simultaneous Knudaen-effusion and torsion-effusion
techniques, and to evaluate the suitability of the instrument
constructed for suoh simultaneous measurements. The advantage of
this instrument is that it provides vapor pressures and estimates of the average molecular weight of the vapors, in a continuous
experiment, over a range of temperature and pressure.
Reproduced with permission of the copyright owner. Further reproduction prohibited without permission.

CHAPTER I
THEORETICAL
Knudsen-Effusion Method
The Knudaen-effusion method is widely used in measurements of
equilibrium vapor- and dissociation- pressures in the 10“* - 10“6
Torr range. This method is based on the Kinetic theory of dilute 2gases. It utilises the rate of flow of a vapor through an oriflee
from a volume saturated with the vapor. This theory indicates that
in a closed system the weight of gas molecules, V, striking the
walls of a container of surface area A0, in time t, is related to
the gas density/7 and to the mean velooity of the gaseous molecules
e by *
J L = H 5 (I-U
Equation (1-1) can be put into a more practical form by substituting
for /O using the ideal gas law, and for c from the Kinetic theory tmm
where R is the average molecular weight of gaseous molecules;
5 ■ (fsfThus :
T * t * r = I S s r (I-*)1 FM 18RT\a4 rt \rr%)
3
Reproduced with permission of the copyright owner. Further reproduction prohibited without permission.

3whloh rearrange* to the Knudaen-effusion equation !
where is the pressure of gaseous molecules obtained from
Knudsen-effusion experiments.
Validity of equation (1-5) is restricted by the following
conditions:
(1) the effusing vapor represents a saturated vapor in equilibrium
with the condensed phase in the effusion cell;
(2) the pressure outside the cell is negligibily low hence no
molecules re-enter the cell once they pass through the orifice;
(3) the flow is free molecular-flow through the orifice — no
molecular collisions of vapor within the orifice;
(4) the fraction of vapor molecules intercepted by the orifice walls
and eventually returned to the cell is negligible.
In practice the first three conditions are realised to a
reasonable degree. Condition four is influenced by the length toradius ratio of the orifloe. An ideal orifice of infinite thinness
is almost impossible to attain. A cylindrical orifloe may be
visualized as a channel with a linear pressure gradient along its
axis. A correction for the reflection of molecules in the channel4back to the cell was introduced by Clausing . The correction factor,
referred to as the Clausing factor, W0, represents the "transition probability", the probability that a molecule having entered the
orifice inlet will escape through the orifice outlet. It is
expressed by t
Reproduced with permission of the copyright owner. Further reproduction prohibited without permission.
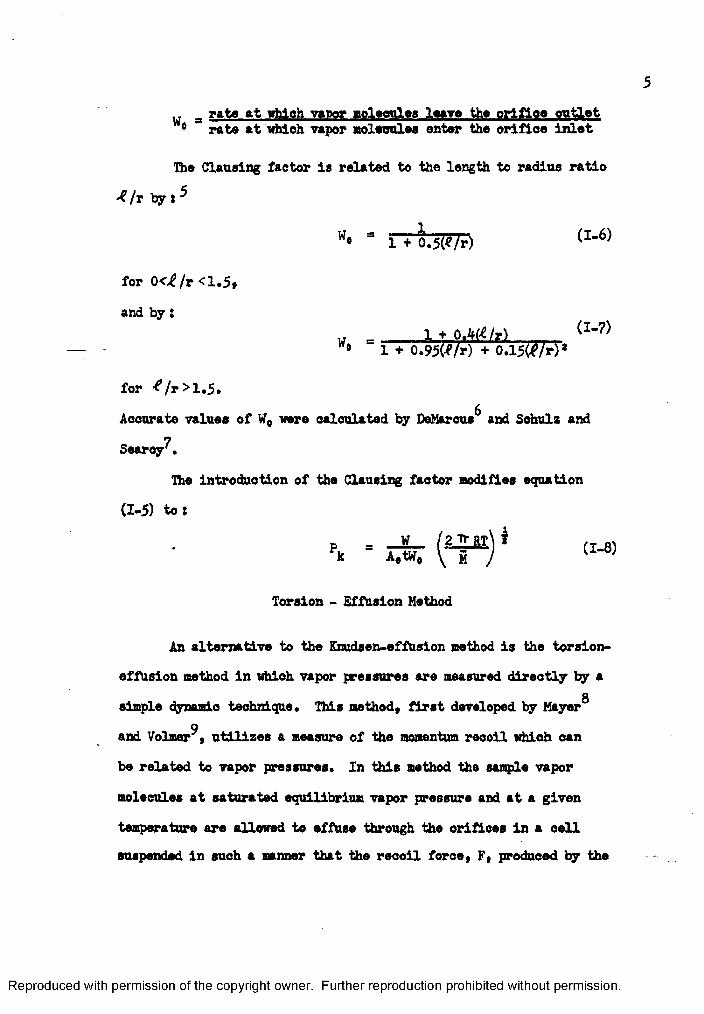
M a rate at which vapor molecules love the orifloe outlet 0 rate at which vapor molecules enter the orifloe inlet
The Clausing factor is related to the length to radius ratio
•*/r by:5
W° = 1 + 0.5(*/r)
for 0<£/r <1.5*
and by:w X + o M M ___ (I_7)w# 1 + O.W/r) + 0.15(^/r)*
for 4 /r >1.5.Accurate values of WQ were calculated by DeMarcus and Schulz and
7Searcy .
The introduction of the Clausing factor modifies equation
(1-5) to:
P = -J£_ (I.8)Fk a , w # \ g ) u
Torsion - Effusion Hethod
An alternative to the Knudserweffusion method is the torsion- effusion method in whioh vapor pressures are measured directly by a
Osimple dynamic technique. This method, first developed by Mayer
9and Volmer , utilizes a measure of the momentum recoil which can
be related to vapor pressures. In this method the sample vapor
molecules at saturated equilibrium vapor pressure and at a given
temperature are allowed to effuse through the orifices in a cell suspended in such a manner that the recoil force, F, produced by the
Reproduced with permission of the copyright owner. Further reproduction prohibited without permission.
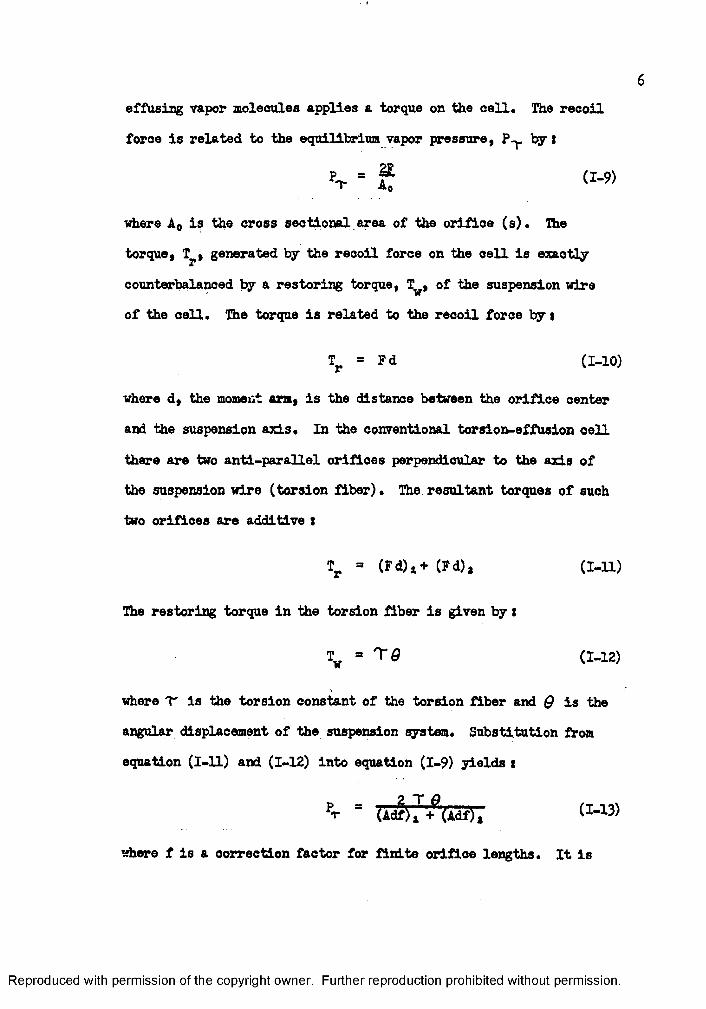
effusing vapor molecules applies a torque on the cell. The recoil
force is related to the equilibrium vapor pressure, P-j. by t
where A0 is the cross sectional area of the orifice (s). The
torque, Ty, generated by the recoil force on the cell is exactly
counterbalanced by a restoring torque, Tw, of the suspension wire
of the aell. The torque is related to the recoil force by t
Tr = Fd (1-10)
where d, the moment arm, is the distance between the orifice center
and the suspension axis. In the conventional torsion-effusion cell
there are two anti-parallel orifloes perpendicular to the axis of
the suspension wire (torsion fiber). The resultant torques of such
two orifices are additive t
Tr = (F d )* + (F d ) . (1 -1 1 )
The restoring torque in the torsion fiber is given by *
Tw * T 9 (1-12)
where T is the torsion constant of the torsion fiber and Q is the
angular displacement of the suspension system. Substitution from
equation (1-11) and (1-12) into equation (1-9) yields s
Pt = (idf) i + (Adf)a
where f is a correction factor for finite orifice lengths. It is
Reproduced with permission of the copyright owner. Further reproduction prohibited without permission.

7analogous to the Clausing factor in the Knudsen-effusion equation.
It represents the ratio of the recoil force resulting from effusion
through an orifloe of finite length to that expected if the orifice
is of infinitesimal length. This factor, referred to as the pressure
factor, had been determined by Searcy and Freeman*0 and a more7accurate tabulation of it m s reported by Schulz and Searcy'•
Correlation of the Knudsen- and Torsion-Effusion Methods
The cell in the torsion-effusion method is a modified Knudsen
cell and oan be used to measure the torque and the rate of weight
loss simultaneously. The torsion pressure calculated by equation
(1-13) oan be used to oaloulate the average molecular weight, M,
of the vapor species. By substitution of PT for P^ in equation
(1-8) and rearrangement one gets t
5 - 2Tf BI (-pT wt)' U-WIf the average molecular weight, M, is different fTom the assumed
molecular weight, M, one may speculate on the nature of the vaporization process and deduce whether the effusing vapor consists
of a mixture as a result of dissociation or polymerisation. The
average molecular weight, M, is related to the molecular weights,
M , of the individual vapor species in such a mixture by** l
M = - ■(£ (1-15)i
where m^ is the mass fraction of vapor species i in the effusing vapor.
Reproduced with permission of the copyright owner. Further reproduction prohibited without permission.

8
Usually the accepted upper pressure Unit for an effusion
experiment is that pressure for which the mean free path of the
molecules is at least ten times the orifloe diameter* There is
considerable evidence^” that equation (1-8) is valid at higher
pressures than the above restriction permits. Searcy and Schulz^
have found, by torsion-effusion measurements with orifices of very short channel lengths, that in the transition region the forces
exerted by effusing molecules are the same as those predicted by
the molecular-flow equation.
Effect of Orifice Dimensions on Equilibrium Pressures
The pressure obtained from an effusion experiment represents
the pressure inside the oell which, due to continuous effusion
through the orifloe, is expected to be less than the equilibrium17pressure . The equilibrium pressure, P^, is related to the
Knudsen pressure, P^, by i
% ‘ d + 5TT > pk (I-l6)cwhere S is the sample surface area, O. the condensation coefficientcdefined as the fraction of molecules striking the sample that
condense. The above equation follows from mass balance considerations
where the rate of evaporation equals the sum of the rate of effhsion
and the rate of condensation. Motzfeldt^, Whitman^ and20Rosenblatt have discussed the theoretical aspects of the treatment
which led to equation (1-16), Speiser and Spretnak introduced
Reproduced with permission of the copyright owner. Further reproduction prohibited without permission.
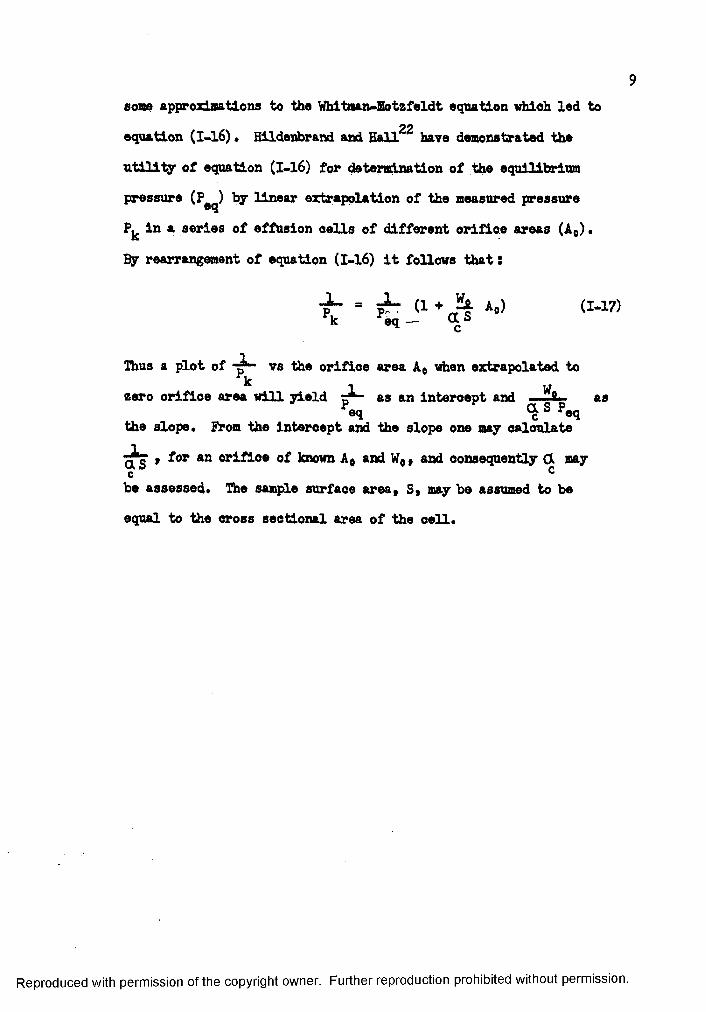
9some approximations to the Whitoan-Eotzfeldt equation vhieh led to
22equation (I-l6) * Hildehbrand and Hall have demonstrated the
utility of equation (I-l6) for determination of the equilibrium
pressure (P ) by linear extrapolation of the measured pressure eqin a series of effusion cells of different orifloe areas (A0).
By rearrangement of equation (1-16) it follows that:
■p“ = P “ (1 + A (I*17)eq - CtS
Thus a plot of r^- vs the orifice area Ae when extrapolated tok 1 Wzero orifice area will yield as an intercept and . as
Peq <JSP«!the slope. From the interoept and the slope one may calculate
0 2 7 for an orifice of known A0 and W0, and consequently OL may c cbe assessed. The sample surface area, S, may be assumed to be
equal to the cross sectional area of the cell.
Reproduced with permission of the copyright owner. Further reproduction prohibited without permission.

CHAPTER II
EXPERIMENTAL
Description of Apparatus
The experimental system used for simultaneous weight-loss
and torsion-effusion measurements is quite simple; it can best be
desoribed by consideration of its individual components. The
essential parts of the apparatus used (shown in Figure 1-5) include
a vacuum recording balance, a torsion-effusion assembly, a vacuum
system, a furnace, and a temperature control system. A schematic
of the assembly is shown in Figure 6.
The Balance
The vacuum reoording balance used in this work was an
Ainsworth sendmioro vacuum balance type RV-AU-1. The balance
mechanism enables automatic addition or removal of small switch
weights in increments of 10 mg up to ^00 mg. Small changes in
weight are deteoted by a variable inductance transducer and are
recorded on a chart recorder via a bridge circuit* The ten inoh
span of the chart corresponds to a 10 mg weight change. The
reciprocal sensitivity of the balance is 0.03 mg with a re
producibility of -0.03 mg. The balance and weight change mechanism
are mounted on a base plate and covered by a pyrex bell jar.
Connection to the vacuum system and the weighing chamber is
through a hole in the base plate beneath the left stirrup.
10
Reproduced with permission of the copyright owner. Further reproduction prohibited without permission.

11
KE7 TO FIGURES 1 - 4
TORSION - KNUDSEN EFFUSION APPARATUS
1. Vaouum recording balance
2. Balance stand
3. Brass extension tube
4. Torsion scale
5. Torsion scale and light soured
6. Recorder
7. Glass window
8. Brass evacuation line
9. Liquid-nitrogen trap
10. Oil diffusion pump
11. Furnace
12. Potentiometer
13. Temperature Controller
14. Ionization- and thermocouple- gauges console
15. Ioe bath
16. Thermocouple gauge
17. Liquid nitrogen feed-control unit18. Ionization gauge
19. Quartz tube
20. D. C. power supply for electromagnet
Reproduced with permission of the copyright owner. Further reproduction prohibited without permission.

12
TORSION - KNUDSEN EFFUSION APPARATUS - I
Reproduced with permission of the copyright owner. Further reproduction prohibited without permission.

13
TORSION - KNUDSEN EFFUSION APPARATUS - 2
Reproduced with permission of the copyright owner. Further reproduction prohibited without permission.

Reproduced with permission of the copyright owner. Further reproduction prohibited without permission.

15
mihim
TORSION - KNUDSEN EFFUSION APPARATUS - 4
Reproduced with permission of the copyright owner. Further reproduction prohibited without permission.

16
KEY TO FIGURE 5
VACUUM SYSTEM
1. Mechanical pomp
2. Diffusion pump and liquid-nitrogen trap
3. Roughing valve 4-. Main-g&te valve
5* Fore-line vacuum valve
6. Rubber tubing connection between the mechanical and diffusion pumps
7* Liquid-nitrogen Dewar
Reproduced with permission of the copyright owner. Further reproduction prohibited without permission.

17
VACUUM SYSTEM
Reproduced with permission of the copyright owner. Further reproduction prohibited without permission.

18
KEI TO FIGURE 6
SCHEMATIC OF TORSION- AND KNUDSEN-EFFUSION APPARATUS
1. Furnace
2. Vacuum recording balance
3. Diffusion Pump
4. Ionization gauge
5* Thermocouple gauges
6. Mechanical Pump
Reproduced with permission of the copyright owner. Further reproduction prohibited without permission.

B
Reproduced with permission of the copyright owner. Further reproduction prohibited without permission.

20
The Torsion-Effusion Assembly
The torsion-effusion assembly (shown in figure 7) whioh was
suspended from the left beam of the balance consisted of, in the
order from top to bottom, a stool and connector, torsion fiber,
mirror and damping disc assembly and effusion cell and its
suspension assembly.
The stool and connector
The torsion assembly was connected to the pan of the balance
via a small chuck fastened to a rotatable drum fitted into an
aluminum stool. The tripod-shaped stool rested on the pan through
three equispaoed brass pins projected on a circular groove in the
pan. The stool and assembly were centered by guiding its pins along
the pan groove whose center coincides with the torsion fiber and the
axis of the surrounding brass cylinder. Rotation and lateral alignment of the torsion assembly were achieved by rotation of the chuck carrying drum. This arrangement was necessary to direct and
position the mirror used to measure the angular deflection of the effusion oell in a direction convenient for measurement.
The torsion filament
An annealed, high purity tungsten wire with a diameter of
0.002 inch or 0.0015 inch and a length of approximately 14 inches, was attached to the above mentioned ahuok. At the lower end of
Reproduced with permission of the copyright owner. Further reproduction prohibited without permission.

KEY TO FIGURE 7
TORSION-EFFUSION ASSEMBLY
1. Stool and connector
2. Torsion wire
3. Mirror
Window
5. Seale
6. Damper
7. Effusion cell
8. Thermocouple
Reproduced with permission of the copyright owner. Further reproduction prohibited without permission.

urn
FIG. 1, TORSION-.EFFUSION ASSEMBLY
Reproduced with permission of the copyright owner. Further reproduction prohibited without permission.

23
the wire was another ehuok whioh supported a mirror, a damper,
and a connecting tantalum tube. Tantalum was chosen beoause of
its relative resistance to corrosion.
The mirror, coxmector tube and damper
The mirror was cemented with epoxy to an aluminum rod fastened
to the lower chuok. A notched position in the aluminum rod allowed
positioning of the mirror such that its front surface was approxi
mately in the plane of the torsion assembly axis. The mirror was
a front-surface galvanometer type (Leeds and Northrup) 0.5 inches
in diameter and concave with a radius of curvature of one meter.
A thin-walled tantalum tube, 0.125 inches in diameter,
0.005 inches in wall thickness, and 15 inches in length, served as a connector to the effusion cell. Its upper end was joined to an
aluminum rod supporting the mirror by a tungsten pin. The damper,
an aluminum disc, 1,5 inches-in diameter and 0.125 inches in thickness, was inserted onto the tantalum tube and positioned at about 6 inches below the mirror by a set screw. Hie effusion cell was
connected to the lower end of a carefully matched graphite dovetail
which facilitated assembly and disassembly. Lateral lines were scribed on the dovetail to align the cell with the axis of the
suspension system.
The effusion cell --
The effusion cells used in this work were fabricated from spectroscopic grade graphite. The cell, 1.5 inches long, 0*500 inches
Reproduced with permission of the copyright owner. Further reproduction prohibited without permission.

Zk
In diameter and. 0.063 inch wall thickness, had two compartments
drilled to a depth of 0.500 inch each from each end. The middle
solid section, 0.375 inches long, m s maohined to match the dovetail
of the connecting tube. The cell end openings were fitted with two-
degrees tappered graphite plugs. This construction enabled easy
loading of the sample. Two holes were drilled on opposite sides
of the cell 1B0° out of phase, antiparallel to each other, and
perpendicular to the oentral axis of the suspension system. A line
scribed along the cell's vertical axis extending to the center of
the dovetail slot in the oell coincided with the suspension
system axis and facilitated the cell alignment by ooineidenoe with
the matching lines on the connecting dovetail. The walls in the
insediate vicinity of the orifices were thinned down by milling to
provide reasonably thin-wall orifices. A sketch is shown in Figure 8.
The Optical Lever System
The optical lever system consisted of a collimated light
source, a mirror of the torsion assembly, and a scale. A beam of
light from the light source to the scale, after reflection at the mirror, aided in measurement of the cell deflection. The scale was
a flexible three foot steel ruler graduated in two hundredths of an
inoh. This scale was mounted to a plexiglass plate maohined to
form an arc of a circle. The mounted scale formed an ere of a oircle,
36 inches in radius with a center of rotation coincident with the axis of the torsional assembly. The distanoe of the support for the
Reproduced with permission of the copyright owner. Further reproduction prohibited without permission.

25
_lU
ui
I ICO
I I______ 1
IJ----- 1
Reproduced with permission of the copyright owner. Further reproduction prohibited without permission.

26
plexiglass plate was adjusted to align the scale to the radius
cited above. The elevation of the support was adjusted so that the
reflected light beam from the mirror would fall on the upper portion
of the scale with a mini mam lamp adjustment. The lamp used was a
conventional galvanometer projector.
The Vacuum System
The balance was connected to the vacuum system through a
2 inch diameter and 18 inches long brass tube which surrounded the
torsion assembly. This extension tube was attached to the balance
base plate by an 0-ring flange. A similar 0-ring flange at the
other end of the tube Joined the quarts heating chamber. The
heating chamber was an 18 inch long, 70 mm inside diameter, closed end, quarts tube fitted with a 2 inch grooved flange pipe. A port
in the extension tube fitted with a flat glass window, at the same level of the mirror in the torsion assembly, permitted incidence and
reflection of the light beam used in deflection measurements. A
T-Joint soldered to the extension tube at about 4 inches below the
balance base plate allowed oonneotion of the blanaoe to the main
pumping system through a vaouum coupling.
The main pumping system shown in Figure 5 consisted of a
ohevron baffle, a cold trap, a 2 inch-four stage fractionating oil
diffusion pump with pumping speed of 285 liter/see (N.B.C. Model
HS2-300) and a two stage mechanical fore-pump with a pumping speed of 150 liter/min (Precision Scientific Model D-150). A high vaouum
Reproduced with permission of the copyright owner. Further reproduction prohibited without permission.

gate valve separated the balance and weighing extension tube from the
diffusion pump. Two, 1 inch vaouum valves were used in roughing- and
fore- lines in the all-metal vacuum pumping system* Two (| inch)
bleeding valves allowed purging the appropriate sections of the
system with air dried over dryrite. The pressure in the vacuum
system was monitored with one ionization gauge, two thermocouple
gauges and a regulated control consols (H.R.C.-720).
The Furnace and Temperature Control and Measurement
The furnace and temperature control
The furnace was a resistance wound furnace. The core was a
mullite tube 3 inches in diameter and 12 inches long. The heating
element was B/&S 15 gauge Kanthal wire wound in such a way to
compensate for heat loss at the ends and to secure a long hot zone
of uniform temperature at the center. A secondary heating element
of B^S 18 gauge ohromel wire was wound on a 3.75 inch-diameter
mullite tube. The windings of the inner tube were insulated by
using Norton Alundum refractory cement. The windings of the outer tube were insulated with an asbestos-fiber coating. The concentric
ceramic tubes of the main and secondary heating elements were
housed in a cold-rolled steel shell, 8 inches in diameter and
11 inches in height. Size 20 abrasive grain Norton Alundum was
used for insulation between the outer ceramic tube and the metal
housing. The furnace was capped at either end with asbestos discs
which ware grooved to permit a tight fit with the metal housing.
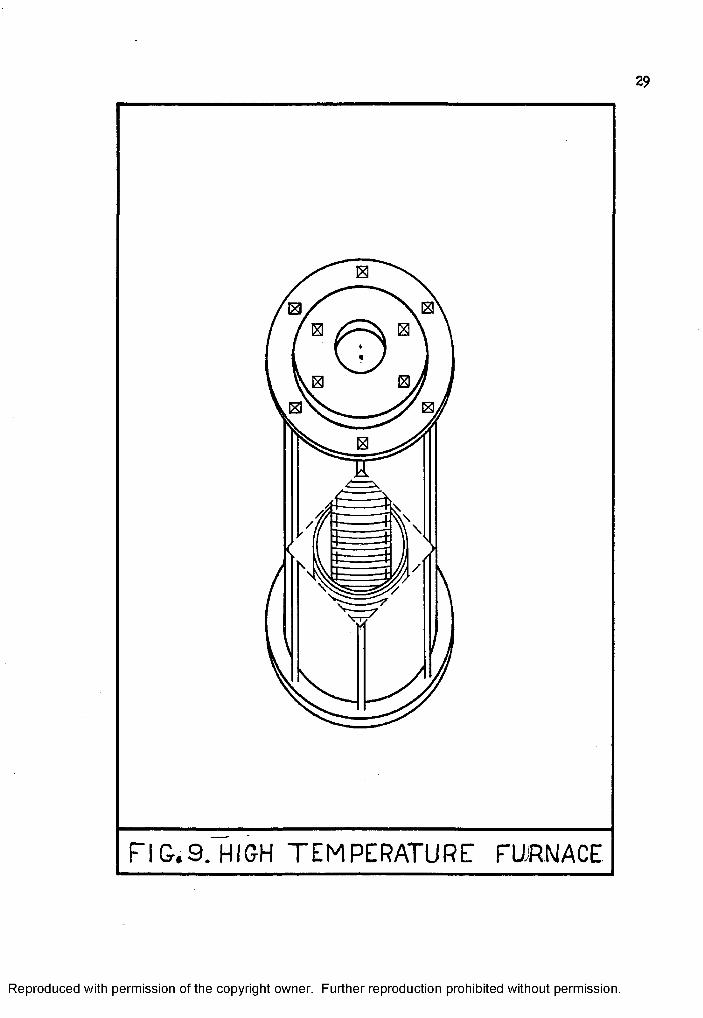
Reproduced with permission of the copyright owner. Further reproduction prohibited without permission.

28
The upper cap contained a circular opening which allowed insertion
of the quartz tube surrounding the effusion cell. The caps were
held in place with six threaded rods which passed through the
asbestos caps, as shown in Figure 9. Power for the furnace was
supplied from a variable transformer. The temperature of the cell
was maintained within £2.0 degrees by means of a time-proportioning
controller (Honeywell VersatrorrLc, Model R7161H).
Temperature measurement
The torsion cell temperature was measured with a chromel-
alumel thermocouple encased in a protective refractory tube. The
thermocouple was securely fixed approximately 0.5 cm above the top
of the effusion cell. The thermocouple leads extended to the
outside of the system through a Conax vacuum seal on the suspension
housing. The thermocouple cold Junction was at the reference
temperature of 0°C in an ioe-water bath. The thermocouple output
was measured by & portable potentiometer (Honeywell No. 27 5)* The relation between this thermocouple and the temperature in the
effusion cell was established by calibration against a prestandard
ized thermocouple as described in the next section.
Calibration of the Thermocouple
The relation between the output of the experimental thermo
couple used for temperature measurements in an experiment and the temperature in the effusion cell was established by calibration
Reproduced with permission of the copyright owner. Further reproduction prohibited without permission.
[3
13IS)
IE!
F IG .9. HIGH TEMPERATURE FURNACE
Reproduced with permission of the copyright owner. Further reproduction prohibited without permission.

against a prestandardized thermocouple. The prestandardized
thermocouple, referred to as the standard thermocouple, was placed
inside a cell through a hole in one of its caps. The cell was
suspended in an identical position to that of an actual experiment.
The thermocouple wires were passed through a vacuum sealed plug
located in the port of the glass window in the suspension housing.
The cold joints of the two thermocouples, the standard and the
experimental, were at the reference temperature of 0°C in the same
ioe-water bath. The emf outputs of both thermocouples were read
by the same portable potentiometer under virtually the same operating
conditions with the system evacuated to a pressure in the normal
operating range of 10"5 to 10’* Torr. Intereomparison of the two
thermocouples was over the range of temperatures used in the
effusion studies. After intereomparison, the standard thermocouple
was removed from the system. The standard thermocouple was
prestandardized against the freezing temperatures of lead, zinc,
aluminum, and oopper. The resulting standardization of temperature
vs. emf of the standard thermocouple was fitted into a linear
equation by a least-squares fit according to i
T (°K ) = 2.75386 x 10* + 2.42216 x 10 V (IX-1)s
Two calibrations were performed; the first was used to calculate the
temperatures for experiments I-IV and the second was used to calculate the temperatures for experiment V. The relation between
the output voltage of the experimental and standard thermocouples,
for each calibration, was fitted into a linear least-squares
Reproduced with permission of the copyright owner. Further reproduction prohibited without permission.

31
equation where :
Vg = 0.159822 + 1.00646 v (II-2A.)
V = 0.10917 + 0.99133 (II-2B)s oxp#
The final equation for the temperature of the torsional cell
in terms of the emf of the experimental thermocouple was derived by
substitution for V in equation (II-l) from equations (II-2) I s
T(°K) = 279.257 + 24.378 Vexp> (1I-3A)
T(°K) = 278.030 + 24.012 VQxp> (II-3B)
Equations (II-2A) and (II-3A) refer to the first calibration
and the respective B equations refer to the second calibration.
Propagation of the errors in these constants and the estimated
precision of measurement of VQXp yields an estimated error of
±0.25°K in the temperature. The maximum average deviation of all
temperatures measured for in the experiments was i2.5°K;
ho.*ever» the deviation at most temperatures was in the range of
tzS'K.,
Calibration of the Torsion Fiber
The torsional constantwas determined by using the
assembly as a torsional pendulum in which the cell was replaced by
a cross bar which supported a demountable ring of known moment of
inertia. The periods of oscillation of the pendulum, with and
Reproduced with permission of the copyright owner. Further reproduction prohibited without permission.

32
without the ring mounted on the oross bar, T2 and T* respectively,
were then measured. The torsional constant was calculated from g
_ 2TT* M (r2* + r32)T - r J T i ? CnJ,)
where rt and r2 are the inner and outer radii of the ring and M is
the ring mass. The measured torsional constants are listed in
Table I. Also listed in this tabulation are the results of the
propagated errors. The individual errors in mass, radius and period
are those estimated from the precision of the respective measurements.
The largest and most decisive of these errors is that associated with
the measurement of the periods with the ring in place on the
pendulum. Hie estimated precision, in seconds for T2 and T*
corresponds to an error in '"t" of i0.0035, a value which is consistent with the differences obtained from repeated measurements; i.e.
tO.0010 in the case of the wire used in experiment V. The accuracy
in the measured torsional constant is found from these estimated
accuracies to be 0.1$. This number is consistent with the results
of several measurements of the torsional constants of several
samplings of this particular diameter of wire. Table II lists the
data of a typical calibration measurement. Since it seemed apparent
that the torsional constant of the filament might change with
changes in load, it was essential that two rings of different
moments of inertia be used. Brass and aluminum rings of masses
39.^53g and 11.9604g respectively were used. The mass of the
cells used were within this range. The change in the torsional
Reproduced with permission of the copyright owner. Further reproduction prohibited without permission.

Reproduced
with perm
ission of the
copyright ow
ner. Further
reproduction prohibited
without
permission.
Wire diameter and
Identification
1 (0.002")
2 (0.002")
3 (0.0015")
Table IMeasurements of Torsional Constants
Characteristics of Aluminum and Brass RingsParameter Aluminum Brass
inner radius rA (am) 2.699 2.696outer radius ra (cm) 2.858 2.860mass m (g) 11.960** 39.4653moment of inertia I (gm cm4) 92.411 304.83
Torsional Constant Calibration DataTorsional Constant
dyn. am. rad.Experiment Material of ring number and cross bar
Time of Oscillation sec/period
for aross for oross bar bar. and
ringTi T*
III Aluminum 11.379 * o.oiQ 38.491 ± 0.21q 2.700Brass 15.32? ± 0.024 68.70g ± O.I62 2.682
IV Aluminum u.176 ± o.oi3 37.912 ± 0.05? 2.780Brass i5.oi5 ± o.oi3 67.56q ± 0.09 ^ 2.774
V Aluminum 19.41q ± 0.03 ^ 66.12 -i 0.12 0.913!
-l
VjJVjO

34
Calibration of
Run CountsNo.
Aluminum Ring and Bar1 46
2 48
3 504 52
5 546 56
7 588 60
Aluminum Bar1 762 78
3 80
4 82
5 84
6 86
7 88
8 90
Table IITorsion Filament used in Experiment V
Time Period T(sec.) sea. period"1
1519.0 23 66.043
1586.2 24 66.0921654.4 25 66.176
1721.2 26 66.20q1784.4 27 66.08
1851.0 28 66.1071920.0 29 66.20?
1987.4 30 66.24Avg. 66,14^
737.0 38 19.395
756.5 39 19.39?778.6 40 19.465
798.3 41 19.471817.3 42 3.9.46Q
836.9 43 19.463854.4 44
873.1 45 19.402
Avg. 19.43^
Reproduced with permission of the copyright owner. Further reproduction prohibited without permission.

35
constant due to the change in the load, e.g. using calibration rings
of aluminum and brass, is shown in Table I.
The method used to obtain the period of osoillation was as
follows : the calibration ring and cross bar suspended from the
torsion assembly were set oscillating by passing a magnet near the
damping disc and then removing it. The magnitude of oscillation was
usually 180° each side of the center. The assembly was allowed to
oscillate several times. The period of oscillation was measured
from the center point of oscillation using the projector and scale
of the optical lever system as an indicating device and a photo
cell connected to an electric counter to count the number of
oscillations over a period of time. The oscillations time was
measured to 0.1 second with an electric timer.
Characteristics of the Effusion Cell
The characteristics of the cells were measured with a
travelling microscope which could read to -0.0025 mm. The diameter
of each orifice was measured 4t 45° intervals. The average of the
measurements was used as the diameter of the orifice. The moment
arm was measured from the inside edge of the orifice to the scribed
central axis. The radius of the orifice was added to this value
to obtain the total moment arm length (d). This represents the
perpendicular distance from the axis of the cell to a line through
the center of the orifloe. The thickness of the orifioe was
obtained using a micrometer oaliper which read to 10.0005 inch. The
characteristics of the cells used are given in Table III.
Reproduced with permission of the copyright owner. Further reproduction prohibited without permission.

36
iKR O «HUc-\SON• rc-•
CM*0u-\Sioo•
d*|*00•
C•
CMCos+«£•£•QV (• w w W w w W
CM&
CM Os§ 3& &• ♦O O
3CMCs.Cs- fc
CM rs CM SO& »o Cs- us* Os£ o OS •oOs Os CO CMCS. ts. CS- Cs- 00• • • • •o O o o o$OsCM00
n3og§%4WVlOm
i2
R O R O “
H
1 I ?
V* a o o o «5 5 -<] 8
so so \r* vr\ it* u-\ c ro
ft «o «
so so«£* W\£ £ £>a o • •o o
O VT\Br >- ci rs o o
CMO CMO CM CM O O CM CM O O
£ ££ £ • •rH H
O»
«H bH
*»'oHn1OH
*>4,rH
c-OI
nbH
f)1OH«IoH
«bHK H K K k k k K k ko
s sOCOH o00O'*CMs
oo3 3 8&
CMCS.3o£»0 »A d Cs. SO N sO d d
00OsCM8Cs-COto8
&Osa
SoCMrHCM£3
& CMO£3 lCs-fea 3rHO o o d o o o o o O
H CM rH CM H N H CM rl CMoi
1H ■fHH01 3
Reproduced with permission of the copyright owner. Further reproduction prohibited without permission.

37
Operational Procedure
The operational procedure of a Knudsen-Torsion experiment
is comprised of two steps t (1) outgassing of the cell and
(2) measurement of the rate of seight loss and torsional defleotion
of the cell containing the sample being studied.
In the outgassing processt the system was assembled without
a sample, as described below, and heated under vacuum to a higher
temperature than the maximum temperature of the desired experiment.
This step was necessary to insure that no weight loss occtired due
to gases adsorbed in the graphite cell.
An effusion measurement, on a sample divided between the
two cell chambers, was started by weighing the suspension system.
Then approximately one gram of sample, MnFa, was introduced into a
graphite cell of known weight. The cell was then attached to the
suspension system via the dovetail connection. The weights on the
pan of the balance were then adjusted to bring the recorder pen to
scale. The mirror on the suspension system was adjusted so that a
zero point would be near the end of the optical system scale. The
bell jar was then placed over the balance. The quartz tube around
the cell was bolted in place at the bottom of the brass suspension
tube. Once the mirror adjustment had been made, and the system was
completely isolated, the system was evacuated to a pressure of
about 10"4 Torr. The zero point of the torsion apparatus was
measured on the torsion scale. At this point, the furnace was
Reproduced with permission of the copyright owner. Further reproduction prohibited without permission.

r&ised into its position around the quartz tuba and the system mas
heated to 73°K where temperature stabilisation was allowed to take place. Again a zero point was measured on the torsion soale to
obtain the effect of the resistance furnace on the zero point. The
temperature was raised in 200° increments to a temperature of
1273°K. After a weight loss of 10*20 mg, the temperature was
lowered to a point in the normal working range between 1130°K and
12$3°K* The torsion deflection and the rate of weight loss were
measured at 10° intervals throughout the above temperature range.
These measurements were performed at subsequent temperatures
selected at random. This approsoh was adopted to note the internal
consistency of the vapor pressure under such random choioe of
temperature. Thermal equilibrium was normally established within
20*30 minutes after attaining a given temperature.Effusion measurements were in the temperature range 1130*K to
1263°K. In one experiment (experiment IV) the sample was heated to
about 1153°K, after which it was cooled and the system was opened to observe changes in the characteristics of the sample, such as melting
or oolor changes. After making these observations, the system was
closed, in the same manner as desoribed above, and heated above
1153°K where measurements at higher temperatures were taken. The
upper temperature limit was imposed by the increase in the rate of
weight loss beyond the limits of the validity of the effusion equation.
After the upper temperature limit had been reached the system was
cooled and opened. The suspension system was weighed and analysis for
Reproduced with permission of the copyright owner. Further reproduction prohibited without permission.

manganese was carried out on the sample residue. Torsion
deflections were read by employing the galvanometer projector of
the optical lever system. The deflection projected on the scale
was read to to.02 inch. The projected deflections were twice as
great as the rotation of the torsion assembly itself, because the
light beam was reflected from the mirror surface. The projected
defleotion angle at a given temperature, was calculated from the
distance between the mirror and the center of scale and the distance
between the zero point and the projected image. The projected
deflection angle, divided by two, gave the actual angular deflection.
The weight loss during a measurement period as recorded on a chart
recorder was read to a precision of ±0.03mg. The temperature was
measured from the output of the experimental thermocouple using the
Honeywell portable potentiometer with an ioe-water bath as a
reference.
Reproduced with permission of the copyright owner. Further reproduction prohibited without permission.

CHAPTER IIIMEASUREMENT OF THE VAPOR PRESSURE
OF MANGANESE (II) FLUORIDE
Introduction
The apparatus to measure the Knudsen and torsion effusion
simultaneously was evaluated by measurement of the vapor pressure
of manganese (II) fluoride. This compound proved convenient to
study for the following reasons t
1. manganese (II) fluoride is known to vaporize as a
monomer;
2. the vapor pressure of MnFa in the temperature range of
interest (H30-1200°K) is within the limits of the
validity of the equation of molecular flow (1CT2 to 10”6
Torr);
3. the sublimation pressure of MnFa^ is believed to be
well established which will allow comparison of the
available thermodynamic data of sublimation with the
vaporization data from the present investigation;
4. the heat of fusion of MnF2/ <, and the condensation(sJcoefficient may be assessed by the above mentioned
comparison.
Literature Review
The only previous reports on sublimation and vaporization23rates of MnFa are the work of Bautista and Margrave and Kent,
40
Reproduced with permission of the copyright owner. Further reproduction prohibited without permission.

2k 23Ehlert and Margrave . Bautista and Margrave investigated the
sublimation of a single crystal of MnFa in the temperature range
887 to 983°K by the Langmuir technique using a vacuum miorobalance.From the second-law least squares treatment of their sublimation
data they calculated the enthalpy of sublimation to be 73*5 - 0.5
Kcal mole"1 at T avg. = 939.0°K and 76.0 - 1.0 Kcal mole"1 at
298°K. Using their data and the computer program written to
evaluate the data from this investigation, the linear least-squares
equation relating the sublimation pressure and temperature is given
in equation (III-l) t
log P (atm) = -(1.605 ± .10) + (8.78 ± 0.11) (III-l)
2kKent et al. investigated both sublimation and vaporisation
of MnF2 over an extended temperature range (105 -1193°K) by Knudsen-
effusion technique employing a mass spectrometer. The ionic species
detected by the mass spectrometer confirmed the absence of dimers and high polymeric species of MnF2 in the effusate. They calculated the
enthalpy of sublimation from the ion intensity data, in the
temperature range 105^ to 1128°K to be 73.0 * 1.5 Kcal mole-1
at T avg. = U03°K and 76.5 * 1.5 Kcal mole-1 at 298°K. Similarly
they calculated the enthalpy of vaporization in the temperature
range 1132 to 1193°K to be 71.9 ± l A Kcal mole-1 at T avg. = 1159°K.
They derived the Clausius-Clapeyron equation for sublimation of
MhFa(g) by correlating the ion intensity measurements with the
Langmuir sublimation pressure to obtain the mass spectrometer
Reproduced with permission of the copyright owner. Further reproduction prohibited without permission.

hz
constant which was then combined with the experimental values from
the mass spectrometric measurements to calculate a value for the
pressure at each temperature. Their least-squares treatment of the
data is presented in equation (HI-2).
log P atm = -(1.596 ± 0.031) ^ + (8.70 ± 0.02) (HI-2)
Also they suggested a value of 1-5 Kcal mole-1 for the enthalpy of25fusion of MnF2 as compared with Brewer's et al. J estimate of
5.5 Kcal mole-1.
Experiments
The vapor pressure studies of MnFa were carried out according
to the procedure described in Chapter H. In a typical run 0.7 to
0.8 g of polycrystalline MnFa (Purchased from Semi-Elements Inc.,
Saxonburg, Pa.) used without purification were placed in an outgassed
cell. After assembly and evaouation of the system to a pressure of
10“4 Torr, the sample was heated initially to 473°K for a few hours
to outgas the assembly before gradually raising the temperature to
1200° K. Heating at this temperature was continued until a weight
loss of about 20 mg was recorded. Then the sample was cooled to a
lower temperature within the range H 30 - 1205°K of this investigation.
A few experiments were carried out without measurements of the
torsion deflection. This was necessary to select the appropriate
cell material and dimensions, the temperature range, and the
Reproduced with permission of the copyright owner. Further reproduction prohibited without permission.

*0
stability of torsion defleotion and its disturbance by the damping
magnet. Cells of stainless steel and Union Carbide graphite
(Grade AUC), seamed to affeot the steady rate of weight loss due
either to their reaction with the sample or to continuous outgassing. A permanent damping magnet interfered with both the balance
sensitivity and the torsion defleotion. A satisfactory arrangement
involved the use of an electromagnet which ms powered only after
thermal equilibrium at eaoh temperature setting ms established,
and turned off after a constant torsion defleotion m s attained.
Five experiments were carried out with spectroscopic graphite
cells (Ultra Carbon-high purity, Grade U-7). The first two were
limited to measurements of the rate of weight loss, in the third
and fifth experiments simultaneous weight loss and torsion
defleotion measurements were carried out. Ihe fourth experiment
m s undertaken to check the constancy of the rate of weight loss
over relatively longer periods at each of a few temperature settings.After the last experiment m s oompleted the thermocouple m s
recalibrated. This calibration m s dictated by a suspected change
in the relative position of the thermocouple.
The total weight loss in a given experiment m s limited to
350-370 mg. This restriction m s imposed by the maximum weights
of the riders which can be automatically removed from the tare
weight without opening the system to atmospheric pressure. This
m s also desirable to secure sufficient sample residue in the cell
to maintain equilibrium between the condensed and vapor phases*
Reproduced with permission of the copyright owner. Further reproduction prohibited without permission.

Results
The vapor pressure data of five experiments are tabulated
in Table (IV to X) and presented in the form of log P vs. ^ plots
in Figures (10 to 13)« Experiment IV is not presented graphically
because it represents the data at a few selected temperatures.
The Knudsen vapor pressure at each temperature was calculated
according to equation (1-8) on the assumption that only the monomer
(MnFa (g)5, of molecular weight (92.93^) » makes up the vapor species. The torsion pressures were calculated according to equation (1-13).
The parameters of the effusion oells and the torsional constant of
the fibers, used in these calculations, are those listed in Tables I
and III respectively. The computations were performed on an IBM
1620 computer. A least-squares treatment of the linear relationship
between log P and ~ for each experiment was performed for the
Knudsen- and torsion- effusion data independently.
The enthalpies and entropies of vaporization were derived from the linear least-squares analyses of the data according to
a h ; a s ; logl° P(ata) ‘ ' 2.303 RT + 2.303 R (IH-3)
The results of least-squares analyses of the measurements are summarized in Table XI. The cited errors are the standard deviations obtained in the least-squares analyses.
Reproduced with permission of the copyright owner. Further reproduction prohibited without permission.
Reproduced
with perm
ission of the
copyright ow
ner. Further
reproduction prohibited
without
permission.
a)
Table IV
Vaporisation Data of MnF, by Knudsen Effusion Experiment I*
Pt. Weight Loss Time Temperature Pressure 101 -log PNo. w x 10*(g) t(ndn) (°K) (atm) T1 6.65 12.5 1254.9 9.336 x 10“s 7.9690 4.0302 1.40 20.0 1166.1 1.184 x 10“* 8.575** 4.9273 2.58 107.5 1130.1 3.997 x 10-‘ 8.8492 5.3984 3.39 75.0 1155.4 7.611 x 10“6 8.6550 5.1195 4.83 80.0 1165.4 1.021 x 10“5 8.5807 4.9916 8.68 107.5 1176.4 1.372 x 10-* 8.5007 4.8637 8.29 82.5 1185.3 1.714 x 10"* 8.4366 4.7668 10.89 85.0 1195.0 2.194 x 10”= 8.3684 4.6599 15.79 97.5 1204.6 2.784 x 10-* 8.3017 4.55510 6.52 32.5 1214.5 3.463 x 10-* 8.2337 4.46111 10.39 40.0 1224.7 4.503 x 10-® 8.1652 4.34712 18.35 57.5 1233.1 5.552 x 10-* 8.1096 4.25613 15.53 37.5 1245.0 7.239 x 10-® 8.0322 4.14014 10.20 17.5 1262.8 1.026 x 10“* 7.9187 3.98915 8.64 12.5 1271.8 1.221 x 10-* 7.8628 3.913
Effective orifloe area I ^ aiwoi = (7.8725)(10-’) cm*

Reproduced
with perm
ission of the
copyright ow
ner. Further
reproduction prohibited
without
permission.
Table VVaporisation Data of MriFa by Knudsen Effusion£Experiment U
iiPt. Weight Loss Time Temperature Pressure 121 -log PNo. w x 10*(g) t(min) (°K) (atm) T1 7.67 60.0 1165.5 9.780 x 10-* 8.5799 5.010(2 3.43 30.0 1161.7 8.733 x 10-* 8.6078 5.0593 7.08 112.5 1137.5 4.756 x 1(T‘ 8.7914 3.3234 3.87 47.5 1147.1 6.184 x 10-* 8.7176 5.2095 6.55 92.5 1144.7 5.369 x 10-* 8.7361 5.2706 6.40 75.0 1149.2 6.482 x 10-* 8.7018 5.1887 4.48 35.0 1166.7 9.797 x 10-* 8.5713 5.0098 11.32 77.5 1172.5 1.121 x 10⁻⁵ 8.5290 4.9509 17.70 97.5 1180.4 1.398 x 10-* 8.4714 4.85510 IO.71 97.5 1160.3 8.385 x 10-* 8.6186 5.07711 35.82 147-5 1190.5 1.878 x 10-* 8.3998 4.72612 16.55 90.0 1180.8 1.416 x 10-* 8.4686 4.849
a) Effeotive orifice area 1 aliWoi " (1-7404)(10-*) cm*

Reproduced
with perm
ission of the
copyright ow
ner. Further
reproduction prohibited
without
permission.
Table VIVaporization Data of MnF* by Knudsen Effusion
Experiment III&Pt. Weight Loss Time Temperatore Pressure 121 -log PNo. w x 10* (g) t(ndn) CK) (atm) T1 15.61 195.0 1174.9 9.618 x 10”* 8.5115 5.0172 5.18 202.5 1131.0 3.016 x 10“* 8.8416 5.5213 5.34 142.5 1143.6 4.442 x 10”* 8.7445 5.3524 4.51 150.0 1135.9 3.552 x 10“* 8.8035 5.4505 4.77 95.0 1153.5 5.978 x 10”* 8.6696 5.2246 3.37 97.5 1140.5 4.092 x 10”* 8.7679 5.3887 16.69 187.5 1174.7 1.069 x 10”* 8.5131 4.9718 6.78 125.0 1156.9 6.467 x 10“* 8.6440 5.1899 7.82 105.0 1168.6 8.924 x 10-* 8.5575 5.04910 16.97 172.5 1179.6 1.184 x 10”* 8.4774 4.92711 17.06 157.5 1183.7 1.306 x 10“* 8.4482 4.88412 16.40 125.0 1191.4 1.587 x 10“* 8.3938 4.79913 14.89 97.5 1197.7 1.853 x 10“* 8.3497 4.73214 9.34 55.0 1203.1 2.065 x 10”* 8.3121 4.685
a) Effective orlfloe area *^2*iWoi = Cl.H26)(10“*) cm*
•ts--o

Reproduced
with perm
ission of the
copyright ow
ner. Further
reproduction prohibited
without
permission.
>Table T O
Vaporisation Data of MnF, by Torsion Effusion Experiment TTT *
Pt. Linear Temperature Pressure 121 -log PNo. deflection
A S (in)(°K) (atm) T
1 2.133 1174.9 1.277 x 10“* 8.5115 4.8942 0.564 1131.0 3.377 x 10“* 8.8416 5.4713 1 0.815 1143.6 4.880 x 10“6 8.7445 5.3124 0.693 1135.9 4.150 x 10“‘ 8.8036 5.3825 1.107 1153.5 6.629 x 10“* 8.6696 5.1796 2.093 1174.7 1.253 x 10“* 8.5131 4.9027 1.321 1156.9 7.910 x 10-* 8.6440 5.1028 1.723 1168.6 1.032 x 10-* 8.5575 4.9869 2.270 1179.6 1.359 x 10-* 8.4774 4.86710 2.492 1183.7 1.492 x 10-* 8.4482 4.82611 3.015 1191.4 1.805 x 10-* 8.3938 4.74.312 3.515 1197.7 2.105 x 10-* 8.3497 4.67713 3.970 1203.1 2.377 x 10-* 8.3121 4.624
Effective orifice area x moment arm j f = (1.23336) (10“*) cm3
Torsional Constant t = 2.6940 dyn cm rad”1 j

Knudsen
- Effusion Dat
a, of
Vaporization for MnF:
^9
bOOIf
£ o oo 5 5 3 5<*> <n t»- o->A «A »A -d- •dr Jt
8 & g; S ocvs 8 $ c-\ op'i dco CO CO CO oo CO CO
JS« a
w w « w n n n si
H H H H H H H K K K K K K K H
tv. vp ck p\ y\« vp N « fl\ Ov-5 .* vo c*. e»- £» o-• • • • • • • •^ 4 1 Jt H rl rl
« U) ■
f$*s s s s ov Cv- VO H >n n nCMPVOONOvCv-U^Ov
• «oinfi-® H « n ^ i T \ \ O N O O
'oH
N O N N O N O \ NCVJ <*>o o
VOCVJ
dH
o o o o o o o o o v% o u> o O VN0 \ C4 Cv. vO 5 VOCVJ3 N
Reproduced with permission of the copyright owner. Further reproduction prohibited without permission.

Reproduced
with perm
ission of the
copyright ow
ner. Further
reproduction prohibited
without
permission.
Table IXVaporization Data of MnFa by Knudsen Effusion
Experiment V aPt.No.
Weight Loss w x 10* (g)
Timet(min)
Temperature(°K)
Pressure(atm)
10*T
-log P
1 23.08 145.0 1166.4 1.123 x 10⁻⁵ 8.5731 4.9502 6.69 90.0 1138.3 5.179 x 10⁻⁴ 8.7847 5.286
3 10.66 110.0 1147.5 6.779 x 10"6 8.7148 5.1694 11.72 95.0 1156.6 8.664 x 10⁻⁴ 8.6461 5.062
5 19.87 62.5 1193.1 2.268 x 10_s 8.3816 4.644
6 12.11 62.5 1173.6 1.371 x 10-* 8.5205 4.863
7 14.45 60.0*{ 1182.5 1.710 x 10“* 8.4565 4.7678 10.61 130.0 1142.4 5.697 x 10⁻⁶ 8.7533 5.244
9 6.28 45.0 1161.9 9.823 x 10“6 8.6068 5.008
10 4.36 42.5 1151.3 7.188 x 10“6 8.6858 5.1431
a) Effective orifice area : a^WQ = (1.8886)(10-*) cm211

Reproduced
with perm
ission of the
copyright ow
ner. Further
reproduction prohibited
without
permission.
Table XVaporization Data of MnFa by Torsion Effusion
Experiment V*Pt.No. Linear deflection
S (in)Temperature
(°K)Pressure(atm) 10*T -log P
1 10.49 1166.4 1.296 x 10⁻⁵ 8.5731 4.887
2 4.78 1138.3 5.904 x 10⁻⁶ 8.7847 5.229
3 6.16 U47.5 7.609 x 10"6 8.7148 5.119
4 7.9^ 1156.6 9.808 x 10"6 8.6461 5.008
5 20.71 1193.1 2.558 x 10“5 8.3816 4.592
6 12.46 1173.6 1.539 x 10⁻⁵ 8.5205 4.813
7 15.64 1182.5 ( 1.932 x 10⁻³ 8.4565 4.714
8 5.30 1142.4 6.54-7 x 10⁻⁶ 8.7533 5.184
9 9.05 1161.9 1.118 x 10⁻⁵ 8.6068 4.95210 6.89 1151.3 8.511 x 10⁻⁶ 8.6858 5.070
^Effective orifice area x moment arm : ^ a^d^f^ = (2.0265)(10“a) cm3 ITorsional constant: T" = 0.9131 dyn cm rad"1

52
to
rn'
LU
LlICO
u.
Reproduced with permission of the copyright owner. Further reproduction prohibited without permission.

53
Ll.
Li_
CO
Ll
Reproduced with permission of the copyright owner. Further reproduction prohibited without permission.

CL.x111
0O
IxlCD O
LO
UJ
Reproduced with permission of the copyright owner. Further reproduction prohibited without permission.

55
Cu
uJLu
Ll_
Z'
U-
LU
too
ro
d £) 01 -
Reproduced with permission of the copyright owner. Further reproduction prohibited without permission.

56
o IA vr> >rv »T» Ov r \ Ov *£*— M 0 NO
PivO
p!vO
s 3'O
«»A
Pi RrH
AOv
VO
Pi■> A 4 « V0 A A A A Aio »o O © b b b b b *or i H H r l r l rH H rH rH H
K X H H M K K K K X
J3 r v r l Ov H cn ISvO CA Ov4* r 14 4 r vo R P-iOv
Ov H £ © CMVT\N ao o
NO4 • * • • • • • 4 •
CU rH Ov Cv-Ov NO rH rH H •S’ ON
i
04IH0 -P
H *1
O<3 3
HI®o H3 *H
£
3Ov4-3- 5.
020
5.100
5.037 00OvH4»A
$ 3Ov Ov4 4■3- -3
8Ov»rv4ao
Cv-d•
O4CM
rH4H00 cv4 4o H
vcv,4
rH
VO Cv4 4o o
H•OCM4rv
C-V4CM
■H +1 + 1+1 + » +1 -H +1 +i +1OV3
(M v^vrv4 400 Ov
r v c n
vO4
PV
HVO4 4O ov -3- c"v
cO•OvCA
CM4
s
O4vO
<n
0.8 <»>4
rH
ov VA• 4o HH4H
C -34 4o o3 -4CM
>A•iH
rH4o»rv4
H
+ i + 1 +1+1 +1 + I -H +1 +1 +1 + 1
69
.6 Ov
3o aoR R
Ov4
r vIS
CM C~\4 4
C-VCM> N .
Ov4
£ - 73.0 4
C*\IS
IS4
O 'vO
8 s c c • o•3 -3 -S3I
c c • oS'Sn
o •
Hn 8.s s
o
■M* ACD S
jS'-'
3 §•8
MSr3
o rv§ o ©
CM CMH rH 31 1IS rH rHrvPi Pi Pi
C't©(Vir1& Ir\
Pi
aoCM
Irl5 " 3-CM CM ■3a ,-n'_*15 $ ss?• • fiwfed
0 «H & O1o H
Reproduced with permission of the copyright owner. Further reproduction prohibited without permission.

57
Discussion
Clausius-Clapeyron plots for the Knudsen-effusion data of
experiments I-IU and V and for the mass spectrometric sublimation
data are presented in Figure 14. For a meaningful analysis of the
data and a clarification of these plots the four experiments are
treated as three separate groups t I and II, III, and V. Experiment
IV is excluded for the consideration mentioned before.
Experiments £ and II
These two experiments were performed in succession shortly
after the initial calibration of the thermocouple. The same torsion
assembly was used except for the cells. Inspection of Figure 14 and
Table XI shows the close agreement of the vapor pressures and the
derived enthalpies and entropies of vaporization from the experimental
data. In addition, a composite least-squares analysis of all the
points, except those obtained at the highest temperatures, yields
the following Clausius-Clapeyron equation:
los« P(atm) = “ * foSffUO* + (8.067 ± 0.5) (HI-4)
Using equation (IH-4) the calculated enthalpy and entropy of
vaporization are in close agreement with those derived from the same
treatment of the individual experiments independently. The melting
point of MnF2, calculated from the analytical solution of the
vaporization equation, (HI-4) , and the mass spectrometrie
Reproduced with permission of the copyright owner. Further reproduction prohibited without permission.

58
4 3 -
4.5
------- K N U D S E N X--------KN\JD S E N I t
-------- KNUDSEN HE...... KNUDSEN SL--------------- M ASS SPEC.
5.0a
u> 01
5.5
6.0 .8.0 i i8.5
10+/T"I--- 1 I
9.0
FIG.I4- SUMHAR/ OF EXPERIMENTS
Reproduced with permission of the copyright owner. Further reproduction prohibited without permission.

sublimation equation, (III-2), at the intersection point of equal
pressures, is 1137°K. The literature value cited by Brewer
is 1129°K.
Equation (UI-4) yields for the enthalpy of vaporization
of MnF2(-f), A H = 69.7 ± 1.5 Kcal mole"1 and for the entropy of vaporization, A - 36.9 - 2.3 eu, in the temperaturerange U30 - 1200°K. The enthalpy value is lower than the value,
p7jA = 71*9 - 2.4 Kcal mole’1, obtained mass speetrometrieally .
Assuming the enthalpy of vaporization value of this study and24that of sublimation reported by Kent et al. to apply adequately at
the melting point, their difference yields an enthalpy of fusion
A HJi^ = 3.25 ~ 2.0 Koal mole-1 and an entropy of fusion
A S°i29 = 3.0 i 1.8 eu. This value for the enthalpy of fusion24is within the range of 1-5 Kcal mole"1 suggested by Kent et al.
and is in fair agreement with 5*5 Kcal mole"1, the value estimated
by Brewer et al.2-*. There are no reported values for the entropy of
vaporization with which to compare the present value.
Experiment III
This experiment was carried out with a new torsion filament
and tantalum-connector tube in the torsion assembly. Due to these
changes in the system and to the use of the apparatus by another
investigator during the interruption period, it was suspected that
the position of the cell relative to the thermocouple and furnace
had changed. Such a change would lead to an error in the calculated
Reproduced with permission of the copyright owner. Further reproduction prohibited without permission.

temperature based on equation (II-3A) of the initial thermocouple
calibration.
Inspection of Figure 14 and Table XI shows that the Knudsen
and torsion vapor pressures calculated from the data of this experi
ment are relatively low. The value of enthalpy of vaporization,
although higher than that calculated from experiments I and II,24agrees well with the value cited by Kent et al. . By the same
reasoning applied to experiments I and II the melting point of
MnF2 calculated from the solution of the proper vaporisation and
sublimation equations is 756°K, from the Knudsen-effusion data,
and 555°K, from the torsion-effusion data. These values fall far
below the literature value of 1129°K26.
A correction for the temperature by using equation (II-3B),
derived from the final thermocouple calibration, yields the following
Clausius-Clapeyron equations:
logl®P(atn) * ’ + 8’°?4 (HI-5)
from Knudsen-ef fusion measurements, and
logl°P(atm) * " + 7.844' (HI-6)
from torsional-reooil measurements. The corresponding Clausius-
Clapeyron plots are shown in Figure 15. The enthalpies and
entropies of vaporization, derived from the above equations, are
AH£i£j = 69.3 Kcal mole“£ and = 36.9eu, from
Reproduced with permission of the copyright owner. Further reproduction prohibited without permission.

61
CD
00
O
d 9 01-
o.XL-jJ
US'c
i :uo
£Qz0(/)3U-uui1zo
aoH
zUltoDDZ
vn*u?u
Reproduced with permission of the copyright owner. Further reproduction prohibited without permission.

62
equation (III-5), and = 67.7 Kcal mole"1 and
A S 1165 * 35*9 eu, from equation (III-6). Although such correction
brings the enthalpy and entropy of vaporization, derived from the Knudsen-ef fusion data, into better agreement with experiments
1 and II, the corresponding vapor pressures are relatively higher (1.166 x 10-sata at 1165®K).
Experiment V
Experiment V was performed with the same torsion assembly used in experiment III except for a new torsion filament and the
oell. Having suspected the validity of the initial calibration of
the thermocouple, a recalibration was made after the oompletion of
the experiment. Equation (II-3B) of this new calibration was
employed to calculate the temperatures of this experiments
Inspection of Figure llfr and Table XI shows that the Knudsen and
torsion vapor pressures are higher than those of experiments I and II.
The value of the enthalpy of vaporization is in agreement (within
experimental errors) with the value from the mass spectrometrio
measurements; however, it is higher than the value calculated from
the data of experiments I and II. The analytical solution of the proper vaporization and sublimation equations yields a rather low
value for the melting point of MnFa (500°K from Knudsen and 32O0.K
from torsion data).
Reproduced with permission of the copyright owner. Further reproduction prohibited without permission.

63
PflWHlggp a£ Bsflsrslfiasjaa »»««»» ~
11 27 31There have been published several reports * ’ in
which the Knudsen-effusion and torsion-recoil methods have been
used in vapor pressure measurements of the same substance. In
each reported ease the measured torsion pressure was greater than
the Knudsen pressure, even when such measurements were performed27simultaneously in the same apparatus '. Inspecting the values of
the Knudsen and torsion pressures of experiments III and V it is
observed that the torsion pressures are larger than the corresponding
Knudsen pressures. The average value of the ratio is 1.15.
This value is within the range of 1.05 to 1.17 of the same ratio
in the cited references.
The lack of agreement between P . and PR may be attributed
to the surmise that the torsion pressure is larger than the Knudsen
pressure because of the effusate which returns preferentially to
the same side of the cell from which it originated^, The effusate
molecules rebound from the walls of the quarts enclosure against the
side of the cell from which they originated. Their impacts, on this
side, increase the deflection of the torsion assembly. Also, the
returning effusate molecules deorease the observed rate of weight
loss. The increased defleotlon leads to a higher apparent torsion
pressure while the reduced rate of mass effusion leads to a lower Knudsen pressure.
The observation that P , is greater than Pg rules out the
Reproduced with permission of the copyright owner. Further reproduction prohibited without permission.

presence of the dimer. If only monomers and dimers ore present,
then :27
PT “ PK * (2>rrfiTMa)* 1 - (MV M 4)a Za (HI-7)
where the M's are moleoular weights and Za Is the molar rate of
effusion of the dimer. Slnoe Z3^ 0 and Ma> M*, then - P.
would be 0 if the dimer were present. Support of the absence2kof dimer in the vapor species was reported by Kent et al. in
their mass spectrometric studies.
Conclusions
Comparison of the vaporisation data of MnFa, summarised in
Table XI, shows that, within experimental errors, only experiments I
and II yield reproducible vapor pressures and enthalpy and entropy
of vaporisation. The close agreement between these two experiments
permitted a composite least-squares analysis of all the points,
except those obtained at the highest temperatures. The Clausius-
Clapeyron equation and the enthalpy and entropy of vaporisation of
MhFa(?), in the temperature range 1130 - 1200°K, obtained from
the combined data of these two experiments ore t
logi°p(atm) = + (8.06? t 0.5) (HI-4)
A H 1165 = 69,7 ± lt$ 5oal ®ole"t
andA = 36.9 t 2.3 eu
Reproduced with permission of the copyright owner. Further reproduction prohibited without permission.

65
Additional criteria, aonsidared In aooepting these data as
the most reliable are presented below.
1) The melting point of MbF2, calculated from the
analytical solution of the vaporisation equation, (111-4), and the
sublimation equation, (IH-2), at the intersection point of equal
pressures, is consistent with the literature value. Similar
calculation* using the vaporisation equations based on experiments
III and V, gave melting points which are too low.
2) The enthalpy of fusion derived from vaporisation data,
based on equation (HI-4), and the sublimation data is consistent with
the value estimated by Brewer2 . The values of the enthalpy and
entropy of fusion, arrived at in this investigation are i
AH£ i29 = 3.25 ± 2.0 Kcal mole
and
A S £i29 “ 2,9 “ 1,8
3) The validity of the thermocouple calibration, represented
by equation (XI-3A) when applied to the data of experiment III,
is suapeoted. Neither of the two calibration equations (II-3A and 11-33) can be considered as reliable since the calibrations and
the vaporisation measurements were interrupted by unavoidable
replacements of the torsion fiber. The same arguments do not apply to experiment V since the final calibration was performed
immediately after completion of the experiments. However, the non-oonformity of this experiment escapes an explanation on
Reproduced with permission of the copyright owner. Further reproduction prohibited without permission.

66
a thermodynamic basis.2h4) The vaporization data of Kent et al. is based on an
extrapolation of their sublimation data. The cited reference failed
to present a Clausius-Clapeyron equation, for the vapor pressure
of MnF2 (-0, and a value for the entropy of vaporization.
Although experiments H I and V failed to contribute
acceptable thermodynamic functions for MnF2, they still served to
prove the utility of the present apparatus for simultaneous
measurements of the torsional recoil and mass effusion as a means
of direct and indirect determinations of vapor pressures - However,
improvements in the apparatus are needed so that more reliable
and reproducible information will become available by its use.
Suggested Apparatus Improvements
The improvements considered as necessary for this apparatus
to be capable of yielding reliable and reproducible data are
outlined below t1) the experimental thermocouple should be fixed in a
permanent position;2) the experimental thermocouple should be periodically
checked during an investigation;
3) the scale and light source of the optical lever system
should be mounted on a rigidly fixed trame;
4*0 a fast responding furnace is recommended.
Reproduced with permission of the copyright owner. Further reproduction prohibited without permission.

67
Suggestions for Future Work
As pointed out earlier the apparatus after the suggested
improvements, should be fruitful not only in determining vapor
pressures directly and indirectly but also in investigating
dissociation and disproportionstion reactions. Before the
discrepancy between the torsion pressure and the Knudsen pressure
can be utilized to indloate simple vaporization, dissociation or
polymerization, it is essential to determine if the discrepancy
is inherent in the method by a study involving a substanoe known to
vaporize as a monomer and of known vapor pressure. Cadmium, zinc
and silver are such substances which are available with high purity.
Once the instrumental correction factor is established, the
vaporization behavior of several double salts, e.g. RbMnF3, may be
elucidated and thermodynamic functions of such salts may be
derived from their vapor pressure data.
Reproduced with permission of the copyright owner. Further reproduction prohibited without permission.

BIBLIOGRAPHI
1. A. Buohler and J« B. Berkowitz-Mattuok, Advances in High Temperature Chemistry. Vol. 1, Ed. L. Eyring, Academic Press,N. X., 1967, pp. 95-152.
2. F. W. Sears, An Introduction to Thermodynamics. The glnetio Theory of Gases and Statistical Mechanics. Addison-tfesley Publishing Co., Inc., Massachusetts, 19^3» pp. 200-222.
3. M. Knudsen, Ann. Phys. (Leipzig), 28, 75 (1909); 28, 999 (1909); 22, 179 (1909).
4. P. Clausing, Ann. Physik, ^2, 961 (1932).
5. E. H. Kenaard, Kinetic Theory of Gases. McGraw-Hill Book Co., Inc., New Tork, 1936, pp. 302ff,
6. W. C. DeMarous, and E. H. Hopper, J. Cham. Phys. 23.1344 (1955).
7* D. A. Schulz and A. W, Searcy, J. Chem. Phys., ^6 , 3099 (1962).
8. H^Mayer, Z. Physik, 52, 235 (1928); £8, 373 (1929);6f, 240 (1931).
9. K* Volmer, Z. Physik Chem., Bodenstein Festband, 863 (1931).
10. R. D. Freeman and A. W. Searcy, J. Chem. Phys*, 22, 1137 (1954).
U. A. W. Searcy and R. D. Freeman, J. Am. Chem. Soo., 26, 5229(1954).
12. J. H. Stem and N. W. Gregory, J. Phys. Chem., 6X, 1226 (1957).
13. R* J. Aokerman, P. W. Gilles, and R. J. Thorn, J. Chem. Phys.,22, 1089 (1958).
14. H. T. Johnson, Phys. Rev., 2JL, 103 (1928).15* K. D. Carlson, "Argonne National Laboratory Report" ANL - 6156,
April (I960).
16. A. W. Searcy and D. A. Schulz, J. Chem. Phys., 28, 772 (1963).
17. J. L. Margrave, Physiochesdoal Measurements at High Temperatures.Ed. 0. M. Boekris, and J. M. White, Butterworth Scientific Publication, London, 1959, pp. 225-246.
68
Reproduced with permission of the copyright owner. Further reproduction prohibited without permission.

6918. K. Motzfeldt, J. Phys. Chem., 52* 139 (1955)*
19. C. I. Whitman, J. Chem. Phys. 2&, l6l (1952); &, W (1953).
20. G. M. Rosenblatt, J. Electroohsm. Soc.t 110. 563 (1963).
21. J. W. Spretnak and R. Speiser, Vacuum Metallurgy. TheElectrochemical Society, New York, (1955) PP* 151-191.
22. D. L. Hildsnbrand and F. W. Hall, Proceedings of the International Symposium on Condensation and Evaporation of Solids. Gordon and Breach Publishing Co., New York, N. Y.(1965) pp. 399 - 415.
23* R* G. Bautista and J. L. Margrave, J. Phys. Chem., 6£, 1564 (1963).
24. R, A* Kent, T. C. Ehlert and J. L. Margrave, J. Am. Chem. Soc,,86* 5090 (196*0.
25. L. Brewer, G. R. Somayajulu and E. Bracket, Chem. Rev,, 63,111 (1963).
26. L. Brewer, Fusion and Vaporisation Data of thejialides.Paper 7 in National Nuolear Energy Series Iy yol.J,9B.Chemistry and Metallurgy of Miscellaneous Materials Thermodynamics. Ed. I. L. Quill, McGraw-Hill Book Co. Ino.,New York, 1950, pp. 193-275.
27. J. R. McCreary and R. J. Thorn, J. Chem. Phys. 48, 3290 (1968).
28. R. D. Freeman and A. W»JSearoy, J. Chem. Phys. 22, 762 (1954-) •29. J. H. Kim and Cosgarea, Jr., J. Chem. Phys. 4*jt, 806 (1966).
30. A. W. Wilson, J. H. Kim and A. Cosgarea, Jr., Rev. Sol. Instr.36, 1428 (1965).
31. G. M. Rosenblatt and C. E. Birchenall, J. Chem. Phys. 35, 788 (1961).
Reproduced with permission of the copyright owner. Further reproduction prohibited without permission.

70
VITA
The author was born on July 16, 194-1, in Ypsilanti,
Michigan. He attended Lincoln Consolidated High School graduating
in 1957* After earning a Bachelor of Arts degree from Eastern
Michigan University, he taught at Summerfield High School in
Petersburg, Michigan. He enrolled in graduate studies at
Western Michigan University in August, 1965. The author is a
member of the American Chemical Society.
y-
Reproduced with permission of the copyright owner. Further reproduction prohibited without permission.