Kenya - Small Towns and Rural Water Supply and Sanitation ... · Language: English Original:...
27
Language: English Original: English PROJECT: SMALL TOWNS AND RURAL WATER SUPPLY AND SANITATION PROJECT COUNTRY: KENYA PROJECT APPRAISAL REPORT Date: July 2009 Appraisal Team Team Leader Team Members Sector Manager Sector Director Regional Director Mr. Boniface Aleobua Mr. Egbert H.J. Schroten Mrs.Amel Hamza Mr. Patrick Karani, Mr. John Sifuma, Mr. Peter Njui, Mr. Patrick Owuori Mr. Alex Mend Mr. Sering B. Jallow Mr. Sering B. Jallow Mrs Diarietou Gaye Principal Water & Sanitation Eng., OWAS.2 W & S. Consultant, OWAS.2. Gender Specialist, OWAS.2 Principal Environmentalist, OWAS.2 Water & Sanitation Specialist, KEFO Consultant Financial Analyst Procurement Assistant, KEFO Principal Agronomist, OSAN.1 OWAS.2 O.I.C, OWAS & AWF OREA Peer Reviewers Mr Osward Chanda, Chief Water and Sanitation Engineer, OWAS.2 Mr Tom Roberts, Chief Program Coordinator, Officer, SEGL.1 Mr Paul Dzimiri, Senior Financial Analyst, OWAS.2 Mr. Amhayesus Metaferia, Consultant Water and Sanitation Engineer, OWAS.0
Transcript of Kenya - Small Towns and Rural Water Supply and Sanitation ... · Language: English Original:...
Language: English Original: English
PROJECT: SMALL TOWNS AND RURAL WATER SUPPLY AND SANITATION PROJECT COUNTRY: KENYA PROJECT APPRAISAL REPORT Date: July 2009
Appraisal Team
Team Leader Team Members Sector Manager Sector Director Regional Director
Mr. Boniface Aleobua Mr. Egbert H.J. Schroten Mrs.Amel Hamza Mr. Patrick Karani, Mr. John Sifuma, Mr. Peter Njui, Mr. Patrick Owuori Mr. Alex Mend Mr. Sering B. Jallow Mr. Sering B. Jallow Mrs Diarietou Gaye
Principal Water & Sanitation Eng., OWAS.2 W & S. Consultant, OWAS.2. Gender Specialist, OWAS.2 Principal Environmentalist, OWAS.2 Water & Sanitation Specialist, KEFO Consultant Financial Analyst Procurement Assistant, KEFO Principal Agronomist, OSAN.1 OWAS.2 O.I.C, OWAS & AWF OREA
Peer Reviewers
Mr Osward Chanda, Chief Water and Sanitation Engineer, OWAS.2 Mr Tom Roberts, Chief Program Coordinator, Officer, SEGL.1 Mr Paul Dzimiri, Senior Financial Analyst, OWAS.2 Mr. Amhayesus Metaferia, Consultant Water and Sanitation Engineer, OWAS.0
TABLE OF CONTENTS I – STRATEGIC THRUST & RATIONALE...........................................................................1
1.1. Project linkages with country strategy and objectives ....................................................1 1.2. Rationale for Bank’s involvement ..................................................................................1 1.3 Sector Reforms...........................................................................................................2 1.4 Donors coordination.........................................................................................................3
II – PROJECT DESCRIPTION .................................................................................................3 2.1. Project components .........................................................................................................3 2.2. Technical solution retained and other alternatives explored...........................................4 2.3. Project type .....................................................................................................................5 2.4. Project cost and financing arrangements.........................................................................6 2.5. Project’s target area and population................................................................................6 2.6. Participatory process for project identification, design and implementation..................7 2.7. Bank Group experience, lessons reflected in project design...........................................7 2.8 Key performance indicators .............................................................................................8
III – PROJECT FEASIBILITY..................................................................................................8 3.1. Economic and financial performance..............................................................................8 3.2. Environmental and Social impacts..................................................................................9
IV – IMPLEMENTATION......................................................................................................11 4.1.1 Implementation arrangements..............................................................................11 4.1.2 Procurement .........................................................................................................11 4.1.3 Financial Management .........................................................................................11 4.2. Monitoring ....................................................................................................................12 4.3. Governance ...................................................................................................................12 4.4. Sustainability.................................................................................................................12 4.5. Risk management ..........................................................................................................13 4.6. Knowledge building ......................................................................................................13
V – LEGAL INSTRUMENTS AND AUTHORITY...............................................................14 5.1. Legal instrument ...........................................................................................................14 5.2. Conditions associated with Bank’s intervention ...........................................................14 5.3. Compliance with Bank Policies ....................................................................................14
VI – RECOMMENDATION ...................................................................................................14 Appendix I: Comparative Socio-Economic Indicators ............................................................15 Appendix II: Table of ADB’s portfolio in the country ............................................................16 Appendix III: Key related projects financed by the Bank and other development partners ....17 Appendix IV: Map of Kenya....................................................................................................18
i
Currency Equivalents July 2009
UA 1.00 = KES 120.249 UA 1.00 = USD 1.55223 UA 1.00 = EURO 1.09822
Fiscal Year 1st July- 30th June
Weights and Measures 1metric tonne = 2204 pounds (lbs) 1 kilogramme (kg) = 2.200 lbs 1 metre (m) = 3.28 feet (ft) 1 millimetre (mm) = 0.03937 inch (“) 1 kilometre (km) = 0.62 mile 1 hectare (ha) = 2.471 acres
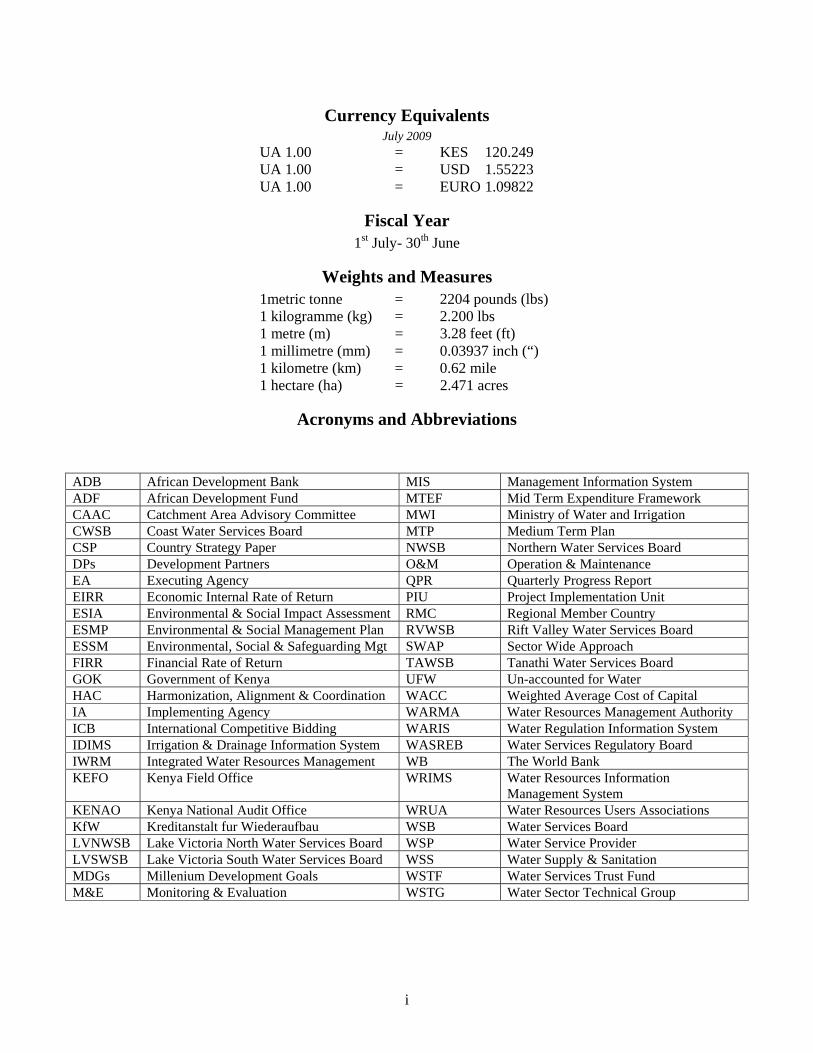
Acronyms and Abbreviations
ADB African Development Bank MIS Management Information System ADF African Development Fund MTEF Mid Term Expenditure Framework CAAC Catchment Area Advisory Committee MWI Ministry of Water and Irrigation CWSB Coast Water Services Board MTP Medium Term Plan CSP Country Strategy Paper NWSB Northern Water Services Board DPs Development Partners O&M Operation & Maintenance EA Executing Agency QPR Quarterly Progress Report EIRR Economic Internal Rate of Return PIU Project Implementation Unit ESIA Environmental & Social Impact Assessment RMC Regional Member Country ESMP Environmental & Social Management Plan RVWSB Rift Valley Water Services Board ESSM Environmental, Social & Safeguarding Mgt SWAP Sector Wide Approach FIRR Financial Rate of Return TAWSB Tanathi Water Services Board GOK Government of Kenya UFW Un-accounted for Water HAC Harmonization, Alignment & Coordination WACC Weighted Average Cost of Capital IA Implementing Agency WARMA Water Resources Management Authority ICB International Competitive Bidding WARIS Water Regulation Information System IDIMS Irrigation & Drainage Information System WASREB Water Services Regulatory Board IWRM Integrated Water Resources Management WB The World Bank KEFO Kenya Field Office WRIMS Water Resources Information
Management System KENAO Kenya National Audit Office WRUA Water Resources Users Associations KfW Kreditanstalt fur Wiederaufbau WSB Water Services Board LVNWSB Lake Victoria North Water Services Board WSP Water Service Provider LVSWSB Lake Victoria South Water Services Board WSS Water Supply & Sanitation MDGs Millenium Development Goals WSTF Water Services Trust Fund M&E Monitoring & Evaluation WSTG Water Sector Technical Group
ii
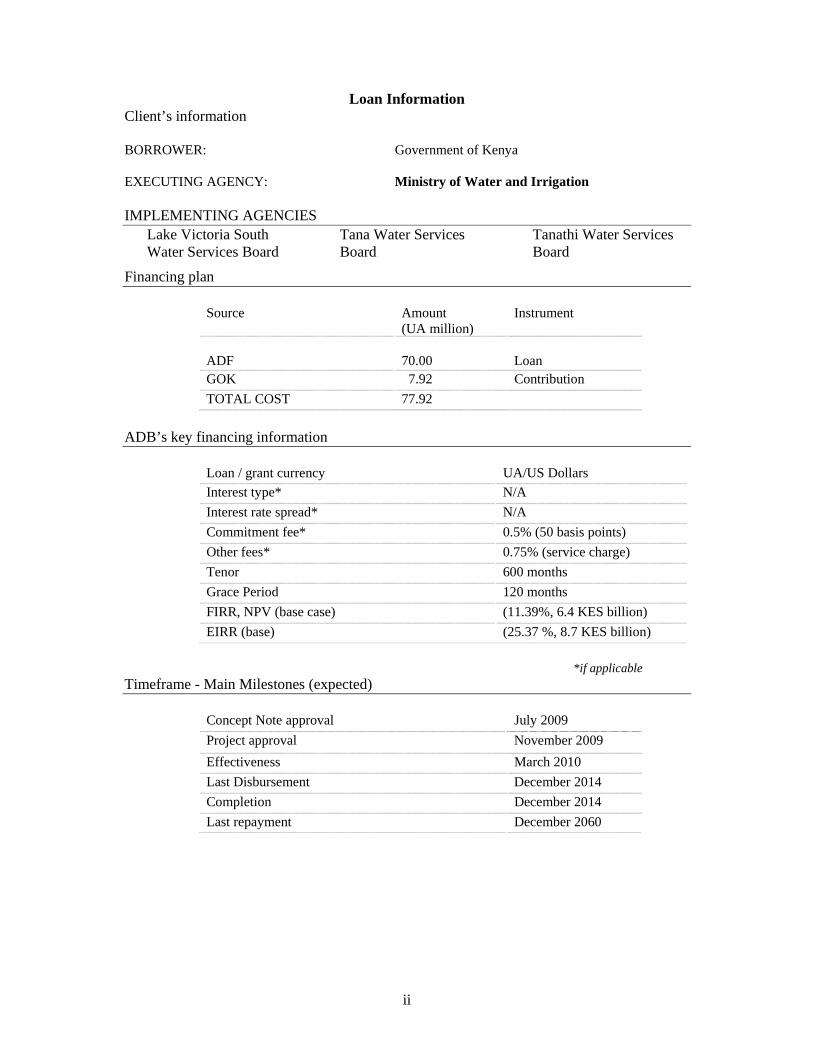
Loan Information Client’s information BORROWER: Government of Kenya EXECUTING AGENCY: Ministry of Water and Irrigation IMPLEMENTING AGENCIES
Lake Victoria South Water Services Board
Tana Water Services Board
Tanathi Water Services Board
Financing plan
Source Amount (UA million)
Instrument
ADF
70.00
Loan
GOK 7.92 Contribution TOTAL COST 77.92
ADB’s key financing information
Loan / grant currency UA/US Dollars Interest type* N/A Interest rate spread* N/A Commitment fee* 0.5% (50 basis points) Other fees* 0.75% (service charge) Tenor 600 months Grace Period 120 months FIRR, NPV (base case) (11.39%, 6.4 KES billion) EIRR (base) (25.37 %, 8.7 KES billion)
*if applicable
Timeframe - Main Milestones (expected)
Concept Note approval July 2009 Project approval November 2009 Effectiveness March 2010 Last Disbursement December 2014 Completion December 2014 Last repayment December 2060
iii
Project Summary The proposed Small Towns, Rural Water Supply and Sanitation Project presents a next step of ADB’s involvement in the water sector of Kenya. The water sector reforms are consistent and are making steady progress, thus it is justified for the Bank to assist (in response to Government’s request) the sector in Kenya in order to reach the MDGs. The project includes institutional development support, water supply, sanitation, and water storage infrastructure. The project will be implemented in a period of four years at a total cost of UA 77.92 million. The beneficiaries of the proposed project will be Lake Victoria South Water Services Board (LVSWSB): population of Bondo and Siaya; Tana Water Services Board (TWSB): population of Maua, Mukurwe-ini, Othaya, and Tanathi Water Services Board (TAWSB): population of Kitui and Yatta District. The total number of beneficiaries is estimated at 0.78 million people. The inadequate water supply and sanitation situation in these towns and surrounding areas accounts for many incidences of water borne diseases. The project will, within the project areas, result in general improvements in water supply and sanitation, public health facilities, curtail water borne diseases, increase food security through additional water storage, stimulate economic development and ensure environmental sustainability. The project will contribute towards meeting the Millennium Development Goals (MDGs) for water supply and sanitation. The Bank has a long experience in the water and sanitation sector development in East Africa, Kenya and elsewhere on the continent and has used this long experience to develop the project. Through supporting the project, the Bank demonstrates its commitment to engage with Government in addressing water supply, sanitation and water storage challenges in the country. The Bank’s experience in the preparation of the project and its implementation will be used in the various project documents including study reports, progress reports, and mid-term review and completion reports. The additional experience will increase the Bank’s institutional knowledge.
iv
Hierarchy of Objectives Expected Results Reach Performance Indicators Indicative Targets Timeframe
Assumptions/Risks
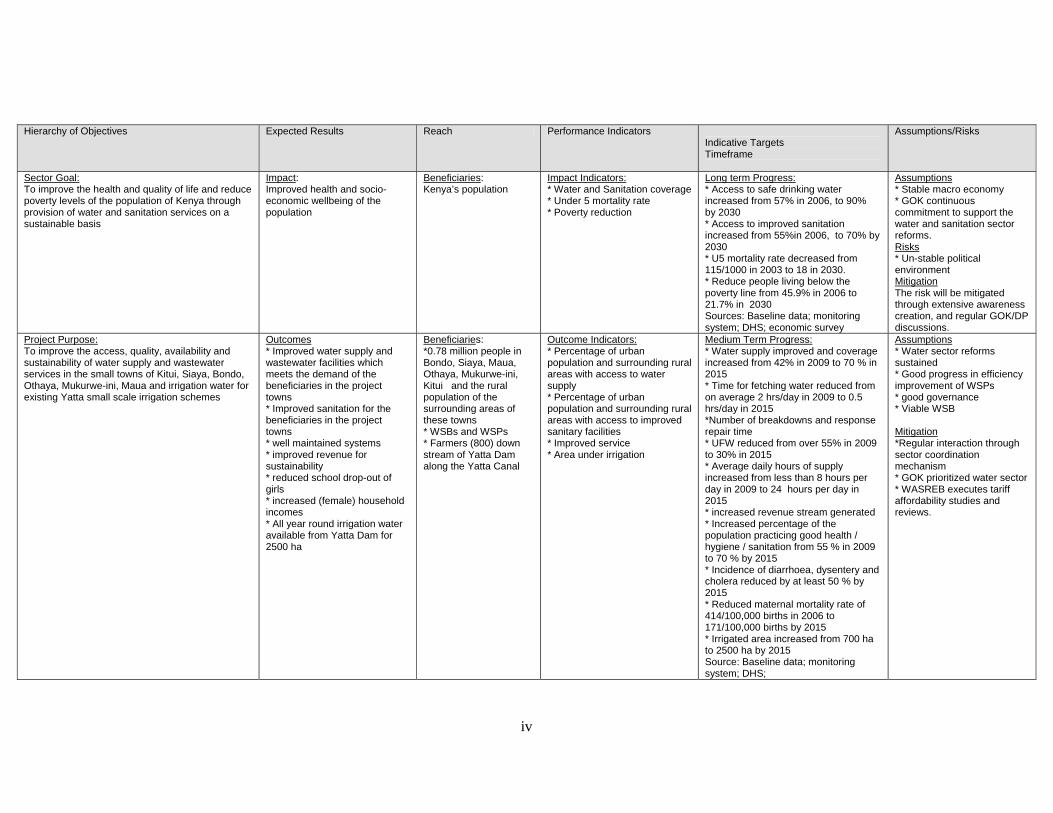
Sector Goal: To improve the health and quality of life and reduce poverty levels of the population of Kenya through provision of water and sanitation services on a sustainable basis
Impact: Improved health and socio-economic wellbeing of the population
Beneficiaries: Kenya’s population
Impact Indicators: * Water and Sanitation coverage * Under 5 mortality rate * Poverty reduction
Long term Progress: * Access to safe drinking water increased from 57% in 2006, to 90% by 2030 * Access to improved sanitation increased from 55%in 2006, to 70% by 2030 * U5 mortality rate decreased from 115/1000 in 2003 to 18 in 2030. * Reduce people living below the poverty line from 45.9% in 2006 to 21.7% in 2030 Sources: Baseline data; monitoring system; DHS; economic survey
Assumptions * Stable macro economy * GOK continuous commitment to support the water and sanitation sector reforms. Risks * Un-stable political environment Mitigation The risk will be mitigated through extensive awareness creation, and regular GOK/DP discussions.
Project Purpose: To improve the access, quality, availability and sustainability of water supply and wastewater services in the small towns of Kitui, Siaya, Bondo, Othaya, Mukurwe-ini, Maua and irrigation water for existing Yatta small scale irrigation schemes
Outcomes * Improved water supply and wastewater facilities which meets the demand of the beneficiaries in the project towns * Improved sanitation for the beneficiaries in the project towns * well maintained systems * improved revenue for sustainability * reduced school drop-out of girls * increased (female) household incomes * All year round irrigation water available from Yatta Dam for 2500 ha
Beneficiaries: *0.78 million people in Bondo, Siaya, Maua, Othaya, Mukurwe-ini, Kitui and the rural population of the surrounding areas of these towns * WSBs and WSPs * Farmers (800) down stream of Yatta Dam along the Yatta Canal
Outcome Indicators: * Percentage of urban population and surrounding rural areas with access to water supply * Percentage of urban population and surrounding rural areas with access to improved sanitary facilities * Improved service * Area under irrigation
Medium Term Progress: * Water supply improved and coverage increased from 42% in 2009 to 70 % in 2015 * Time for fetching water reduced from on average 2 hrs/day in 2009 to 0.5 hrs/day in 2015 *Number of breakdowns and response repair time * UFW reduced from over 55% in 2009 to 30% in 2015 * Average daily hours of supply increased from less than 8 hours per day in 2009 to 24 hours per day in 2015 * increased revenue stream generated * Increased percentage of the population practicing good health / hygiene / sanitation from 55 % in 2009 to 70 % by 2015 * Incidence of diarrhoea, dysentery and cholera reduced by at least 50 % by 2015 * Reduced maternal mortality rate of 414/100,000 births in 2006 to 171/100,000 births by 2015 * Irrigated area increased from 700 ha to 2500 ha by 2015 Source: Baseline data; monitoring system; DHS;
Assumptions * Water sector reforms sustained * Good progress in efficiency improvement of WSPs * good governance * Viable WSB Mitigation *Regular interaction through sector coordination mechanism * GOK prioritized water sector * WASREB executes tariff affordability studies and reviews.
v
Activities:
Outputs:
Beneficiaries:
Output Indicator:
Short Term Progress:
Assumptions/Risks:
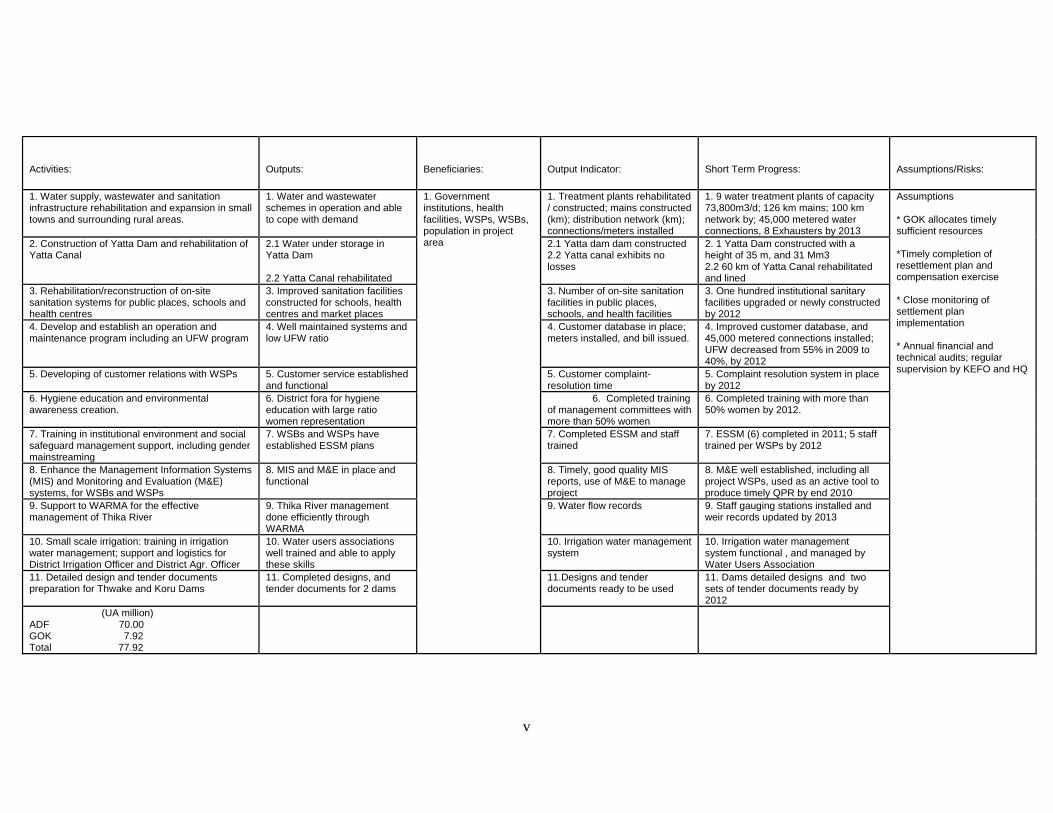
1. Water supply, wastewater and sanitation infrastructure rehabilitation and expansion in small towns and surrounding rural areas.
1. Water and wastewater schemes in operation and able to cope with demand
1. Treatment plants rehabilitated / constructed; mains constructed (km); distribution network (km); connections/meters installed
1. 9 water treatment plants of capacity 73,800m3/d; 126 km mains; 100 km network by; 45,000 metered water connections, 8 Exhausters by 2013
2. Construction of Yatta Dam and rehabilitation of Yatta Canal
2.1 Water under storage in Yatta Dam 2.2 Yatta Canal rehabilitated
2.1 Yatta dam dam constructed 2.2 Yatta canal exhibits no losses
2. 1 Yatta Dam constructed with a height of 35 m, and 31 Mm3 2.2 60 km of Yatta Canal rehabilitated and lined
3. Rehabilitation/reconstruction of on-site sanitation systems for public places, schools and health centres
3. Improved sanitation facilities constructed for schools, health centres and market places
3. Number of on-site sanitation facilities in public places, schools, and health facilities
3. One hundred institutional sanitary facilities upgraded or newly constructed by 2012
4. Develop and establish an operation and maintenance program including an UFW program
4. Well maintained systems and low UFW ratio
4. Customer database in place; meters installed, and bill issued.
4. Improved customer database, and 45,000 metered connections installed; UFW decreased from 55% in 2009 to 40%, by 2012
5. Developing of customer relations with WSPs 5. Customer service established and functional
5. Customer complaint-resolution time
5. Complaint resolution system in place by 2012
6. Hygiene education and environmental awareness creation.
6. District fora for hygiene education with large ratio women representation
6. Completed training of management committees with more than 50% women
6. Completed training with more than 50% women by 2012.
7. Training in institutional environment and social safeguard management support, including gender mainstreaming
7. WSBs and WSPs have established ESSM plans
7. Completed ESSM and staff trained
7. ESSM (6) completed in 2011; 5 staff trained per WSPs by 2012
8. Enhance the Management Information Systems (MIS) and Monitoring and Evaluation (M&E) systems, for WSBs and WSPs
8. MIS and M&E in place and functional
8. Timely, good quality MIS reports, use of M&E to manage project
8. M&E well established, including all project WSPs, used as an active tool to produce timely QPR by end 2010
9. Support to WARMA for the effective management of Thika River
9. Thika River management done efficiently through WARMA
9. Water flow records 9. Staff gauging stations installed and weir records updated by 2013
10. Small scale irrigation: training in irrigation water management; support and logistics for District Irrigation Officer and District Agr. Officer
10. Water users associations well trained and able to apply these skills
10. Irrigation water management system
10. Irrigation water management system functional , and managed by Water Users Association
11. Detailed design and tender documents preparation for Thwake and Koru Dams
11. Completed designs, and tender documents for 2 dams
11.Designs and tender documents ready to be used
11. Dams detailed designs and two sets of tender documents ready by 2012
(UA million) ADF 70.00 GOK 7.92 Total 77.92
1. Government institutions, health facilities, WSPs, WSBs, population in project area
Assumptions * GOK allocates timely sufficient resources *Timely completion of resettlement plan and compensation exercise * Close monitoring of settlement plan implementation * Annual financial and technical audits; regular supervision by KEFO and HQ
vi
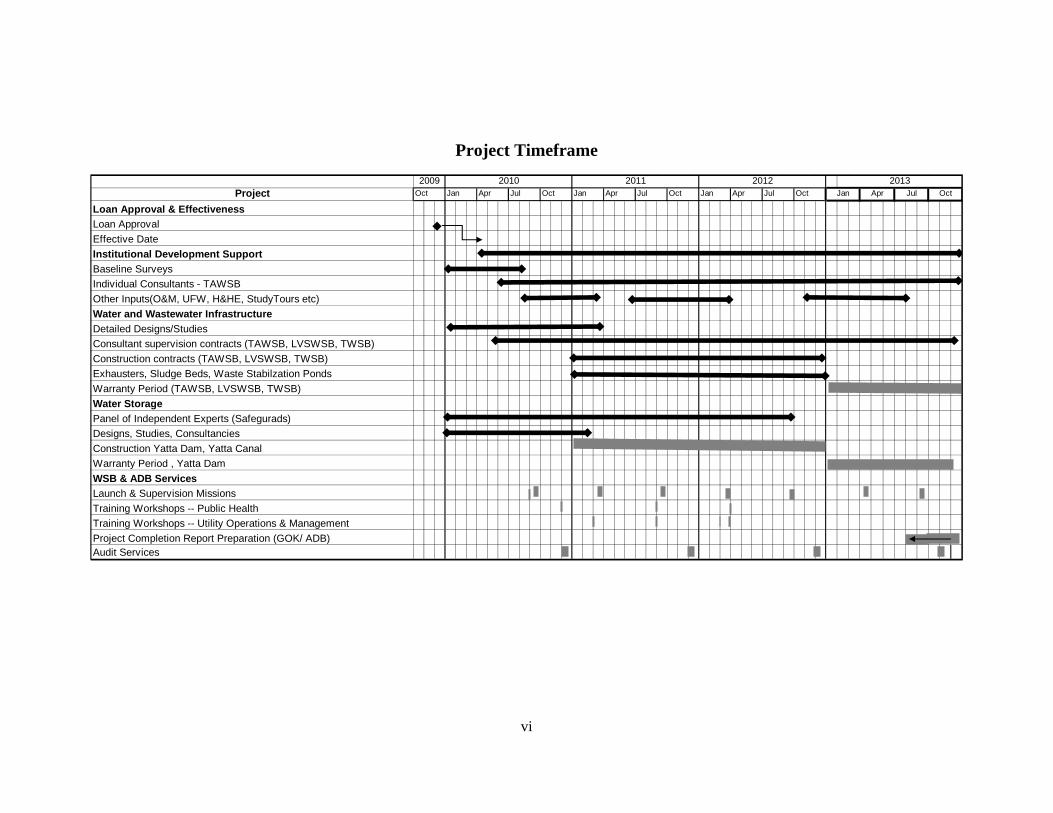
Project Timeframe
ProjectLoan Approval & EffectivenessLoan ApprovalEffective DateInstitutional Development SupportBaseline SurveysIndividual Consultants - TAWSBOther Inputs(O&M, UFW, H&HE, StudyTours etc)Water and Wastewater InfrastructureDetailed Designs/StudiesConsultant supervision contracts (TAWSB, LVSWSB, TWSB)Construction contracts (TAWSB, LVSWSB, TWSB)Exhausters, Sludge Beds, Waste Stabilzation PondsWarranty Period (TAWSB, LVSWSB, TWSB)Water StoragePanel of Independent Experts (Safegurads)Designs, Studies, ConsultanciesConstruction Yatta Dam, Yatta CanalWarranty Period , Yatta DamWSB & ADB ServicesLaunch & Supervision MissionsTraining Workshops -- Public HealthTraining Workshops -- Utility Operations & ManagementProject Completion Report Preparation (GOK/ ADB)Audit Services
2012Jan Apr Jul OctJul Oct
2011Jan Apr Jul Oct
2009Oct
2013Jan Apr Jul Oct
2010Jan Apr
1
REPORT AND RECOMMENDATION OF THE MANAGEMENT OF THE ADB GROUP TO THE BOARD OF DIRECTORS ON A PROPOSED LOAN TO KENYA
FOR THE SMALL TOWNS, RURAL WATER SUPPLY AND SANITATION PROJECT Management submits the following Report and Recommendation on a proposed loan for UA 70.00 million to finance the Small Towns, Rural Water Supply and Sanitation Project in Kenya.
I – STRATEGIC THRUST & RATIONALE
1.1. Project linkages with country strategy and objectives The Government of Kenya’s Vision 2030 acknowledges the fact that Kenya is a water scarce country and underscores the central role water plays in the performance of key sectors of the economy and the livelihoods of Kenyans. It further highlights the consequences of under-investment in: (a) water supply and sanitation services as a fundamental need for productive livelihoods and (b) irrigation and hydropower developments on food and energy security. Under the economic and social pillars of the Vision, improved access to safe water and sanitation in both rural and urban areas, and increasing the area under irrigation have been given prominence with the rehabilitation and expansion of water supply and sanitation services in urban centres and construction of water storage dams identified as some of the flagship projects. The project addresses improved water supply and sanitation, in small towns and surrounding rural areas, as well as water storage, for water supply and irrigation development, that underpins the Kenyan economic and social developments (Vision 2030) and its associated five years Medium Term Plan (MTP) for 2008-2012. The project also fits within the broad thrust of the Bank’s current 2008 – 2012 CSP which is underpinned by two pillars, with Pillar I focusing on the improvement of infrastructure services for competitiveness and enhanced regional integration and (ii) Pillar II, which addresses employment creation and poverty reduction. The current CSP is aligned with the MTP, and has a strong feature on the contributory role of water supply and sanitation, in infrastructural development. In addition, the CSP (Deliverables and Targets) identifies the proposed investment being earmarked for funding under Kenya’s ADF XI allocation.
In the Kenyan National Water Sector Strategy (2007 – 2015), the country aims to improve access
to safe water and sanitation with the goal of attaining 75% access to safe and reliable water for urban areas and 70% for rural areas and reduce unaccounted for water to below 30%.
1.2. Rationale for Bank’s involvement The overall aim of the project is to contribute to the provision of improved water supply and sanitation in small towns and their surrounding areas, and to increase the multi-purpose water storage infrastructure. The present infrastructure is inadequate, was built in the fifties, in places as Bondo, Siaya, Maua, Othaya, Mukurwe-ini and Kitui towns. The water supply coverage in the towns varies from below 20% to around 50%. The sanitation situation is in similar state none of the towns has an acceptable sanitation action plan, program and system. In spite of the recurrent droughts and floods, Kenya has not invested in water storage infrastructure to deal with shocks from extreme events. This is illustrated by the decline in water storage from 11 m3 per capita to an alarmingly low value of below 5 m3 per capita.
2
The Project fits under the social pillar of Vision 2030 and is in line with current CSP for Kenya, which aims at building on the on-going Bank support in the sector by improving water and sanitation services in medium sized towns and surrounding rural areas, and increasing efficiency of water storage. The Bank’s medium term strategy aims at providing for the support and capacity of RMCs to sustainably manage water resources and mainstream Integrated Water Resources Management (IWRM) practice. The project will achieve this goal, through the provision for the multipurpose Yatta Dam, which is intended for sustained additional water for both domestic water supply and water for the existing Yatta small-scale irrigation schemes, which are decrepit, because of intermittent water flows. In addition, the construction of the Yatta Dam complements the GOK’s MTP goal of increasing the per capita water storage from 5m3 to 16m3 per capita by 2012. The project further complements the ongoing Water Services Boards Support Project, related to the improvement of water supply and sewerage systems in LVSWSB TWSB, NWSB approved in 2007 and scheduled to be completed in 2012. The Bank Group should intervene in the water and sanitation sector, stemming from its long-term engagement in sector, and the fact that the GOK has requested for support in the six towns. In the National Water Sector Strategy (2007 – 2015), Kenya over the next five years aims to improve access to safe water and sanitation with the goal of attaining 75% access to safe and reliable water for urban areas and 70% for rural areas and reduce unaccounted for water to below 30%. The government recognizes the Bank to be a key development partner in its efforts to improve water and sanitation services given the long-standing engagement in the country. The Bank has financed several water, irrigation, and dam projects since the 1980s and currently, the Bank is actively involved in different sectors, including power, urban and rural water supply and sanitation, health, education, and roads. The Bank is hence well suited to finance the project given its vital and unique role in the socio-economic development of its Regional Member Countries.
1.3 Sector Reforms Prior to the sector reforms in 2002, the water services sub-sector in Kenya was plagued by poorly performing utilities, resulting in the degradation of infrastructure, and services.
The reforms resulted in the Water Services Regulatory Board (WASREB) setting standards and regulating the sub-sector; the eight Water Services Boards (WSBs) responsible for the efficient and economical provision of water services; the Water Services Trust Fund (WSTF) financing pro-poor investments; and Water Services Providers (WSPs) as agents in the provision of water and sewerage services utilizing acceptable business principles in their operations. The Water Resources Management Authority (WARMA) oversees the management, use and development of water resources nationally. The MWI is responsible for overall sector oversight including policy formulation, coordination and resource mobilization. The reforms are now focused on achieving commercial viability / technical efficiency of the various institutions established. Further work remains to be achieved with respect to assets and staff transfers. All of these will be supported by the project.
3
1.4 Donors coordination The Harmonization, Alignment, and Coordination (HAC) donor group was established in 2003 for donors to better harmonize, align, and coordinate their activities, in line with the objectives of the Paris Declaration. The HAC group expanded to 17 donor partners, with the African Development Bank coming on board in January 2007. The 17 HAC members are the governments of Canada, Denmark, Finland, France, Germany, Italy, Japan, the Netherlands, Norway, Spain, Sweden, the United Kingdom, the United States, the African Development Bank, the European Commission, the United Nations, and the World Bank. Currently KEFO is chairing the Roads and Transportation Donor Group. Collaboration between donors has been scaled up with the establishment of the Water Sector Technical Group (WSTG), which meets once every two months and currently being chaired by KfW. Development Partners (DPs) active in the water sector currently have a commitment of about USD 950 million towards water and sanitation projects including institutional support. Most of these come from the World Bank, KfW, Japan, ADB and AFD. The situation currently is that Athi Water Services Board (AWSB) is assisted by WB and AFD, the Coast Water Services Board (CWSB) is supported by WB and AFD, the LVNWSB is assisted by WB and the (KfW), while the ADB supports the RVWSB, LVSWSB, TWSB and NWSB and AWSB in Kibera.
II – PROJECT DESCRIPTION
The proposed project addresses the water supply and sanitation problems in a number of small towns and the lack of water storage in Yatta area. The project will have three components (1) institutional development support to strengthen the commercial, technical and financial aspects of the Water Service Providers, (2) water supply and wastewater infrastructure rehabilitation and extension, and (3) water storage intervention which includes the construction of the multi-purpose Yatta dam. As the very first activity a gender sensitive baseline survey will be undertaken to establish a clear baseline.
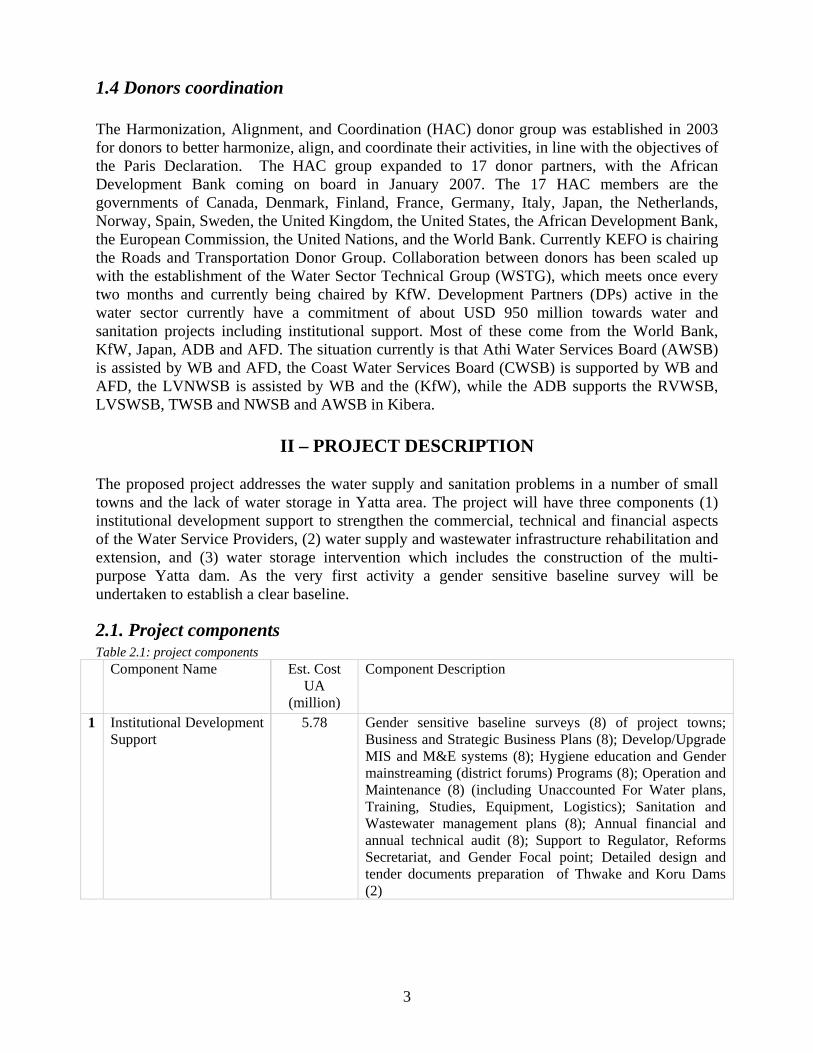
2.1. Project components Table 2.1: project components
Component Name Est. Cost UA
(million)
Component Description
1
Institutional Development Support
5.78
Gender sensitive baseline surveys (8) of project towns; Business and Strategic Business Plans (8); Develop/Upgrade MIS and M&E systems (8); Hygiene education and Gender mainstreaming (district forums) Programs (8); Operation and Maintenance (8) (including Unaccounted For Water plans, Training, Studies, Equipment, Logistics); Sanitation and Wastewater management plans (8); Annual financial and annual technical audit (8); Support to Regulator, Reforms Secretariat, and Gender Focal point; Detailed design and tender documents preparation of Thwake and Koru Dams (2)
4
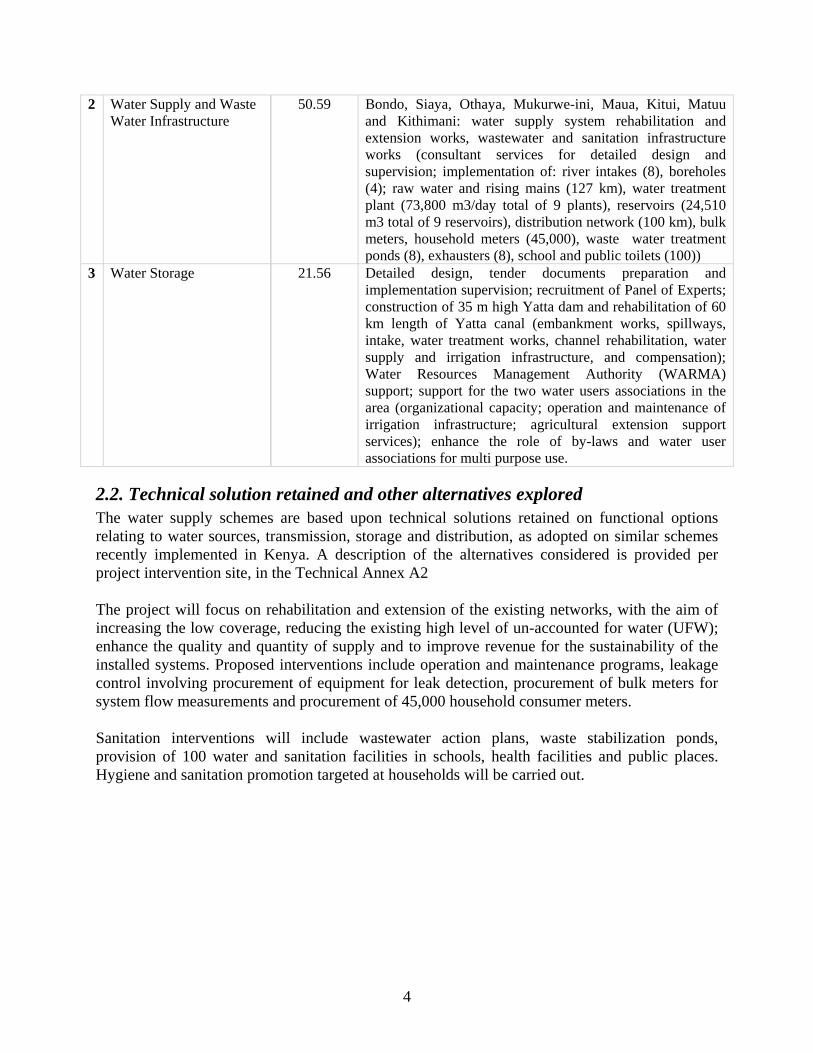
2
Water Supply and Waste Water Infrastructure
50.59
Bondo, Siaya, Othaya, Mukurwe-ini, Maua, Kitui, Matuu and Kithimani: water supply system rehabilitation and extension works, wastewater and sanitation infrastructure works (consultant services for detailed design and supervision; implementation of: river intakes (8), boreholes (4); raw water and rising mains (127 km), water treatment plant (73,800 m3/day total of 9 plants), reservoirs (24,510 m3 total of 9 reservoirs), distribution network (100 km), bulk meters, household meters (45,000), waste water treatment ponds (8), exhausters (8), school and public toilets (100))
3 Water Storage
21.56
Detailed design, tender documents preparation and implementation supervision; recruitment of Panel of Experts; construction of 35 m high Yatta dam and rehabilitation of 60 km length of Yatta canal (embankment works, spillways, intake, water treatment works, channel rehabilitation, water supply and irrigation infrastructure, and compensation); Water Resources Management Authority (WARMA) support; support for the two water users associations in the area (organizational capacity; operation and maintenance of irrigation infrastructure; agricultural extension support services); enhance the role of by-laws and water user associations for multi purpose use.
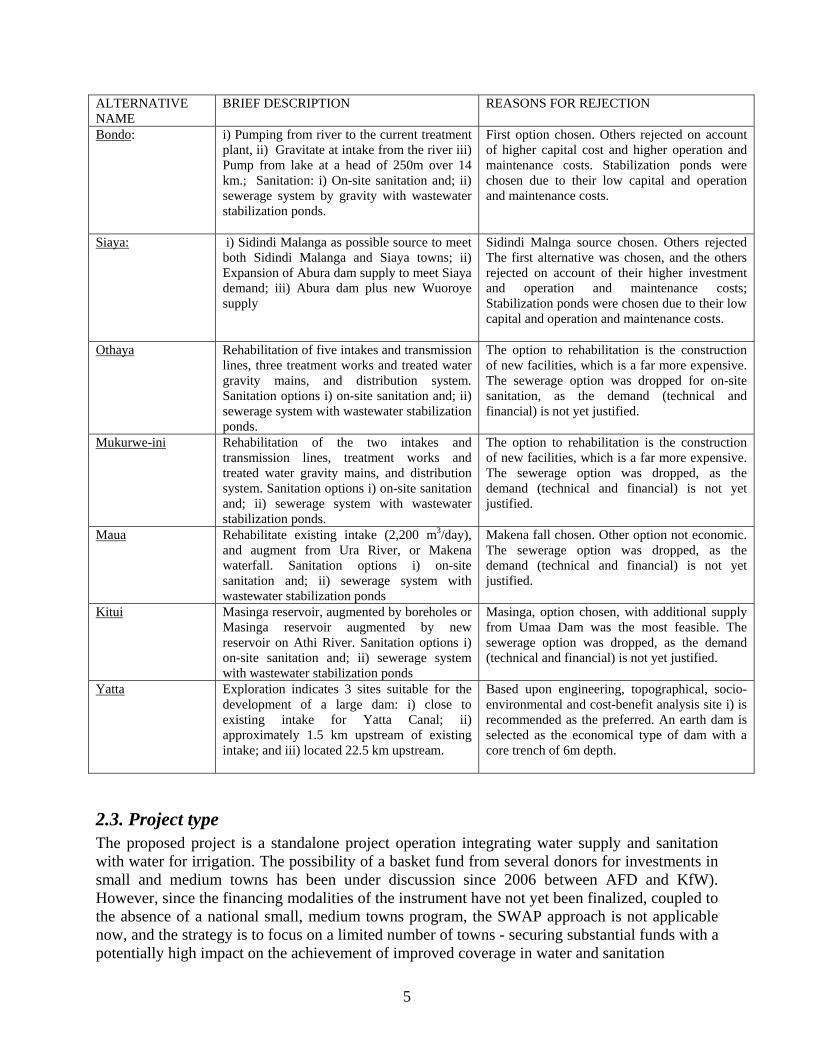
2.2. Technical solution retained and other alternatives explored The water supply schemes are based upon technical solutions retained on functional options relating to water sources, transmission, storage and distribution, as adopted on similar schemes recently implemented in Kenya. A description of the alternatives considered is provided per project intervention site, in the Technical Annex A2 The project will focus on rehabilitation and extension of the existing networks, with the aim of increasing the low coverage, reducing the existing high level of un-accounted for water (UFW); enhance the quality and quantity of supply and to improve revenue for the sustainability of the installed systems. Proposed interventions include operation and maintenance programs, leakage control involving procurement of equipment for leak detection, procurement of bulk meters for system flow measurements and procurement of 45,000 household consumer meters. Sanitation interventions will include wastewater action plans, waste stabilization ponds, provision of 100 water and sanitation facilities in schools, health facilities and public places. Hygiene and sanitation promotion targeted at households will be carried out.
5
ALTERNATIVE NAME
BRIEF DESCRIPTION REASONS FOR REJECTION
Bondo: i) Pumping from river to the current treatment plant, ii) Gravitate at intake from the river iii) Pump from lake at a head of 250m over 14 km.; Sanitation: i) On-site sanitation and; ii) sewerage system by gravity with wastewater stabilization ponds.
First option chosen. Others rejected on account of higher capital cost and higher operation and maintenance costs. Stabilization ponds were chosen due to their low capital and operation and maintenance costs.
Siaya: i) Sidindi Malanga as possible source to meet both Sidindi Malanga and Siaya towns; ii) Expansion of Abura dam supply to meet Siaya demand; iii) Abura dam plus new Wuoroye supply
Sidindi Malnga source chosen. Others rejected The first alternative was chosen, and the others rejected on account of their higher investment and operation and maintenance costs; Stabilization ponds were chosen due to their low capital and operation and maintenance costs.
Othaya Rehabilitation of five intakes and transmission lines, three treatment works and treated water gravity mains, and distribution system. Sanitation options i) on-site sanitation and; ii) sewerage system with wastewater stabilization ponds.
The option to rehabilitation is the construction of new facilities, which is a far more expensive. The sewerage option was dropped for on-site sanitation, as the demand (technical and financial) is not yet justified.
Mukurwe-ini Rehabilitation of the two intakes and
transmission lines, treatment works and treated water gravity mains, and distribution system. Sanitation options i) on-site sanitation and; ii) sewerage system with wastewater stabilization ponds.
The option to rehabilitation is the construction of new facilities, which is a far more expensive. The sewerage option was dropped, as the demand (technical and financial) is not yet justified.
Maua Rehabilitate existing intake (2,200 m3/day), and augment from Ura River, or Makena waterfall. Sanitation options i) on-site sanitation and; ii) sewerage system with wastewater stabilization ponds
Makena fall chosen. Other option not economic. The sewerage option was dropped, as the demand (technical and financial) is not yet justified.
Kitui Masinga reservoir, augmented by boreholes or Masinga reservoir augmented by new reservoir on Athi River. Sanitation options i) on-site sanitation and; ii) sewerage system with wastewater stabilization ponds
Masinga, option chosen, with additional supply from Umaa Dam was the most feasible. The sewerage option was dropped, as the demand (technical and financial) is not yet justified.
Yatta Exploration indicates 3 sites suitable for the development of a large dam: i) close to existing intake for Yatta Canal; ii) approximately 1.5 km upstream of existing intake; and iii) located 22.5 km upstream.
Based upon engineering, topographical, socio-environmental and cost-benefit analysis site i) is recommended as the preferred. An earth dam is selected as the economical type of dam with a core trench of 6m depth.
2.3. Project type The proposed project is a standalone project operation integrating water supply and sanitation with water for irrigation. The possibility of a basket fund from several donors for investments in small and medium towns has been under discussion since 2006 between AFD and KfW). However, since the financing modalities of the instrument have not yet been finalized, coupled to the absence of a national small, medium towns program, the SWAP approach is not applicable now, and the strategy is to focus on a limited number of towns - securing substantial funds with a potentially high impact on the achievement of improved coverage in water and sanitation
6
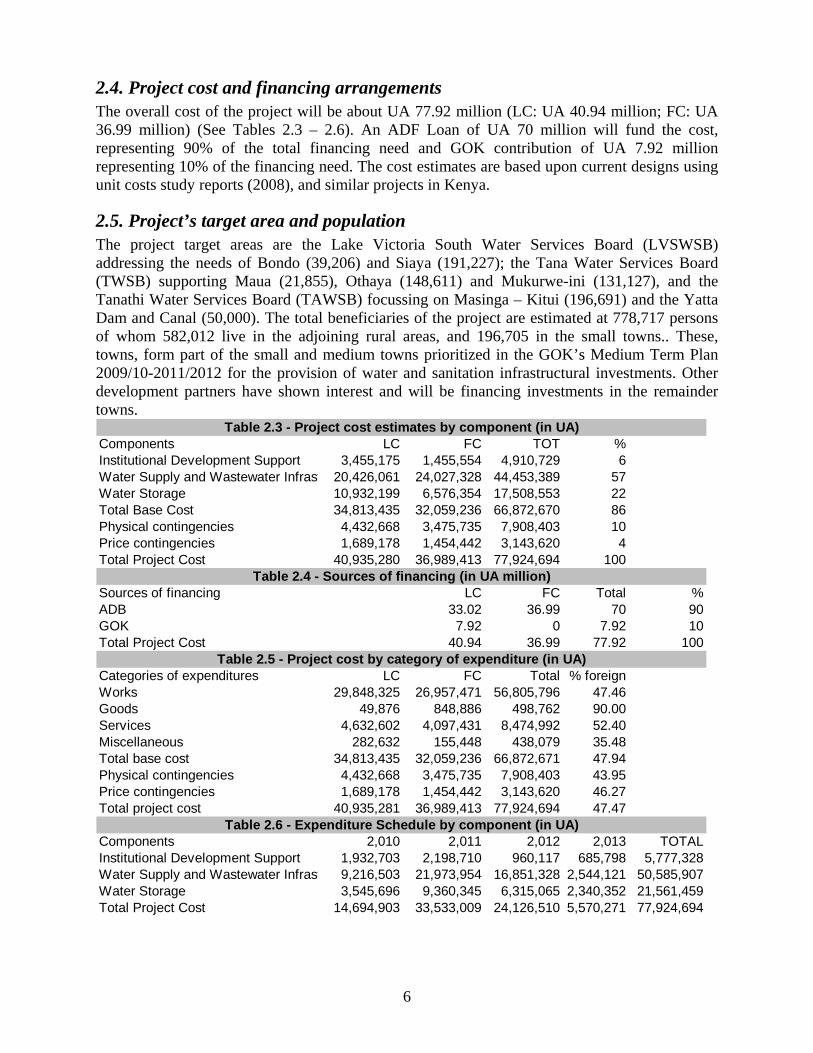
2.4. Project cost and financing arrangements The overall cost of the project will be about UA 77.92 million (LC: UA 40.94 million; FC: UA 36.99 million) (See Tables 2.3 – 2.6). An ADF Loan of UA 70 million will fund the cost, representing 90% of the total financing need and GOK contribution of UA 7.92 million representing 10% of the financing need. The cost estimates are based upon current designs using unit costs study reports (2008), and similar projects in Kenya.
2.5. Project’s target area and population The project target areas are the Lake Victoria South Water Services Board (LVSWSB) addressing the needs of Bondo (39,206) and Siaya (191,227); the Tana Water Services Board (TWSB) supporting Maua (21,855), Othaya (148,611) and Mukurwe-ini (131,127), and the Tanathi Water Services Board (TAWSB) focussing on Masinga – Kitui (196,691) and the Yatta Dam and Canal (50,000). The total beneficiaries of the project are estimated at 778,717 persons of whom 582,012 live in the adjoining rural areas, and 196,705 in the small towns.. These, towns, form part of the small and medium towns prioritized in the GOK’s Medium Term Plan 2009/10-2011/2012 for the provision of water and sanitation infrastructural investments. Other development partners have shown interest and will be financing investments in the remainder towns.
Components LC FC TOT %Institutional Development Support 3,455,175 1,455,554 4,910,729 6Water Supply and Wastewater Infrast 20,426,061 24,027,328 44,453,389 57Water Storage 10,932,199 6,576,354 17,508,553 22Total Base Cost 34,813,435 32,059,236 66,872,670 86Physical contingencies 4,432,668 3,475,735 7,908,403 10Price contingencies 1,689,178 1,454,442 3,143,620 4Total Project Cost 40,935,280 36,989,413 77,924,694 100
Sources of financing LC FC Total %ADB 33.02 36.99 70 90GOK 7.92 0 7.92 10Total Project Cost 40.94 36.99 77.92 100
Categories of expenditures LC FC Total % foreignWorks 29,848,325 26,957,471 56,805,796 47.46Goods 49,876 848,886 498,762 90.00Services 4,632,602 4,097,431 8,474,992 52.40Miscellaneous 282,632 155,448 438,079 35.48Total base cost 34,813,435 32,059,236 66,872,671 47.94Physical contingencies 4,432,668 3,475,735 7,908,403 43.95Price contingencies 1,689,178 1,454,442 3,143,620 46.27Total project cost 40,935,281 36,989,413 77,924,694 47.47
Components 2,010 2,011 2,012 2,013 TOTALInstitutional Development Support 1,932,703 2,198,710 960,117 685,798 5,777,328Water Supply and Wastewater Infrast 9,216,503 21,973,954 16,851,328 2,544,121 50,585,907Water Storage 3,545,696 9,360,345 6,315,065 2,340,352 21,561,459Total Project Cost 14,694,903 33,533,009 24,126,510 5,570,271 77,924,694
Table 2.3 - Project cost estimates by component (in UA)
Table 2.4 - Sources of financing (in UA million)
Table 2.6 - Expenditure Schedule by component (in UA)
Table 2.5 - Project cost by category of expenditure (in UA)
7
2.6. Participatory process for project identification, design and implementation Public consultations were initiated during the pre-feasibility studies stage and continued with the ESIA studies. The Ministry of Water and Irrigation (MWI) has discussed the project with other relevant ministries, districts, Water Services Boards, Water Services Providers, and community members of the project towns. The ESIA was done in consultation with the communities living upstream and downstream the project site of the Yatta Dam. The preparation and appraisal missions had consultations with WSBs, Districts and visited the project sites, during which, it interacted with communities at project sites to confirm their perception of, and support for the planned development. Briefing of the DPs of the project was done during the DPs Sector Coordination meeting. The proposed project is part of the Government’s long term plans to address the multi-pronged issue of inadequate access to water and sanitation services. The project preparation and appraisal was jointly done by ADB and Officials of the GOK.
2.7. Bank Group experience, lessons reflected in project design The Bank Group operations in Kenya commenced in 1967 with a focus on infrastructure and agricultural development. There are 20 on-going public sector projects with a total portfolio amount of UA 525.7 million distributed as follows: Transport (42.7%), Energy (3.4%), Agriculture and Environment (21.0%), Water and Sanitation (12.6%), Education Sector (11.4%), Health Sector (4.5) and Institutional Reforms (4.3%), with an average project size of UA 26.29 million. Projects at risk declined from 21% in 2007 to 9.5% in 2009 with a disbursement level of 12.94%. While progress was made as indicated above, a number of challenges, remain including slow implementation and low disbursements against growing Bank Group commitments. The ADB supported water & sanitation sector operations in Kenya, started in 1978 and consist of 10 operations (UA 145.28 million): Of these, 6 projects and 2 studies were completed, and 2 are ongoing. The Rift Valley Water Supply & Sanitation Project, focusing on rehabilitation and improvement of Nakuru water and sewerage system, and nearby secondary towns and rural water supply, is expected to be completed by December 2009 and the Water Services Board Support Project approved in 2007, will be completed in 2012. In designing the new investment, a number of pertinent lessons from past Bank, and other development partner financed projects have been taken into account. From the ADF supported El Nino Infrastructure Rehabilitation Project (1998-2002) and the Third Nairobi Water Supply project (1989-1997) lessons learned and applied in the design are (a) the need for adequate audit and oversight arrangements, through the institution of yearly technical and financial audits, (b) the provision of ample funds for exhaustive site investigations in order to better determine the site conditions and limit the possible increases in measured works and engineering claims during project implementation, particularly for dam projects requiring sub surface investigation; lesson applied through the increased contingencies percentage (c) the need for incorporating the recommendations of Project Panel Experts in the dam design before tendering and not during the project implementation; lesson applied through recruitment of Panel of Expert under advance procurement so that the Panel is available at the start of the Project (d) the need to ensure that conditions related to land acquisition are closely monitored to prevent delays and associated costs; (e) need to allow for increased physical and price contingencies for dam and tunnelling works than in usual percentages applied to other works; lesson applied through increased physical contingencies (20%) for the dam component; (f) the need to adequately sensitize the
8
affected populations about resettlement and compensation arrangements which should include both land and cash for the land development; lesson applied through intensifying interaction with the beneficiaries. Further, the lessons from the on-going Rift Valley Water Supply and Sanitation (approved in 2003) and the Water Services Boards Support Project (approved in 2007) have resulted in the fast tracking of procurement, evidenced in the Procurement Plan, , and a system of tracking disbursement request from the Implementing Agencies to the Bank being factored into the design of the project, to accelerate the commencement of project activities and minimise delays in disbursement which plagued both projects.
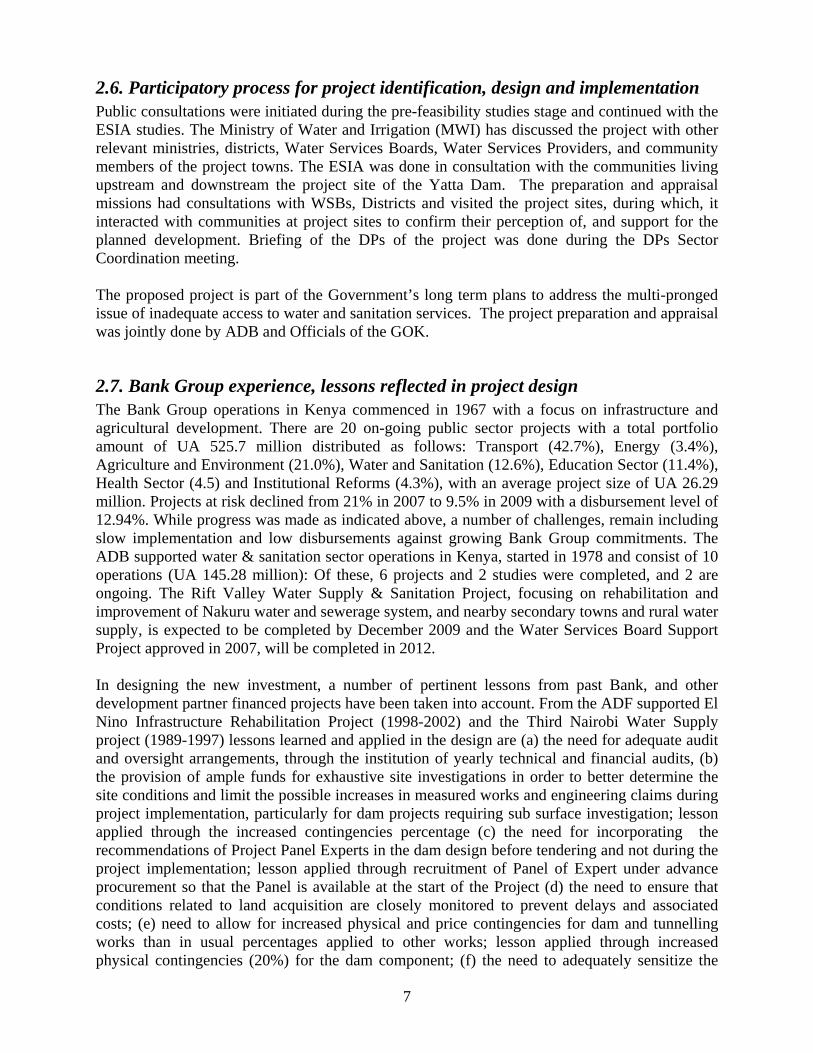
2.8 Key performance indicators The project key performance indicators reflect achievement of the expected outputs and outcomes. These include: (i) improvement in access to improved water supply by residents (ii) improvements in access to improved sanitation (iii) improvement in the quality of service provision (i.e. increased number of hours of supply, reduction of UFW, reduction of hours spent in fetching water, improved response time to registered customers’ complaints), (iv) the reduction in the number of water and sanitation related diseases, (v) farmers able to access adequate irrigation water all year round. These are presented in C1 of the Technical Annexes The performance indicators reflecting the socio-economic and gender dimensions of the project include the number of privately managed sanitation facilities especially by women’s group, and project staff trained in the methodology and techniques of collecting and reporting disaggregated data.
2009 2015 Improved water supply 42% 70% Improved sanitation 40% 70% Hours of water supply/day <8 hours 24 hours UFW 55% 30% Time spent fetching water 3-5 hours/day 0.5 hours/day Decrease of incidence disease X 50% of X Area year-round irrigation 0 ha 700 ha
III – PROJECT FEASIBILITY
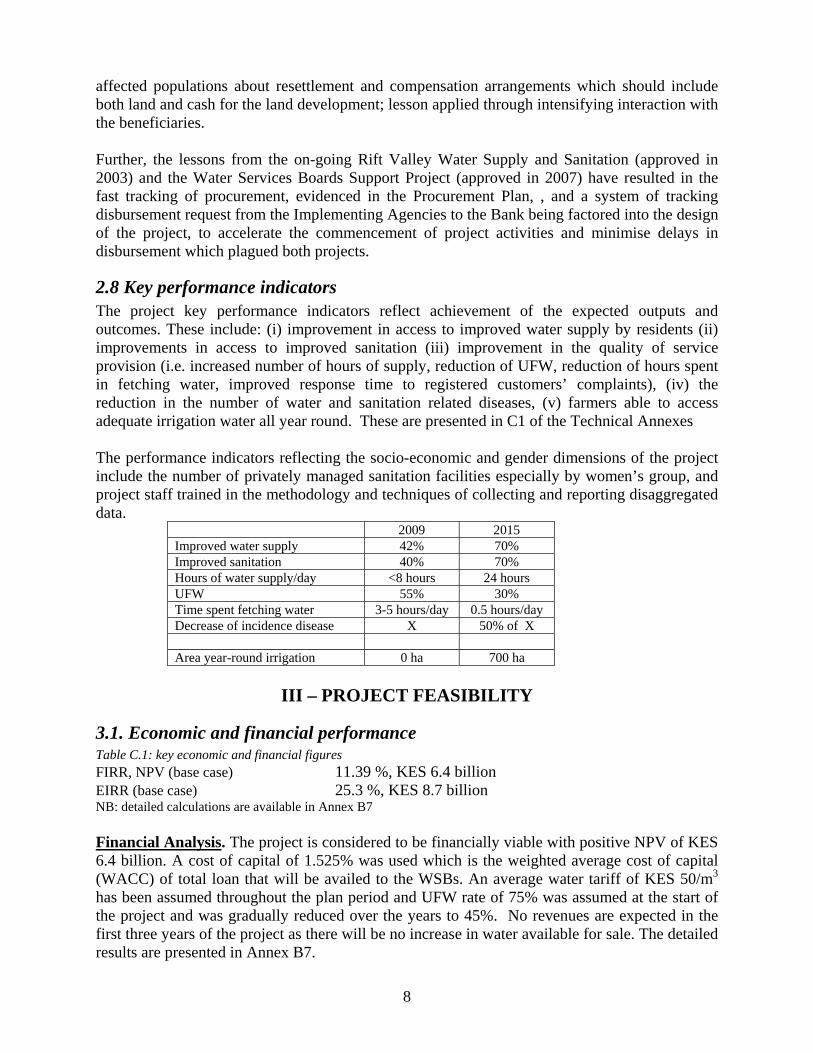
3.1. Economic and financial performance Table C.1: key economic and financial figures FIRR, NPV (base case) 11.39 %, KES 6.4 billion EIRR (base case) 25.3 %, KES 8.7 billion NB: detailed calculations are available in Annex B7 Financial Analysis. The project is considered to be financially viable with positive NPV of KES 6.4 billion. A cost of capital of 1.525% was used which is the weighted average cost of capital (WACC) of total loan that will be availed to the WSBs. An average water tariff of KES 50/m3 has been assumed throughout the plan period and UFW rate of 75% was assumed at the start of the project and was gradually reduced over the years to 45%. No revenues are expected in the first three years of the project as there will be no increase in water available for sale. The detailed results are presented in Annex B7.
9
Economic Analysis. The economic analysis measures the benefits generated by the project for various aspects such as Social / economic benefits (hereby referred to as opportunity costs) of alternative uses of time previously used for fetching water by the household over a long distance, social benefits enjoyed by the household due to better health from improvement in sanitation and water supply, social benefits accruing from a reduction in health costs, incremental economic benefit accruing from increased production under irrigation and employment opportunities created by the project. Assuming a 12% economic opportunity cost of the investments, the analysis indicates an economic NPV of KES 8.7 billion, translating into significant impact and benefits for the beneficiaries in the project area. The detailed results are given in Annex B7.
3.2. Environmental and Social impacts Environment The project has been classified as environmental category 1 because of the construction of the Yatta Dam for water storage. Anticipated environmental impacts include resettlement of the 50 families, displacement of the biodiversity during constructions, noise and emissions by trucks transporting construction materials. Additional impacts on displacement of vegetation are anticipated in other project areas of Kitui, Bondo, Siaya, Othaya, Mukurwe-ini and Maua. However, the impacts are minimal and reversible through mitigation measures. The ESMP and Resettlement Plans have been designed for effective mitigation measures and actions will be incorporated in the contractor’s TOR to limit interference with vegetation, replace destroyed vegetation through landscaping and engaging local communities to expand on biodiversity conservation measures and practices in all project sites. Climate Change The consequences of climate change pose risks to the project, with respect to the extreme weather events of droughts and floods, which have become frequent in Kenya e.g., the El Nino and La Niña in the 90s both causing extreme floods and drought; Kenya is currently experiencing the fourth consecutive year of drought seasons. The government is committed to mitigating climate change, and is investing a lot in adaptation/mitigation measures. Within this framework therefore, the design and physical location of the structures being built, will be in areas less prone to flooding. In addition, support is provided in the project for WARMA to execute river flow monitoring , and to enhance their capacity for flood, and drought prediction and monitoring in the catchment. The major investments in addressing the unaccounted for water, will ultimately reduce energy costs associated with pumping, and thus contribute positively to reduction in carbon emissions. Gender The rehabilitation/provision of safe drinking water and sanitation systems in the project towns combined with hygiene promotion will help in decreasing the school drop out rate of girls and the maternal mortality rate. Because of reducing the heavy burden of household responsibilities of girls and supporting the schools with sanitation facilities, girls’ dropout from school will significantly decrease at project completion, when compared to the figures of 4.9% in 2008. In addition, the support of health centres will contribute to the national efforts to meet the MDG on maternal mortality, which is currently getting worse. The provision of clean water and sanitary facilities to health centres will contribute to the reduction of the Maternal Mortality Rate from 414/100,000 in 2006 to 171/100,000 by 2013 which is the national target.
10
The availability of irrigation water throughout the year will help also women farmers to increase production of their subsistence/cash crops, which will influence household nutrition and income. It will help male and female farmers, engaged in growing cash crops, to increase production and potentially enhance economic security and livelihoods as well. The gender roles in farming systems are complex. An improved access to irrigation for subsistence and cash corps is considered as one among many other contributing factors that can increase women’s opportunity to improve their living standard. Social The project aims to increase access to safe drinking water and sanitation facilities in the project areas, and all year round irrigation water, which will result in an increase of all year round irrigated farming to 700 ha, extending to 2500 ha by the year 2015, as well as provide water for 210,000 livestock. The improved health and socio-economic situation will influence the livelihoods of the beneficiaries through reduced health cost and improved ability to work. It contributes to the reduction in the number of persons living below the poverty line. It is estimated that the reduction of water related diseases saves on average two working days per year; which represents roughly 1% of household income. The proposed hygiene promotion and the strengthened role of the district health forums in undertaking effective public health campaigns will increase the population practicing good hygiene from 55 % in 2009 to 70 % by 2015. Women spend between 3 to 5 hours daily fetching water. This amounts to about 40% of their working day. The reduced time and energy spent in fetching and queuing for water, of say, a half hour by 2015 will enable women to engage in alternative activities. The reduction in time spent fetching water could be utilised for income generating activities that will increase the contribution of female family labor by 10 %. The proposed Yatta Dam will secure access to safe drinking water and irrigation water for existing users of the Yatta Canal. The project anticipates increased agricultural production by 45% as well as employment on the existing farms, 2,000 people are expected to be employed. Involuntary resettlement About 50 families will be displaced by the reservoir and some livelihoods will be affected as a result of the construction of water storage in Yatta. In accordance with the Government of Kenya Land Acquisition Act Chapter 295 and ADB (2003) Involuntary Resettlement Policy, ESMP and Resettlement Plans have been designed to effectively mitigate the displacement impact through relocation of the affected families with adequate compensation scheme. In addition, consultations with concerned families, local authorities and other state institutions is currently taking place, with the objective formalising an earlier consensus on resettlement as a result of the water storage construction The satisfactory implementation of the Resettlement and Compensation plan is made a condition of the loan (section 5.2).
11
IV – IMPLEMENTATION
4.1.1 Implementation arrangements The GOK is the borrower of the ADF loan, while the MWI of the borrower is the Executing Agency (EA) for the project and will have a coordinating role, audit and progress reporting only. The Water Services Boards (WSBs) will implement the project using existing staff. i.e., Lake Victoria South WSB will implement Siaya and Bondo; Tana WSB will implement Othaya-Mukurweini, Maua; while Tanathi WSB will implement Kitui & Yatta Dam, and no Project Implementation Units (PIU) will be required as the same internal units implementing the on-going Water Services Support Board Project , will implement the project. This will ensure faster start up of the new project. The WSBs and WSPs will be assisted through the institutional development support component to enhance their managerial, commercial, and technical capacity. Support by engineering consultants will be provided to prepare the detailed designs, tender documents, and supervision of works. In addition, the Tanathi Water Services Board (established in June 2008), which will handle the bulk of investments provided in the project will have its staff strength strengthened for the duration of the Project, with Contract staff in Civil Engineering, Internal Audit, and Financial Management. The WSBs/WSPs will closely collaborate with the Ministry of Health in the delivery of the health education activities, with particular attention to awareness creation, promoting and supporting capacity building within the project areas. The implementation of the construction phase of the multipurpose Yatta Dam and the rehabilitation of the Yatta Canal and irrigation schemes will be managed by Tanathi WSB with support from the District Irrigation Engineer, and District Agricultural Officer. The farmer support activities on the irrigation schemes will be implemented through the offices of the District Irrigation Engineer, and District Agricultural Officer.
4.1.2 Procurement A procurement assessment of the WSBs was conducted during project appraisal, and the results attached in Annex B5. All procurement of goods, works and acquisition of consulting services financed by the Bank will be in accordance with the Bank's Rules and Procedures for Procurement of Goods and Works or, as appropriate, Rules and Procedures for the Use of Consultants, using the relevant Bank Standard Bidding Documents.. The project WSBs will be responsible for the procurement of goods, works, services, training and miscellaneous items. A procurement plan, as well as the Project Implementation Plan (PIP) is included in Annex B5.
4.1.3 Financial Management
The assessment of TWSB’s; TAWSB’s and LVSWSB’s financial arrangements for the implementation of the project found that they have sufficient experience in managing projects of this nature and size following their individual experience with other Bank Group Projects. The respective Internal Controls within WSBs will be used for the Project. The TAWSB, TWSB, and LVSWSB all have Internal Audit Departments, which reports functionally to the Audit Committee of the Board, and administratively to the CEO. External Audits for the Project will be carried out by KENAO; however, in the event that KENAO is unable to fit the yearly financial and technical audits into its schedule, provision is also made for the services to be outsourced to an Independent Auditor whose appointment through short-listing will be approved by the Bank. Disbursement of the ADF resources will be through direct disbursement to the suppliers and
12
contractors for the ICB and NCB packages and for some consultancy services. Disbursements for contracts UA 50,000 will be through the special account.
4.2. Monitoring Timeframe Milestone Monitoring process / Feedback loop 11/2009 Loan Approval ADF 04/2010 Loan Effectiveness Launching Mission – Follow-up 07/2010 First Disbursement ADF – KEFO to monitor Annual Sector Review KEFO, ADF to attend and follow up 06/2012 Mid Term Review All Stakeholders Involved – Follow-up 12/2014 Completion ADF/KEFO A tracking system to monitor the time for completing disbursement requests from the IAs, to the Bank, will be implemented for efficient project implementation. The project will utilize and further enhance the existing monitoring tools developed for use under the reform process in Kenya namely:
• WARIS - an Information System which tracks the performance of the water services sub-sector and covers the local level (WSPs and point sources), WSB and WASREB;
• WRIMS- an Information System that is focused on water resources data and includes time series hydrological data, permit data, and catchment spatial data. This Information System is being developed by WRMA;
• IDIMS.-an Information System that addresses the needs of the irrigation sub-sector; The results of the monitoring tools are fed into a mandatory Quarterly Performance Contract system, which will be annexed, to the Bank’s standard Quarterly Progress Reports. As there are a number of DPs supporting the WSBs/WSPs in capacity building, there will be also quarterly coordination meeting of the DPs in the WSBs.
4.3. Governance According to the World Bank’s Governance rankings for 2009, Kenya’s performance on the three governance dimensions i) Voice and Accountability, ii) Government Effectiveness, iii) Regulatory Quality, is in the second percentile rank in comparison with countries in Sub-Saharan Africa that were surveyed. On the other hand, the governance dimensions iv) Political Stability v) Rule of Law, and vi) Control of Corruption are in the first percentile rank. The Government is steadily implementing the required sector policy issues, and also actively supporting decentralization of water services to water services institutions away from the central Ministry of Water and Irrigation. To further improve water sector governance the project will support the regulator (WASREB) in its oversight role of water services institutions, and strengthen the continued engagement with stimulate the adoption and implementation of transparency and participation as guiding principles.
4.4. Sustainability The project addresses most of the important factors which contributes to sustainability, namely capacity and skills of the Project WSBs, the complexity of technology chosen, support of government leadership, ability and willingness to pay, and adequacy of policies and legislation. This is demonstrated by the GOK commitment to the on-going sector reform process, and in
13
particular, the requirement that the newly established institutions achieve technical; and financial viability. To this end, therefore, the project will support the annual Water Services Boards and Water Service Providers’ tariff reviews and performance monitoring exercises by the Water Services Regulatory Board (WASREB). This regulatory/supervisory oversight provides the basis for sustainability of the water sector institutions, and guarantees the flow of finances needed for the continuous operational and maintenance requirements, once the infrastructure has been completed. .The tariffs are designed with the aim of assuring the efficiency of the water supply schemes, water conservation, financial sustainability, service simplicity and are set in a way that is equitable and provides affordable services to the poor. See Annex C of the Technical Annexes. The institutional development support will assist the new water services institutions particularly with respect to their technical efficiency and financial viability. To this end, the support for addressing Unaccounted-For-Water (UFW) and the WSP clustering studies are deemed necessary. In addition, the project addresses matters of customer orientation, and efficiency in metering and billing. Moreover, strengthening of farmer groups and training of farmers on efficient use and management of irrigation water will also contribute to the sustainability of the project. The improved production of high value crops and increased incomes of the beneficiary farmers from the year round availability of water for irrigation will be enough to sustain their interest in the project.
4.5. Risk management The major risks associated with the project are (i) slow down of the implementation of the sector policy reforms; (ii). failure to pay timely the counterpart funding; (iii) lack of progress in improvement of efficiency of the water service providers; (iv) delay to finalize resettlement and compensation; (v) poor governance; (vi) costs over-run and (vii0 viability of the Water Services Boards The risks have been mitigated by (a) regular interaction through the sector coordination mechanism; (b) prioritization in the current budgetary provisions of the GOK of the estimated counterpart funds for the project. (c) the institutional development support activities with strong focus on O&M, MIS and M&E; (d) closer monitoring by ADB, of the resettlement and compensation, envisaged by GOK; (e) the annual financial and technical audit including regular and candid supervision by KEFO and HQ; (f) making allowance for this in the contingencies, (g) Regular tariff and affordability studies for financial sustainability carried out by WASREB.
4.6. Knowledge building The project will include comprehensive reporting, in agreed formats, comprising quarterly progress reports, audit reports, WASREB Impact reports, mid-term review reports and completion reports. Information from various sources will also be routinely gathered, as part of the monitoring and evaluation framework for the project. The experience and lessons learned will be duly documented and the information will be shared among stakeholders through joint technical and sector reviews and other appropriate forums such as water week events. The Bank, through its supervision missions, will share this knowledge and experiences with other development partners.
14
The project will also complement other knowledge building initiatives by AFD and UN HABITAT (LVSWSB), WB (TAWSB) and EU (TWSB) detailed in Annex B 10.
V – LEGAL INSTRUMENTS AND AUTHORITY
5.1. Legal instrument An ADF Loan Agreement will be executed between the Fund and the Borrower.
5.2. Conditions associated with Bank’s intervention Conditions Precedent to Entry into Force of the Loan Agreement (i) The Loan Agreement shall enter into force subject to the fulfilment by the Borrower of
the provisions of section 12 of the General Conditions Applicable to Loan Agreements and Guarantee Agreement of the African Development Fund.
Conditions Precedent to First Disbursement for the Loan: (i) Provide evidence to the Fund of a Subsidiary Financing Agreement between the Government of Kenya and each of the Water Services Boards of Lake Victoria South, Tana and Tanathi respectively , prepared in due consultations with the ADB, on the transfer of the urban infrastructure related part of the ADF loan proceed (section 2.4);
(ii) Provide evidence of each Water Service Board having opened two special accounts (one in foreign currency and the other local currency) in a Commercial Bank acceptable to the Fund (section 4.1). Other Conditions (i) Provide an undertaking to cause an implementation of tariff adjustments, based upon tariff studies, for water supply and sanitation services, as per WASREB guidelines in order to ensure sustainability of service provision including investment (section 4.4). . (ii) Provide evidence acceptable to the Fund, of the full implementation of the Resettlement and Compensation Plan, prior to approval by the Fund of civil works contracts for the Yatta Dam (section 3.2).
5.3. Compliance with Bank Policies This project complies with all applicable Bank policies. VI – RECOMMENDATION Management recommends that the Board of Directors approve the proposed loan of UA 70.00 million to the Government of Kenya for the purposes and subject to the conditions stipulated in this report.
Appendix I
15
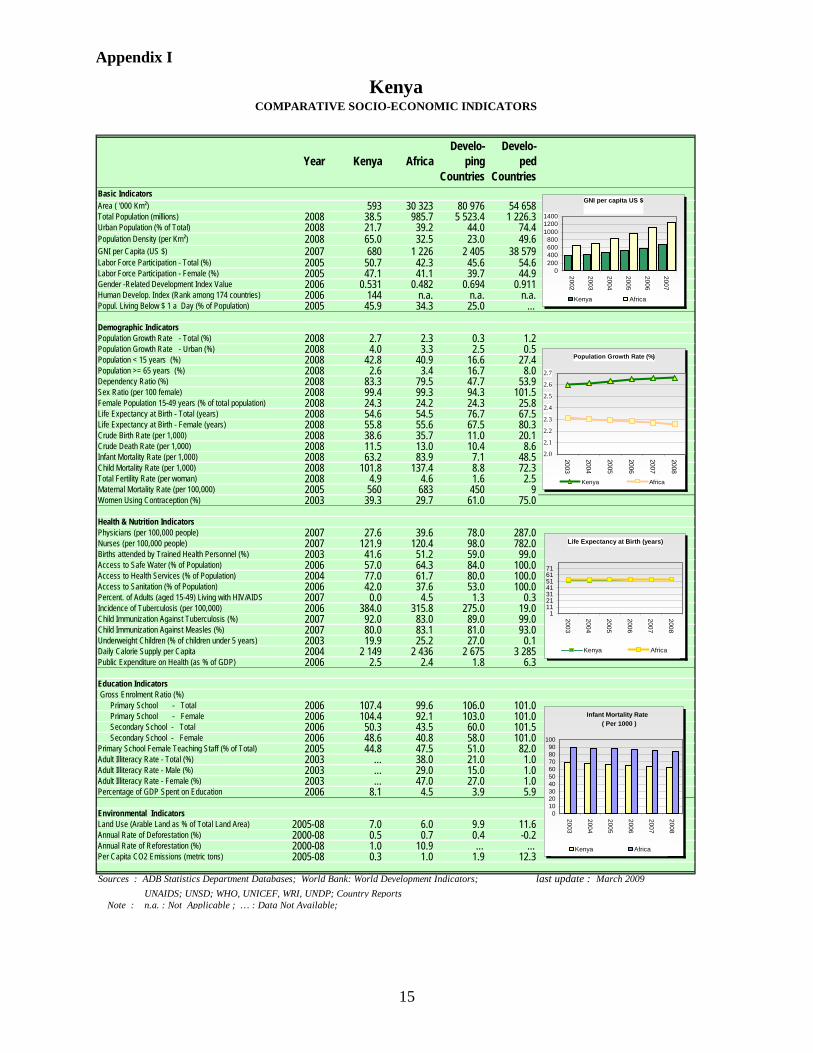
Year Kenya AfricaDevelo-
ping Countries
Develo- ped
CountriesBasic Indicators Area ( '000 Km²) 593 30 323 80 976 54 658Total Population (millions) 2008 38.5 985.7 5 523.4 1 226.3Urban Population (% of Total) 2008 21.7 39.2 44.0 74.4Population Density (per Km²) 2008 65.0 32.5 23.0 49.6GNI per Capita (US $) 2007 680 1 226 2 405 38 579Labor Force Participation - Total (%) 2005 50.7 42.3 45.6 54.6Labor Force Participation - Female (%) 2005 47.1 41.1 39.7 44.9Gender -Related Development Index Value 2006 0.531 0.482 0.694 0.911Human Develop. Index (Rank among 174 countries) 2006 144 n.a. n.a. n.a.Popul. Living Below $ 1 a Day (% of Population) 2005 45.9 34.3 25.0 …
Demographic IndicatorsPopulation Growth Rate - Total (%) 2008 2.7 2.3 0.3 1.2Population Growth Rate - Urban (%) 2008 4.0 3.3 2.5 0.5Population < 15 years (%) 2008 42.8 40.9 16.6 27.4Population >= 65 years (%) 2008 2.6 3.4 16.7 8.0Dependency Ratio (%) 2008 83.3 79.5 47.7 53.9Sex Ratio (per 100 female) 2008 99.4 99.3 94.3 101.5Female Population 15-49 years (% of total population) 2008 24.3 24.2 24.3 25.8Life Expectancy at Birth - Total (years) 2008 54.6 54.5 76.7 67.5Life Expectancy at Birth - Female (years) 2008 55.8 55.6 67.5 80.3Crude Birth Rate (per 1,000) 2008 38.6 35.7 11.0 20.1Crude Death Rate (per 1,000) 2008 11.5 13.0 10.4 8.6Infant Mortality Rate (per 1,000) 2008 63.2 83.9 7.1 48.5Child Mortality Rate (per 1,000) 2008 101.8 137.4 8.8 72.3Total Fertility Rate (per woman) 2008 4.9 4.6 1.6 2.5Maternal Mortality Rate (per 100,000) 2005 560 683 450 9Women Using Contraception (%) 2003 39.3 29.7 61.0 75.0
Health & Nutrition IndicatorsPhysicians (per 100,000 people) 2007 27.6 39.6 78.0 287.0Nurses (per 100,000 people) 2007 121.9 120.4 98.0 782.0Births attended by Trained Health Personnel (%) 2003 41.6 51.2 59.0 99.0Access to Safe Water (% of Population) 2006 57.0 64.3 84.0 100.0Access to Health Services (% of Population) 2004 77.0 61.7 80.0 100.0Access to Sanitation (% of Population) 2006 42.0 37.6 53.0 100.0Percent. of Adults (aged 15-49) Living with HIV/AIDS 2007 0.0 4.5 1.3 0.3Incidence of Tuberculosis (per 100,000) 2006 384.0 315.8 275.0 19.0Child Immunization Against Tuberculosis (%) 2007 92.0 83.0 89.0 99.0Child Immunization Against Measles (%) 2007 80.0 83.1 81.0 93.0Underweight Children (% of children under 5 years) 2003 19.9 25.2 27.0 0.1Daily Calorie Supply per Capita 2004 2 149 2 436 2 675 3 285Public Expenditure on Health (as % of GDP) 2006 2.5 2.4 1.8 6.3
Education Indicators Gross Enrolment Ratio (%) Primary School - Total 2006 107.4 99.6 106.0 101.0 Primary School - Female 2006 104.4 92.1 103.0 101.0 Secondary School - Total 2006 50.3 43.5 60.0 101.5 Secondary School - Female 2006 48.6 40.8 58.0 101.0Primary School Female Teaching Staff (% of Total) 2005 44.8 47.5 51.0 82.0Adult Illiteracy Rate - Total (%) 2003 ... 38.0 21.0 1.0Adult Illiteracy Rate - Male (%) 2003 ... 29.0 15.0 1.0Adult Illiteracy Rate - Female (%) 2003 ... 47.0 27.0 1.0Percentage of GDP Spent on Education 2006 8.1 4.5 3.9 5.9
Environmental IndicatorsLand Use (Arable Land as % of Total Land Area) 2005-08 7.0 6.0 9.9 11.6Annual Rate of Deforestation (%) 2000-08 0.5 0.7 0.4 -0.2Annual Rate of Reforestation (%) 2000-08 1.0 10.9 … …Per Capita CO2 Emissions (metric tons) 2005-08 0.3 1.0 1.9 12.3
Sources : ADB Statistics Department Databases; World Bank: World Development Indicators; last update :UNAIDS; UNSD; WHO, UNICEF, WRI, UNDP; Country Reports
Note : n.a. : Not Applicable ; … : Data Not Available;
COMPARATIVE SOCIO-ECONOMIC INDICATORSKenya
March 2009
Infant Mortality Rate ( Per 1000 )
0102030405060708090
100
2003
2004
2005
2006
2007
2008
Kenya Africa
GNI per capita US $
0200400600800
100012001400
2002
2003
2004
2005
2006
2007
Kenya Africa
Population Growth Rate (%)
2.0
2.1
2.2
2.3
2.4
2.5
2.6
2.7
2003
2004
2005
2006
2007
2008
Kenya Africa
Life Expectancy at Birth (years)
111213141516171
2003
2004
2005
2006
2007
2008
Kenya Africa
16
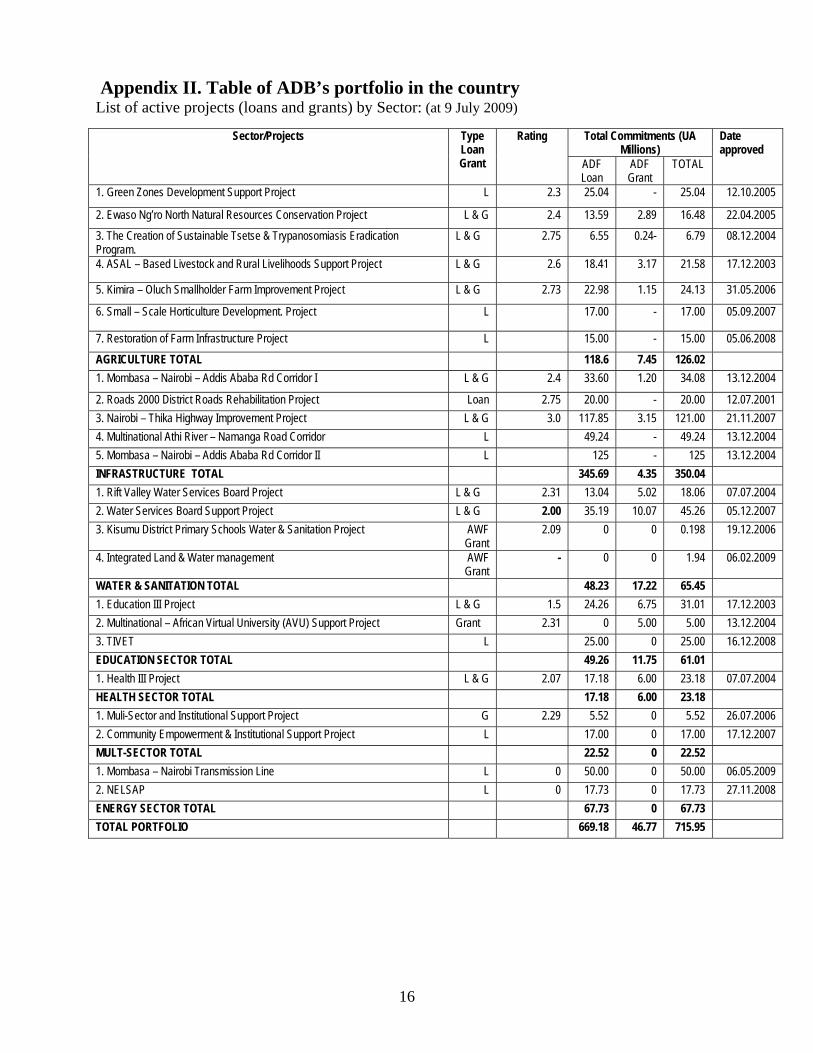
Appendix II. Table of ADB’s portfolio in the country List of active projects (loans and grants) by Sector: (at 9 July 2009)
Total Commitments (UA
Millions) Sector/Projects Type
Loan Grant
Rating
ADF Loan
ADF Grant
TOTAL
Date approved
1. Green Zones Development Support Project L 2.3 25.04 - 25.04 12.10.2005
2. Ewaso Ng’ro North Natural Resources Conservation Project L & G 2.4 13.59 2.89 16.48 22.04.2005
3. The Creation of Sustainable Tsetse & Trypanosomiasis Eradication Program.
L & G 2.75 6.55 0.24- 6.79 08.12.2004
4. ASAL – Based Livestock and Rural Livelihoods Support Project L & G 2.6 18.41 3.17 21.58 17.12.2003
5. Kimira – Oluch Smallholder Farm Improvement Project L & G 2.73 22.98 1.15 24.13 31.05.2006
6. Small – Scale Horticulture Development. Project L 17.00 - 17.00 05.09.2007
7. Restoration of Farm Infrastructure Project L 15.00 - 15.00 05.06.2008
AGRICULTURE TOTAL 118.6 7.45 126.02 1. Mombasa – Nairobi – Addis Ababa Rd Corridor I L & G 2.4 33.60 1.20 34.08 13.12.2004
2. Roads 2000 District Roads Rehabilitation Project Loan 2.75 20.00 - 20.00 12.07.2001 3. Nairobi – Thika Highway Improvement Project L & G 3.0 117.85 3.15 121.00 21.11.2007 4. Multinational Athi River – Namanga Road Corridor L 49.24 - 49.24 13.12.2004 5. Mombasa – Nairobi – Addis Ababa Rd Corridor II L 125 - 125 13.12.2004 INFRASTRUCTURE TOTAL 345.69 4.35 350.04 1. Rift Valley Water Services Board Project L & G 2.31 13.04 5.02 18.06 07.07.2004 2. Water Services Board Support Project L & G 2.00 35.19 10.07 45.26 05.12.2007 3. Kisumu District Primary Schools Water & Sanitation Project AWF
Grant 2.09 0 0 0.198 19.12.2006
4. Integrated Land & Water management AWF Grant
- 0 0 1.94 06.02.2009
WATER & SANITATION TOTAL 48.23 17.22 65.45 1. Education III Project L & G 1.5 24.26 6.75 31.01 17.12.2003 2. Multinational – African Virtual University (AVU) Support Project Grant 2.31 0 5.00 5.00 13.12.2004 3. TIVET L 25.00 0 25.00 16.12.2008 EDUCATION SECTOR TOTAL 49.26 11.75 61.01 1. Health III Project L & G 2.07 17.18 6.00 23.18 07.07.2004 HEALTH SECTOR TOTAL 17.18 6.00 23.18 1. Muli-Sector and Institutional Support Project G 2.29 5.52 0 5.52 26.07.2006 2. Community Empowerment & Institutional Support Project L 17.00 0 17.00 17.12.2007 MULT-SECTOR TOTAL 22.52 0 22.52 1. Mombasa – Nairobi Transmission Line L 0 50.00 0 50.00 06.05.2009 2. NELSAP L 0 17.73 0 17.73 27.11.2008 ENERGY SECTOR TOTAL 67.73 0 67.73 TOTAL PORTFOLIO 669.18 46.77 715.95
17
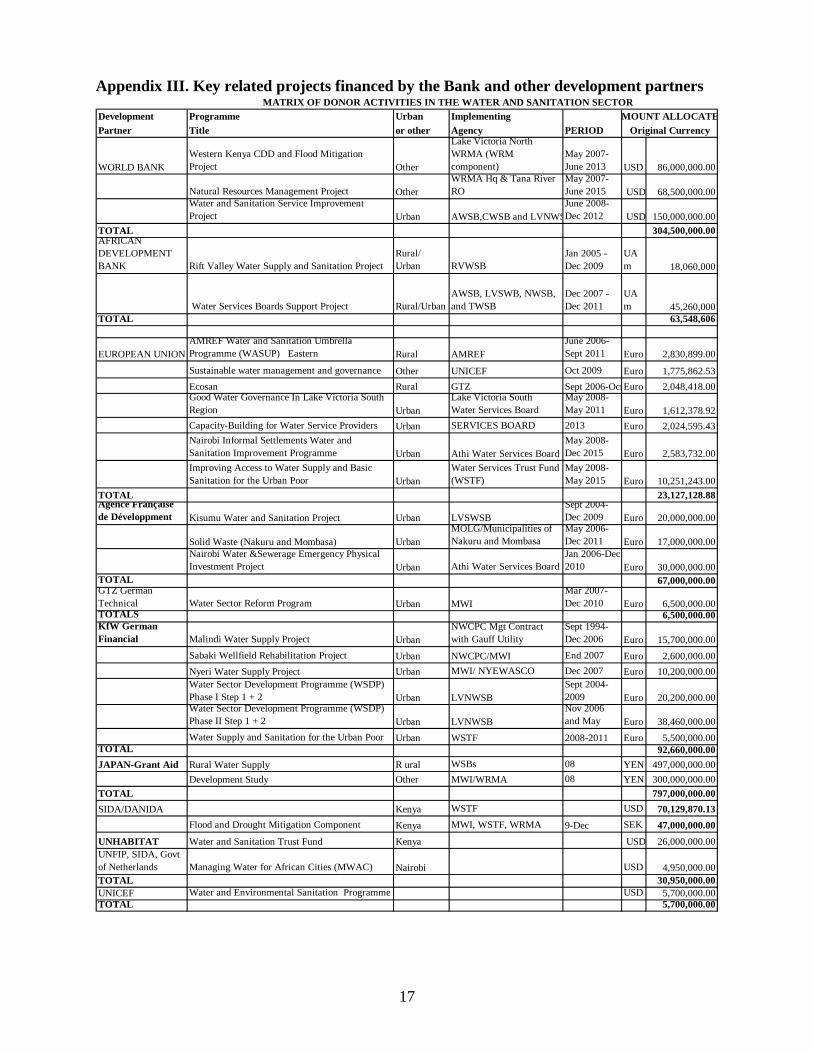
Appendix III. Key related projects financed by the Bank and other development partners MATRIX OF DONOR ACTIVITIES IN THE WATER AND SANITATION SECTOR
Development Programme Urban ImplementingPartner Title or other Agency PERIOD
WORLD BANKWestern Kenya CDD and Flood Mitigation Project Other
Lake Victoria North WRMA (WRM component)
May 2007-June 2013 USD 86,000,000.00
Natural Resources Management Project OtherWRMA Hq & Tana River RO
May 2007-June 2015 USD 68,500,000.00
Water and Sanitation Service Improvement Project Urban AWSB,CWSB and LVNWS
June 2008-Dec 2012 USD 150,000,000.00
TOTAL 304,500,000.00AFRICAN DEVELOPMENT BANK Rift Valley Water Supply and Sanitation Project
Rural/ Urban RVWSB
Jan 2005 - Dec 2009
UA m 18,060,000
Water Services Boards Support Project Rural/UrbanAWSB, LVSWB, NWSB, and TWSB
Dec 2007 - Dec 2011
UA m 45,260,000
TOTAL 63,548,606
EUROPEAN UNIONAMREF Water and Sanitation Umbrella Programme (WASUP) Eastern Rural AMREF
June 2006-Sept 2011 Euro 2,830,899.00
Sustainable water management and governance Other UNICEF Oct 2009 Euro 1,775,862.53Ecosan Rural GTZ Sept 2006-OctEuro 2,048,418.00Good Water Governance In Lake Victoria South Region Urban
Lake Victoria South Water Services Board
May 2008-May 2011 Euro 1,612,378.92
Capacity-Building for Water Service Providers Urban SERVICES BOARDy y
2013 Euro 2,024,595.43Nairobi Informal Settlements Water and Sanitation Improvement Programme Urban Athi Water Services Board
May 2008-Dec 2015 Euro 2,583,732.00
Improving Access to Water Supply and Basic Sanitation for the Urban Poor Urban
Water Services Trust Fund (WSTF)
May 2008-May 2015 Euro 10,251,243.00
TOTAL 23,127,128.88Agence Française de Développment Kisumu Water and Sanitation Project Urban LVSWSB
Sept 2004-Dec 2009 Euro 20,000,000.00
Solid Waste (Nakuru and Mombasa) UrbanMOLG/Municipalities of Nakuru and Mombasa
May 2006-Dec 2011 Euro 17,000,000.00
Nairobi Water &Sewerage Emergency Physical Investment Project Urban Athi Water Services Board
Jan 2006-Dec 2010 Euro 30,000,000.00
TOTAL 67,000,000.00GTZ German Technical Water Sector Reform Program Urban MWI
Mar 2007-Dec 2010 Euro 6,500,000.00
TOTALS 6,500,000.00KfW German Financial Malindi Water Supply Project Urban
NWCPC Mgt Contract with Gauff Utility
Sept 1994-Dec 2006 Euro 15,700,000.00
Sabaki Wellfield Rehabilitation Project Urban NWCPC/MWI End 2007 Euro 2,600,000.00Nyeri Water Supply Project Urban MWI/ NYEWASCO Dec 2007 Euro 10,200,000.00Water Sector Development Programme (WSDP) Phase I Step 1 + 2 Urban LVNWSB
Sept 2004-2009 Euro 20,200,000.00
Water Sector Development Programme (WSDP) Phase II Step 1 + 2 Urban LVNWSB
Nov 2006 and May Euro 38,460,000.00
Water Supply and Sanitation for the Urban Poor Urban WSTF 2008-2011 Euro 5,500,000.00TOTAL 92,660,000.00JAPAN-Grant Aid Rural Water Supply R ural WSBs 08 YEN 497,000,000.00
Development Study Other MWI/WRMA 08 YEN 300,000,000.00TOTAL 797,000,000.00SIDA/DANIDA Kenya WSTF USD 70,129,870.13
Flood and Drought Mitigation Component Kenya MWI, WSTF, WRMA 9-Dec SEK 47,000,000.00
UNHABITAT Water and Sanitation Trust Fund Kenya USD 26,000,000.00UNFIP, SIDA, Govt of Netherlands Managing Water for African Cities (MWAC) Nairobi USD 4,950,000.00TOTAL 30,950,000.00UNICEF Water and Environmental Sanitation Programme USD 5,700,000.00TOTAL 5,700,000.00
MOUNT ALLOCATEOriginal Currency
18
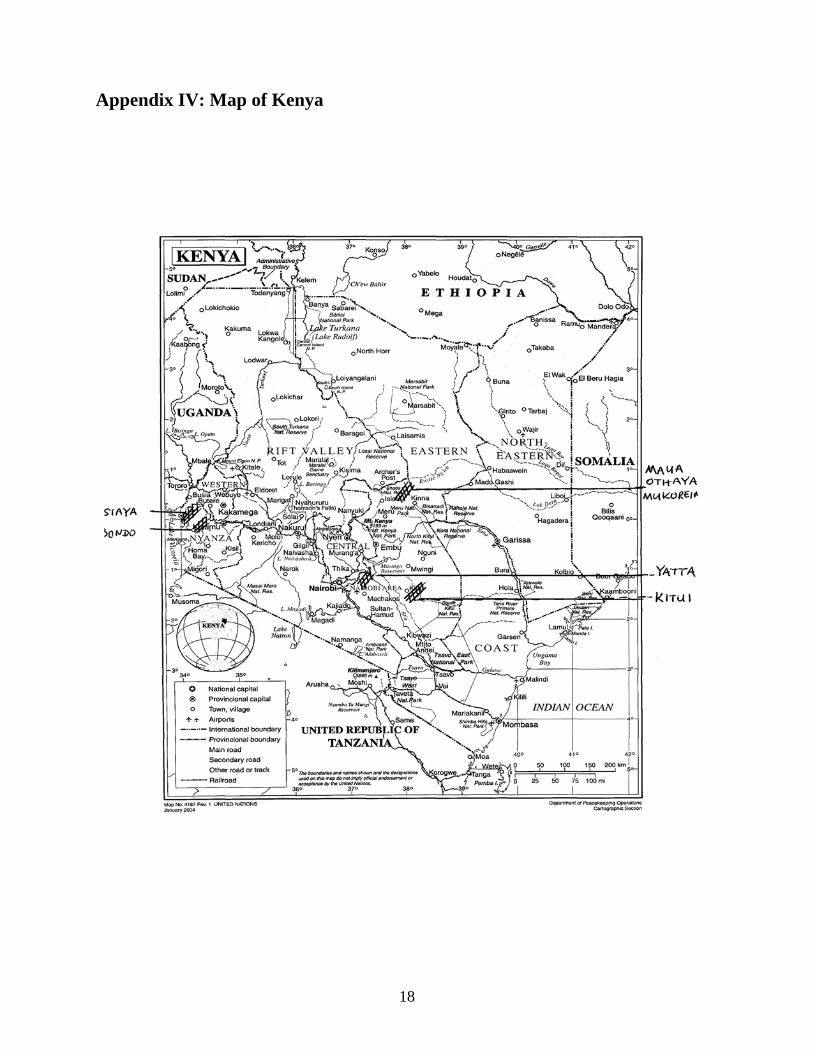
Appendix IV: Map of Kenya

PROJECT NAME Financing Source Approval Date Effect. Date Closing Approved Loan UA Disbursed Total Disb. Ratio
A. Public - Kenya UA 1. Roads 2000 - Districts Rural Roads Rehabilitation Project: North and South Regions
ADF Loan 12.07.2001 29.04.2002 30.12.2008 20,000,000.00 8,459,285.02 42.30%
2. Nairobi - Thika Highway Improvement Project ADF Loan 21.11 2007 29.07.2008 Dec. 2010 117,850,000.00 8,084,510.00 6.86% ADF Grant 21.11 2007 29.07.2008 Dec. 2010 3,150,000.00 - 0.00%3. Rift Valley Water Supply and Sanitation Project ADF Loan 07.07.2004 21.12.2004 31.12.2009 13,040,000.00 6,179,505.94 47.39%
ADF Grant 07.07.2004 6.09.2004 31.12.2009 5,020,000.00 3,061,196.00 60.98%4. Water Services Boards Support Project ADF Loan Nov-07 26.11.2008 Dec. 2011 35,190,000.00 133,722.00 0.38%
ADF Grant Nov-07 Dec-07 Dec. 2011 10,070,000.00 - 0.00%5. Green Zones Development Support Project ADF Loan 12.10.2005 27.02.2006 31.12.2013 25,040,000.00 10,824,792.00 43.23%6. Ewaso Ng'ïro North Natural Resources Conservation Project ADF Loan 22.04.2005 27.09.2005 31.12.2012 13,590,000.00 4,708,935.00 34.65%
ADF Grant 22.04.2005 16.06.2005 31.12.2012 2,890,000.00 636,667.00 22.03%7. ASAL-Based Livestock and Rural Livelihoods Support Project ADF Loan 17.12.2003 22.09.2004 31.12.2011 18,410,000.00 13,744,906.00 74.66%
ADF Grant 17.12.2003 09.08.2005 31.12.2011 3,170,000.00 2,420,016.61 76.34%8. Kimira- Oluch Smallholder Farm Improvement Project ADF Loan 31.05.2006 21.09.2006 30.09.2013 22,978,992.00 564,690.97 2.46%
ADF Grant 31.05.2006 20.10.2007 30.09.2013 1,153,332.00 44,403.28 3.85%9. Small-Scale Horticulture Development Project ADF Loan 05.09. 2007 20.5.2008 Jan. 2014 17,000,000.00 421,600.00 2.48%10. Education III Project ADF Loan 17.12.2003 24.11.2004 31.12.2010 24,260,000.00 4,056,272.00 16.72%
ADF Grant 17.12.2003 24.11.2004 31.12.2010 6,750,000.00 68,175.00 1.01%11. Rural Health III Project ADF Loan 07.07.2004 15.03.2005 31.12.2010 17,180,000.00 2,566,692.00 14.94%
ADF Grant 07.07.2004 15.03.2005 31.12.2010 6,000,000.00 3,171,755.17 52.86%12. Kenya Institutional Support to Good Governance ADF Grant 26.07.2006 08.12.2007 30.09.2009 5,520,000.00 966,552.00 17.51%13. Community Empowerment & Institutional Support Project ADF Loan 17.12.2007 02.07.2009 Mar. 2013 17,000,000.00 340,000.00 2.00%14. Kisumu District Primary Schools Water and Sanitation Project AWF 19.12.2006 29.01.2007 Sep-08 198,317.04 198,317.04 100.00%15. Technical Industrial Vocational and Entrepreneurship Training (TIVET) ADF Loan 16.12.2008 15.05.2009 31.12.2013 25,000,000.00 1,770,000.00 7.08%16. Integrated Land and Water Management AWF 06.02.2009 27.08.2009 31.12.2011 1,936,000.00 - 0.00%17. Restoration of Farm Infrastructure and Support Project ADF Loan 29.04.2009 30.06.2013 15,000,000.00 0.00%18. Mombasa - Nairobi Power Transmission Line ADF Loan 06.05.2009 50,000,000.00 0.00%
Sub-total 477,396,641.04 72,421,993.03 15.17%
B. Public - Multinational19. Mombasa - Nairobi - Addis Ababa Road Corridor Project ADF Loan 13.12.2004 07.04.2005 31.12.2010 33,600,000.00 12,458,880.00 37.08%
ADF Grant 13.12.2004 07.04.2005 31.12.2010 1,200,000.00 348,070.68 29.01%20. Arusha - Namanga - Athi River Road Development Project ADF Loan 13.12.2006 30.04.2007 31.12.2012 49,241,000.00 15,407,508.90 31.29%21. Creation of Sustainable Tsetse Eradication Program ADF Loan 08.12.2004 07.04.2005 31.12.2011 6,550,000.00 5,418,815.00 82.73%
ADF Grant 08.12.2004 07.04.2005 31.12.2011 240,000.00 105,425.00 43.93%
22. Nile Equitorial Lakes Electric Grid - NELSAP ADF Loan 27.11.2008 - 31.1.2014 17,730,000.00 - 0.00%
23. Mombasa - Nairobi - Addis Ababa Road Corridor Project Phase II ADF Loan 01.07.2009 125,000,000.00 0.00%
Sub-total 233,561,000.00 33,633,274.58 14.40%
Sub total (A + B) 710,957,641.04 106,055,267.61 14.92%C. Other24. African Virtual University Support Project ADF Grant 13.12.2004 07.03.2005 30.09.2009 5,000,000.00 4,053,500.00 81.07%
Total 715,957,641.04 110,108,767.61 15.38%
KENYA PORTFOLIO STATUS SUMMARY 15 OCTOBER 2009